


Características


¿Tienes alguna pregunta?
Recomendar


8 diapositivas
Business Opportunities in Europe Map Presentation
Unlock the potential of European markets with the Business Opportunities in Europe Map template, a dynamic tool designed for analyzing market trends across Europe. This presentation is ideal for businesses looking to explore new avenues and capitalize on regional opportunities. This template is compatible with PowerPoint, Keynote, and Google Slides.


4 diapositivas
Aviation Logistics and Scheduling Presentation
Coordinate timelines and optimize operations with the Aviation Logistics and Scheduling presentation. This layout uses a control tower illustration to visualize four key scheduling points—ideal for showcasing flight operations, airport coordination, or air traffic planning. Great for logistics teams, airline operations managers, or aviation consultants. Fully editable in PowerPoint, Keynote, and Google Slides.


10 diapositivas
Customer Demographic Breakdown Presentation
Give your insights a bold, modern look with a clear visual layout that turns customer data into an easy-to-follow story. This presentation helps you explain key demographic patterns, highlight audience behavior, and support smarter decisions with clean, structured visuals. Fully editable and compatible with PowerPoint, Keynote, and Google Slides.


23 diapositivas
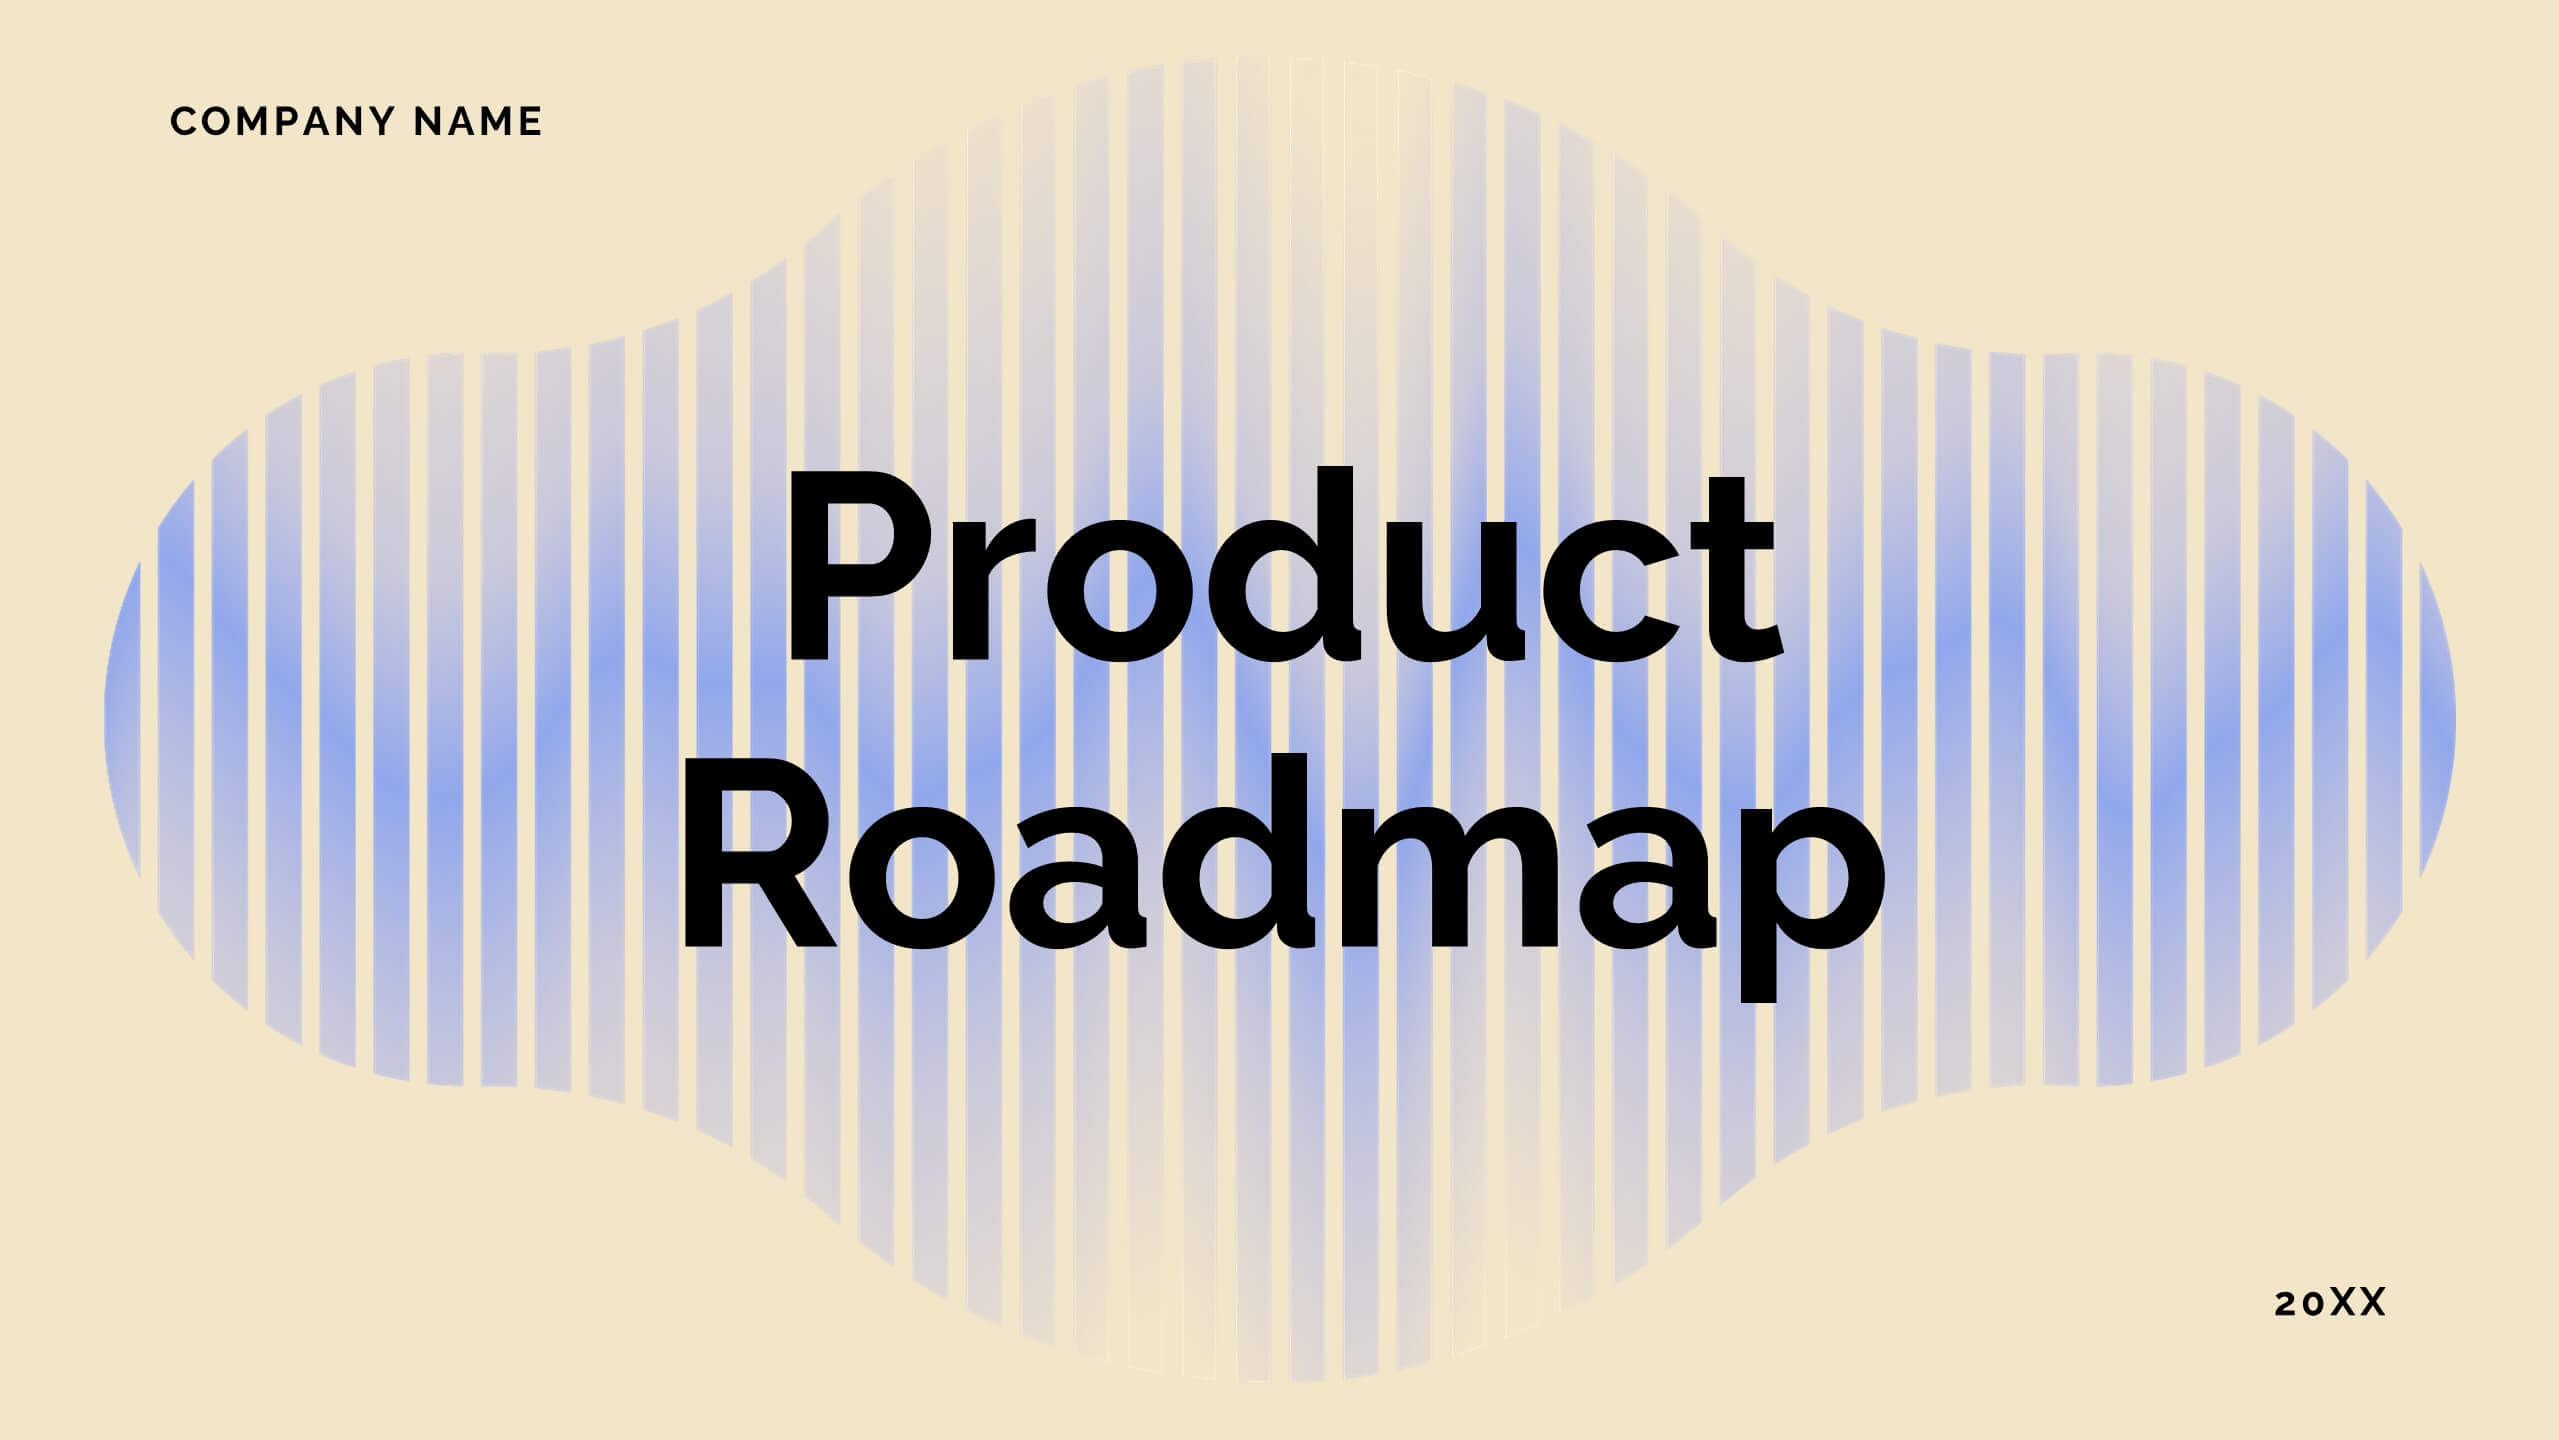
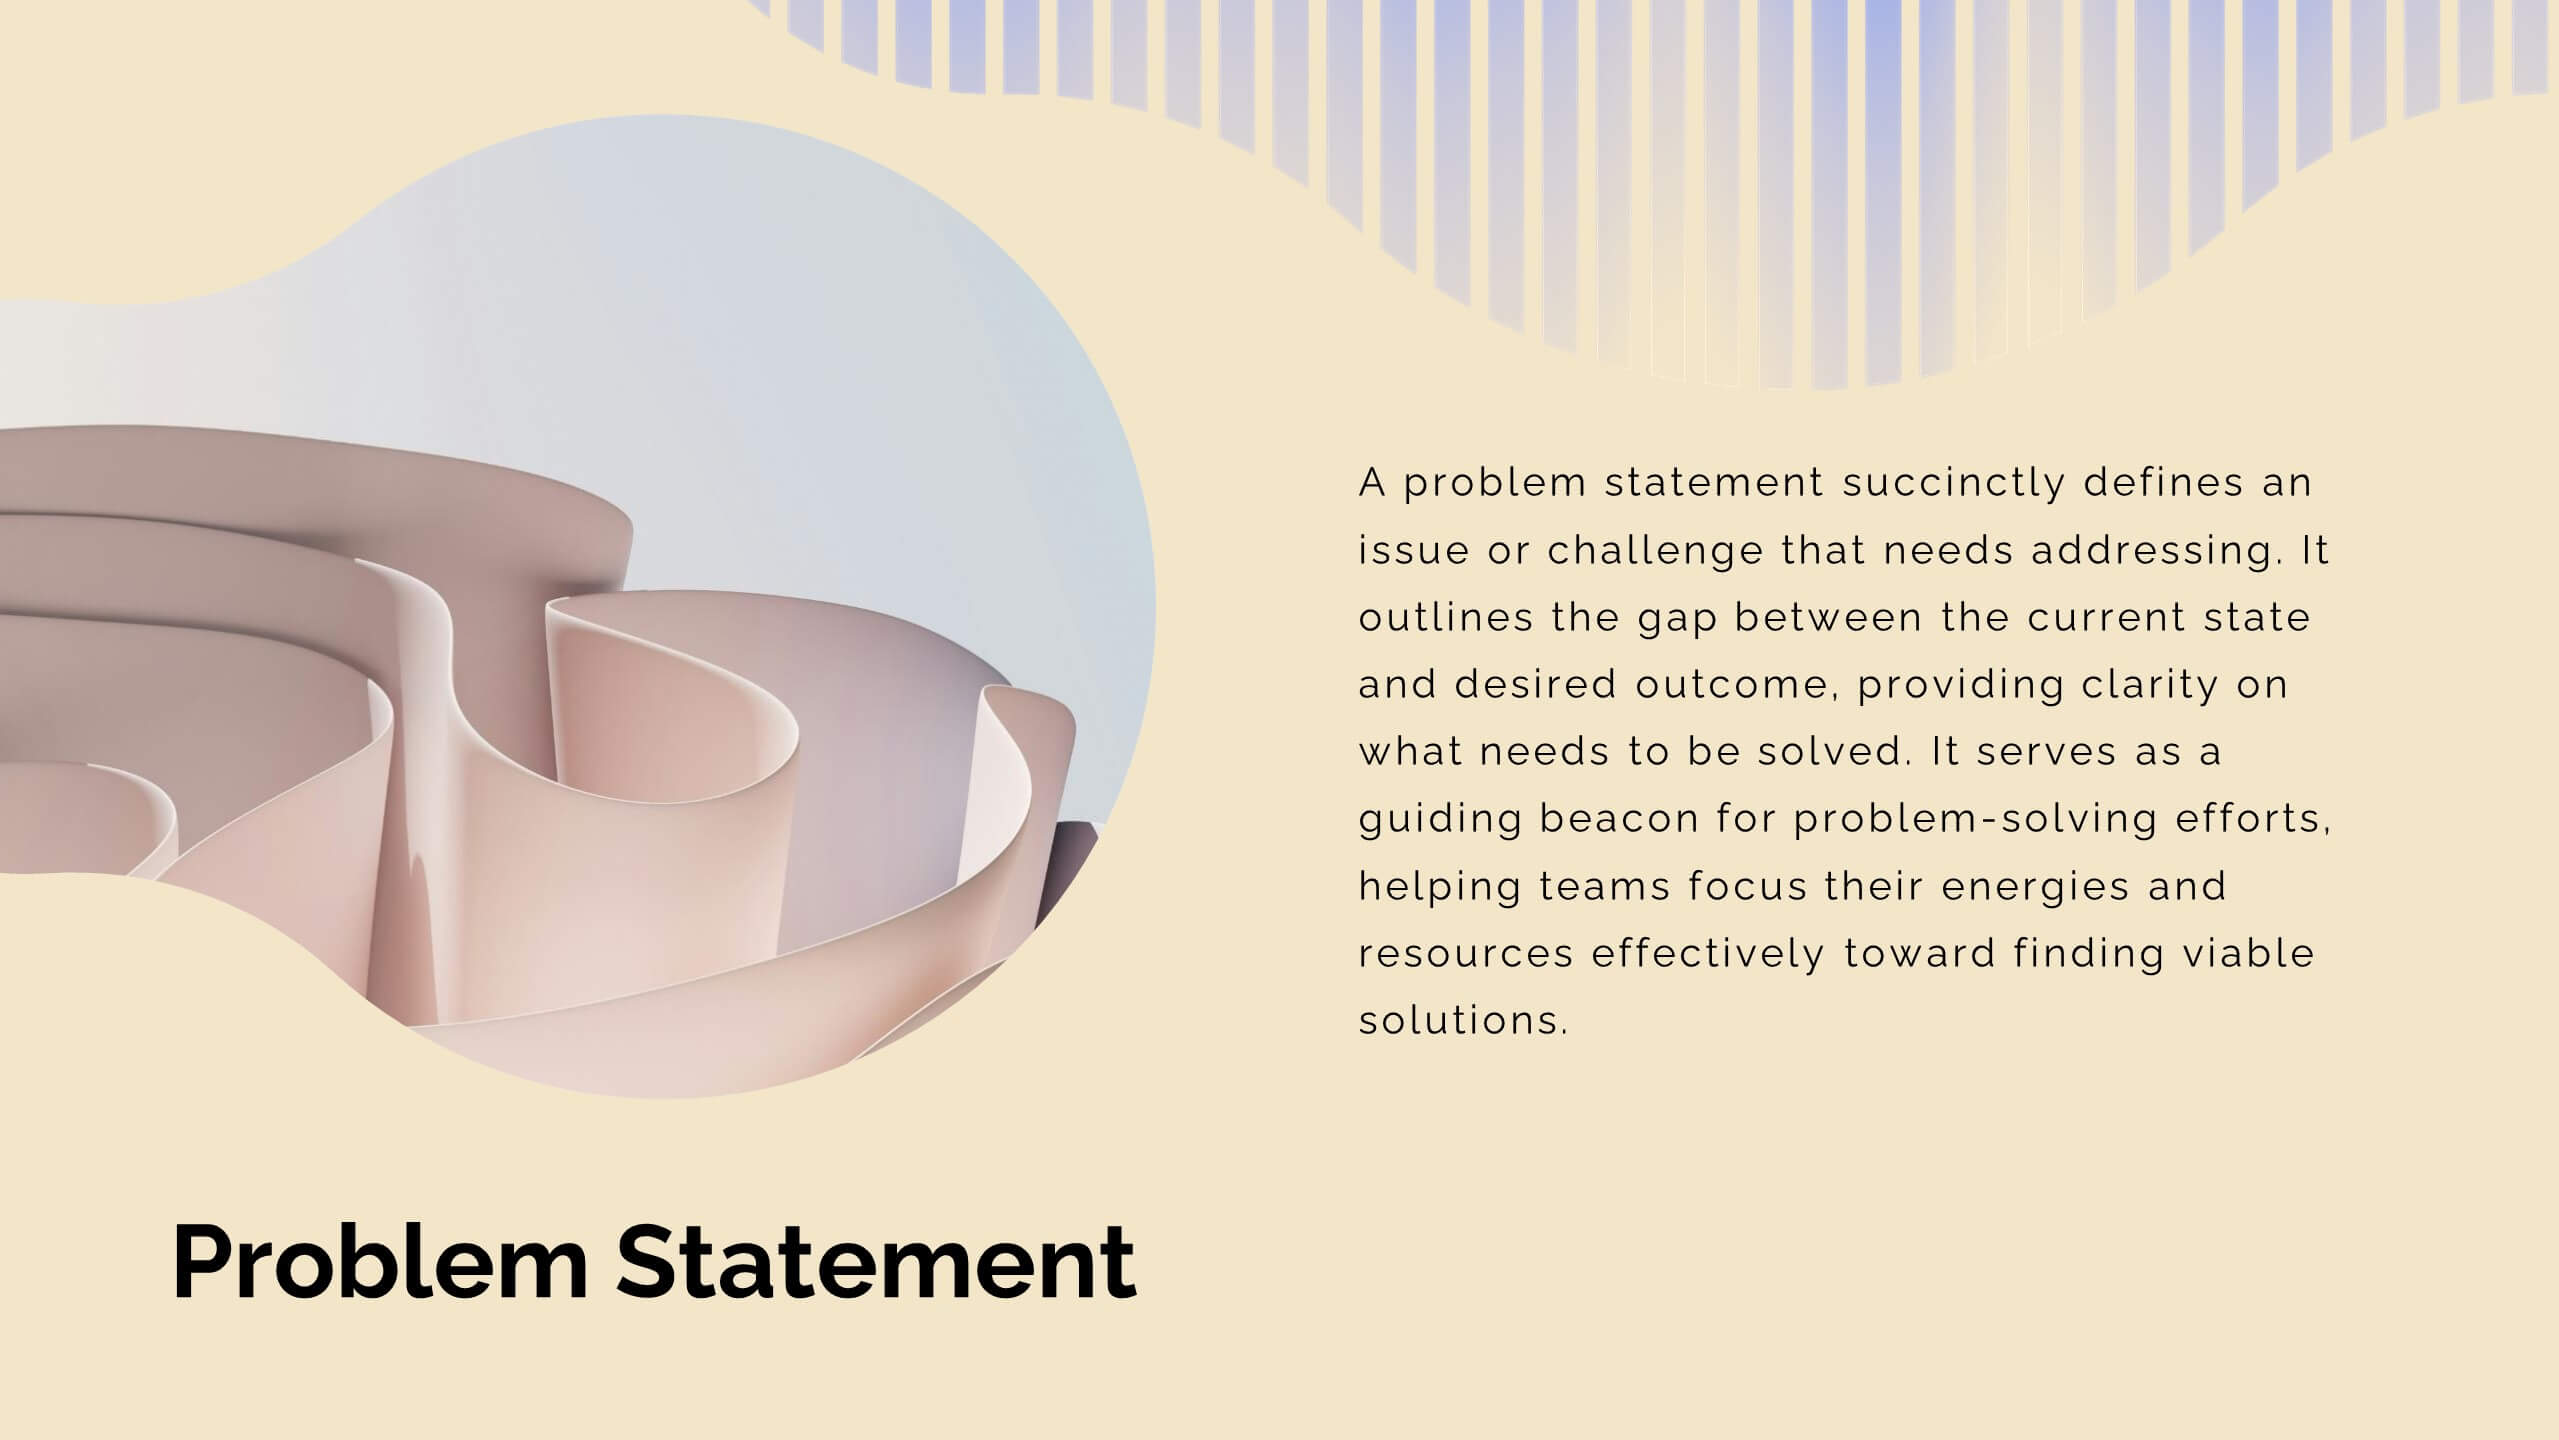
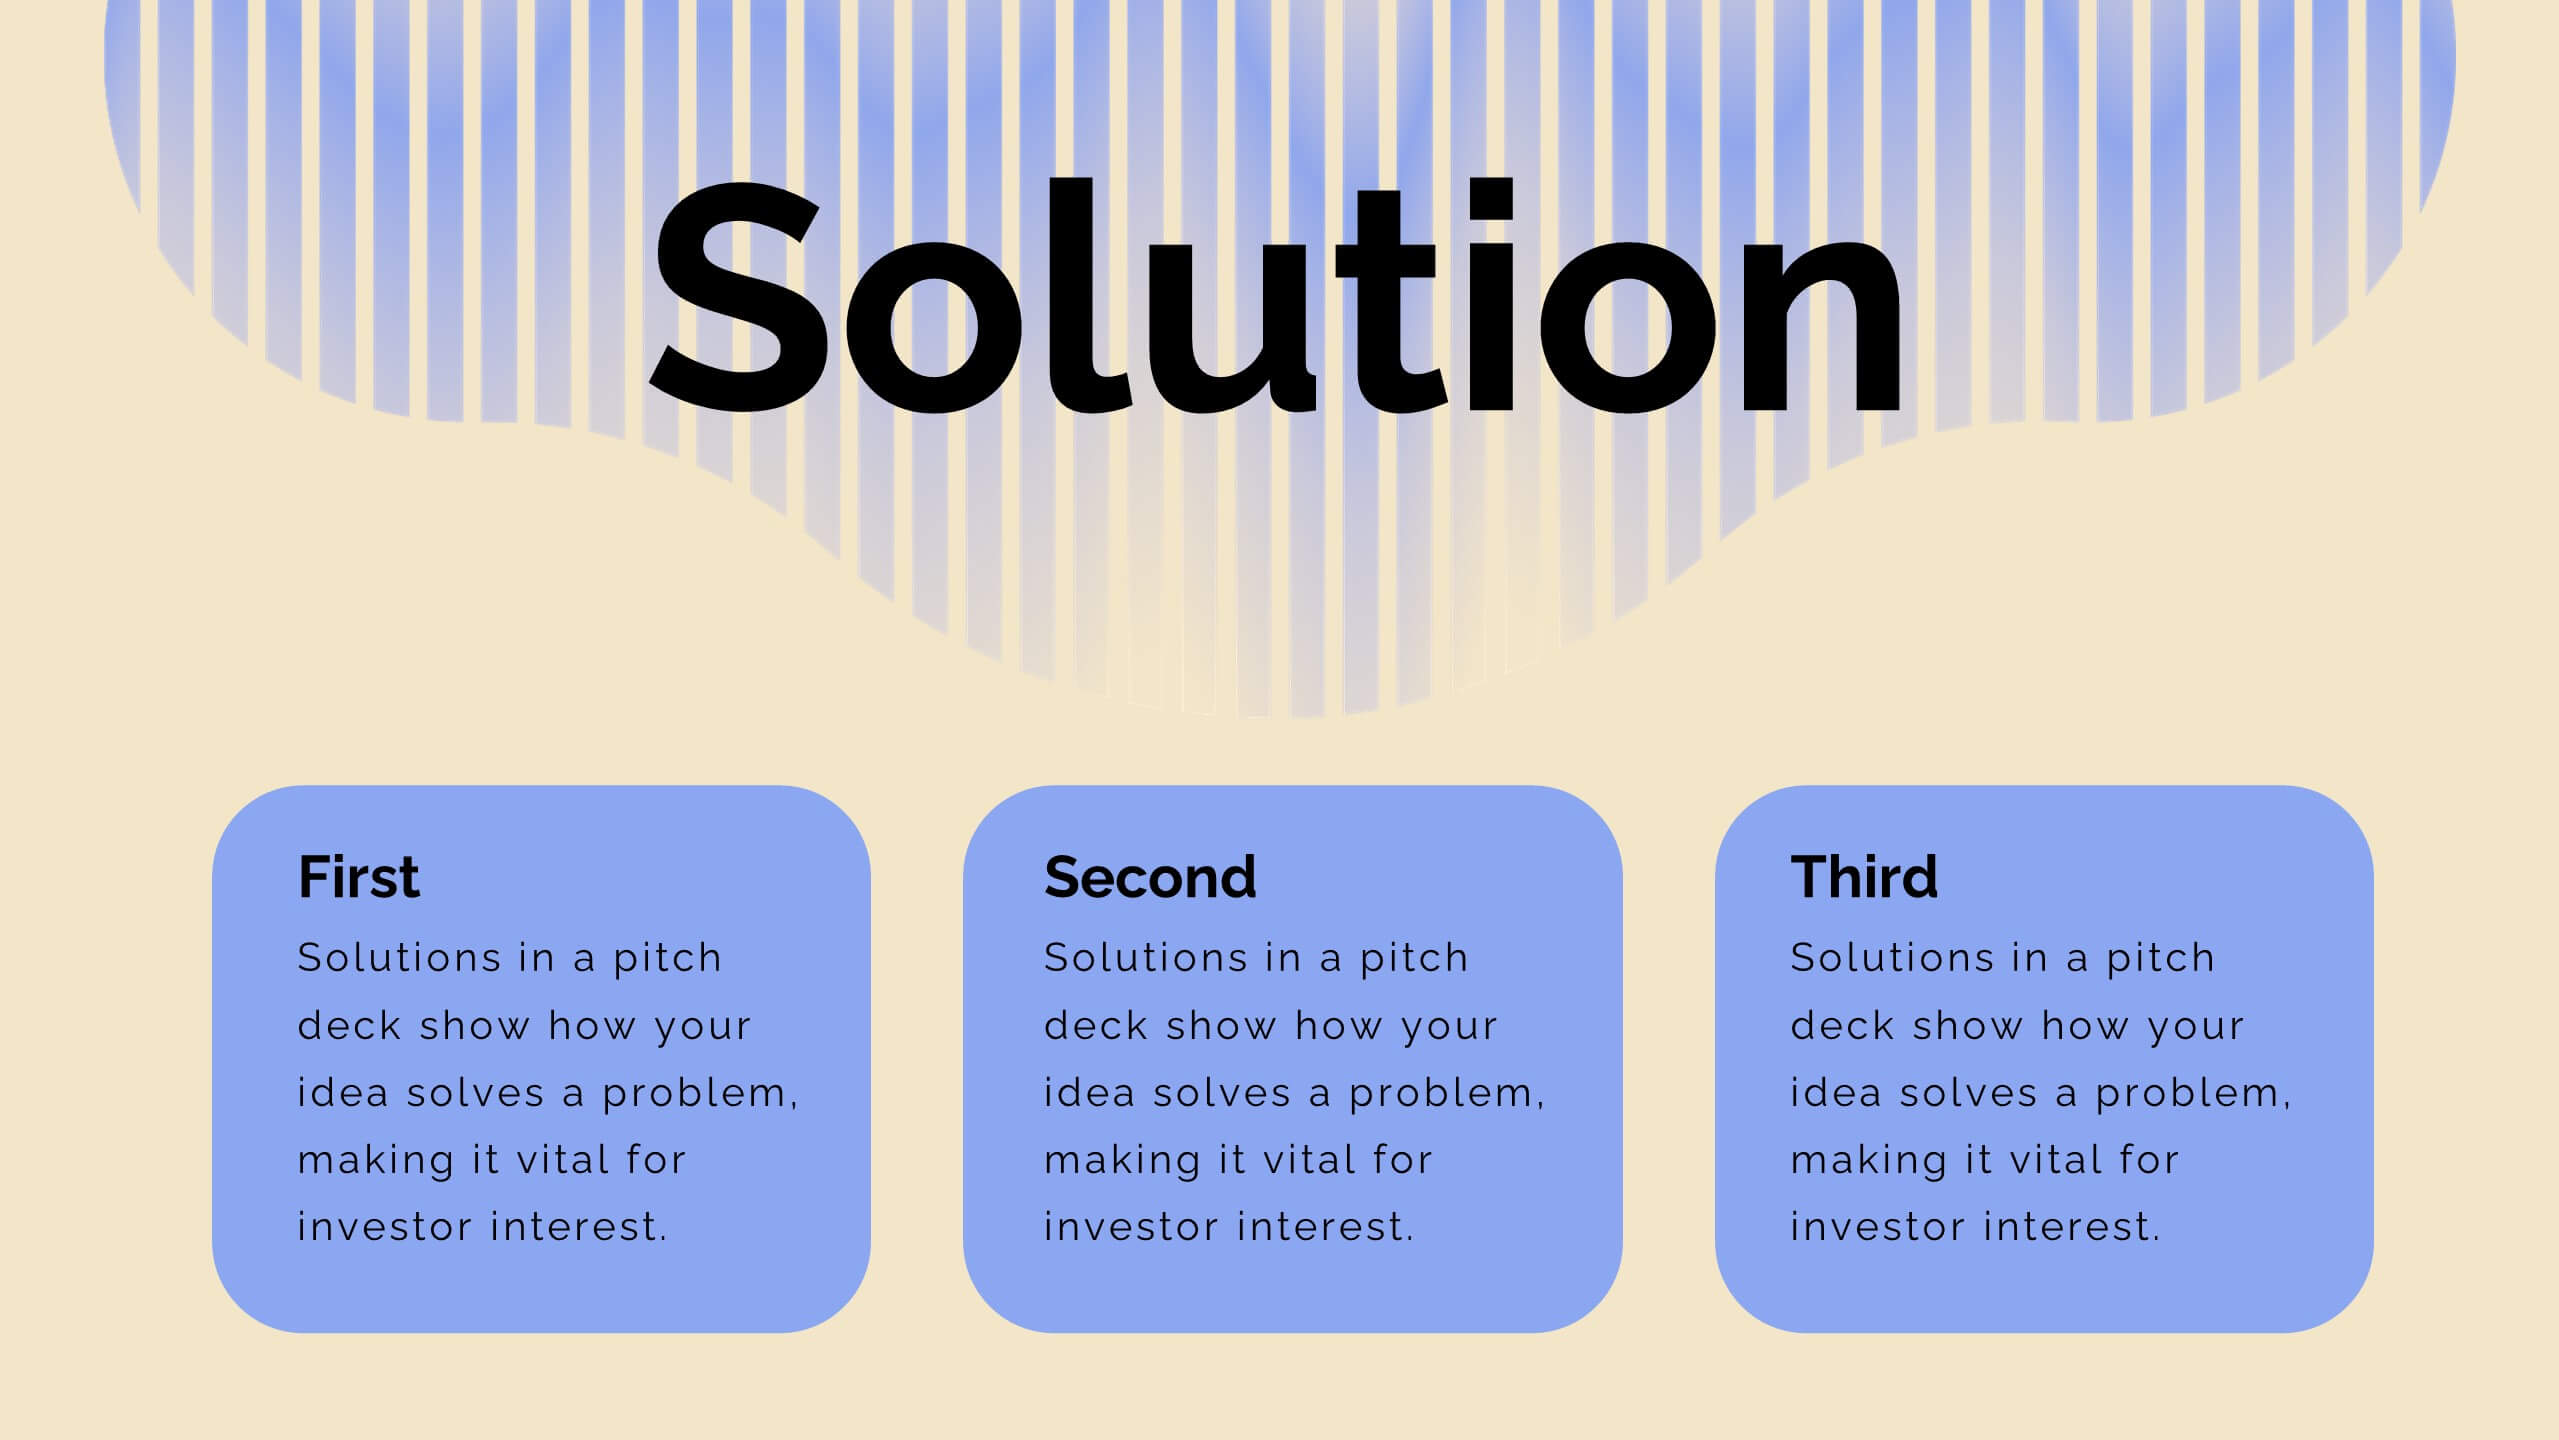
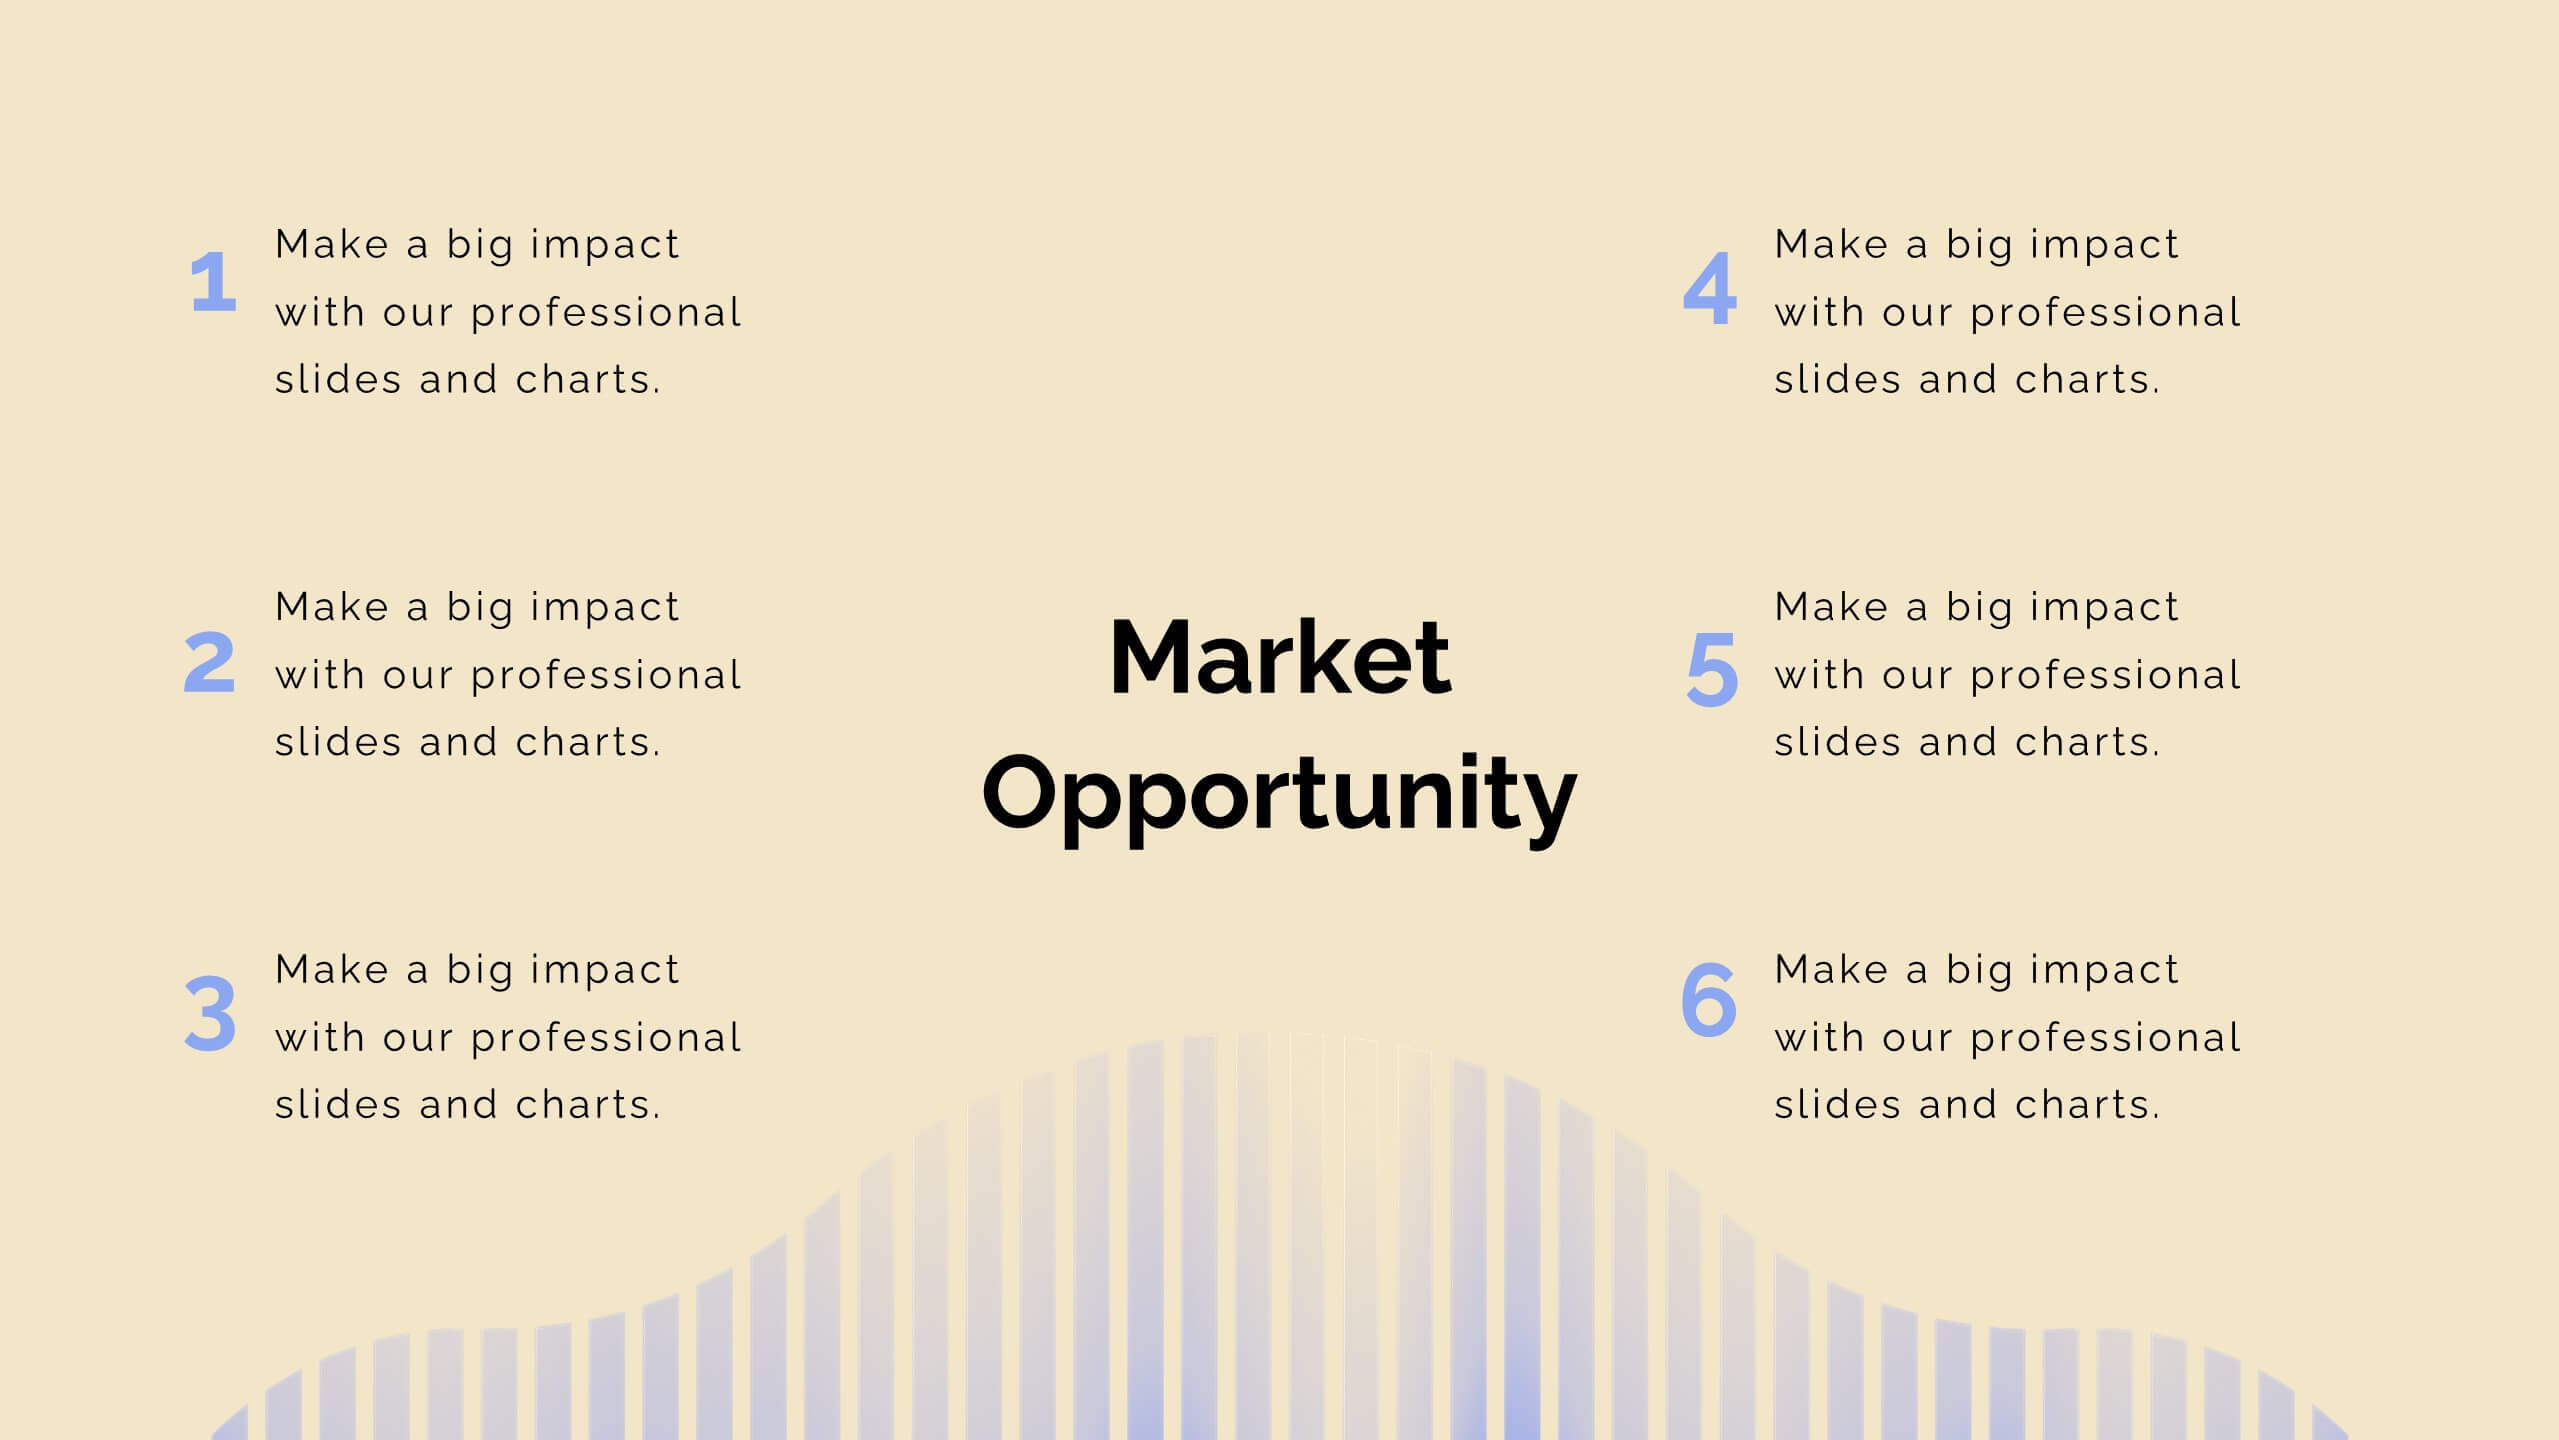
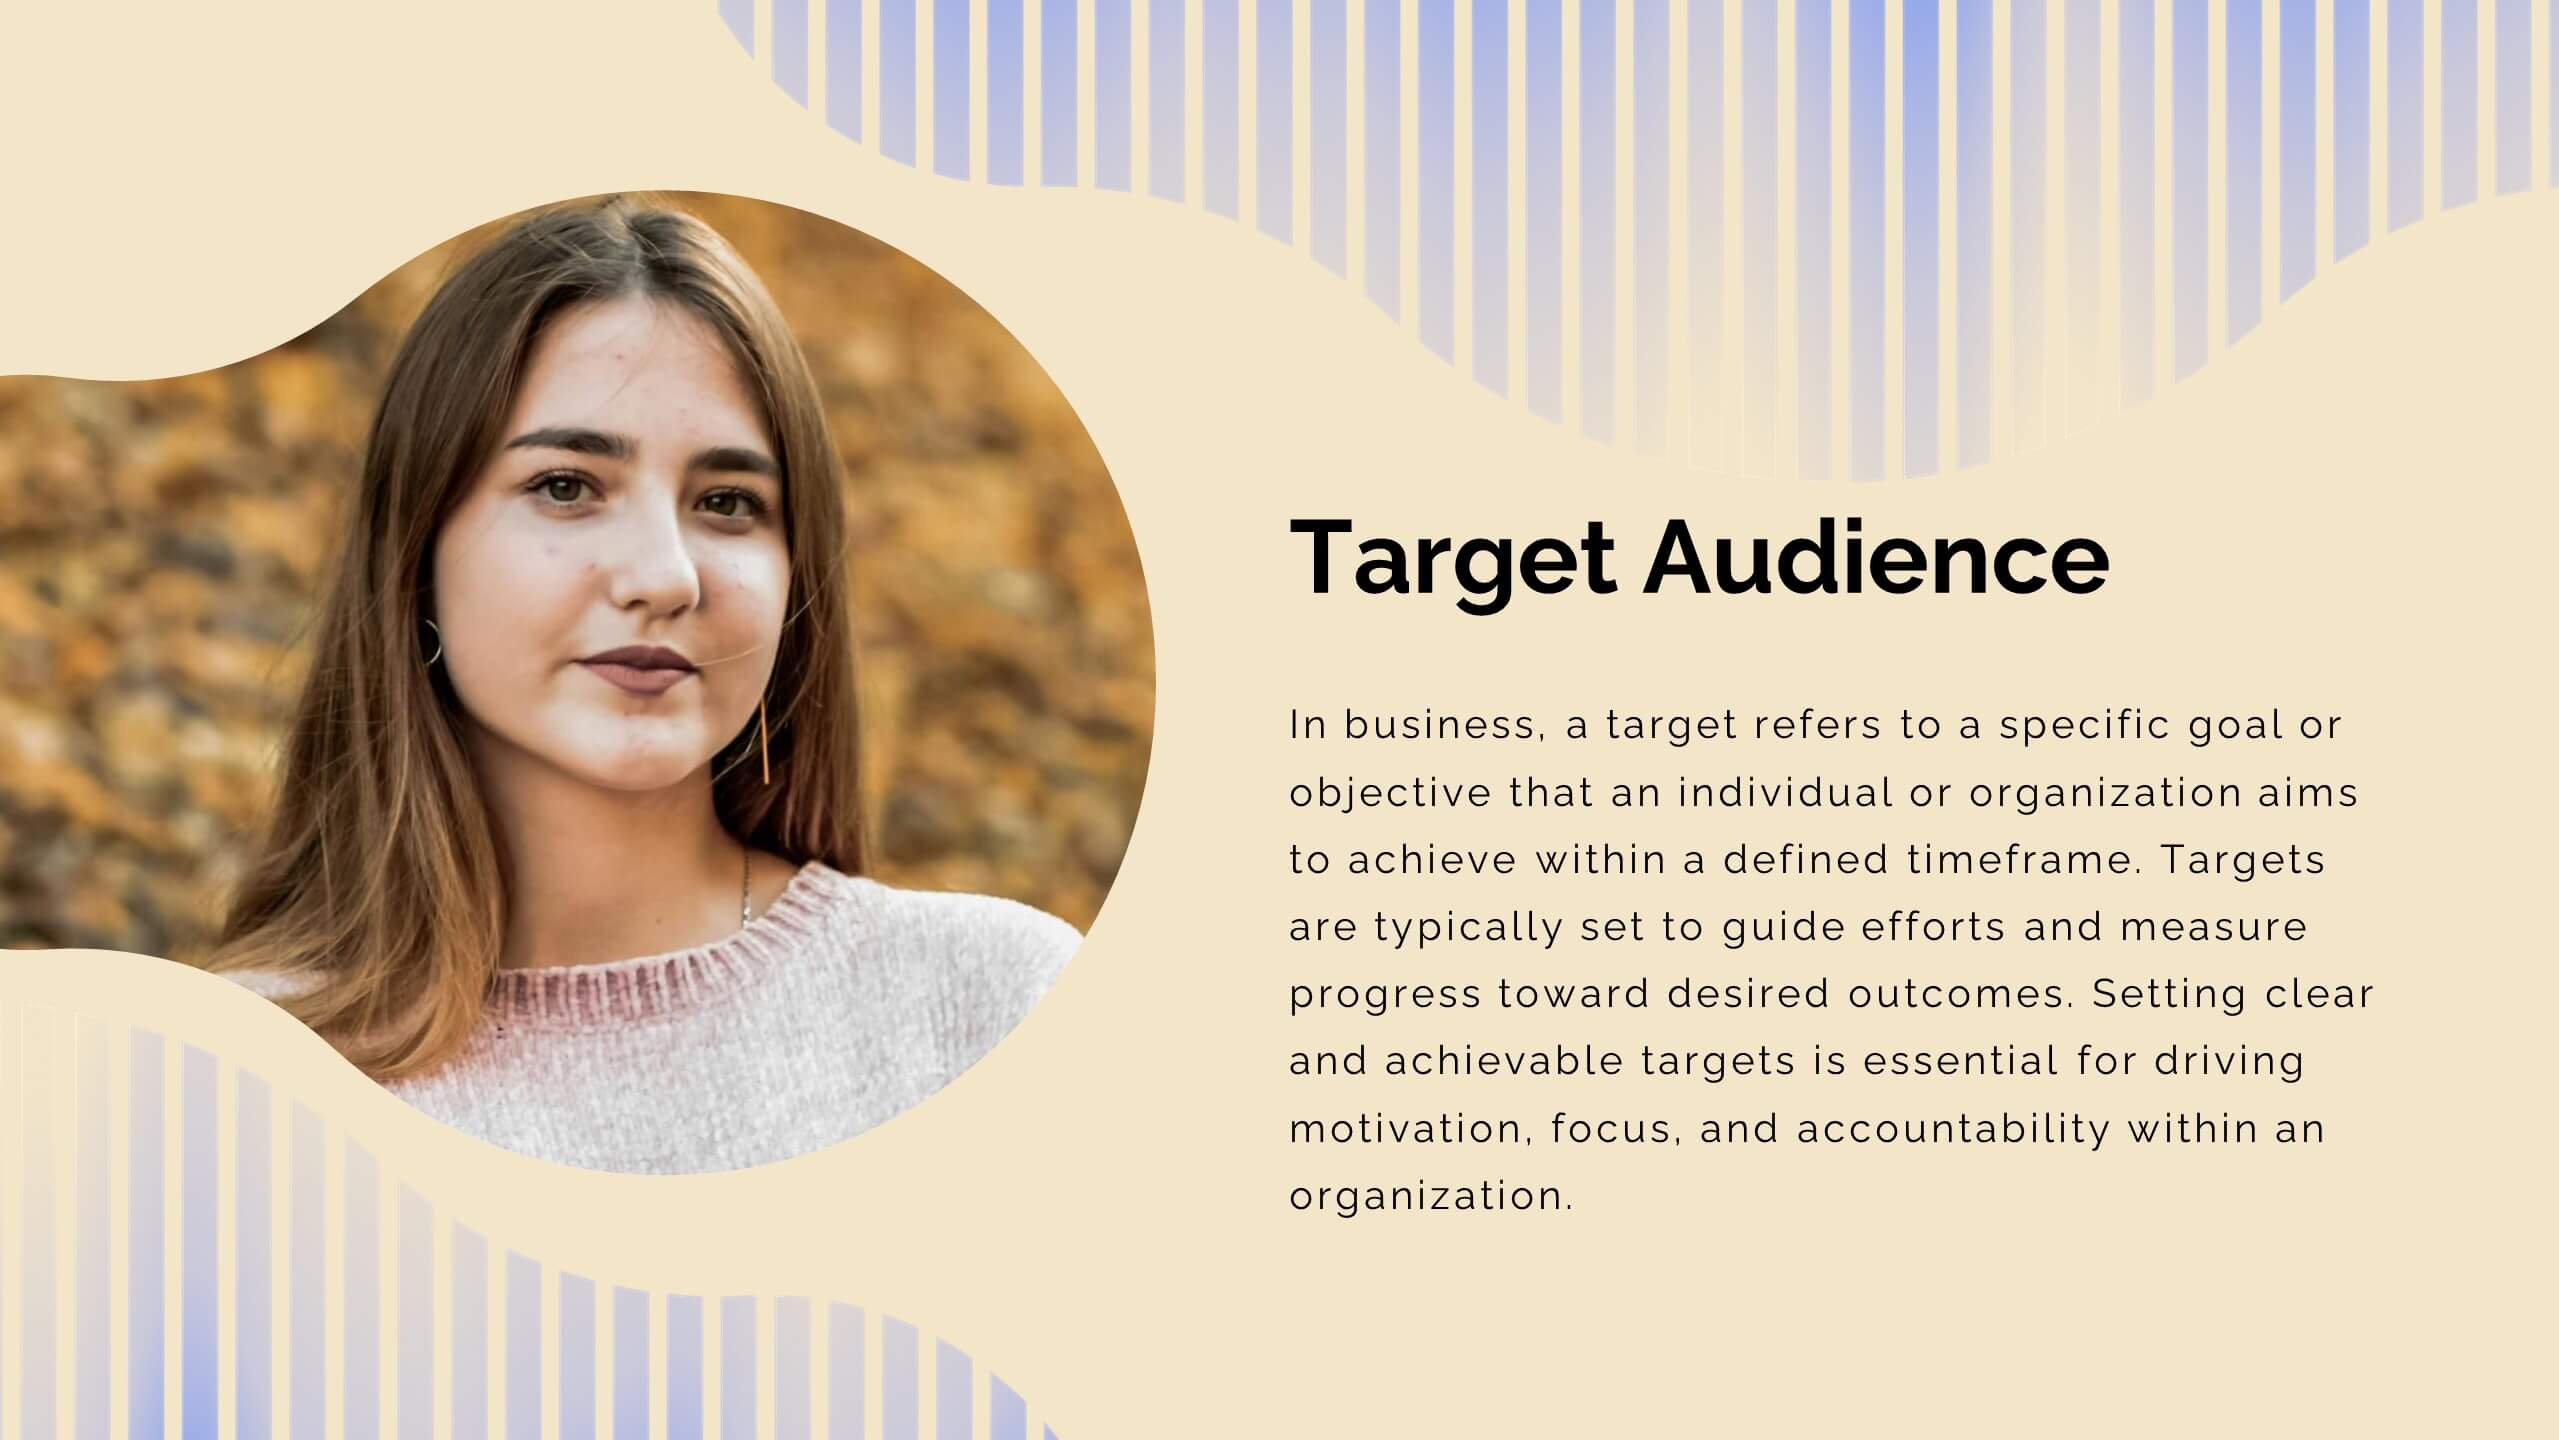
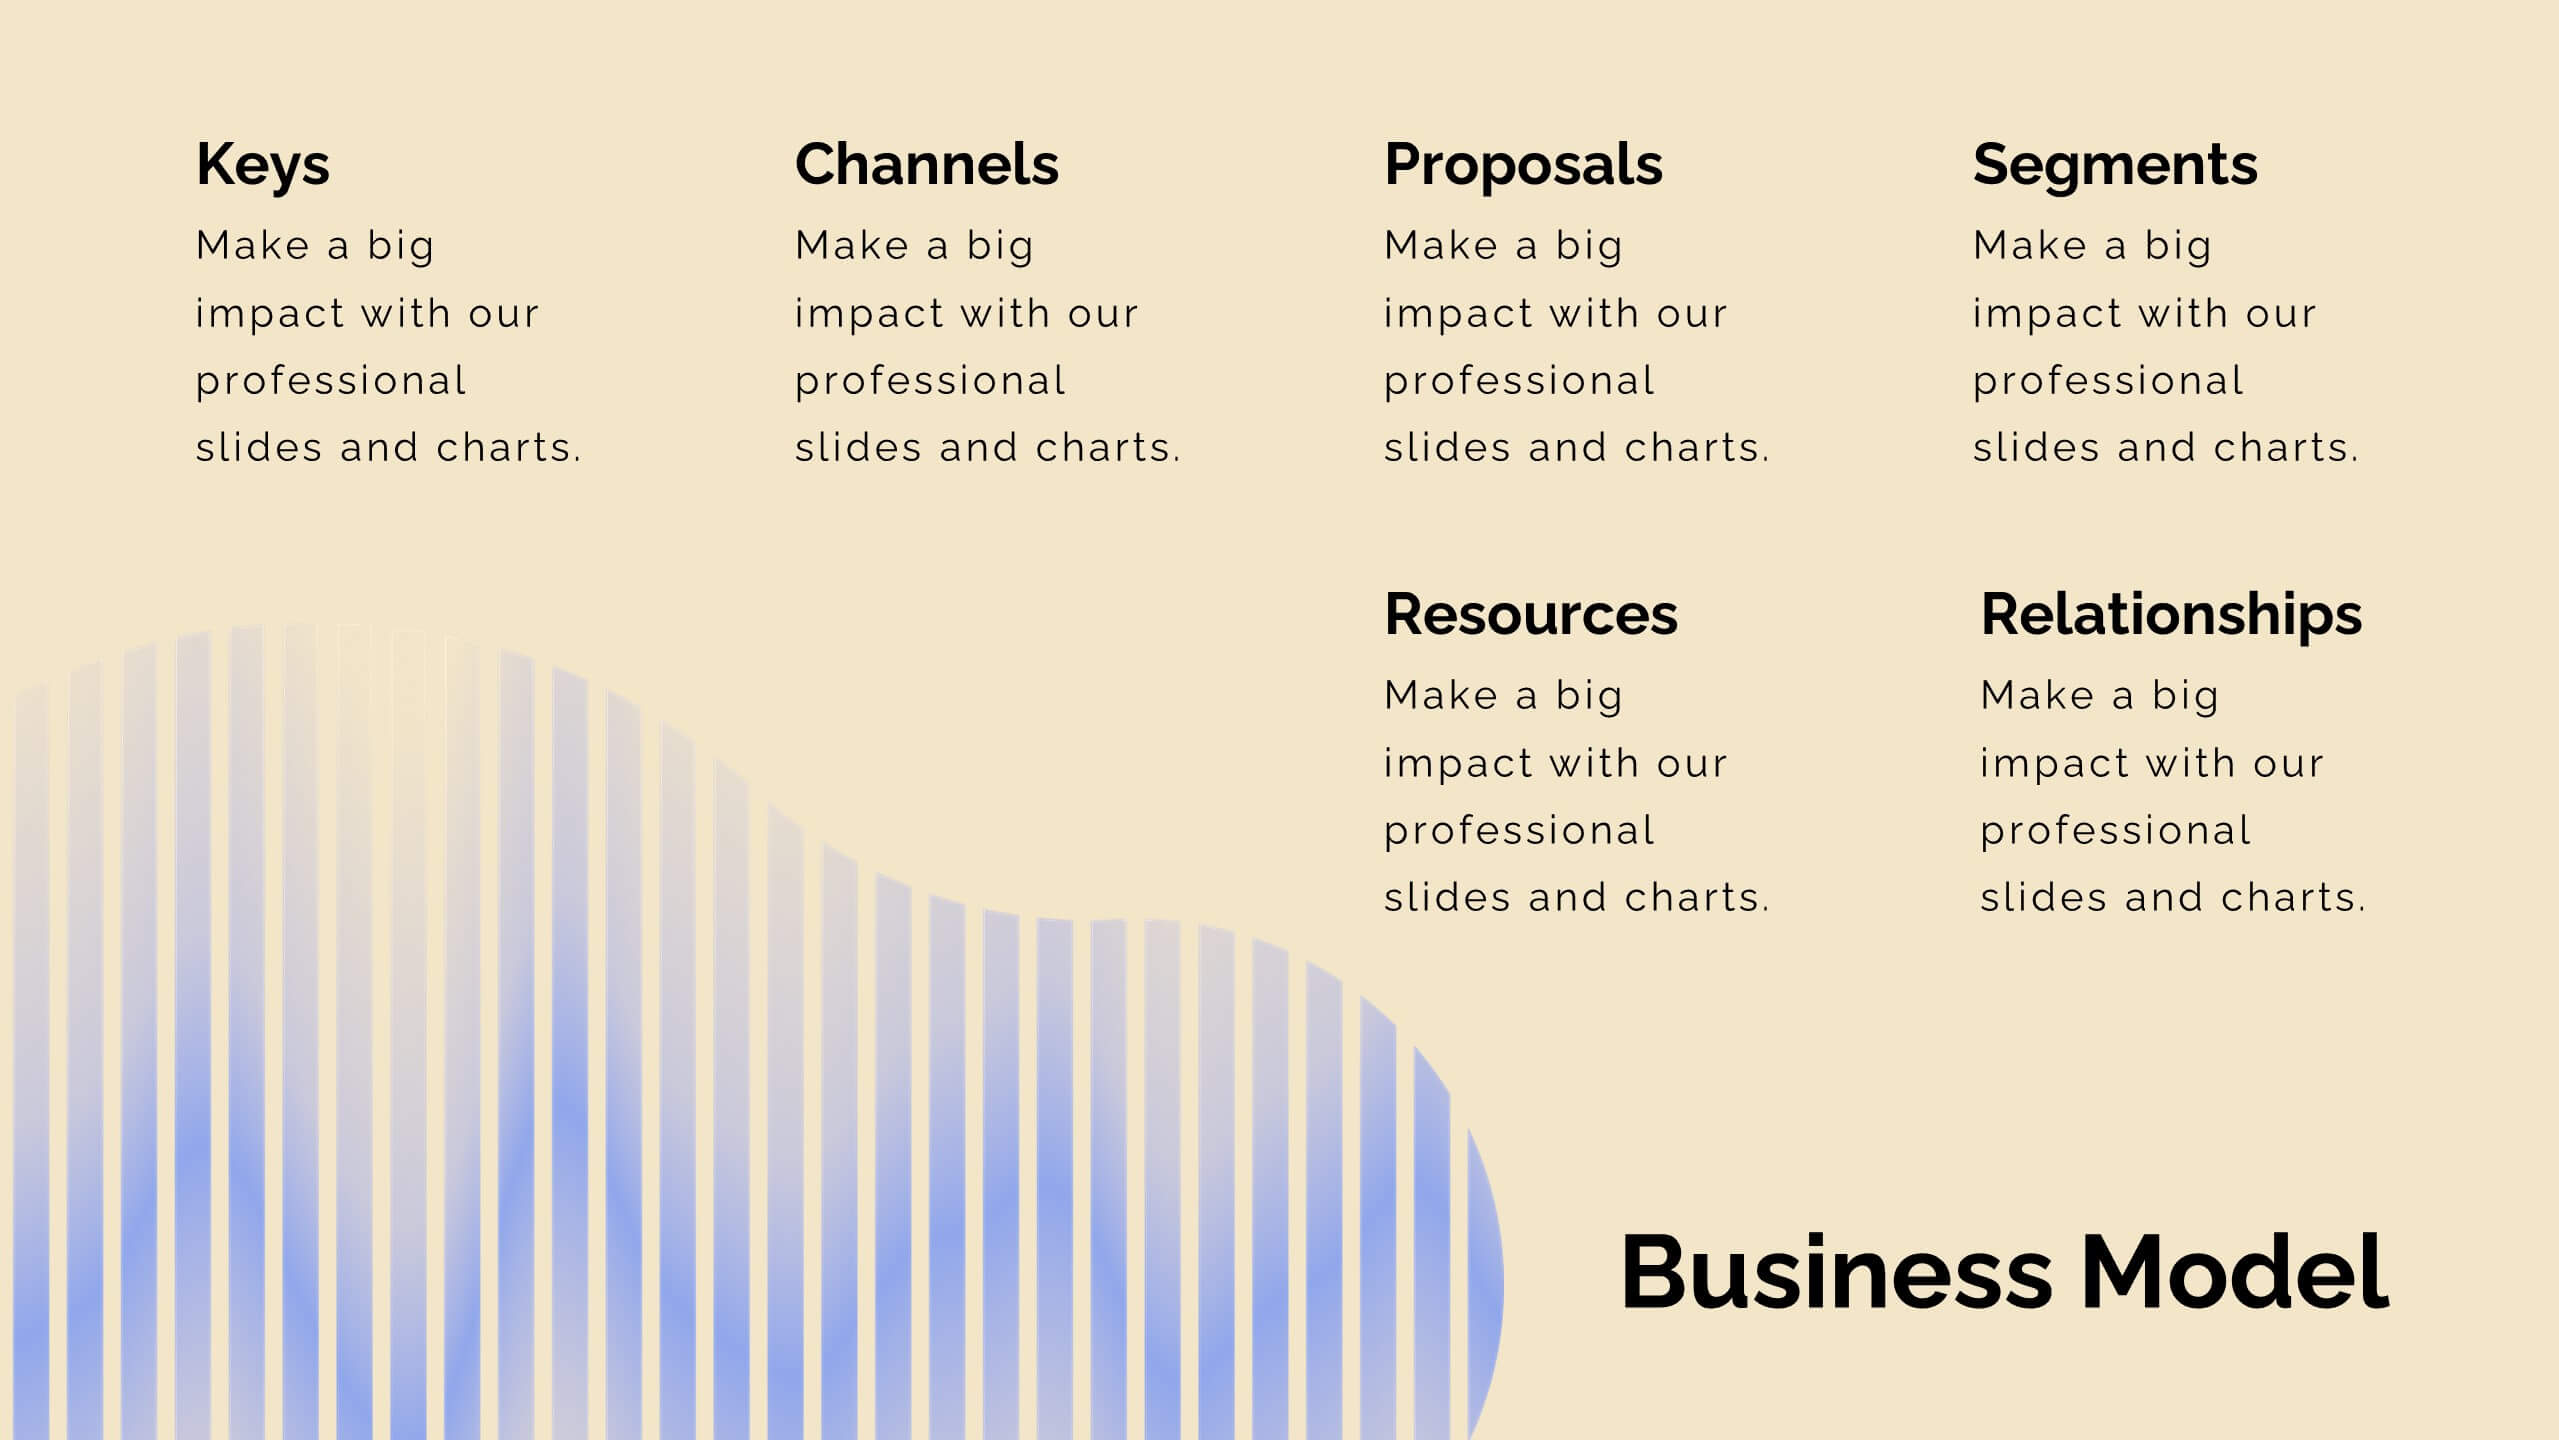
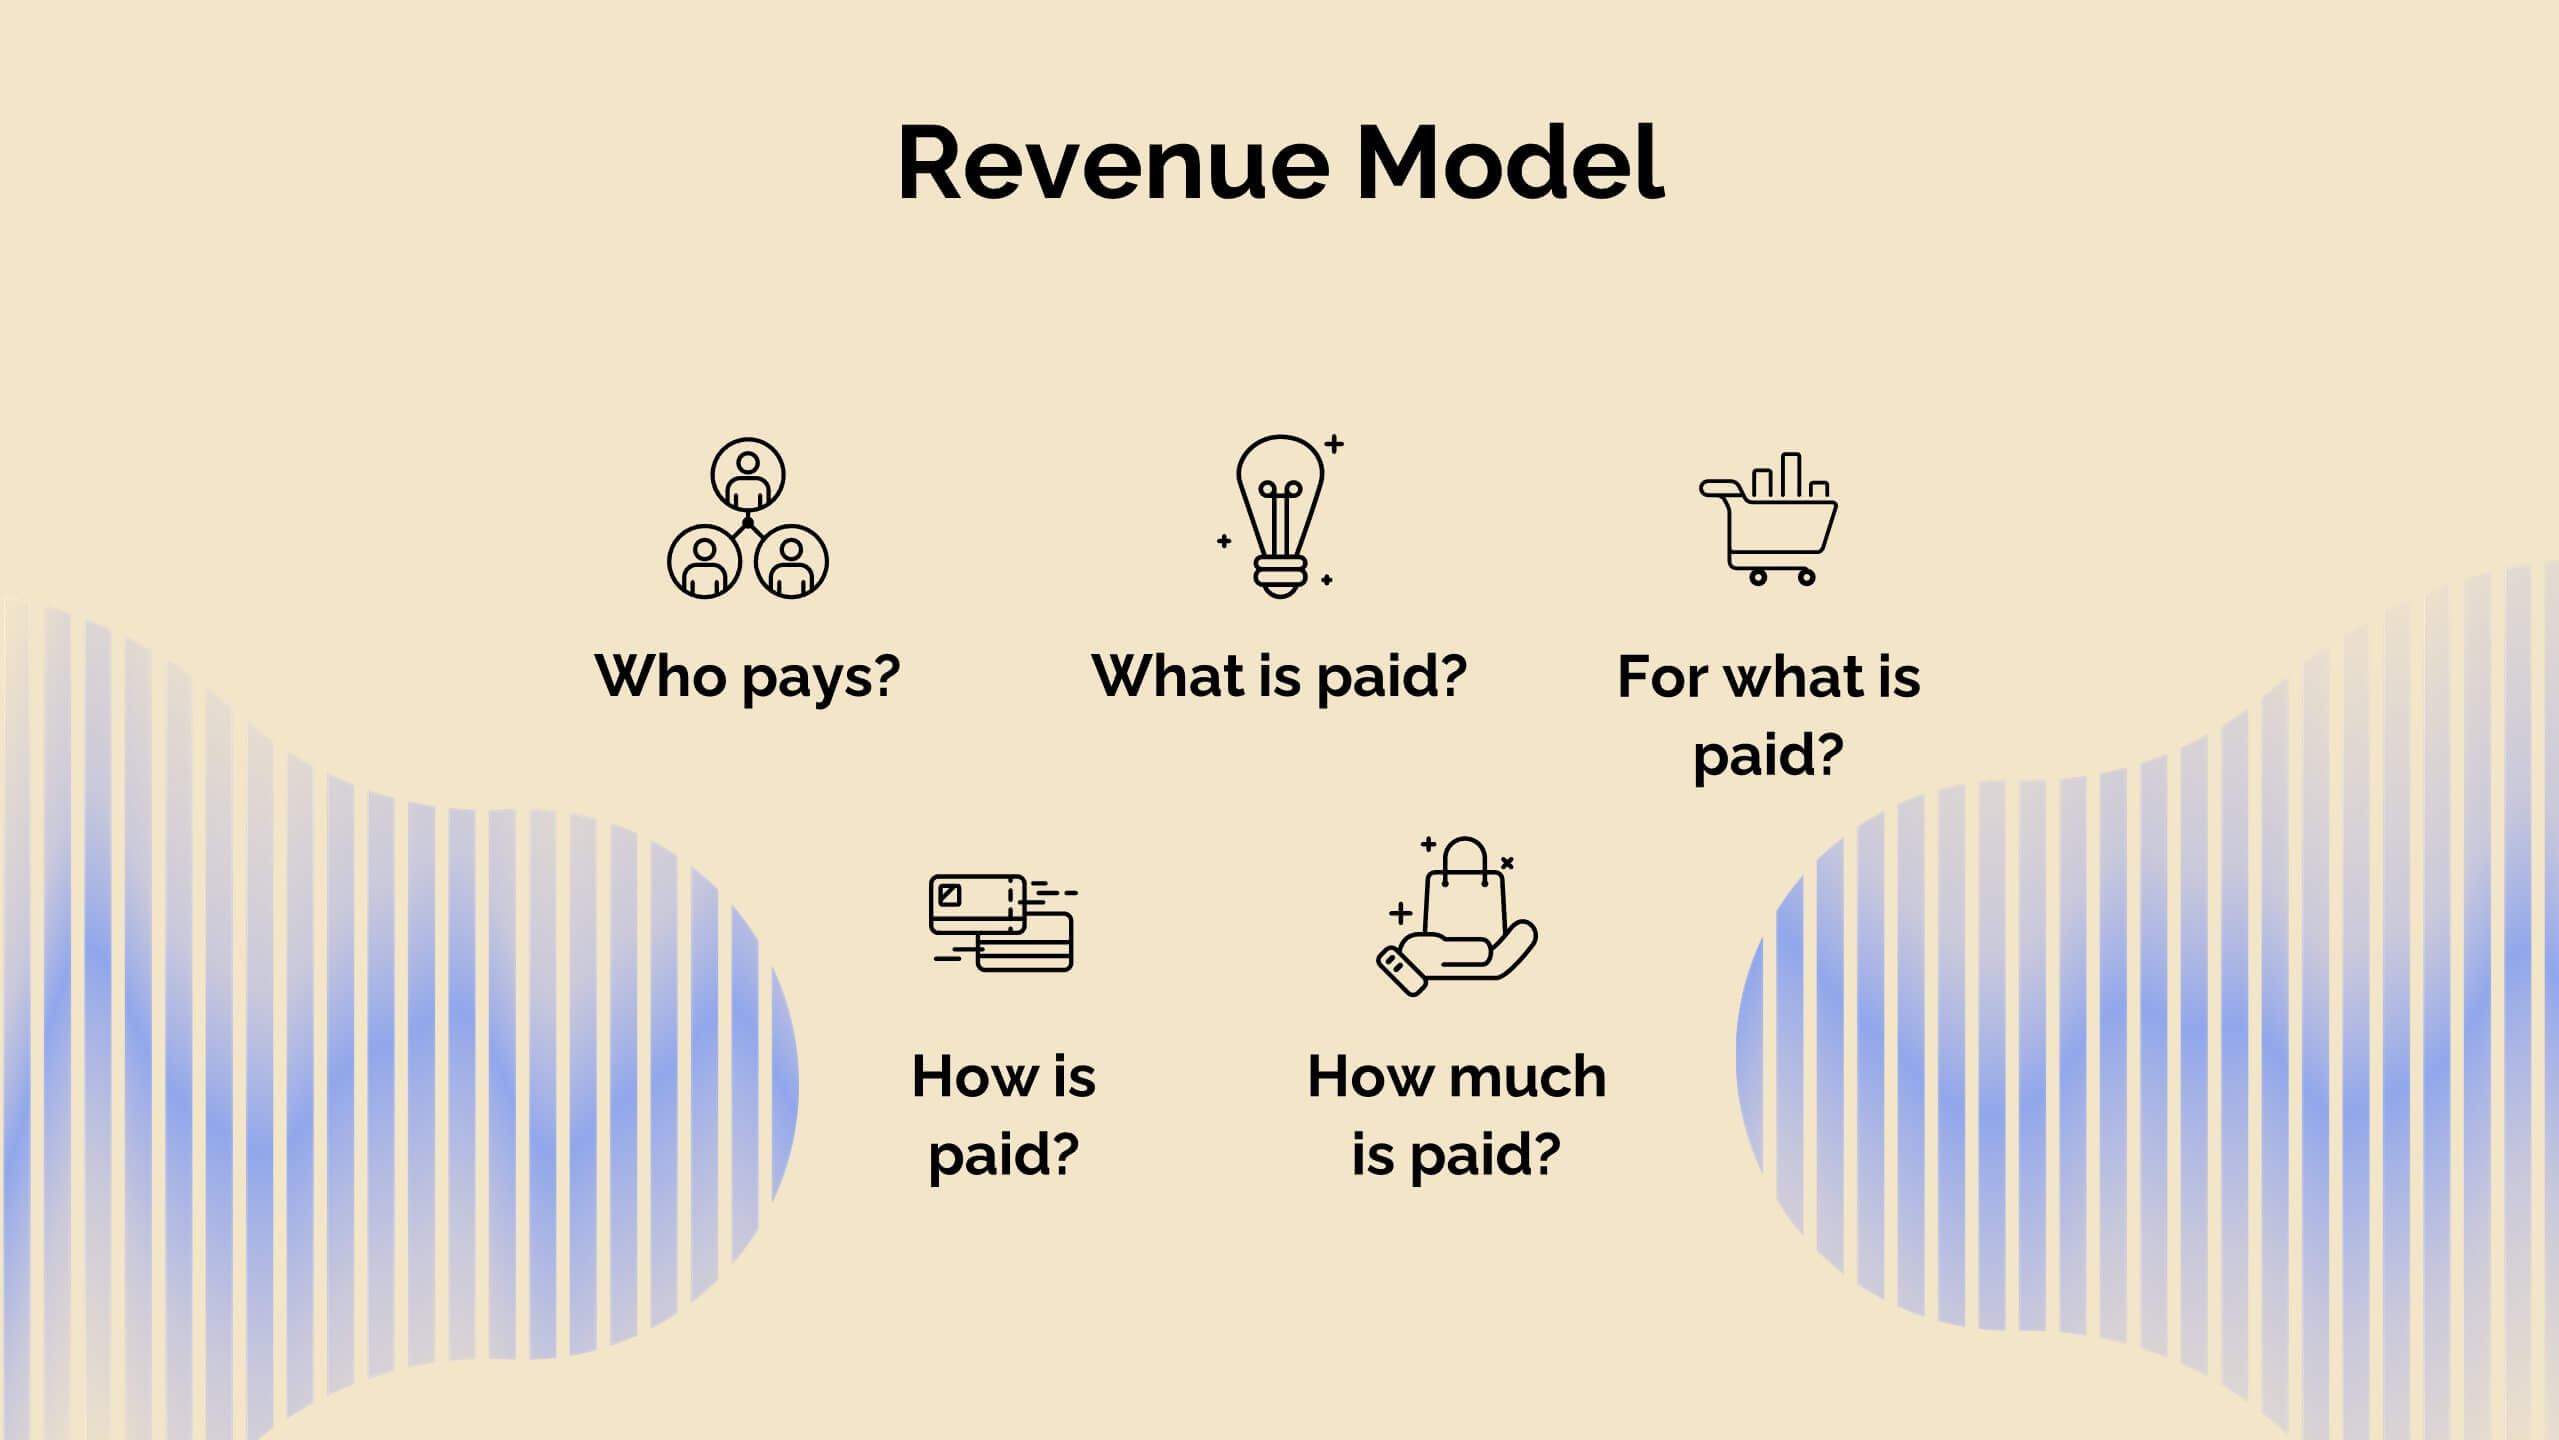
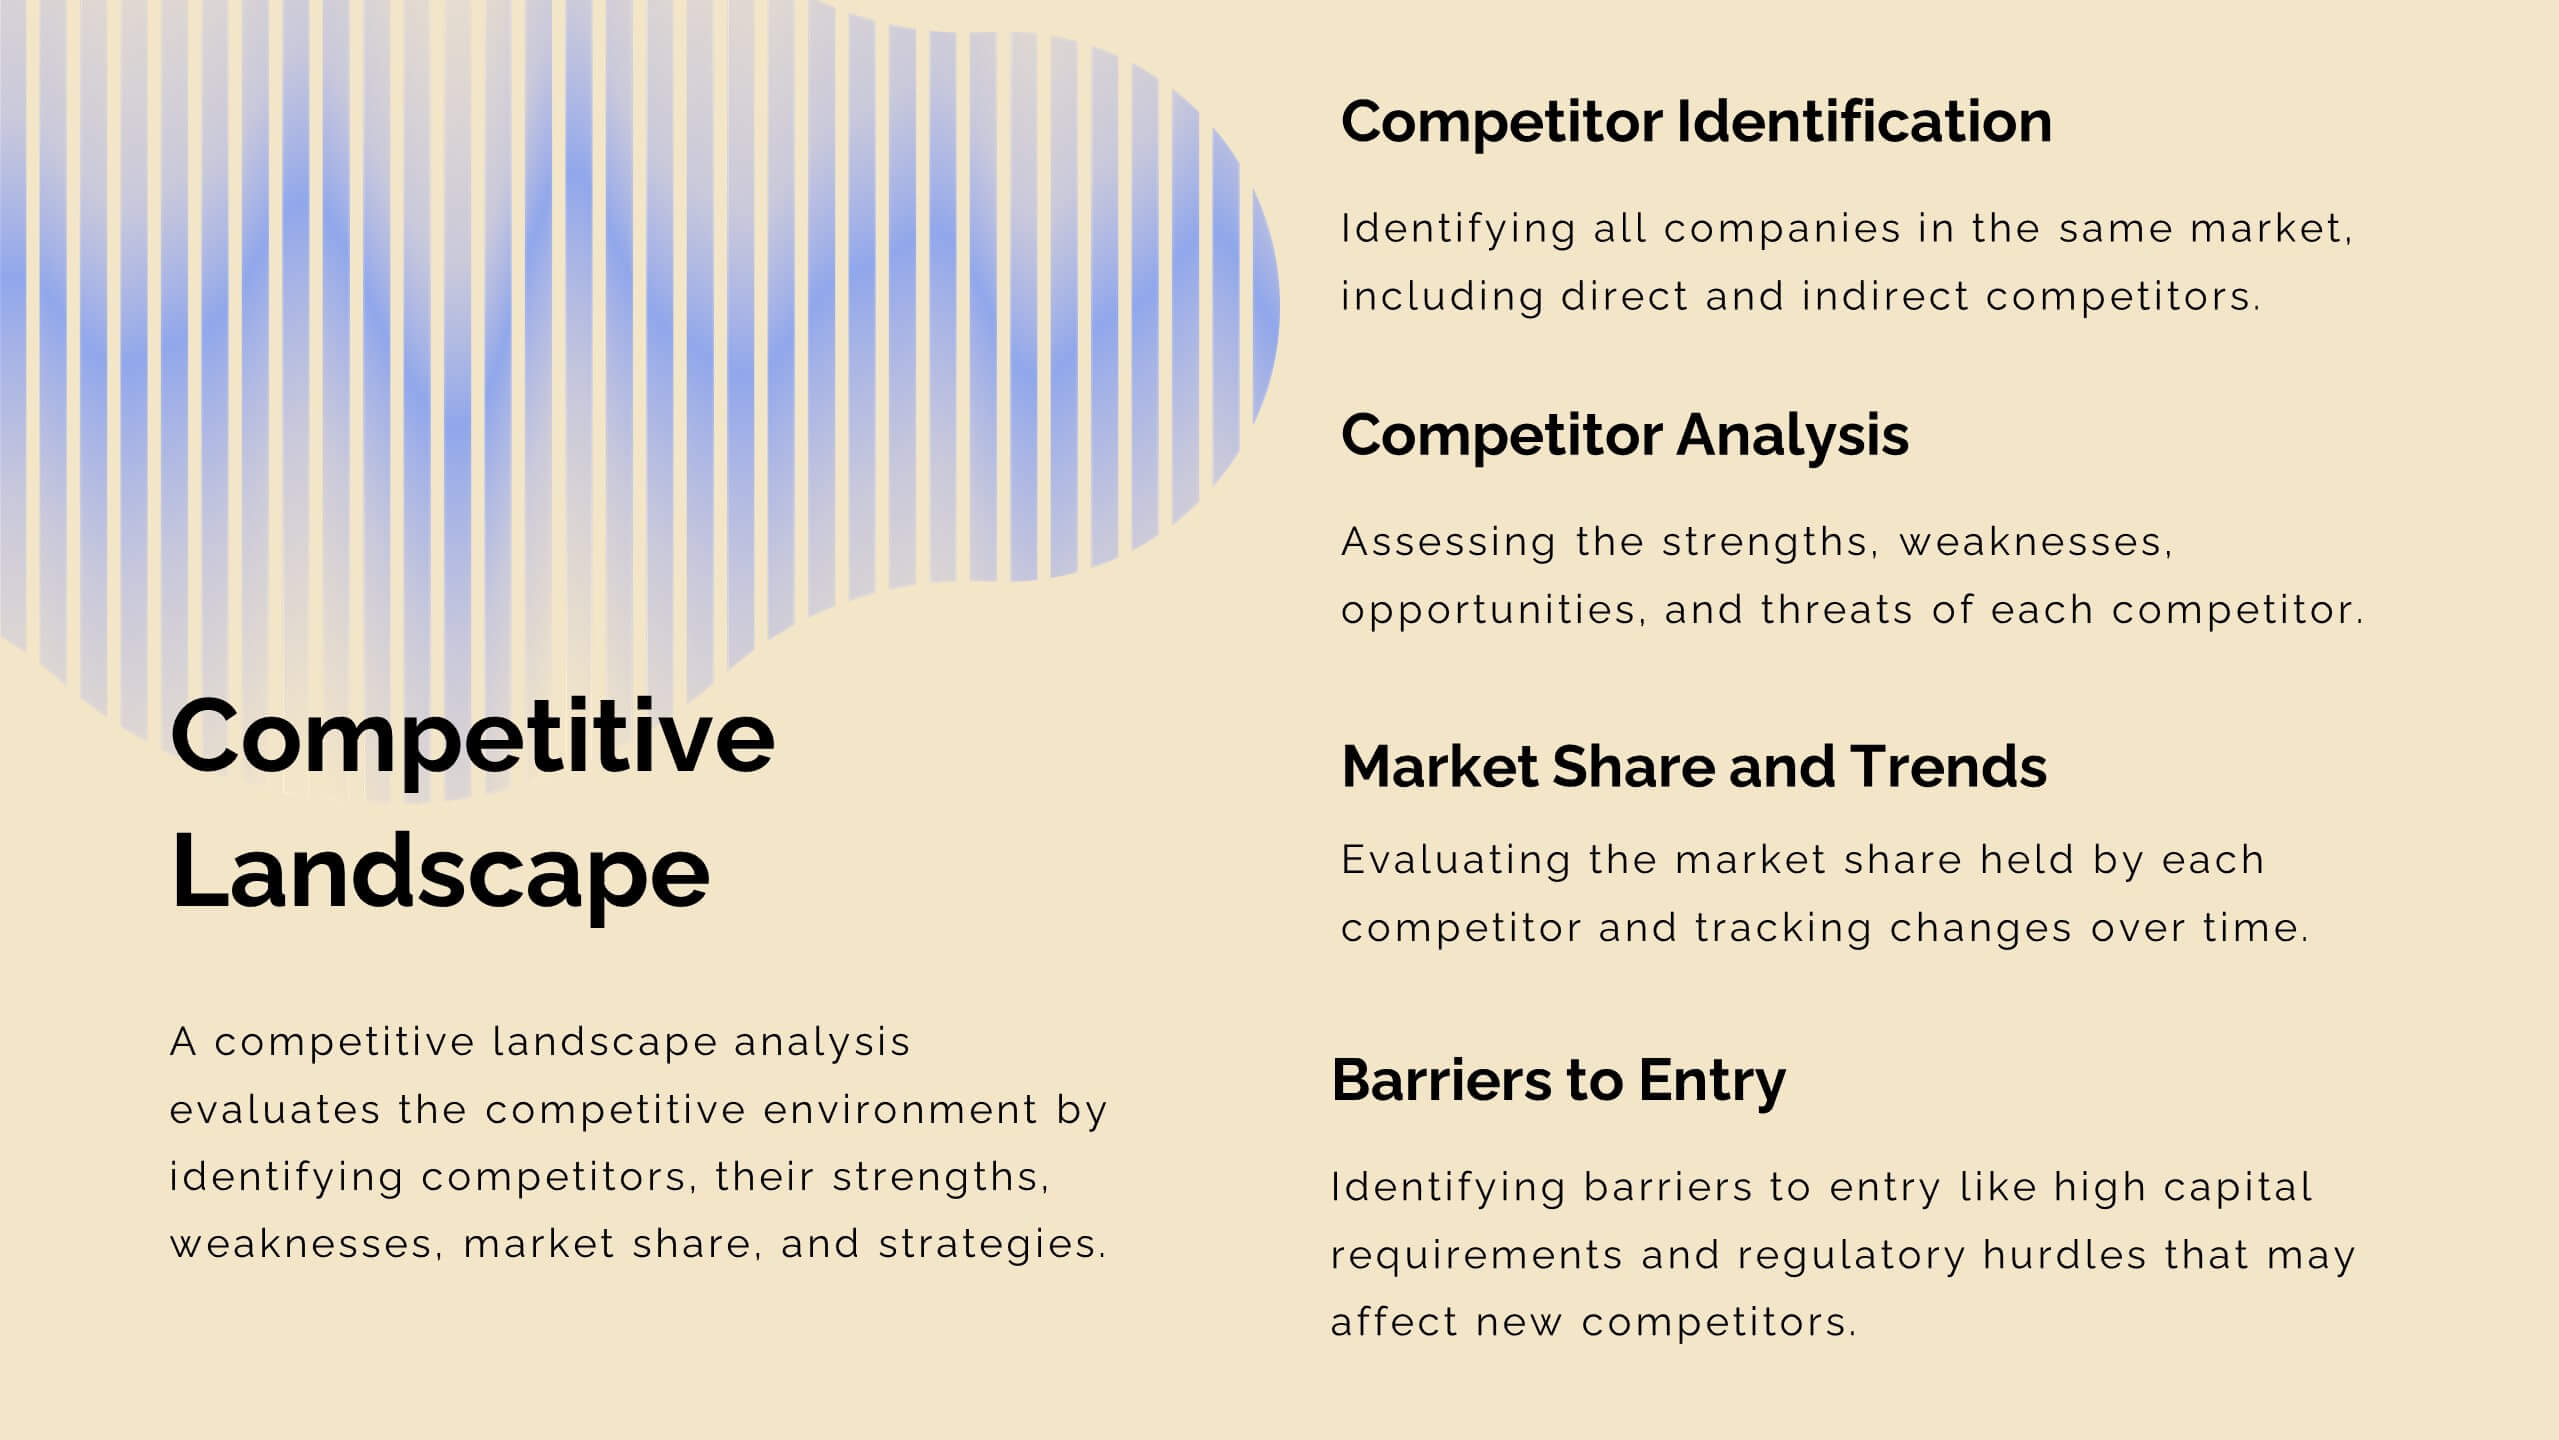
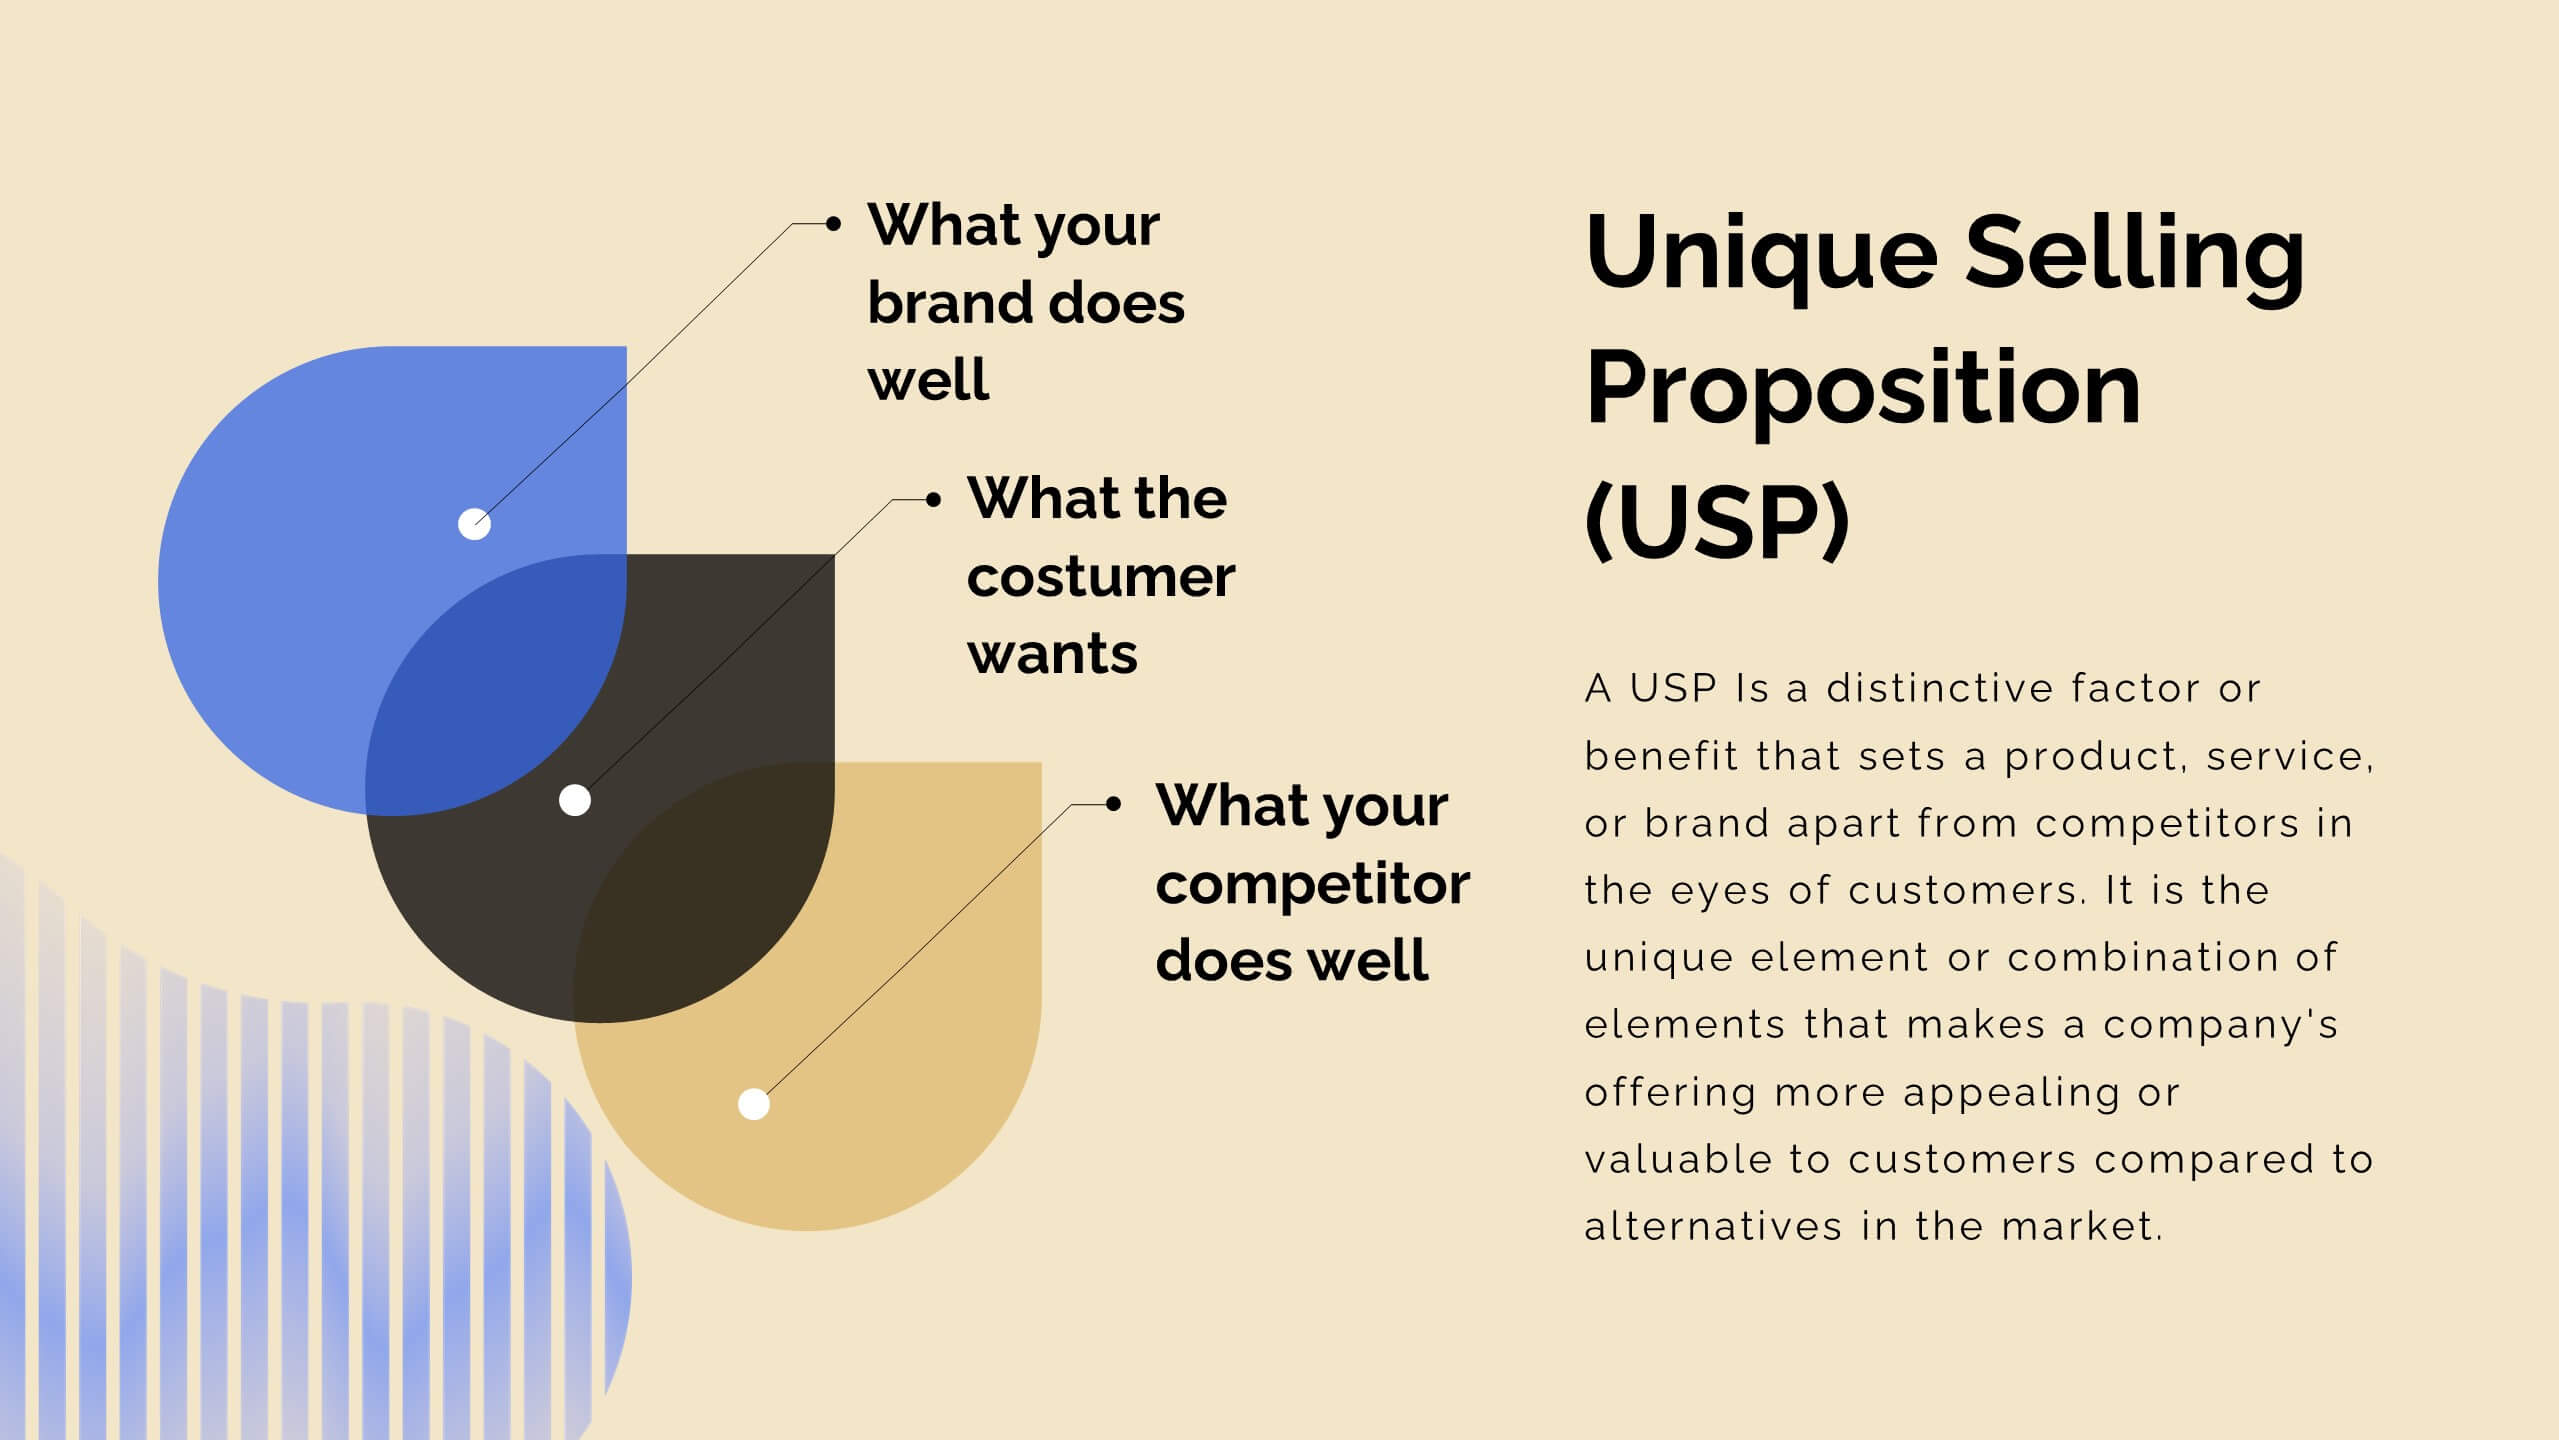
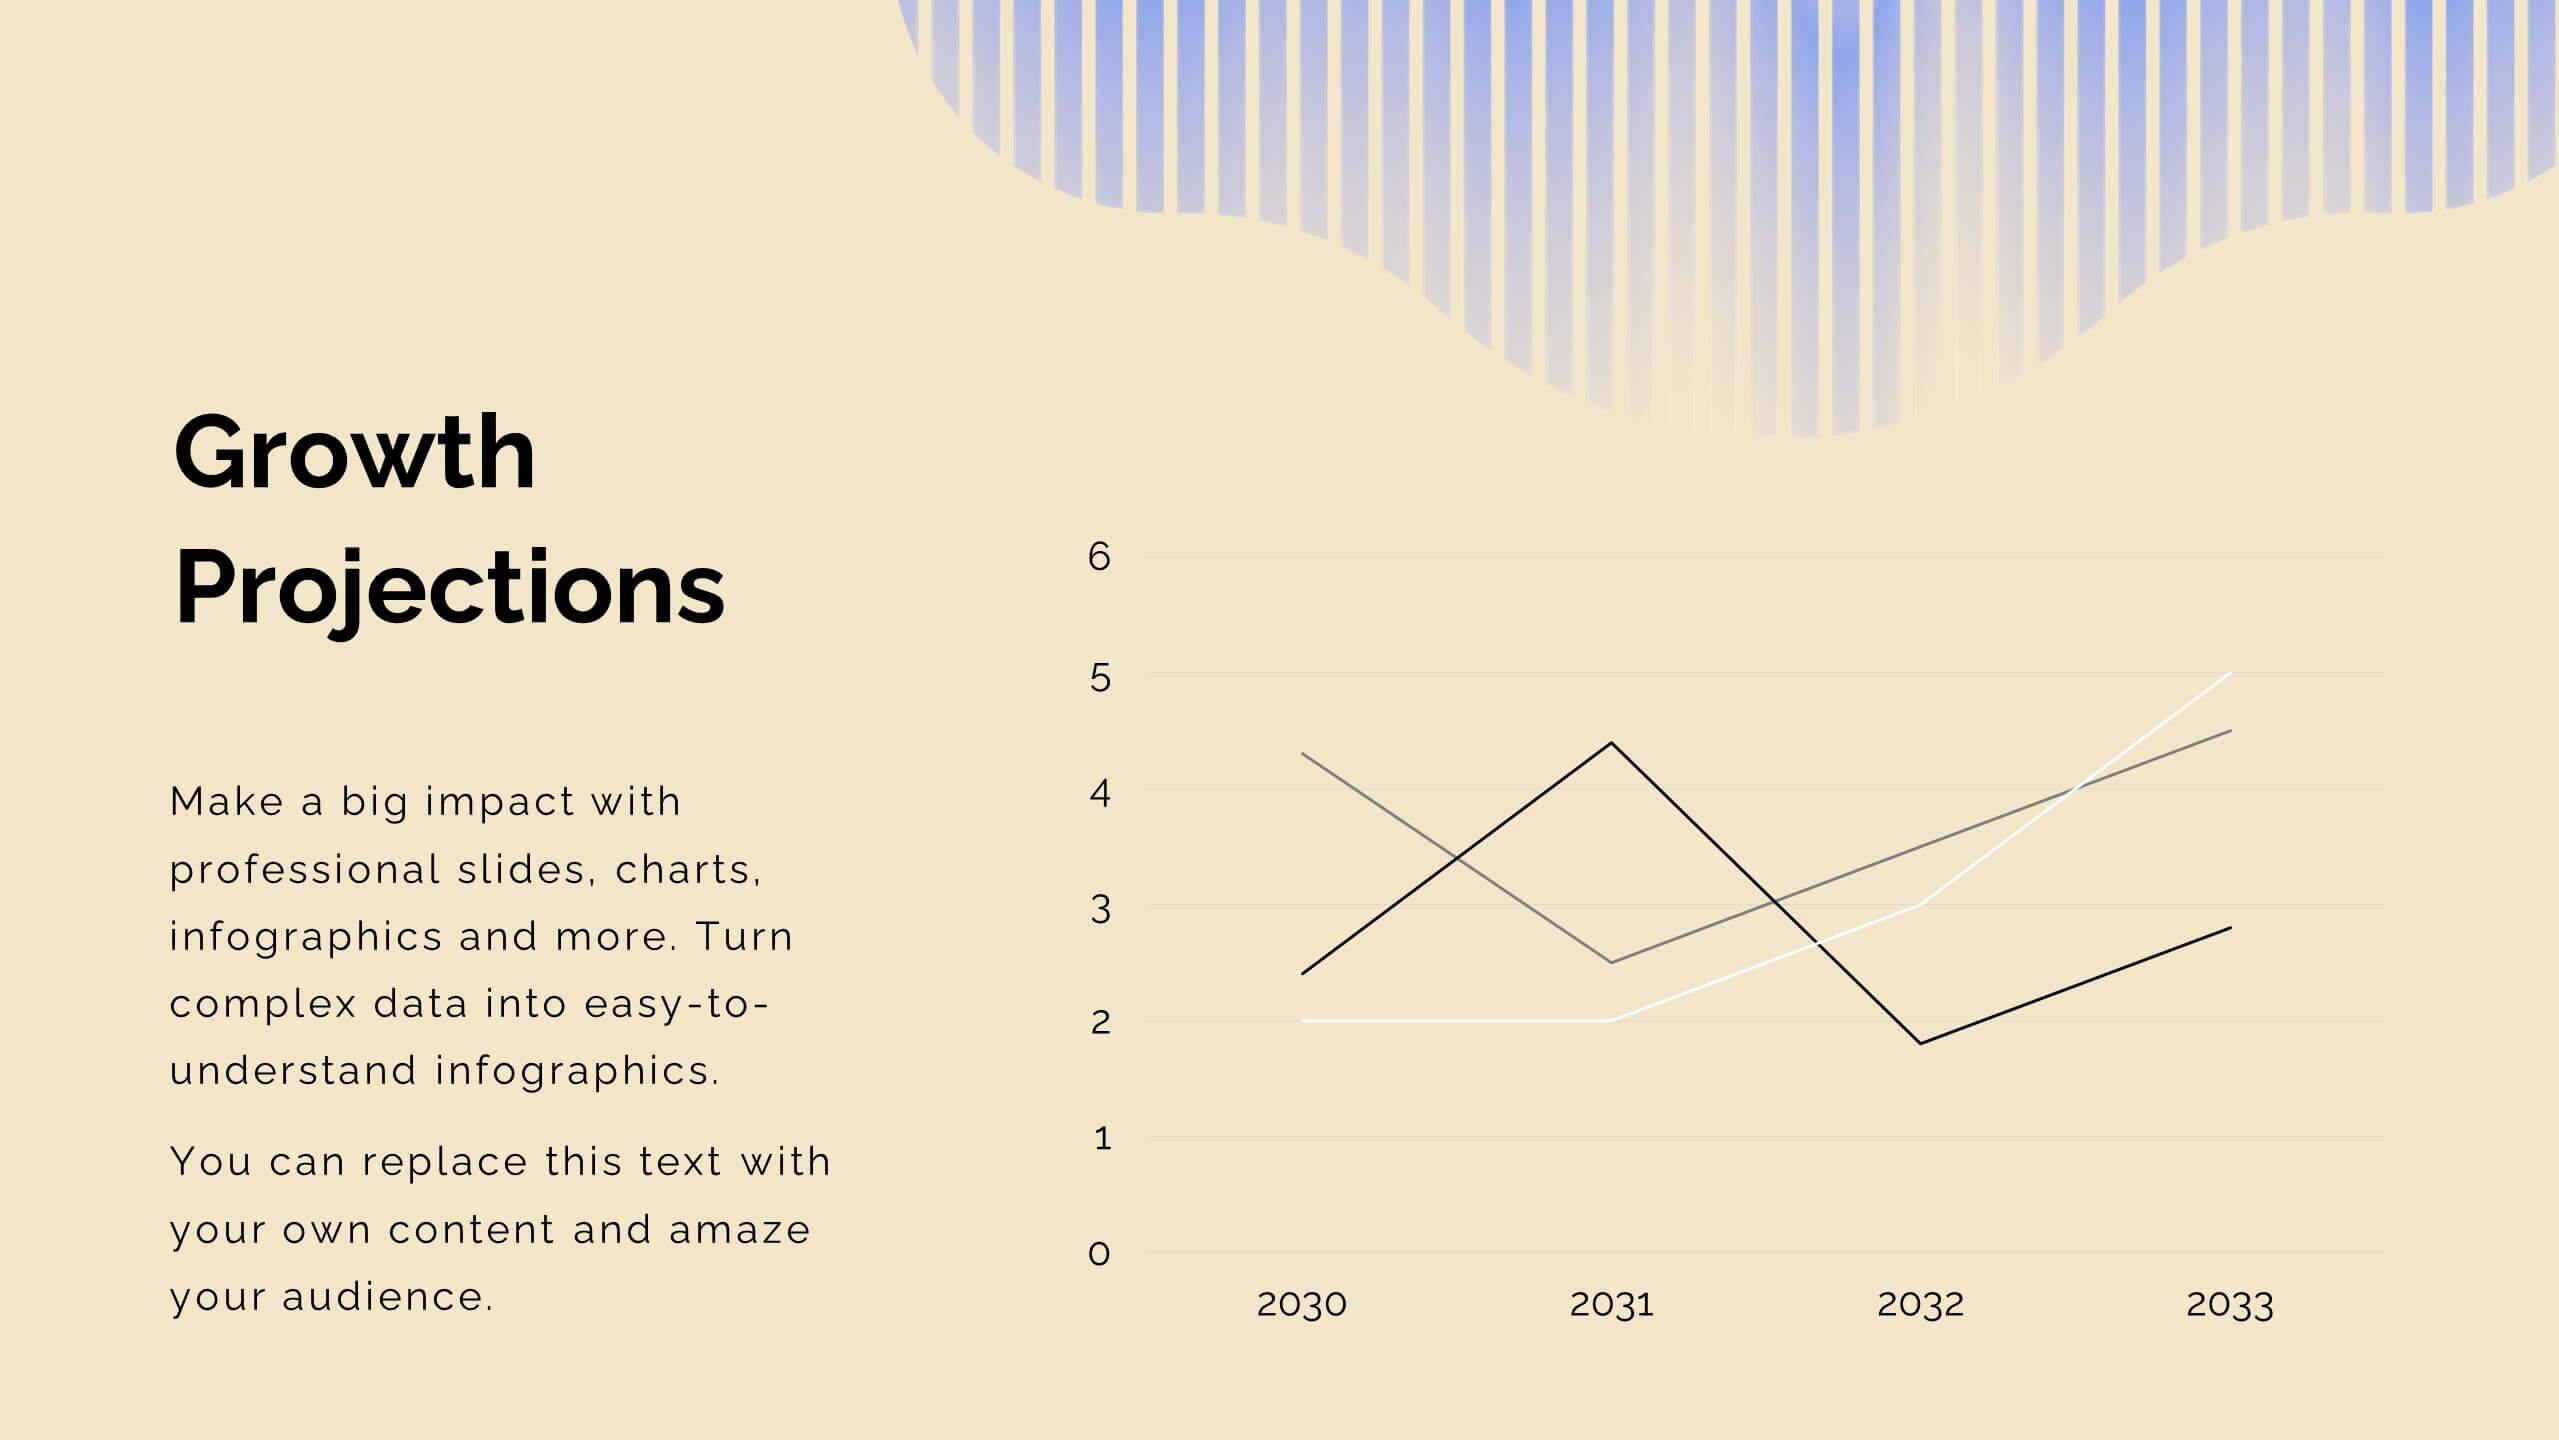
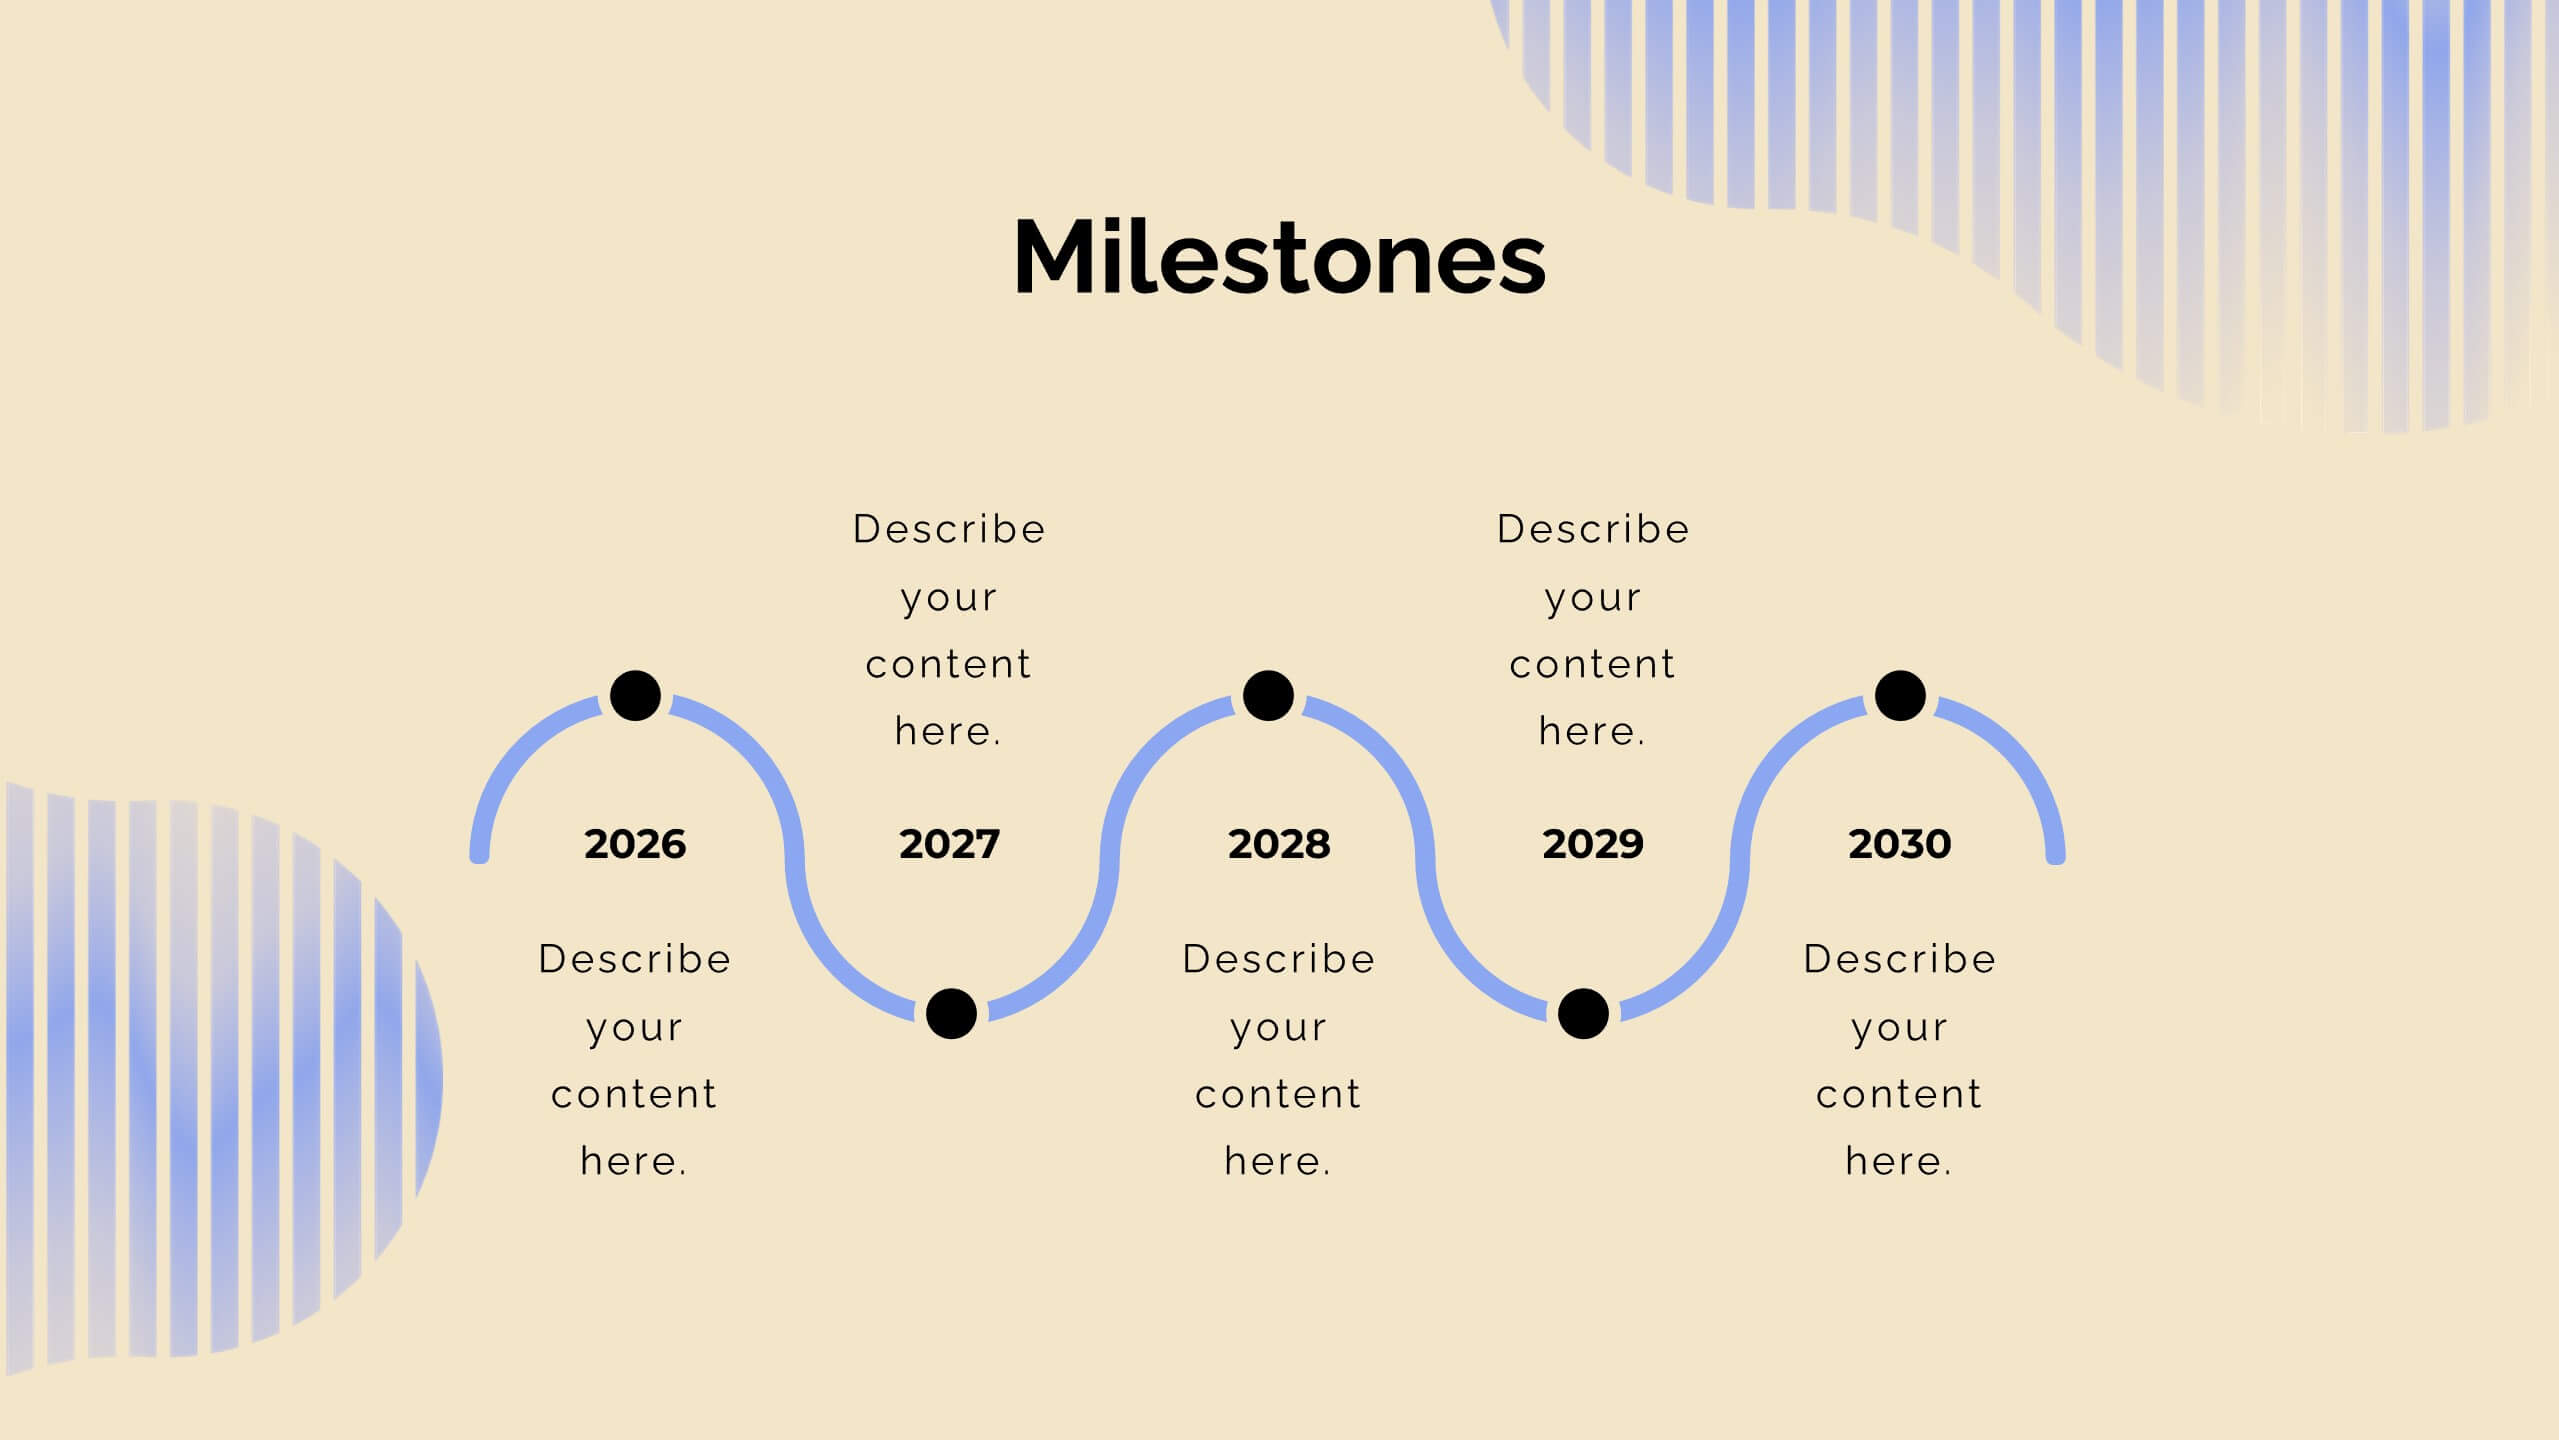
Journey Product Roadmap Presentation
Embark on a seamless journey through your product’s lifecycle with this comprehensive roadmap template! Perfect for illustrating key milestones, business models, and market opportunities, it’s your go-to for clear and engaging presentations. Dive into competitive analysis, showcase your unique selling proposition, and outline your growth projections with style. Compatible with PowerPoint, Keynote, and Google Slides.


8 diapositivas
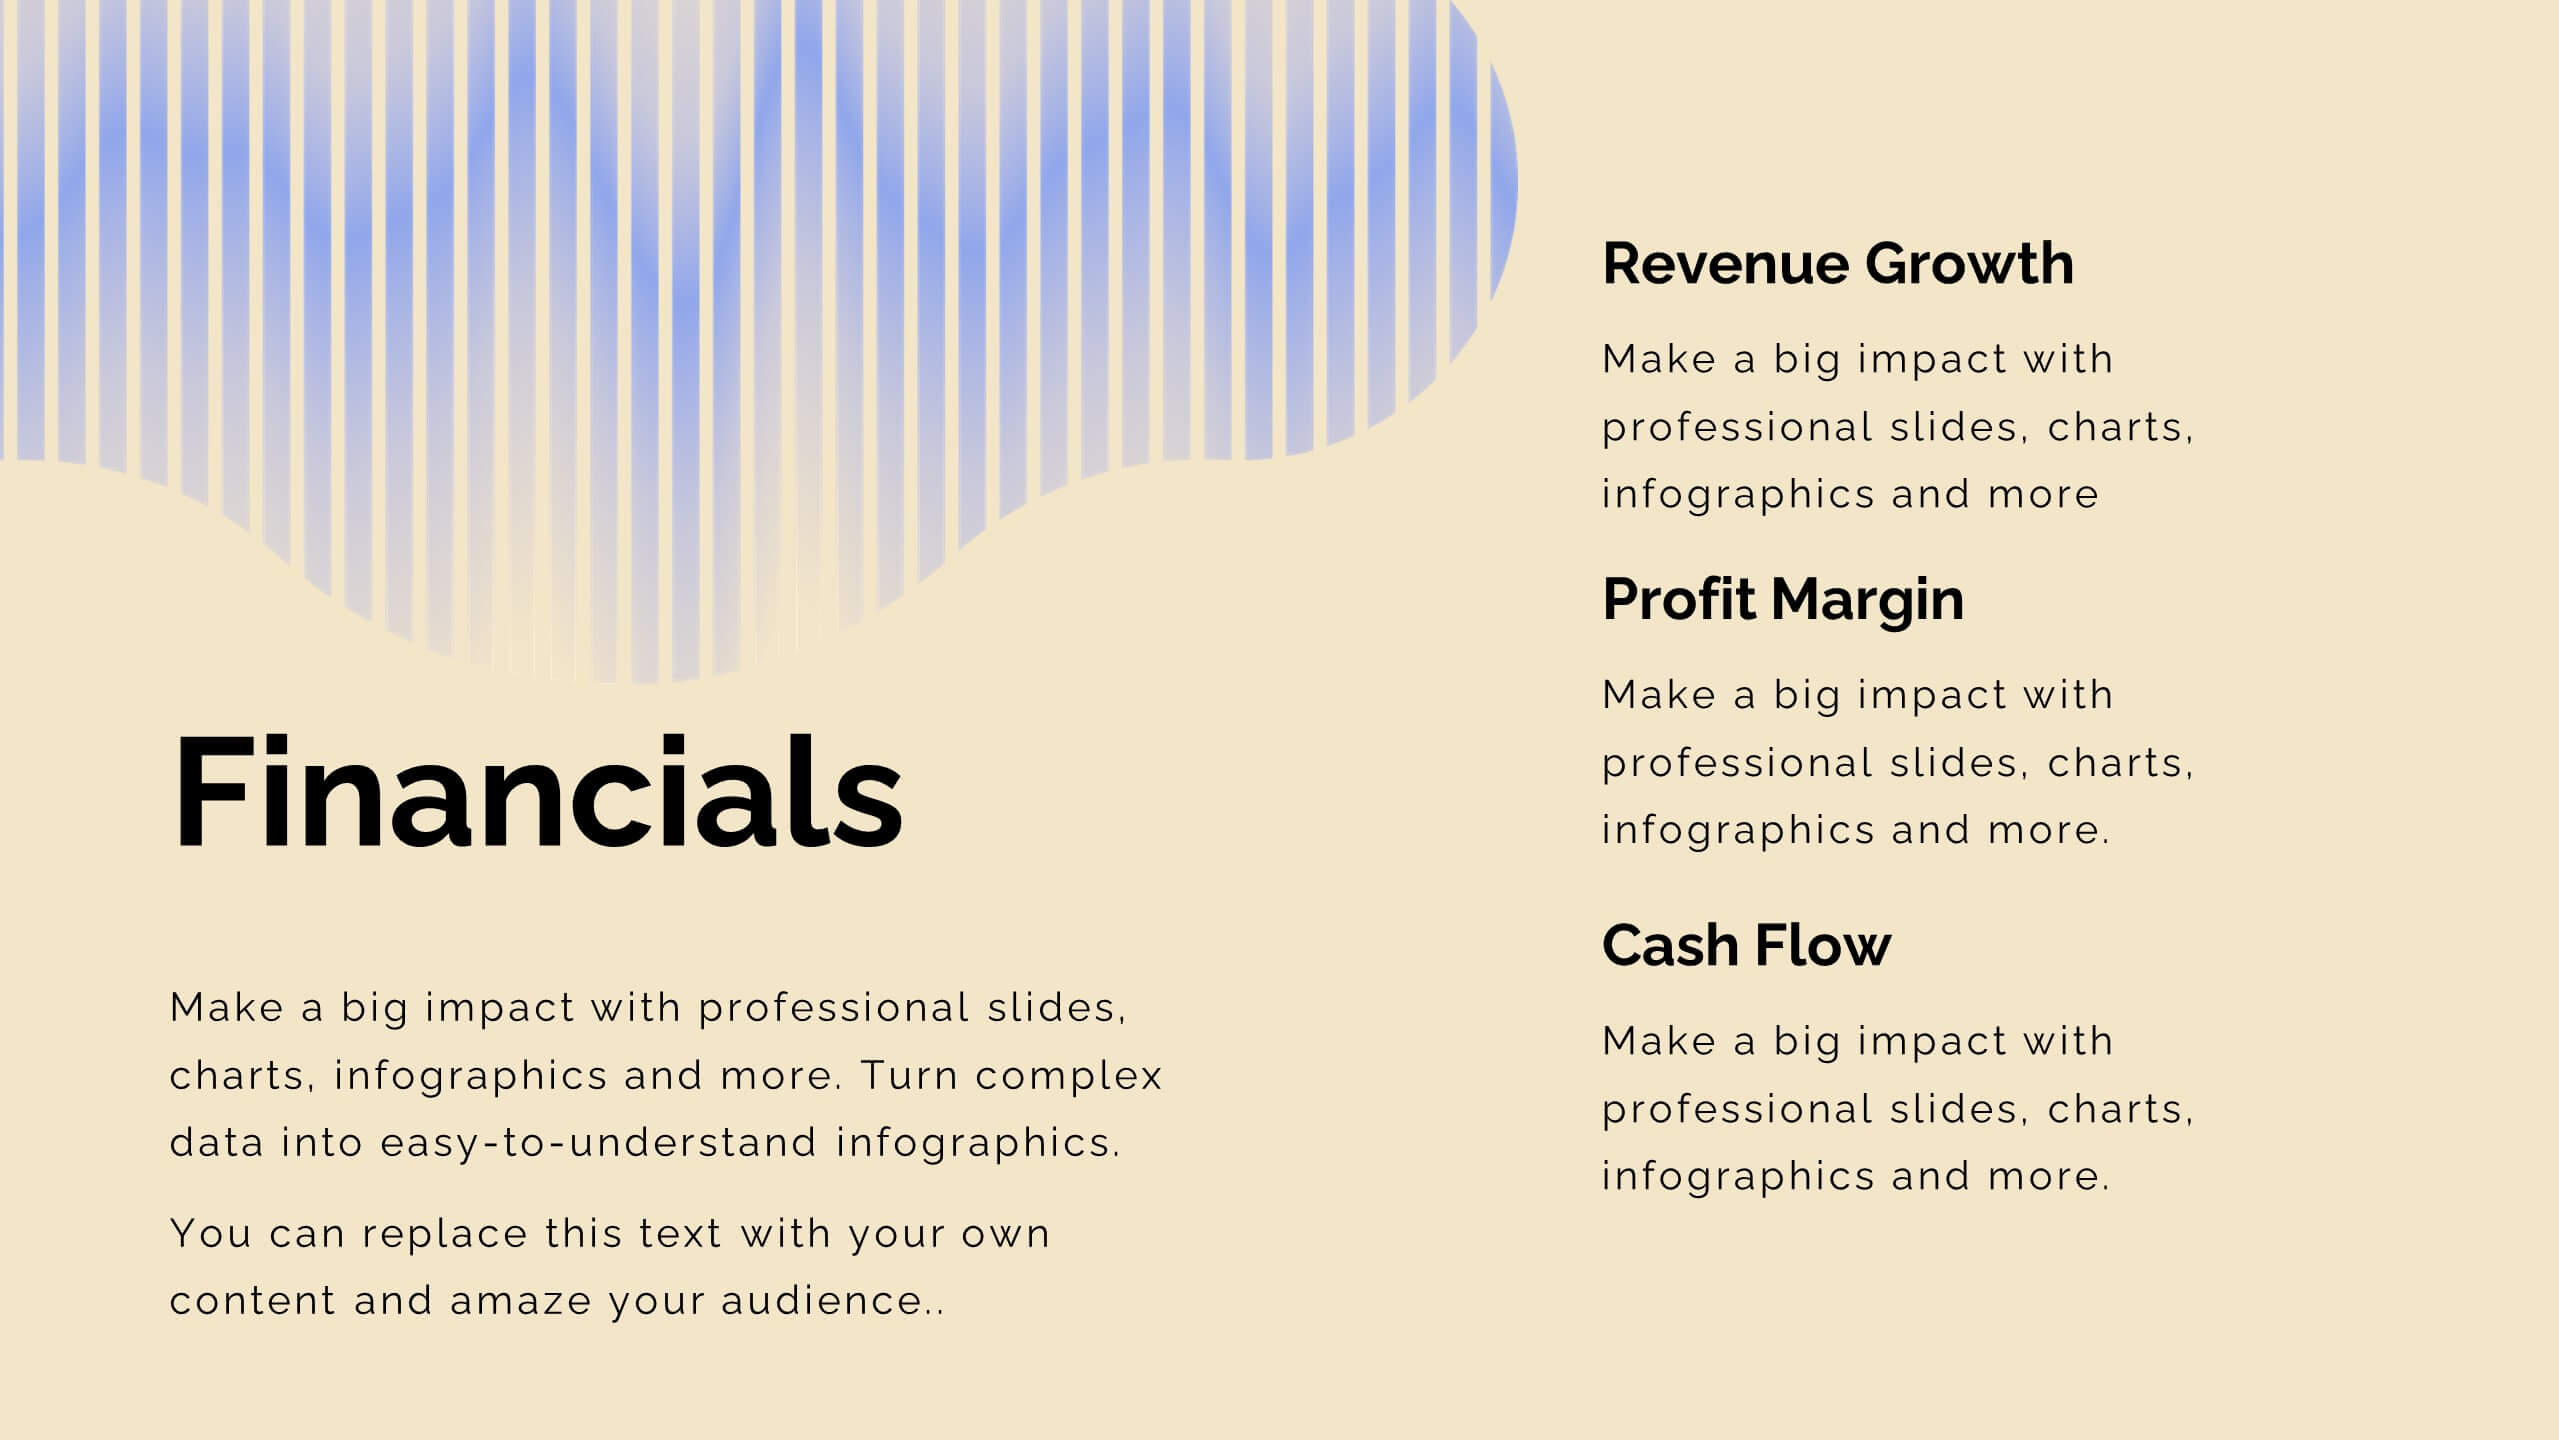
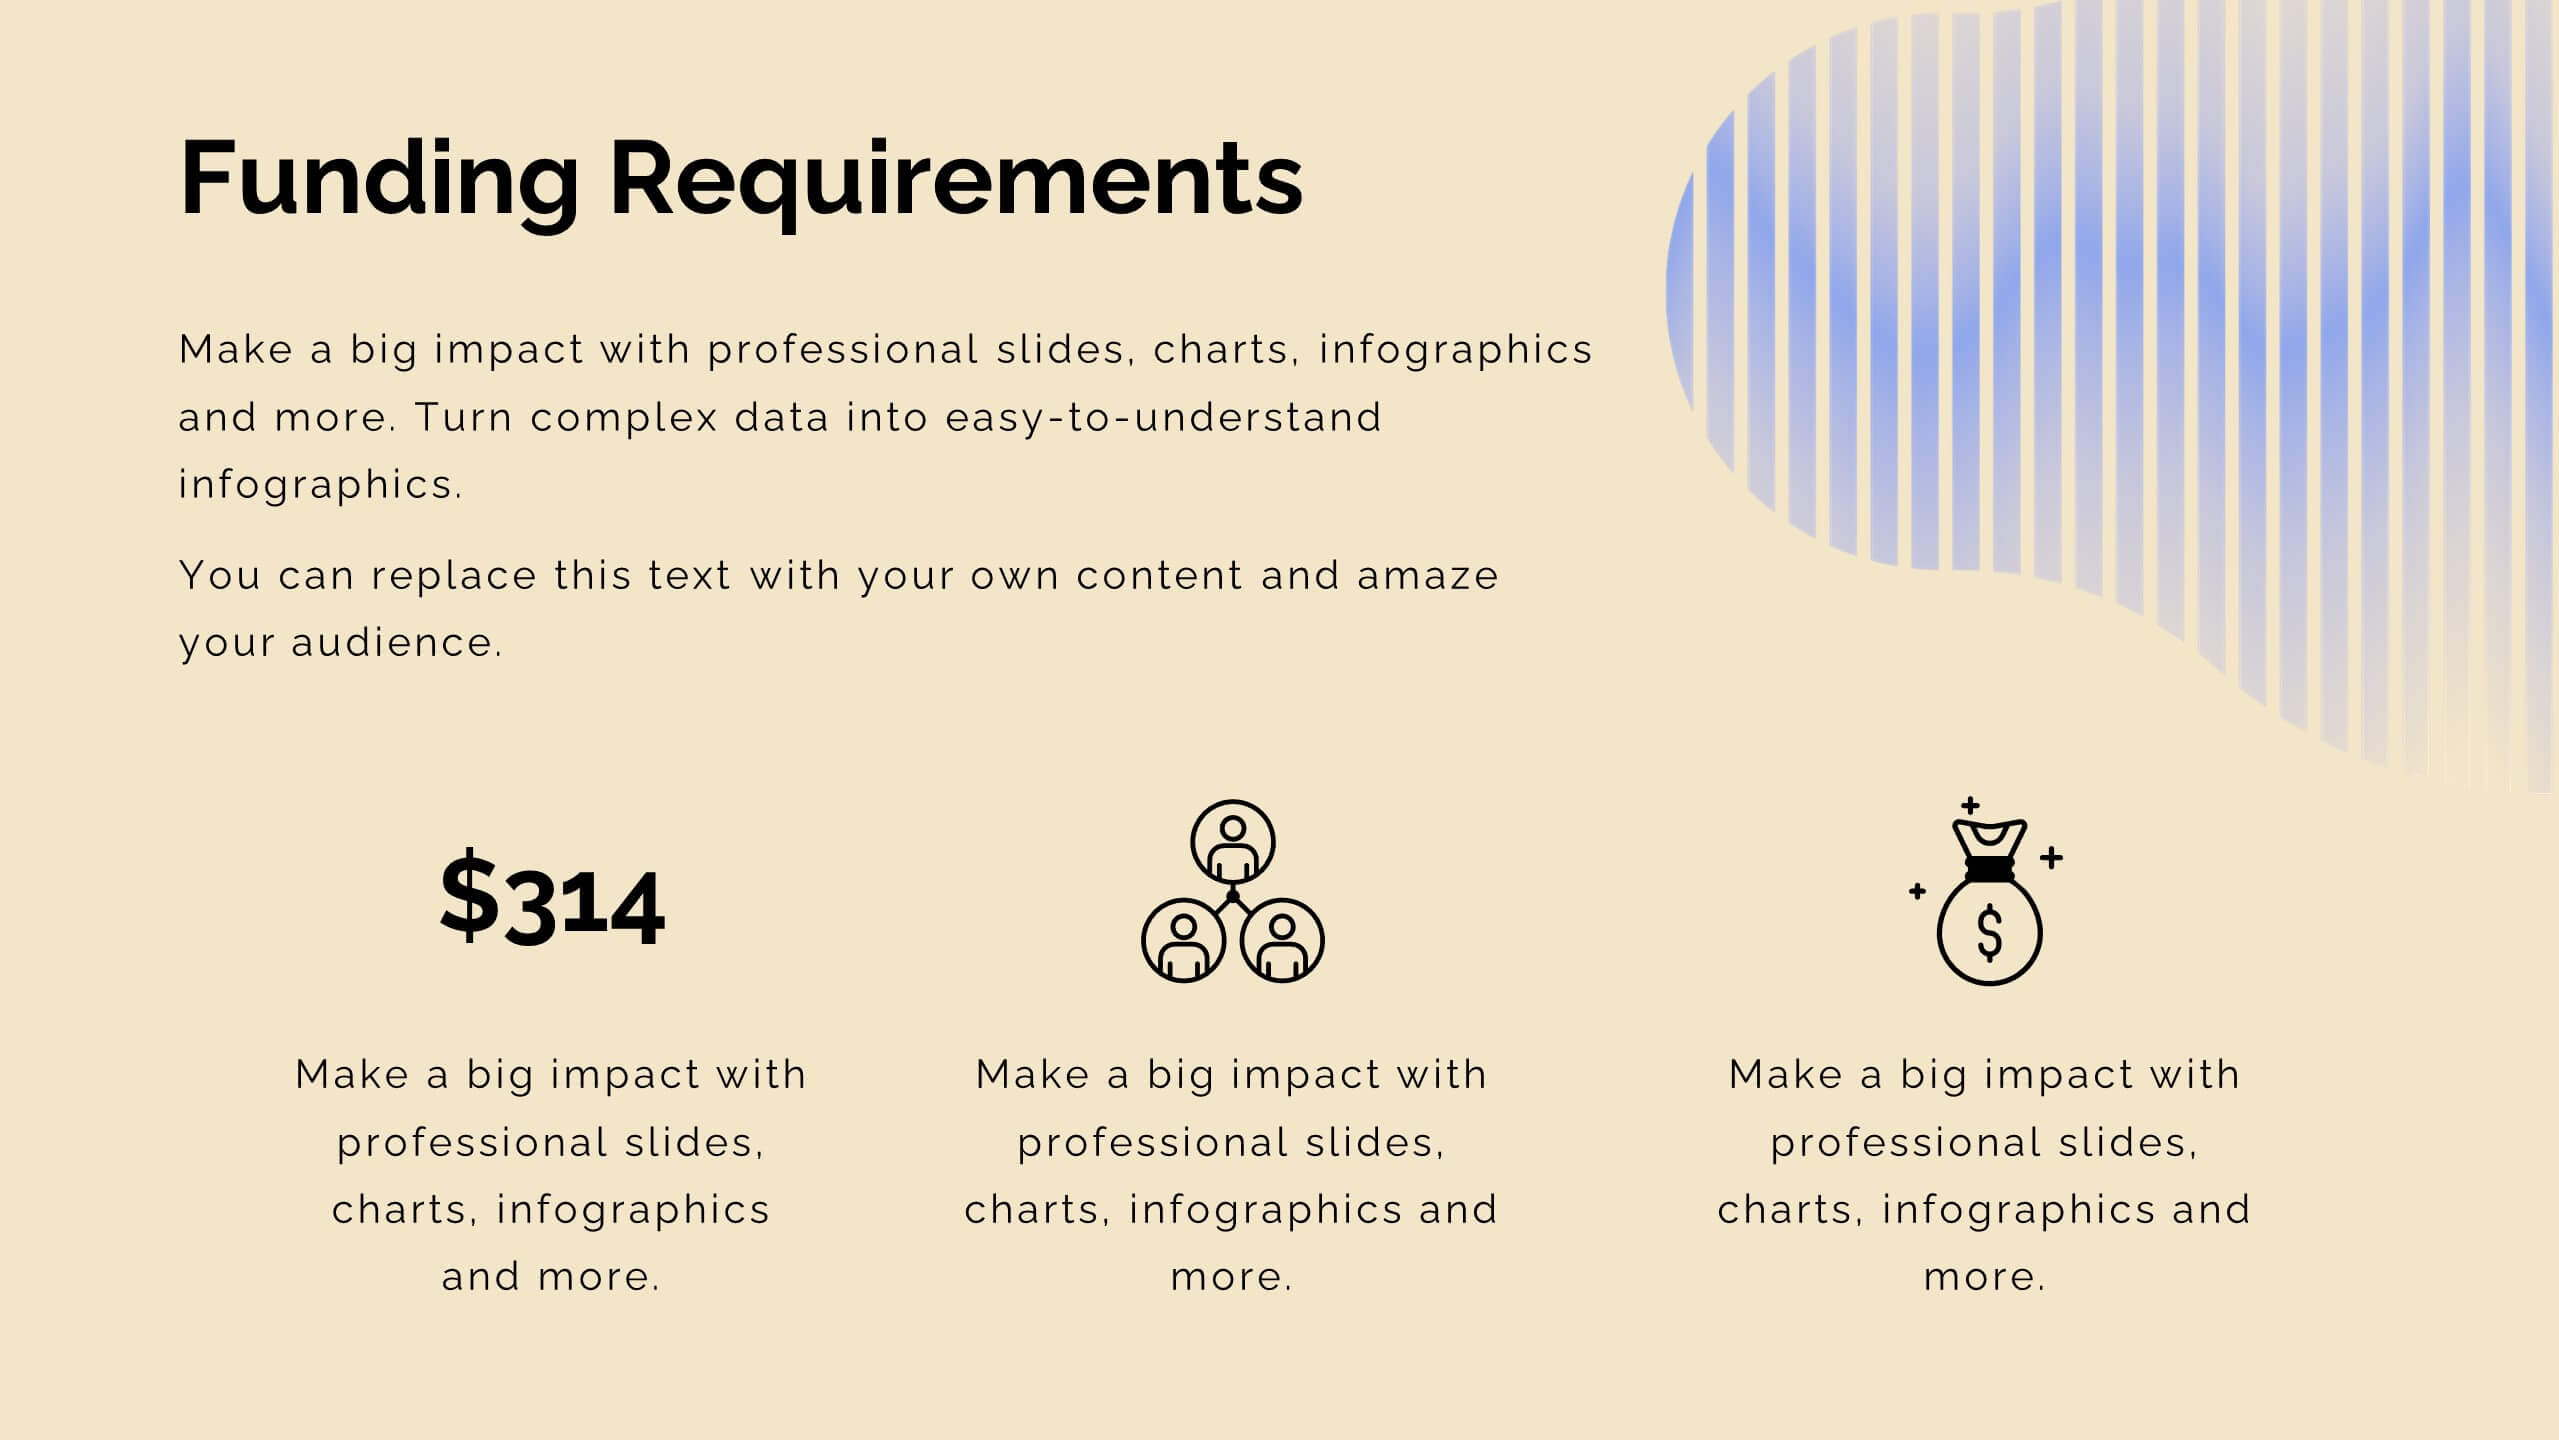
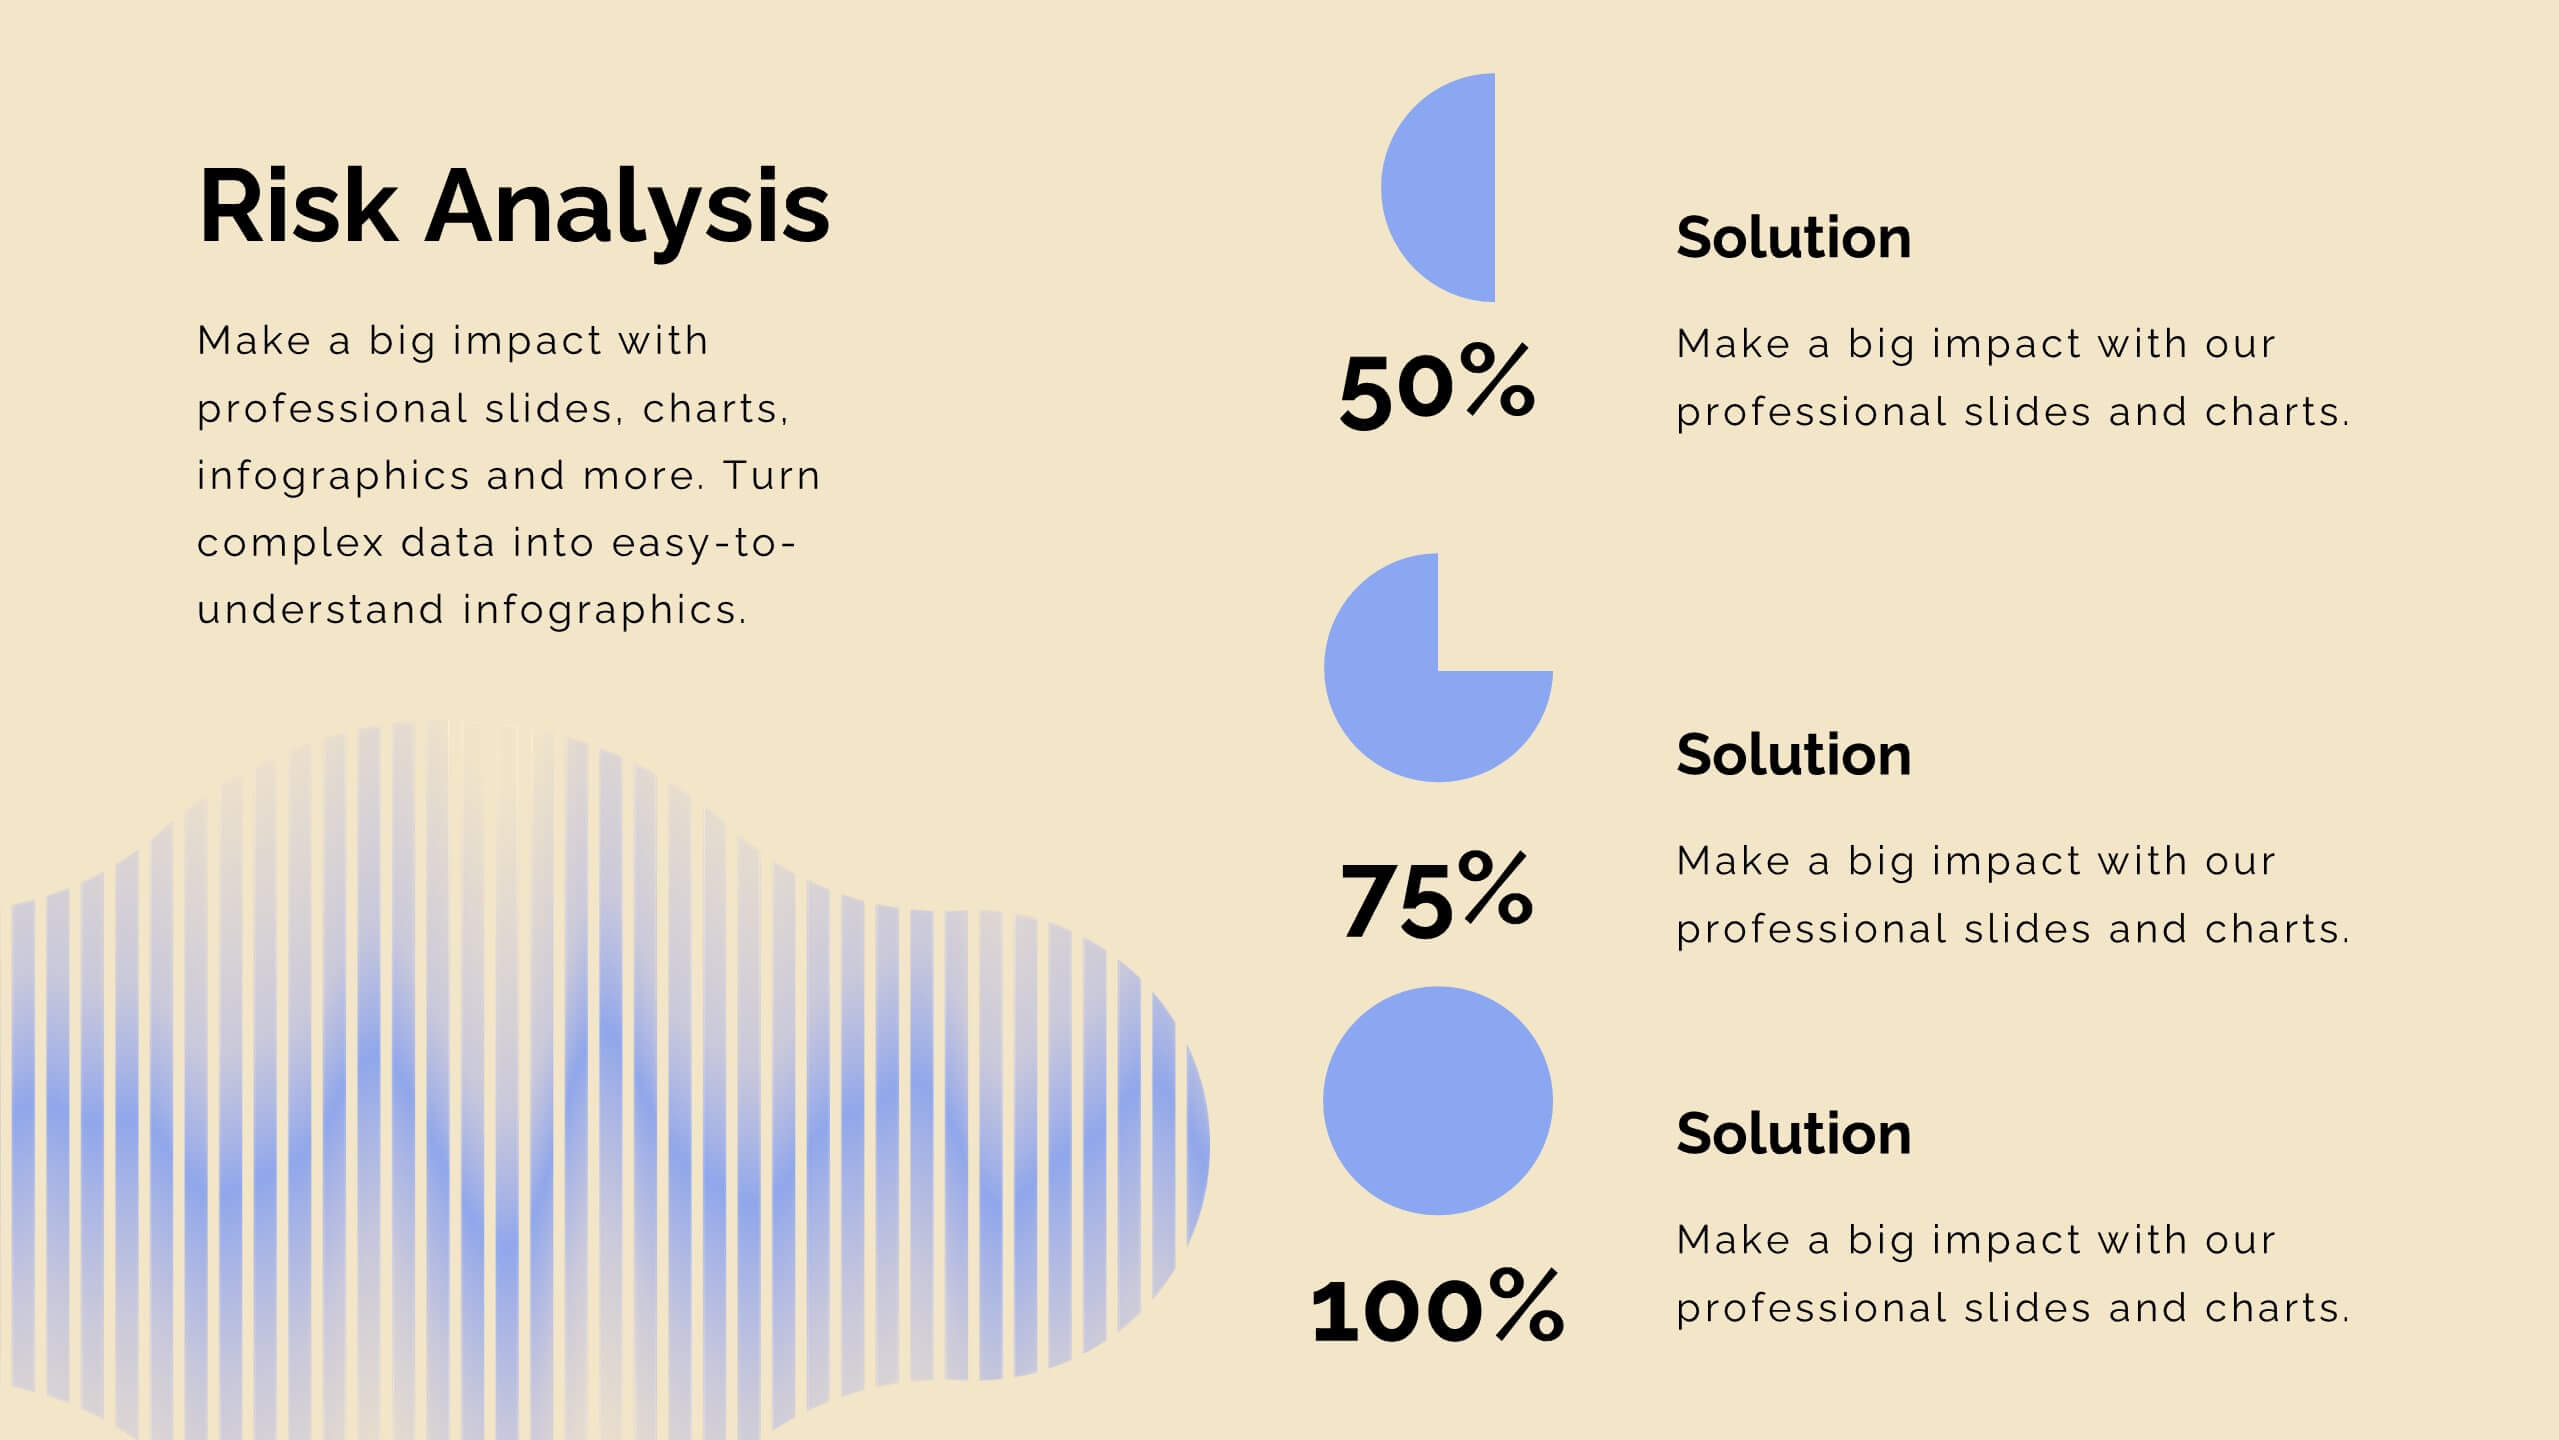
Investment and Risk Business Case Presentation
Assess investment risks with confidence using this dynamic business case template. Designed for clear visualization, it categorizes risk levels from high to low, helping professionals analyze financial decisions effectively. Perfect for finance, business strategy, and market evaluation, this template is fully compatible with PowerPoint, Keynote, and Google Slides.


5 diapositivas
Business Pillars for Success Presentation
Present your organization's core values or strategic foundations with this column-style infographic. Each pillar represents a distinct success factor, ideal for visualizing business frameworks, goals, or leadership principles. Fully editable in PowerPoint, Keynote, or Google Slides to match your brand and message.


22 diapositivas
Calcifis Qualitative Research Findings Presentation
Present your research insights with clarity and impact using this modern and engaging presentation template. Cover key areas such as research objectives, methodology, data analysis, key findings, limitations, and recommendations. The visually appealing design helps you communicate complex qualitative data effectively, making it ideal for academic, business, and market research presentations. Fully customizable and compatible with PowerPoint, Keynote, and Google Slides.


6 diapositivas
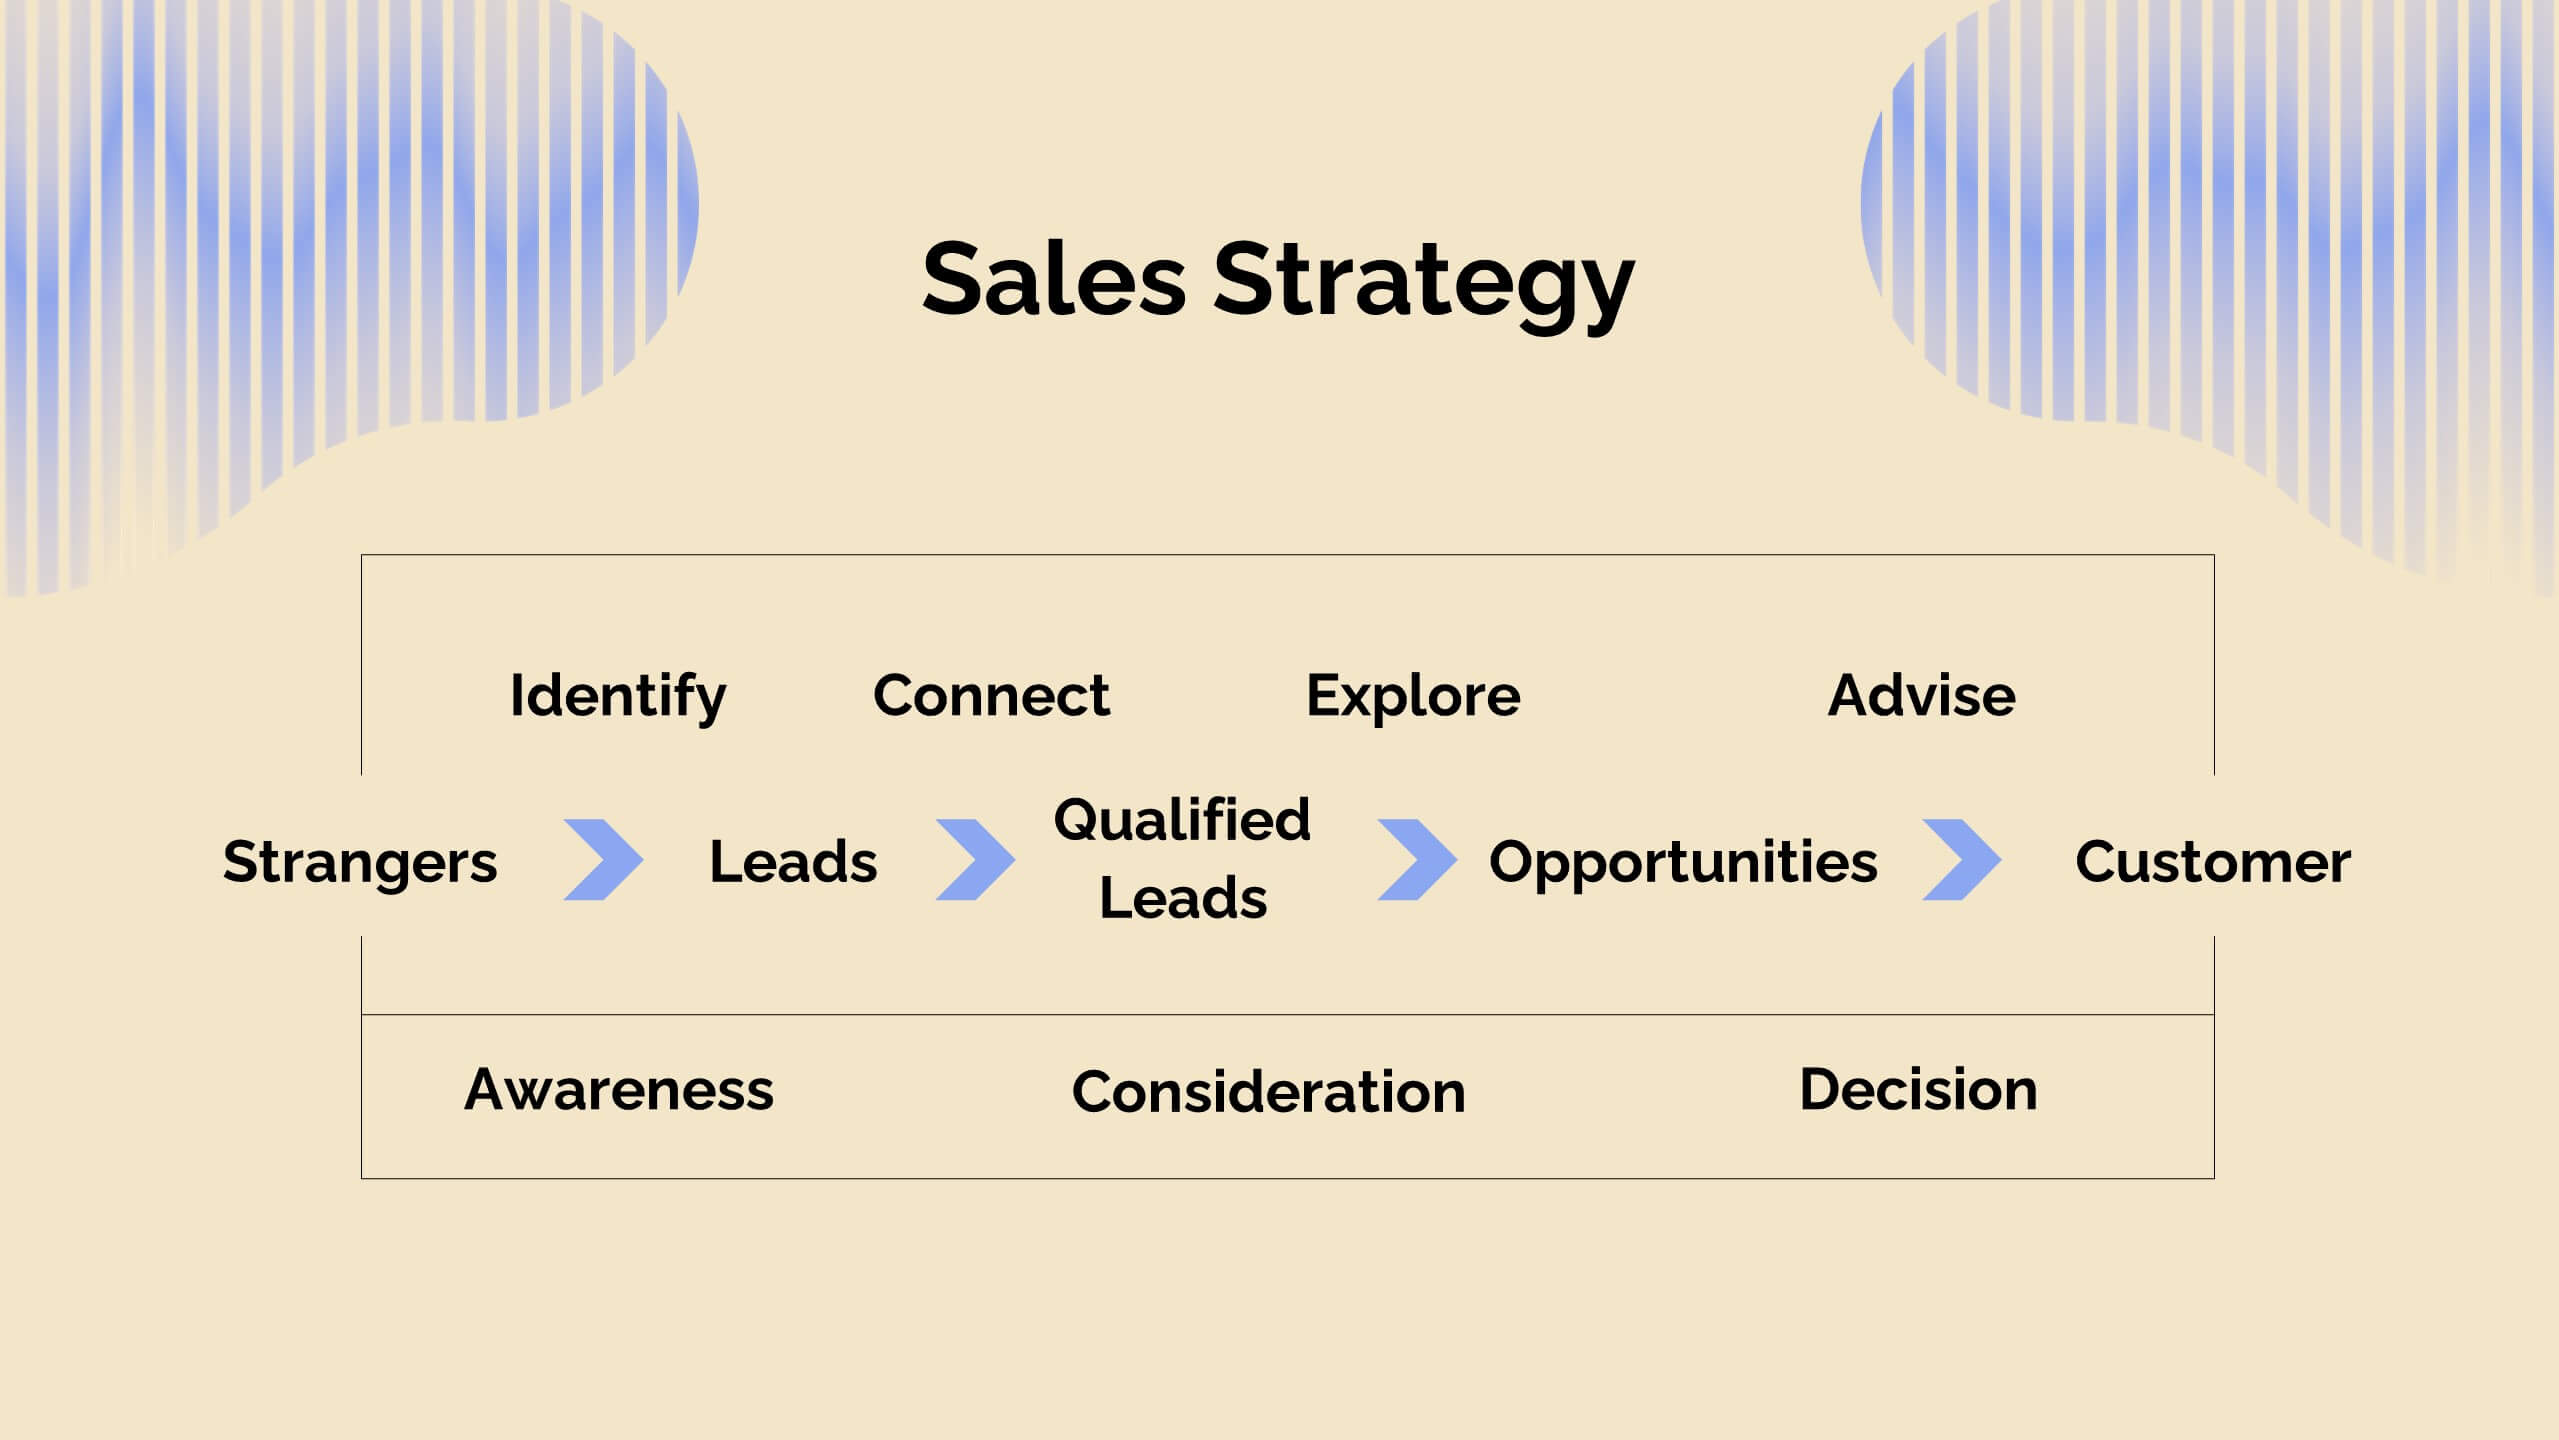
Funnel Stages Infographic
In marketing and sales, the term "funnel stages" refers to the different stages or steps that a potential customer goes through in their journey from initial awareness of a product or service to making a purchase decision. These infographics visualize and help you understand the customer's progression through these stages. They aim to help businesses and professionals understand the customer journey and optimize their strategies for each stage of the funnel. Whether used in sales presentations, marketing workshops, or educational materials, this template helps businesses build successful sale funnels and maximize their revenue potential.


6 diapositivas
Customer Support Team Infographic
The set of slides presented is meticulously designed to encapsulate the essence of customer support team operations, highlighting various key aspects such as teamwork, communication channels, customer interaction points, and support strategies. Each slide utilizes a clean and professional design, integrating soft color palettes and structured layouts to clearly convey complex information in an accessible way. These slides are particularly useful for customer support teams looking to present or revamp their strategy, showcasing how they handle customer queries and feedback across different platforms. The visual elements such as graphs, hierarchical diagrams, and process flows are strategically used to illustrate the team’s structure, response processes, and efficiency metrics, making it easier for stakeholders to grasp the effectiveness of customer support initiatives. Such a collection is indispensable for training new team members, demonstrating the team's impact on customer satisfaction, and internal reviews to improve service delivery. By using these slides, teams can ensure a consistent understanding of goals, roles, and procedures, which is crucial for maintaining high standards of customer service and team alignment.


24 diapositivas
Minerva UX Design Presentation
Elevate your UX design presentations with this comprehensive template, featuring sections for project overview, user research, wireframes, prototyping, and usability testing. Showcase design systems, branding guidelines, and accessibility considerations with ease. Perfect for demonstrating a user-centered approach. Compatible with PowerPoint, Keynote, and Google Slides for seamless customization.


6 diapositivas
Machine Learning Systems Overview
Get ready to light up your next tech talk with a bold, clean layout that simplifies even the most complex systems. This infographic presentation template is designed to break down how intelligent algorithms function, analyze data, and learn patterns—perfect for explaining how machine learning fits into real-world applications. Each slide uses smart visuals and icons to guide viewers through each system stage with clarity. Ideal for educators, developers, or startups pitching AI-powered solutions, it’s a creative and professional way to keep your audience engaged. Fully compatible with PowerPoint, Keynote, and Google Slides.


5 diapositivas
Marketing Sales Funnel Presentation
Watch your customer journey come to life with a clean, visual flow that makes each stage easy to understand at a glance. This presentation breaks down your funnel into clear steps, helping you explain conversions, behaviors, and strategy with confidence. Fully compatible with PowerPoint, Keynote, and Google Slides.


26 diapositivas
Construction Engineering Dark Presentation
Elevate your project narratives with our construction engineering dark presentation template, tailored specifically for industry professionals who desire clarity and precision. This template, steeped in dark shades complemented by stark orange and green accents, offers a sophisticated canvas for your plans. It's an essential asset for construction engineers and contractors seeking to outline project scopes, or innovative engineering solutions. Compatible with Powerpoint, Keynote, and Google Slides. Included are purposeful graphics and technical icons, all arranged to underscore your presentation's professionalism and comprehensive nature.


5 diapositivas
Business Performance Dashboard Presentation
Bring your data to life with a crisp, unified view of metrics that matter. This presentation helps you track performance, compare results, and visualize progress through charts and KPIs that keep teams aligned. Clean, modern, and easy to adapt. Fully compatible with PowerPoint, Keynote, and Google Slides.


5 diapositivas
Creative Watercolor Style Presentation
Splash your ideas onto the page with a layout that blends artistic watercolor accents and clean, modern structure. This presentation helps you showcase insights, steps, or concepts in a visually soothing format that feels both creative and professional. Ideal for storytelling or branding discussions. Fully compatible with PowerPoint, Keynote, and Google Slides.


6 diapositivas
International Breast Cancer Day Infographics
Celebrate International Breast Cancer Day with our customizable infographic template, designed to raise awareness and share vital information about breast cancer. This template is fully compatible with popular presentation software such as PowerPoint, Keynote, and Google Slides, allowing you to easily personalize it to convey your unique message. The International Breast Cancer Day infographic template serves as a versatile canvas for displaying facts, statistics, prevention methods, and support resources related to breast cancer. Whether you're a healthcare professional, advocate, or someone passionate about promoting breast health, this template offers a user-friendly platform to create informative presentations and awareness materials. Make an impact with this SEO-optimized International Breast Cancer Day infographic template, meticulously crafted for clarity and ease of use. Customize it to share stories of survivors, highlight the importance of early detection, and spread the message of hope and support. Start creating your personalized infographic to contribute to the cause today!


6 diapositivas
Market Differentiation with Blue Ocean Strategy
Position your brand uniquely with this Market Differentiation slide based on Blue Ocean Strategy principles. Featuring a clean, strategic layout with a blend of visuals and text, this template is ideal for competitive analysis, innovation roadmaps, and strategic marketing plans. Fully customizable in PowerPoint, Keynote, and Google Slides.