


Características


¿Tienes alguna pregunta?
Recomendar


5 diapositivas
Eco-Friendly Practices Implementation Presentation
Brighten your message with a clean, circular design that maps out every green initiative step-by-step. This visual template illustrates key eco-conscious actions, helping you present sustainable practices with ease. Perfect for environmental reports, team strategies, or policy pitches. Fully compatible with PowerPoint, Keynote, and Google Slides for flexible editing.


5 diapositivas
Human Resources Department Infographics
The Human Resources (HR) department is an integral part of an organization, responsible for managing and developing the organization's human capital. These informative infographics aim to provide a comprehensive overview of the functions, roles, and importance of the HR department in managing the organization's workforce. Whether used in HR conferences, employee orientations, or internal communications, this template helps convey crucial information in a visually appealing manner, enhancing understanding for the HR department's role in managing and developing the organization's most valuable asset - its people.


7 diapositivas
Social Media Infographic Presentation Template
Social media is an important business tool due to the fact that it allows you to reach, nurture, and engage with customers no matter where they are located. Additionally, it allows you to target new audiences, create brand awareness, and grow your following. This template features a clean, fun design that is easy to read. With a variety of slides and infographics, it makes it simple to create. This template will inform you how social media can be a powerful tool. This template is a great way to keep your information organized and includes tips that can be added at the bottom of each section.


6 diapositivas
Project Stakeholder Mapping
Visualize stakeholder relationships with this dynamic swirl-style infographic. Designed to showcase six key entities—Society, Media, Customer, Shareholder, Manager, and Employee—this layout emphasizes the interconnected roles within project environments. Perfect for stakeholder mapping, project planning, or communication strategies. Editable in PowerPoint, Keynote, and Google Slides.


7 diapositivas
Design Team Infographic
The displayed slides are specifically tailored for design teams, reflecting a strong focus on visual elements that convey creative processes and team structures. Each slide is crafted to enhance the presentation of design projects, illustrating workflows, team roles, and project milestones with a visually appealing approach. The collection utilizes a vibrant color palette and dynamic shapes to keep the viewer engaged, making these templates ideal for showcasing design projects, brainstorming sessions, and team capabilities in a clear and aesthetically pleasing manner. The templates feature various layouts including organizational charts, process diagrams, and brainstorming tools that facilitate effective communication of design concepts and strategies. They are designed to be versatile, supporting a wide range of design projects from graphic and digital design to UI/UX prototypes. This set serves as an essential tool for design teams to demonstrate their methods, track project progress, and showcase their creative solutions to clients or stakeholders, ensuring that every aspect of the design process is both understood and visually compelling.


6 diapositivas
Technology Trends Overview Presentation
Step into the future with a sleek visual that maps out emerging ideas in a way anyone can follow. This presentation helps you break down key innovations, highlight major shifts, and explain how new technologies influence your strategy. Ideal for reports and trend discussions. Fully compatible with PowerPoint, Keynote, and Google Slides.


6 diapositivas
Monthly Agenda and Events Presentation
The "Monthly Agenda and Events" presentation template features a calendar format, segmented by months, for detailed planning and tracking of events. Each month is color-coded for easy reference and contains placeholders for listing specific tasks or events. This template is perfect for individuals and teams who need to organize and visualize monthly activities, providing a clear overview of upcoming commitments and timelines, ensuring that all events and tasks are completed efficiently throughout the year.


26 diapositivas
Green Business Initiatives Presentation
Lead the charge in sustainability with our Green Business Initiatives presentation template. This eco-friendly template, fully compatible with PowerPoint, Keynote, and Google Slides, is designed for forward-thinking professionals committed to environmental stewardship. Showcase your company's dedication to sustainability with slides that highlight green policies, sustainable practices, and the long-term benefits of eco-conscious operations. The template's customizable elements allow you to present your environmental initiatives with clarity and impact, ensuring your message resonates with your audience. Whether you're a green startup or an established corporation, our template is SEO-optimized to help you spread the word about your commitment to the planet. Engage stakeholders and encourage industry-wide change with a presentation that underscores the value of green business strategies.


6 diapositivas
Concentric Circles Strategy Infographics
Visualize your strategic approach with our Concentric Circles Strategy infographic template. This template is fully compatible with popular presentation software like PowerPoint, Keynote, and Google Slides, allowing you to easily customize it to illustrate and communicate your concentric circles strategy. The Concentric Circles Strategy infographic template offers a visually engaging platform to depict your strategy's core, intermediate, and peripheral elements. Whether you're a business leader, strategist, or planner, this template provides a user-friendly canvas to create informative presentations and effectively communicate your strategic vision. Enhance your strategic planning with this SEO-optimized Concentric Circles Strategy infographic template, thoughtfully designed for clarity and ease of use. Customize it to highlight the key components of your concentric circles strategy, ensuring that your team and stakeholders grasp the strategic direction clearly. Start crafting your personalized infographic today to drive alignment and execution of your strategic goals.


7 diapositivas
Concept Development for Great Ideas Presentation
Bring your ideas to life with the Concept Development for Great Ideas Presentation. This visually engaging layout features a central lightbulb icon surrounded by six customizable segments—ideal for breaking down key phases of ideation, planning, or innovation strategy. Clean, color-coded elements help guide your audience through your thought process. Compatible with Canva, PowerPoint, Keynote, and Google Slides.


6 diapositivas
Business Logic Flow Chart
Streamline complex processes with the Business Logic Flow Chart Presentation. This modern, curved connector design helps you visually outline up to five sequential steps or logic paths, using colorful icons and editable text fields. Ideal for business workflows, strategic plans, or data flow maps. Fully compatible with PowerPoint, Keynote, and Google Slides.


6 diapositivas
Three-Point Framework Triangle Diagram Presentation
Break down complex strategies with the Three-Point Framework Triangle Diagram template. This visually structured design helps you present key business components in a clear, logical format, making it ideal for decision-making, planning, and analysis. Fully customizable and easy to use, it's compatible with PowerPoint, Keynote, and Google Slides for seamless integration.


6 diapositivas
Market Trends and Insights Year in Review Presentation
Analyze seasonal shifts with clarity using the Market Trends and Insights Year in Review Presentation. This quarterly layout lets you break down key trends, data, and highlights by month, helping stakeholders visualize market behavior throughout the year. Ideal for analysts, marketers, and strategy teams. Fully customizable and works seamlessly with PowerPoint, Keynote, and Google Slides.


7 diapositivas
Training Infographic Presentation Template
Training is the foundation of a successful business. It gives everyone a great understanding of their responsibilities and the knowledge and skills they need to do that job. Training is essential for your new employees. The purpose of this template is to promote effective communication and understanding on the importance of training. Training is an essential part of growing your company. This presentation will allow you to show how training is an opportunity to learn new skills and improve on existing ones. This template provides a fun and professional layout that your employees will love.


5 diapositivas
Project Planning and Rollout Timeline
Stay on track from kickoff to delivery with the Project Planning and Rollout Timeline Presentation. This curved roadmap layout visually guides your audience through five sequential stages—perfect for illustrating workflows, rollout phases, or go-to-market strategies. Easily customizable in PowerPoint, Keynote, and Google Slides to suit any project.


7 diapositivas
Drawing Anatomy Infographic
Dive into the captivating world of human anatomy with our drawing anatomy infographic. Crafted with vibrant hues of green, orange, red, and blue, this template brings to life the intricacies and artistry of the human form. Whether you're an aspiring artist, a seasoned illustrator, or an educator, this infographic is tailored to enhance your understanding or teaching of anatomical details. The fun, colorful design ensures engagement, making learning a visually pleasing experience. Seamlessly incorporate it into PowerPoint, Keynote, or Google Slides for versatile and effective presentations.


19 diapositivas
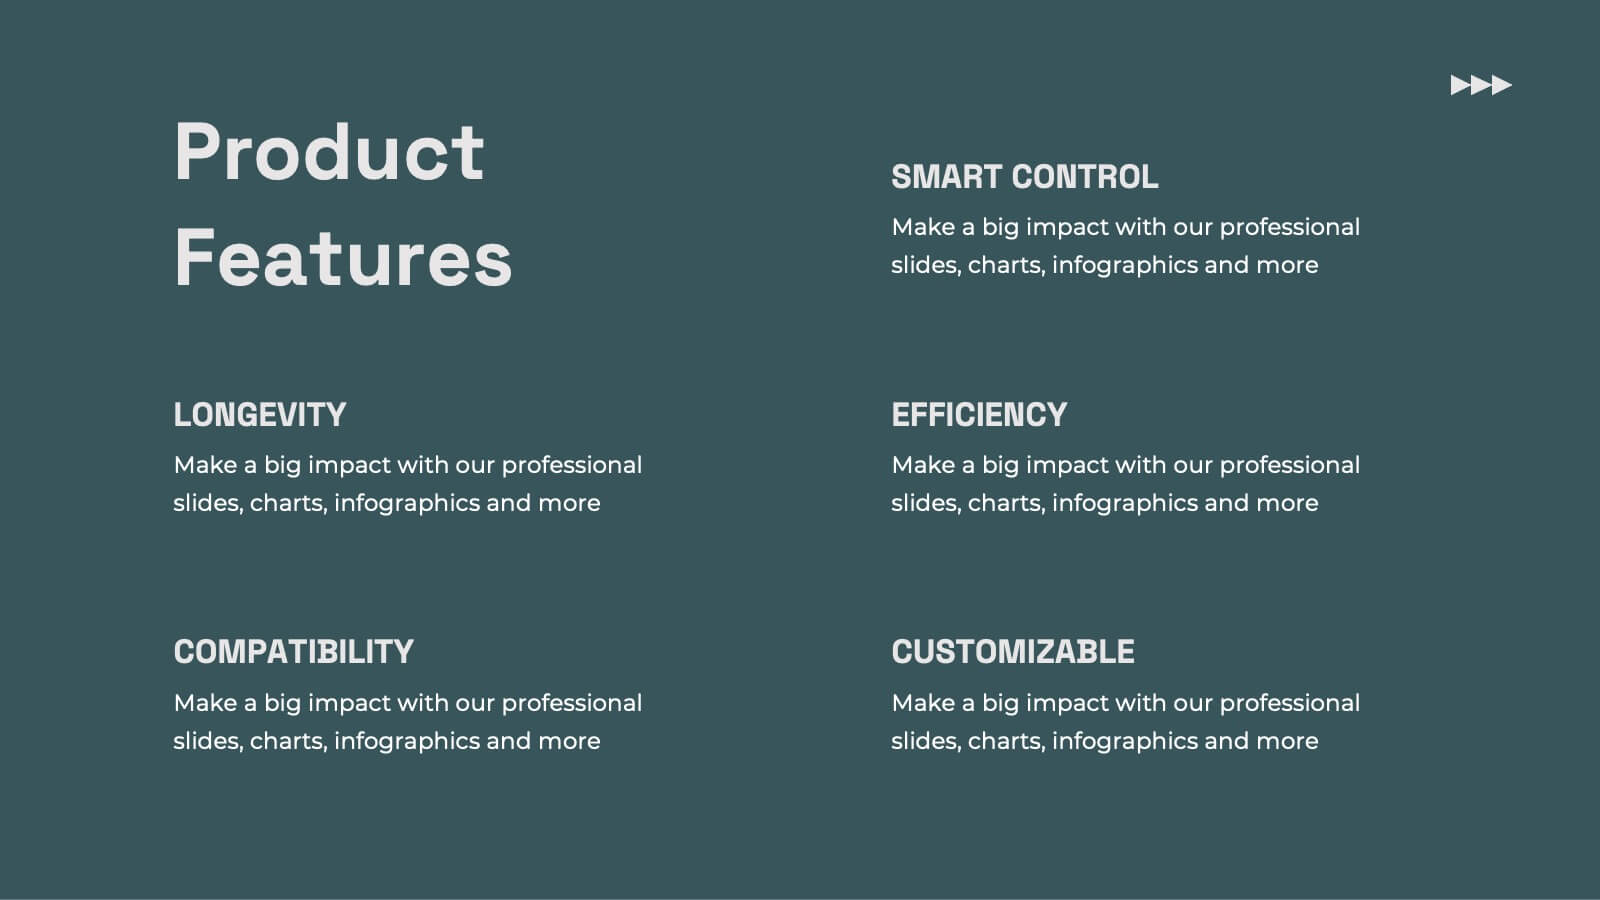
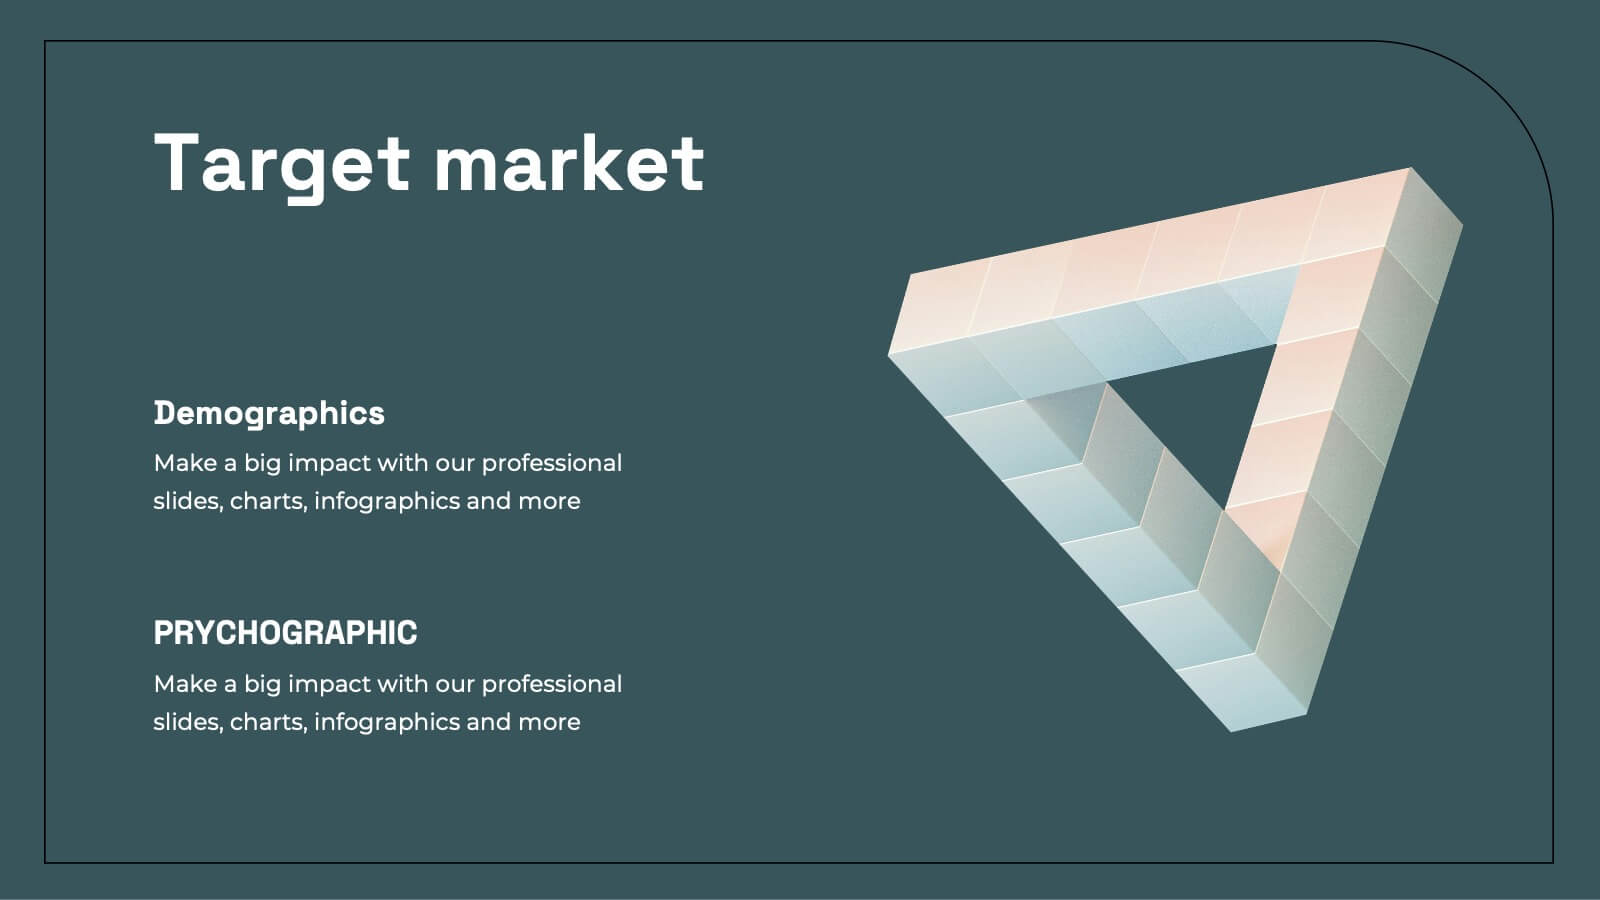
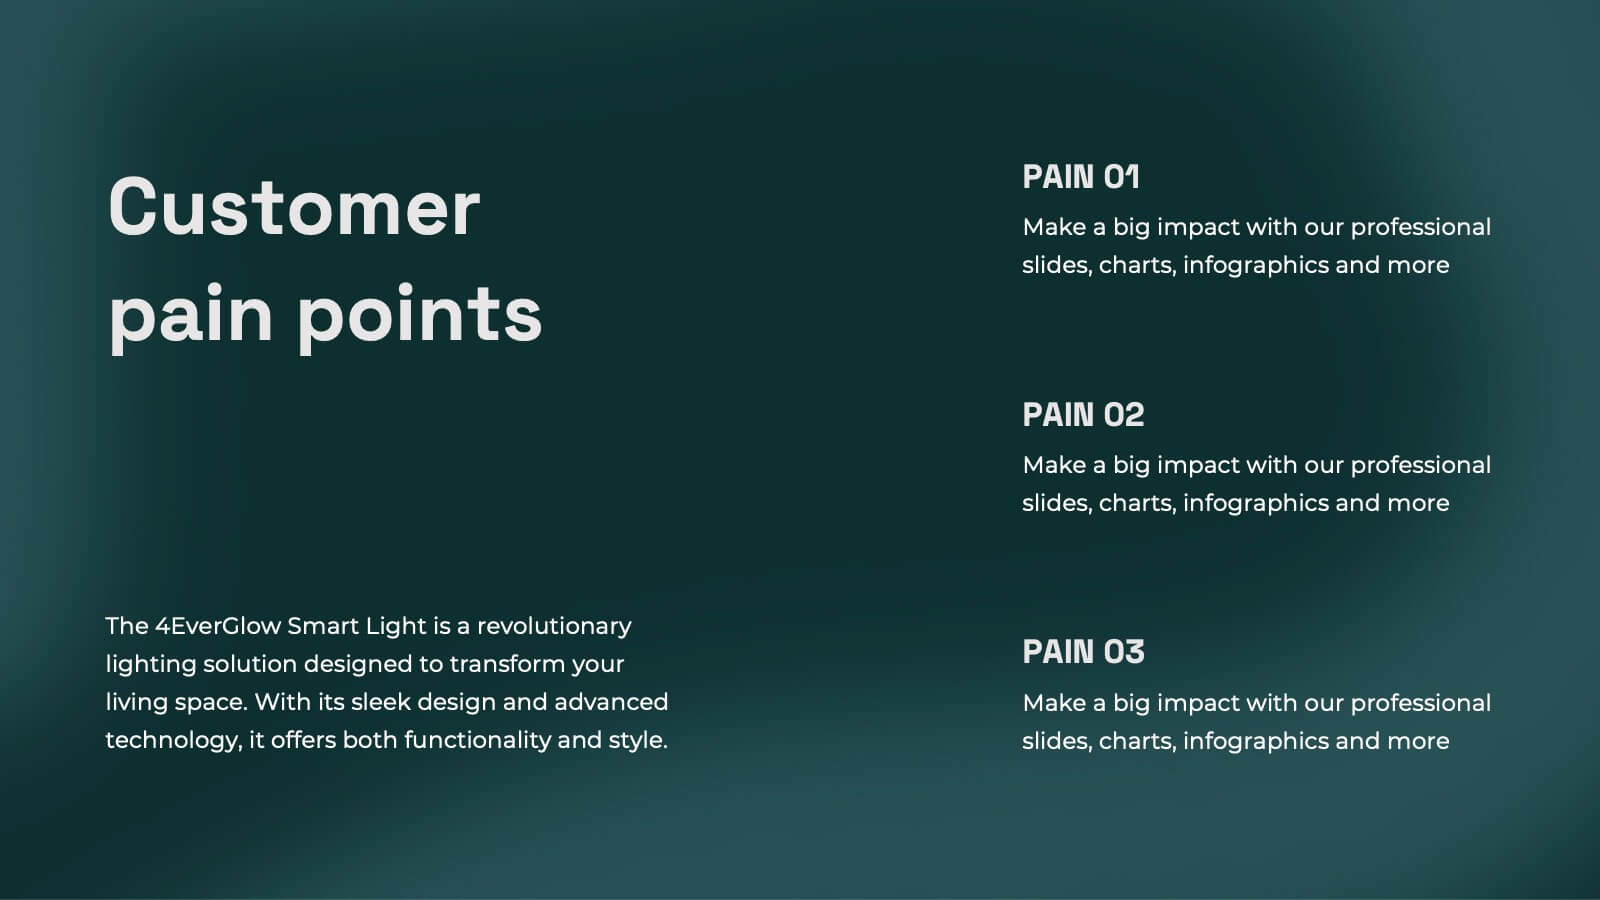
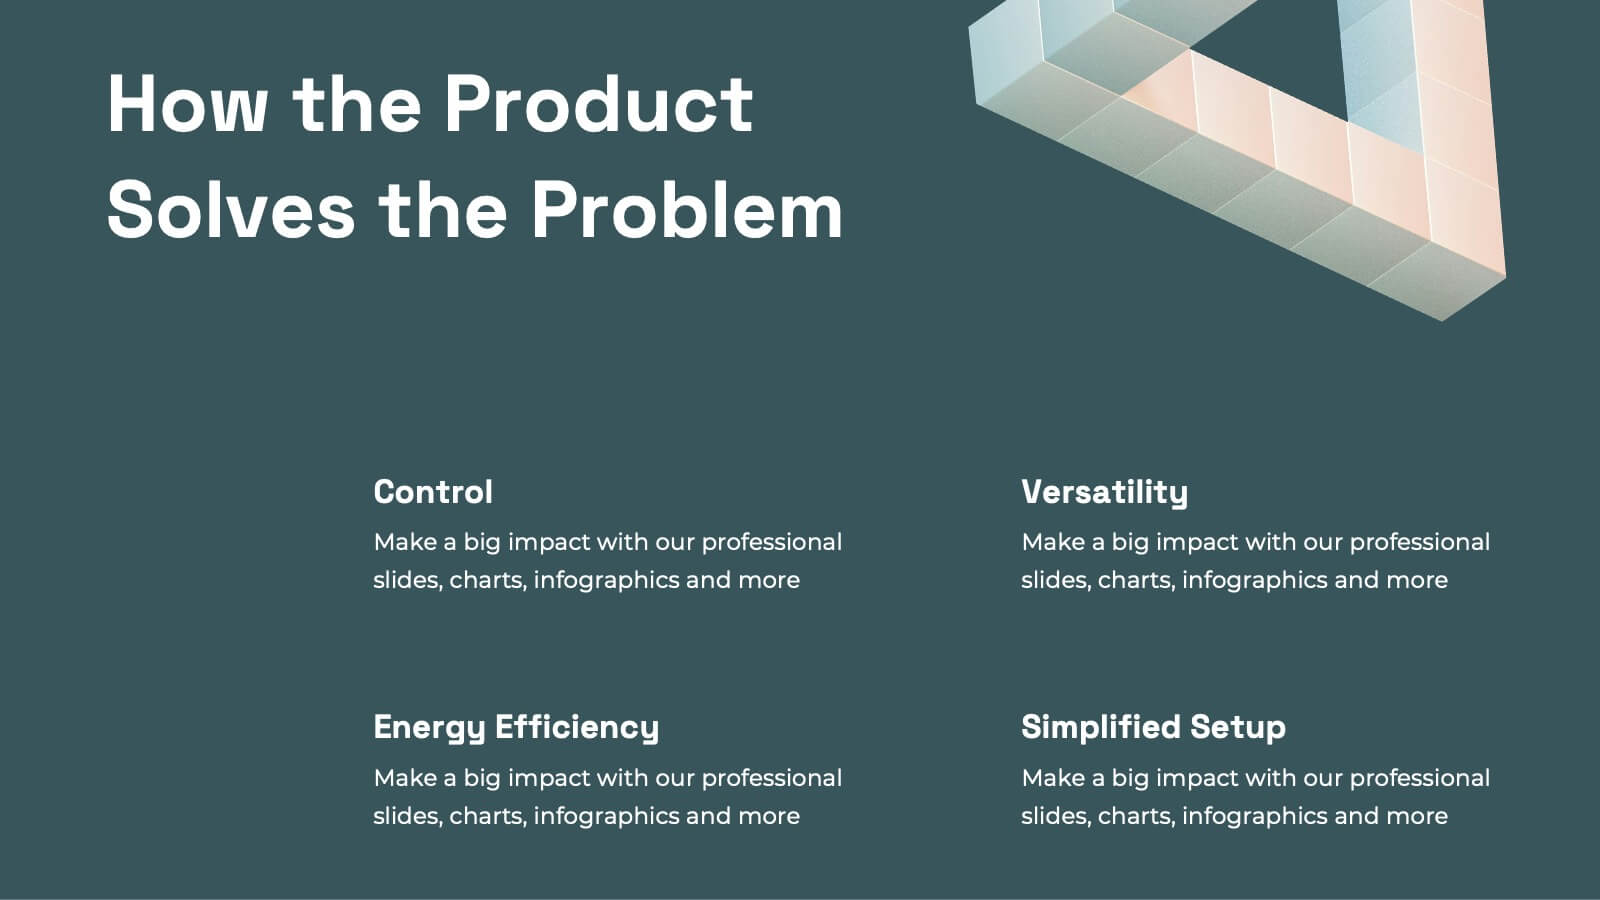
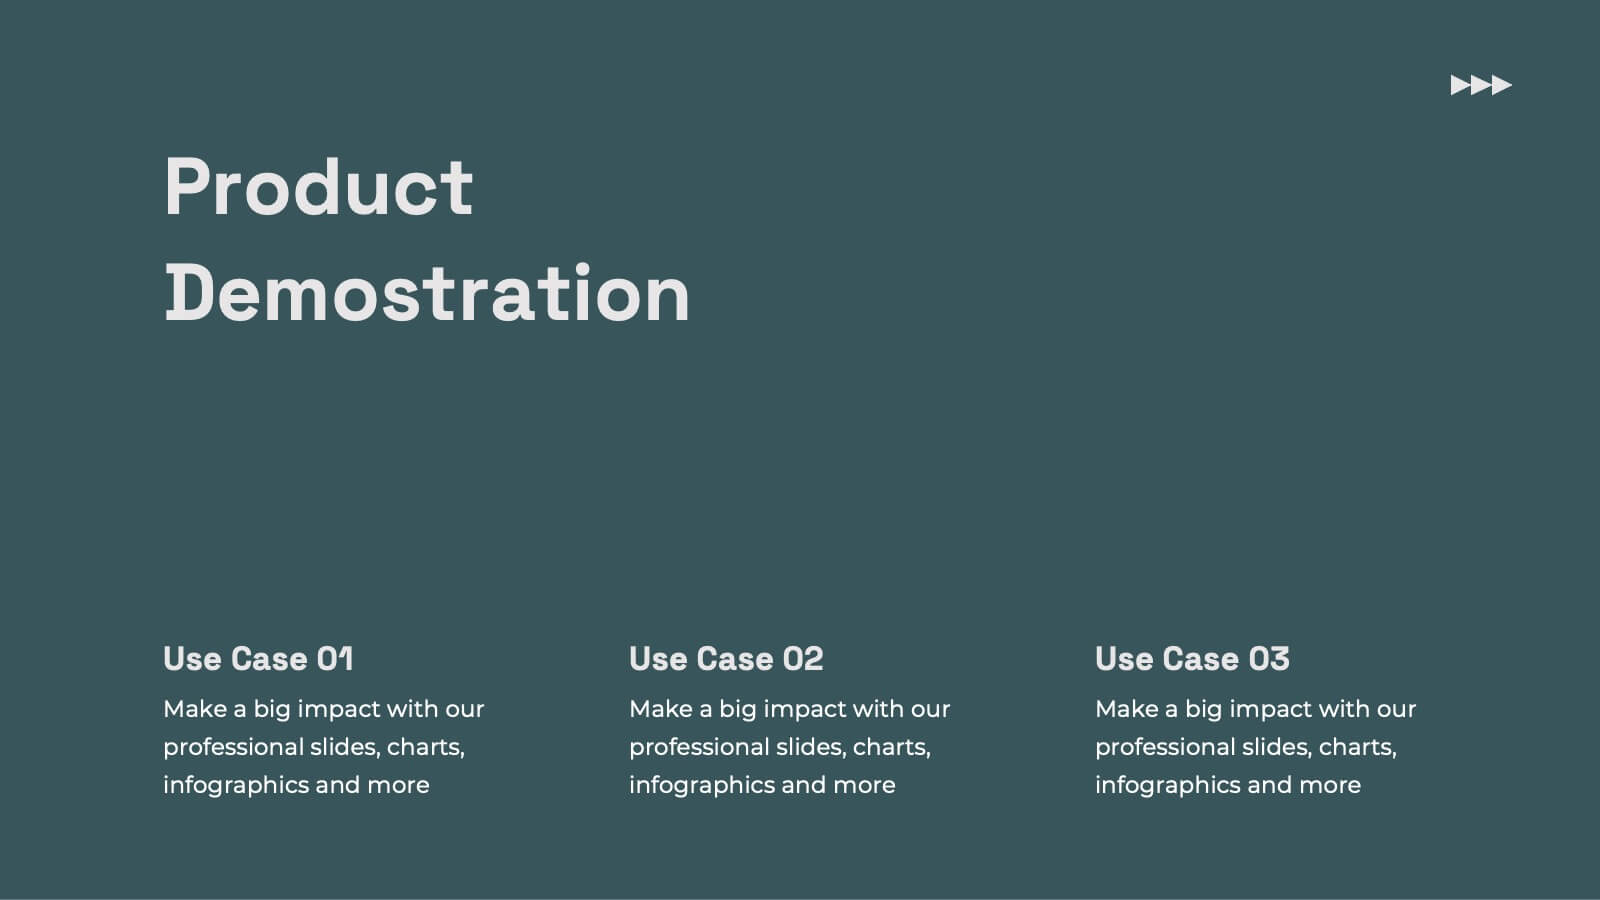
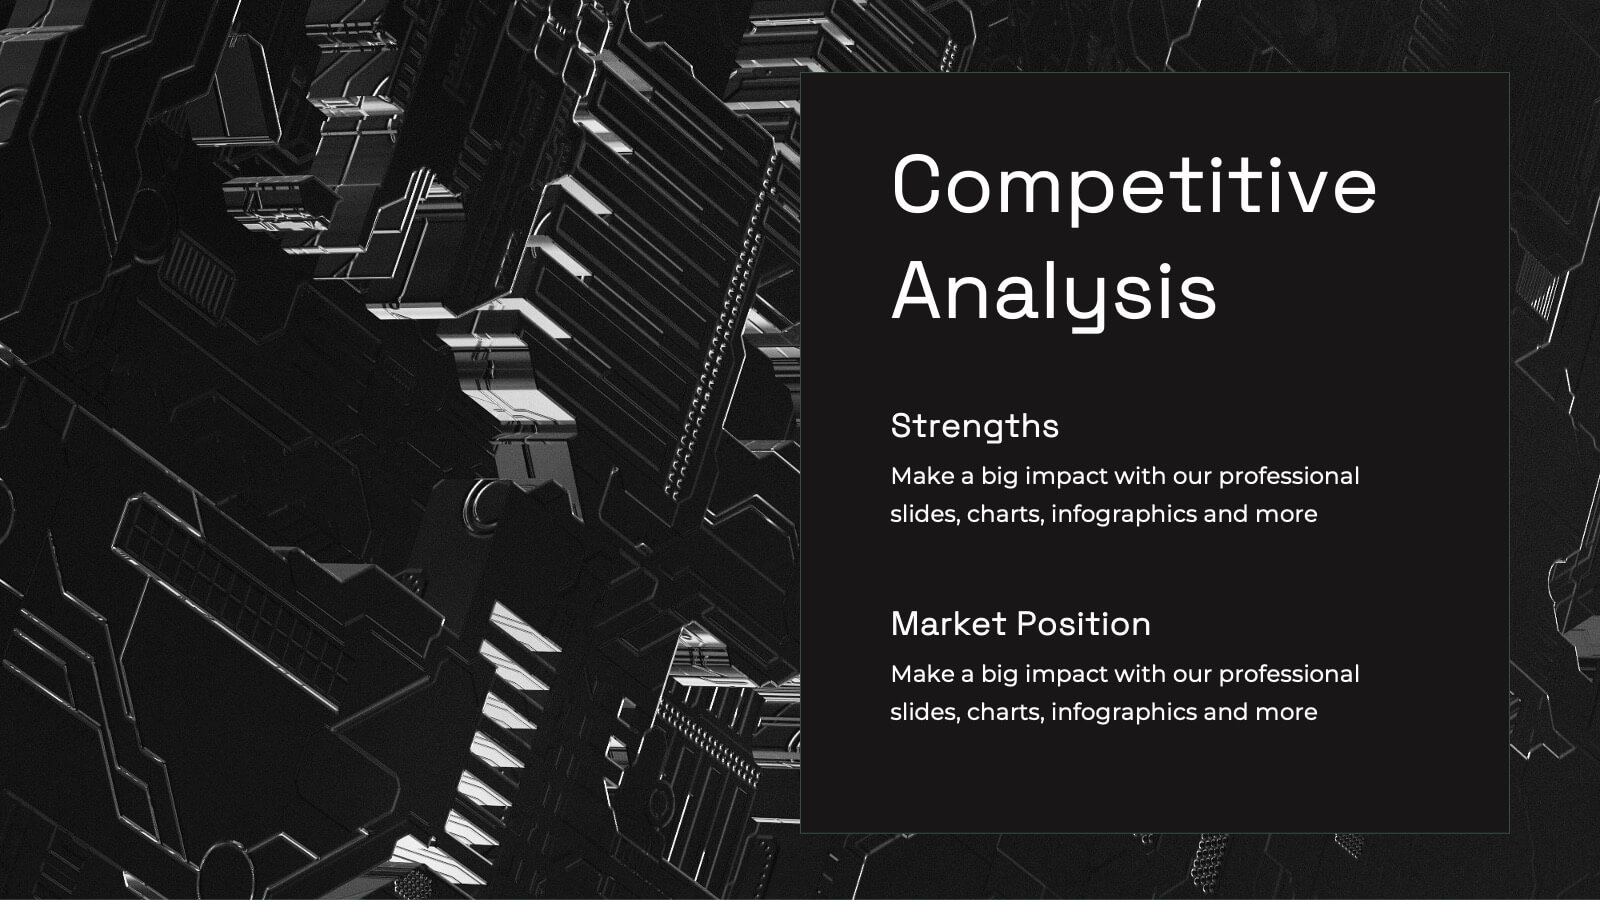
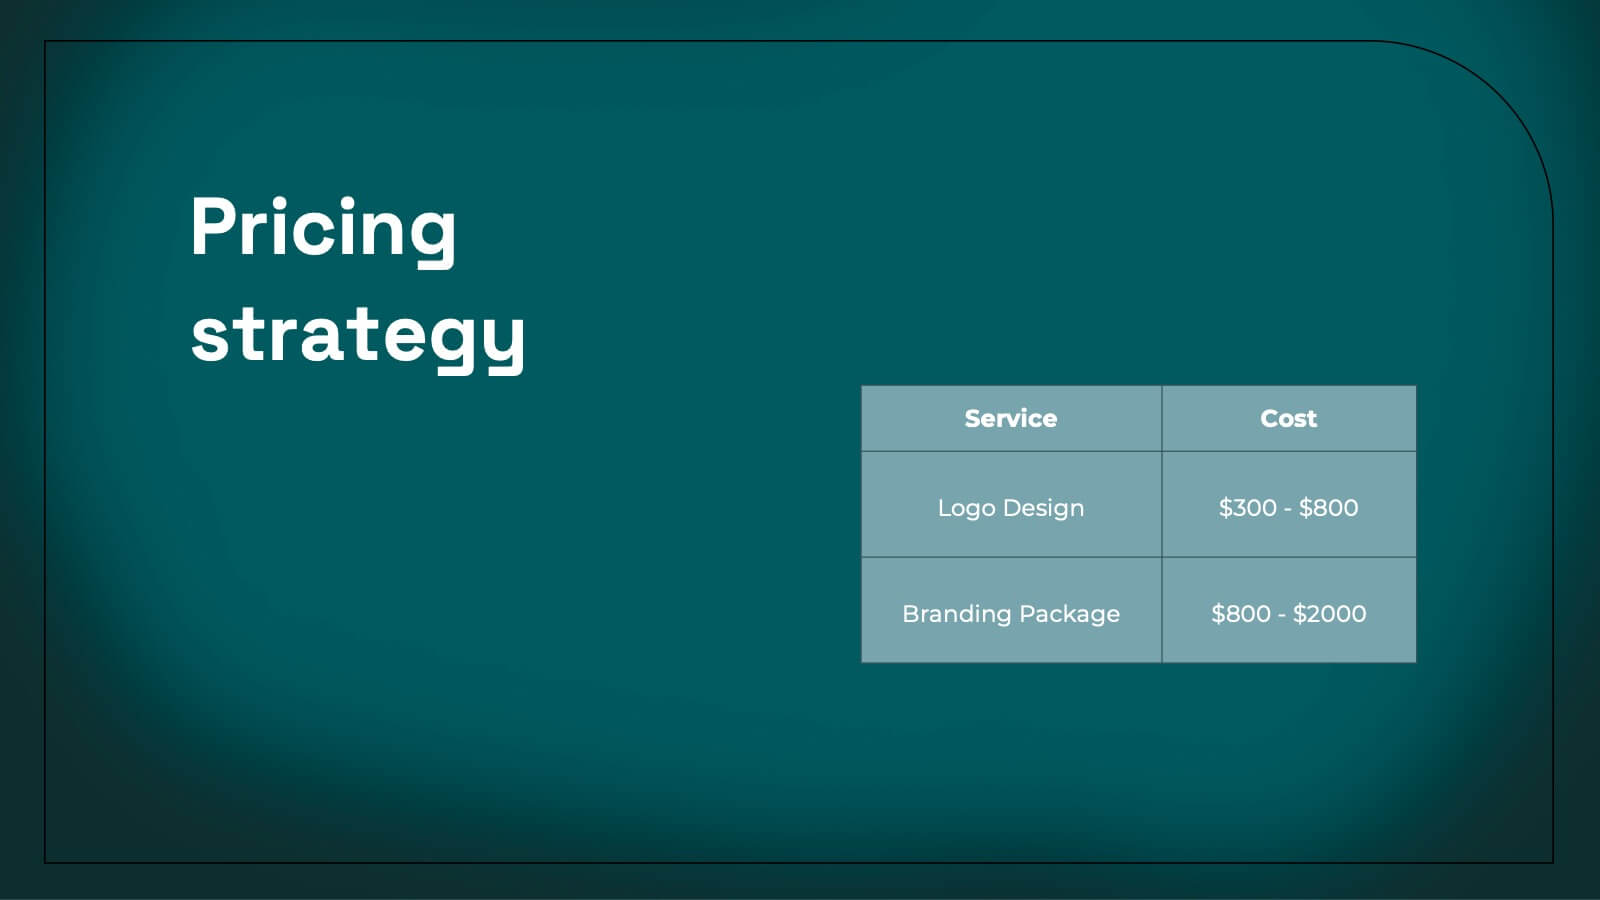
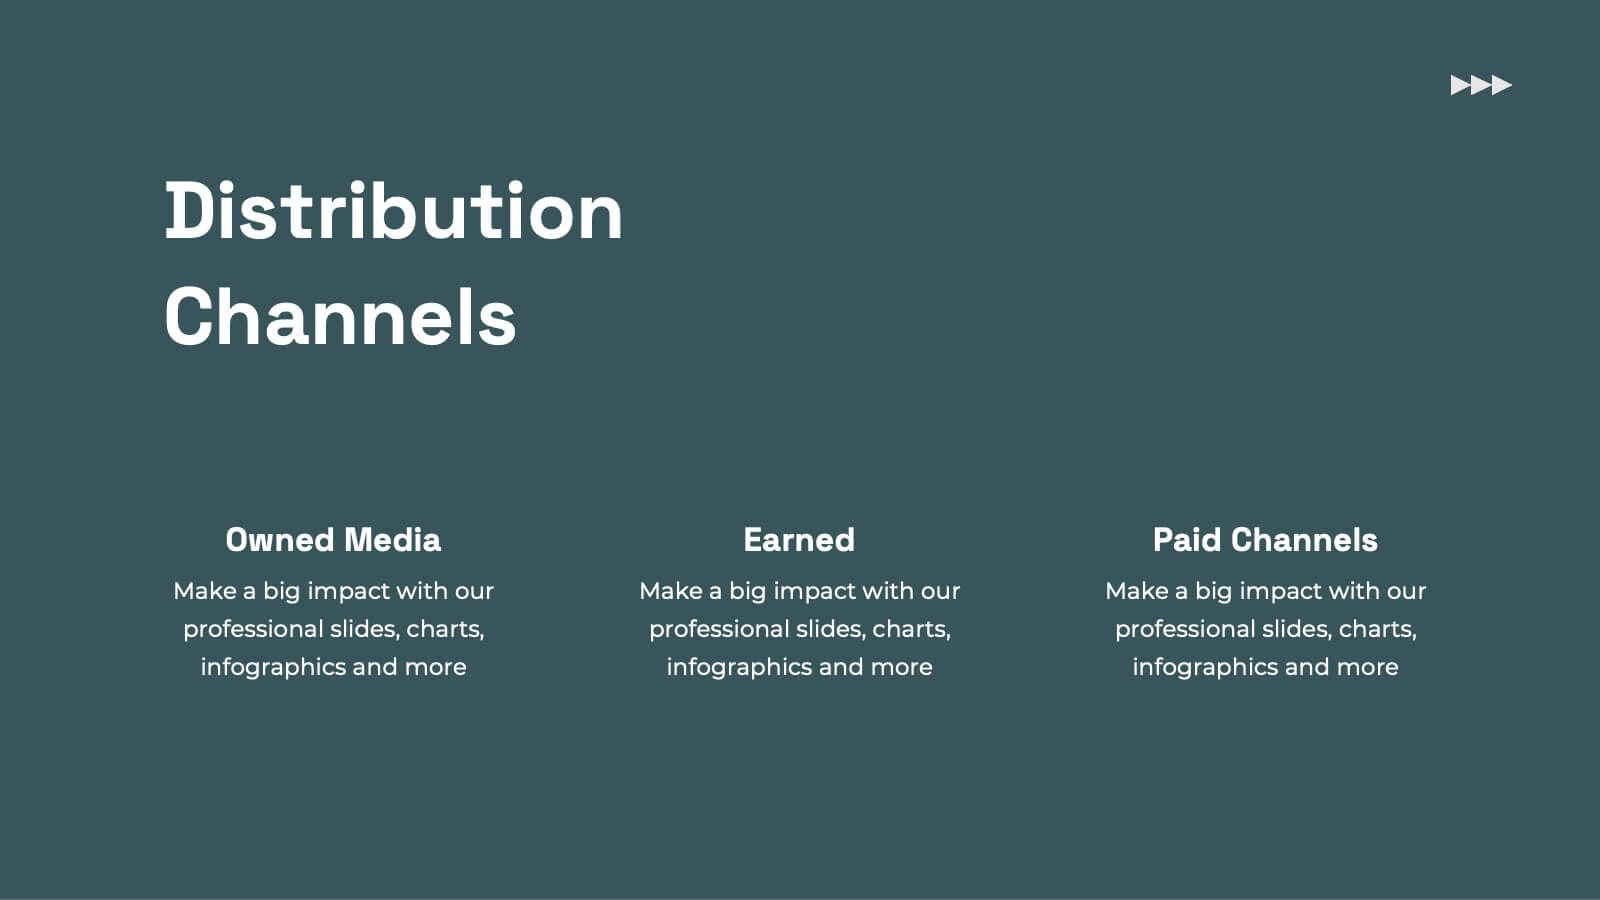
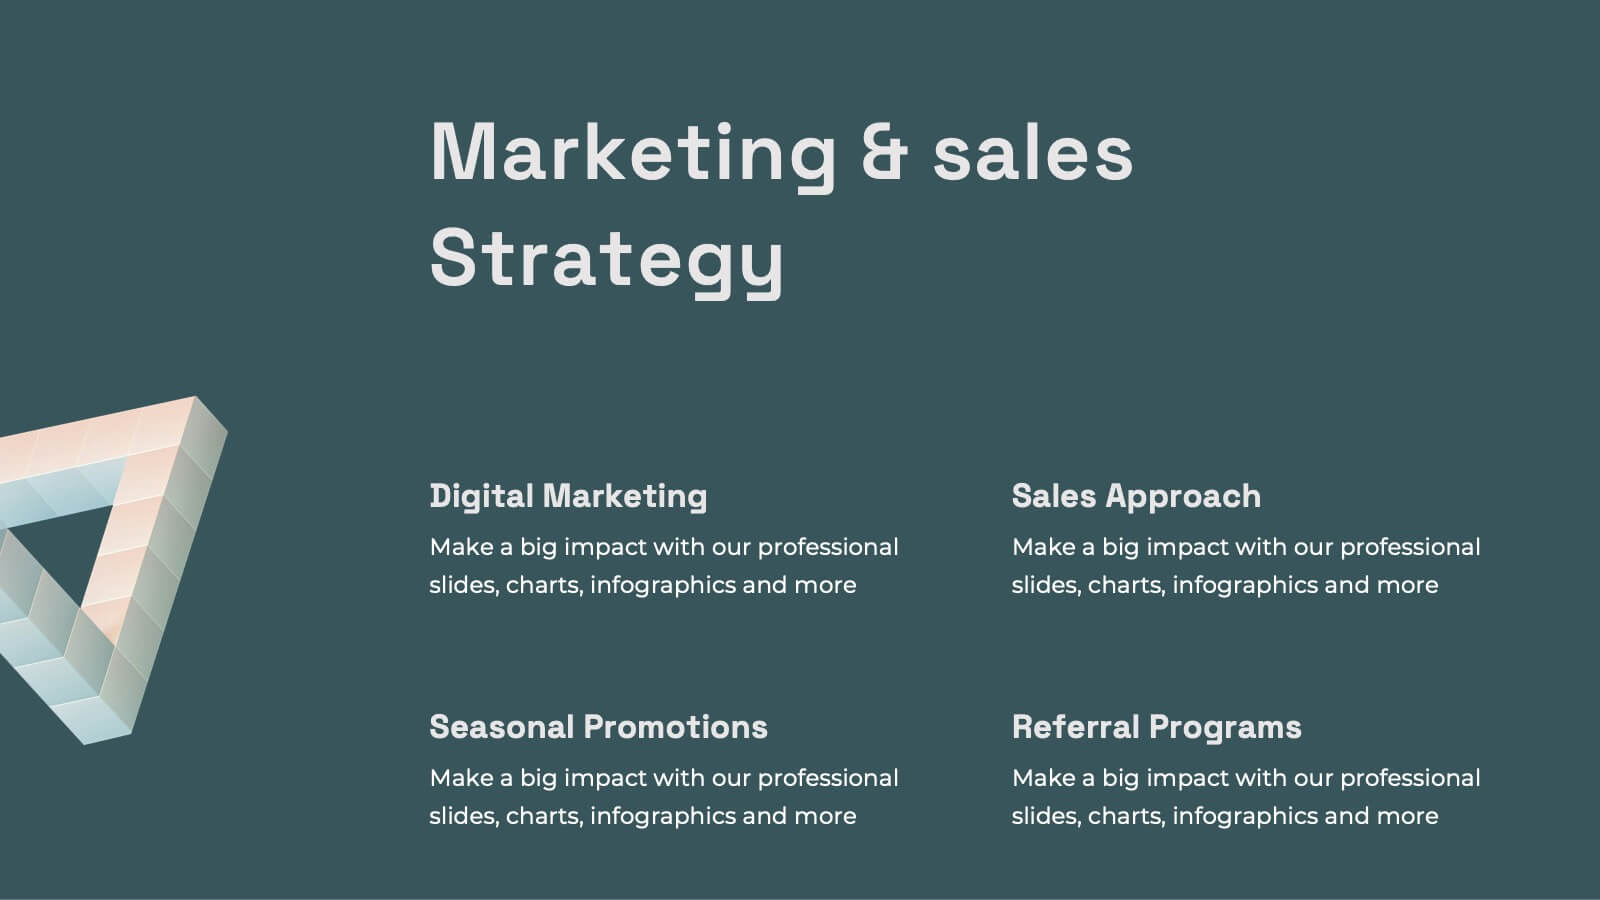
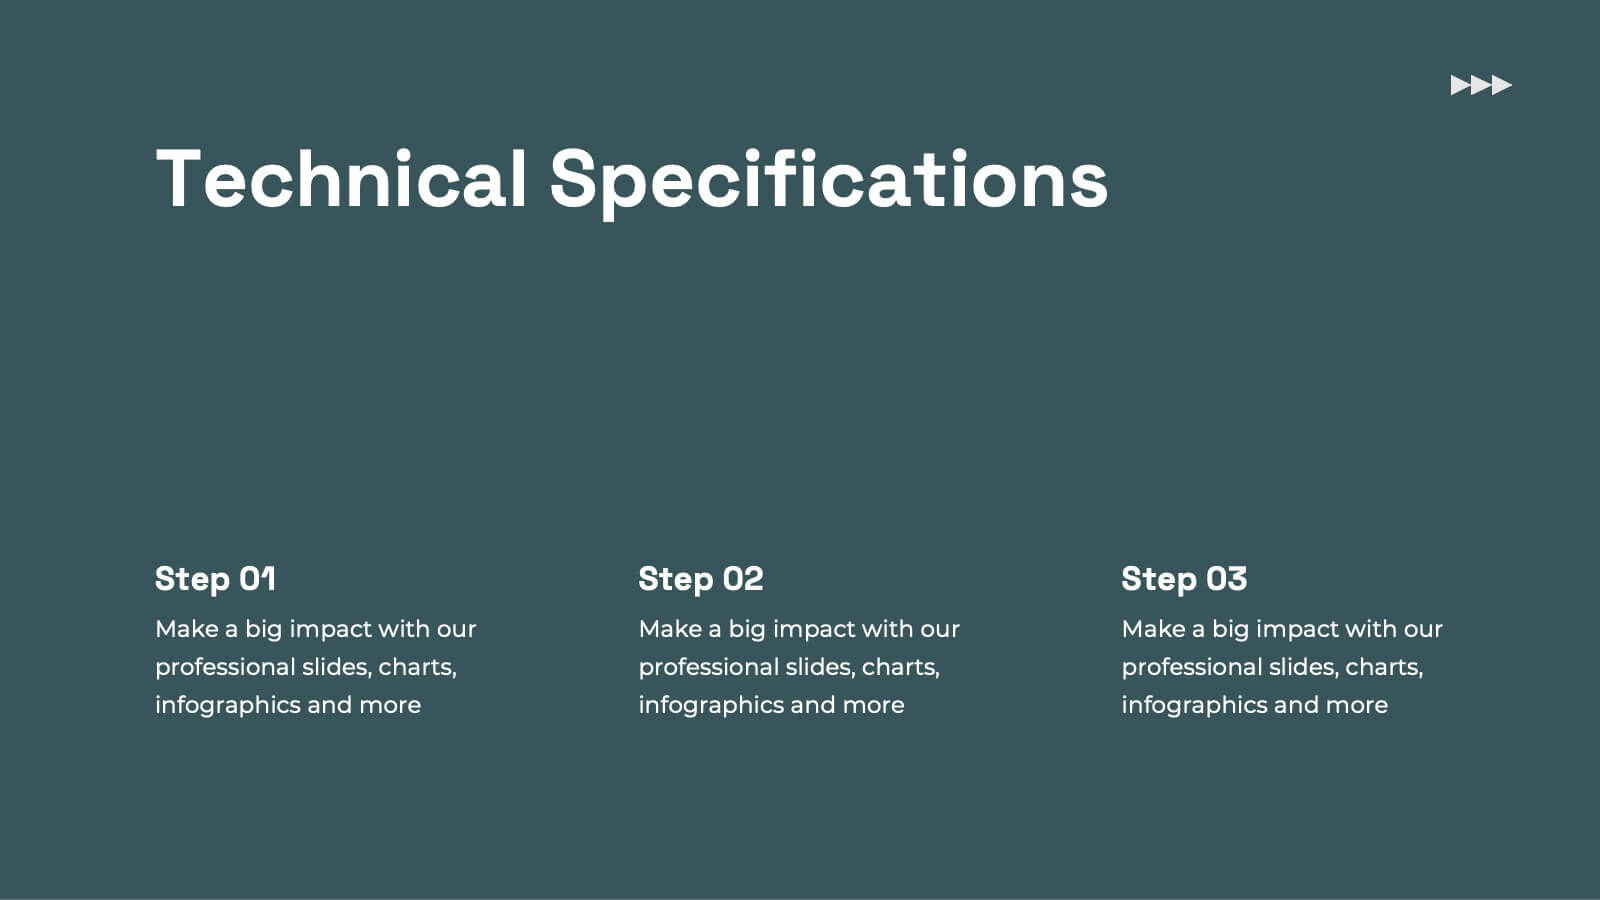
Kale Product Strategy Report Presentation
Unleash the power of your product with this bold and dynamic product strategy report template! Elevate your presentation with eye-catching designs that showcase product features, competitive analysis, and pricing strategies like never before. Captivate your audience from start to finish and leave a lasting impression. Fully compatible with PowerPoint, Keynote, and Google Slides!