


Características


¿Tienes alguna pregunta?
Recomendar


8 diapositivas
Annual Business Performance Report Presentation
Visualize your company’s progress with the Annual Business Performance Report Presentation. This sleek, data-driven template combines donut charts and bar graphs to showcase KPIs, milestones, and key achievements. Perfect for year-end summaries and stakeholder updates. Fully editable in Canva, PowerPoint, and Google Slides for easy customization and professional results.
21 diapositivas
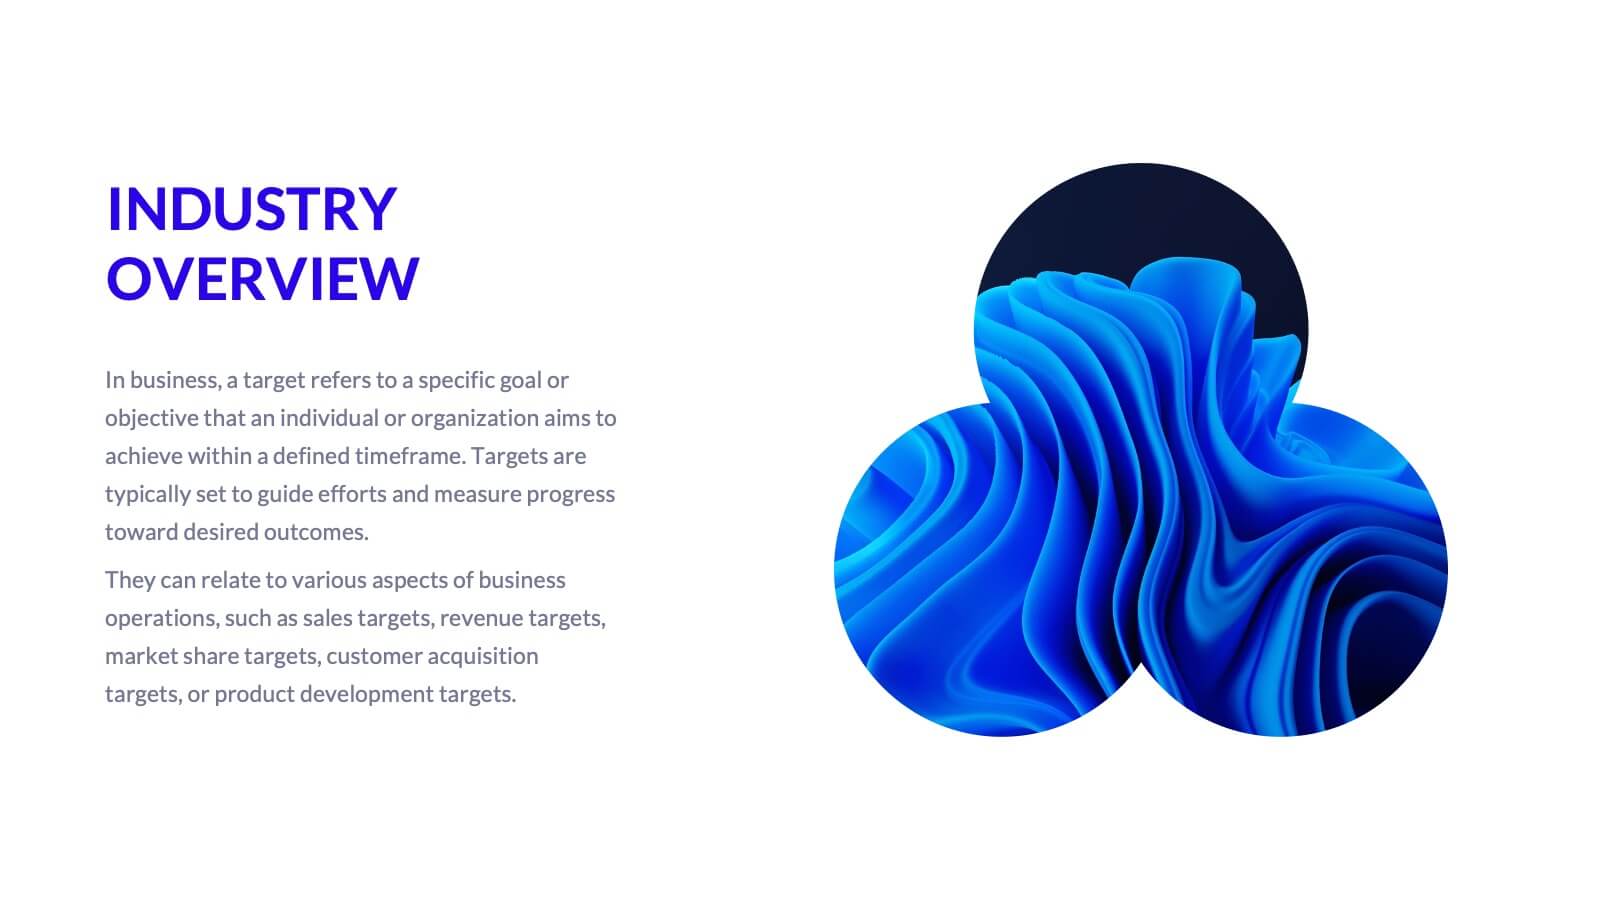
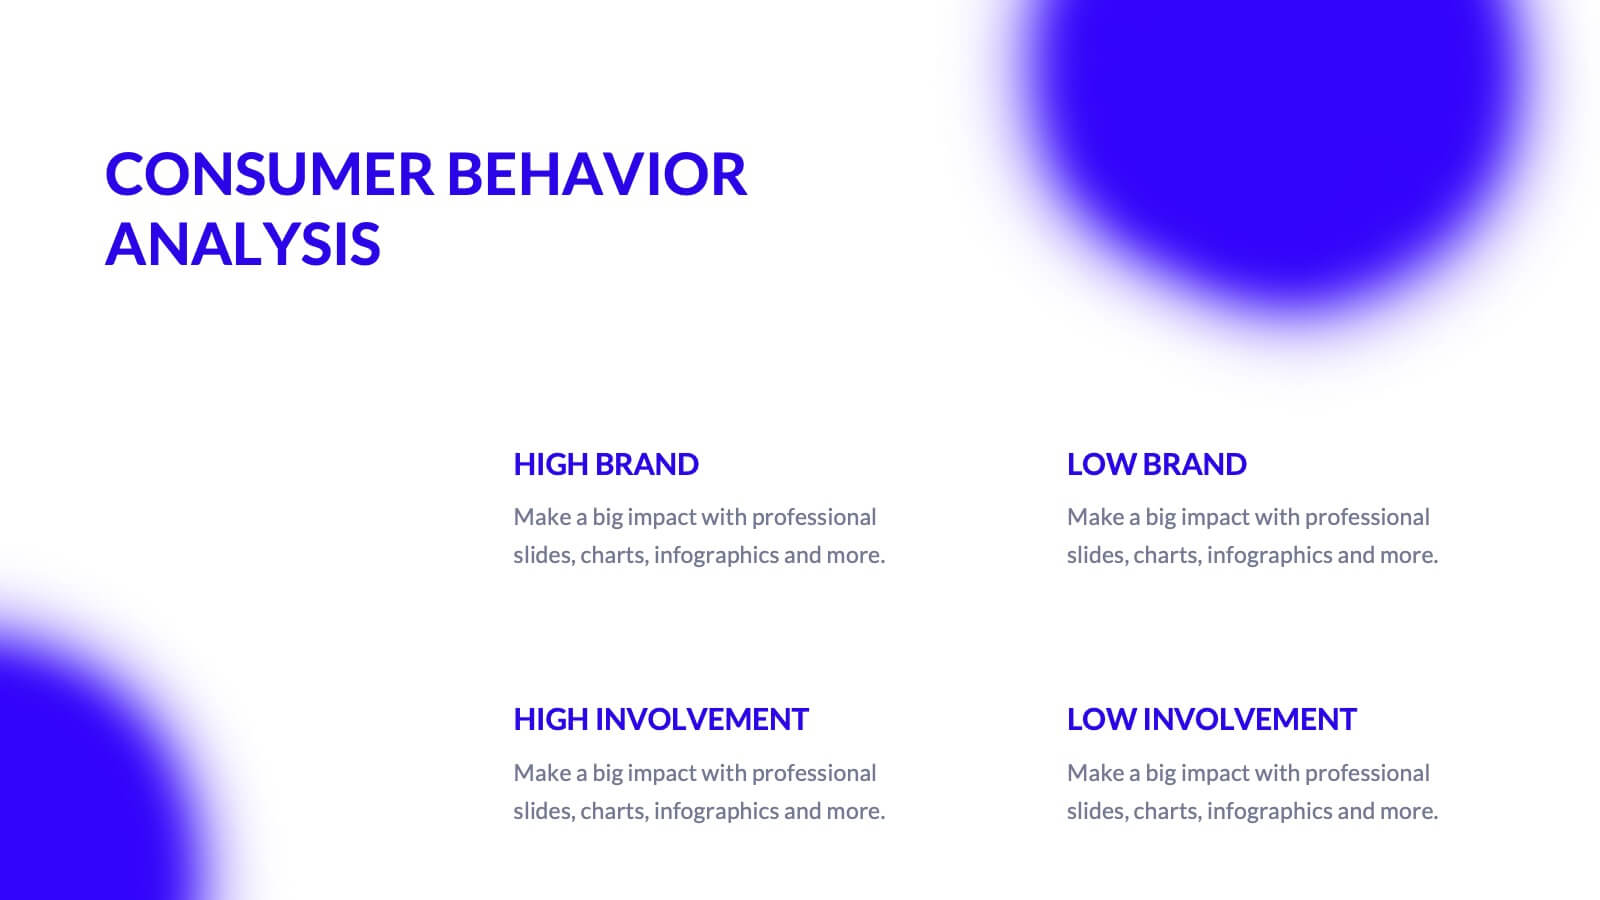
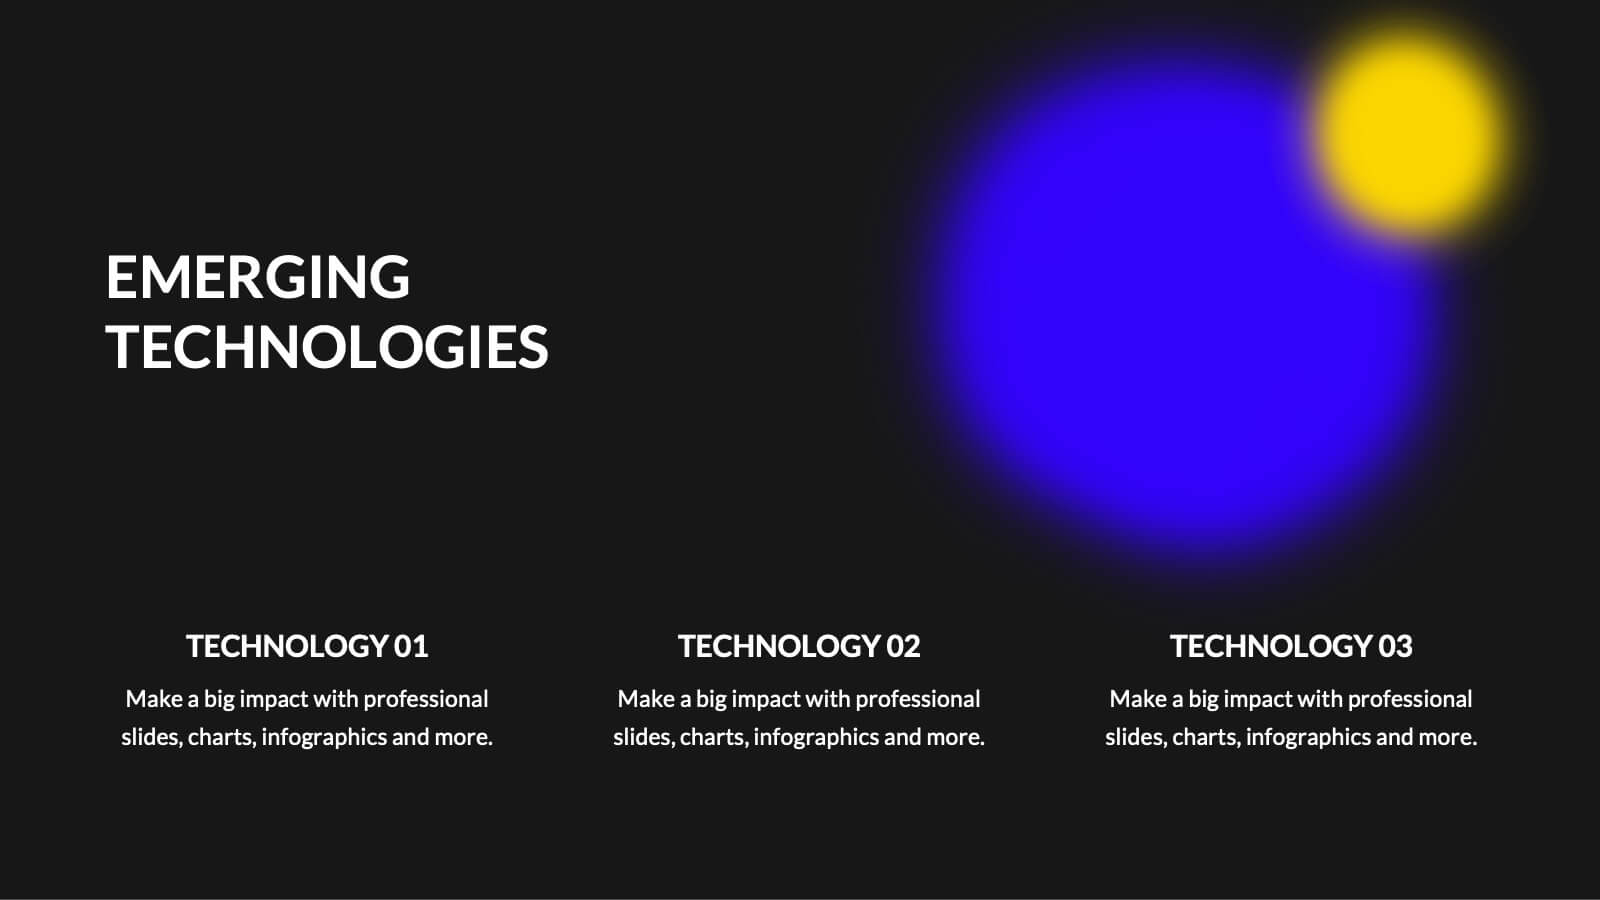
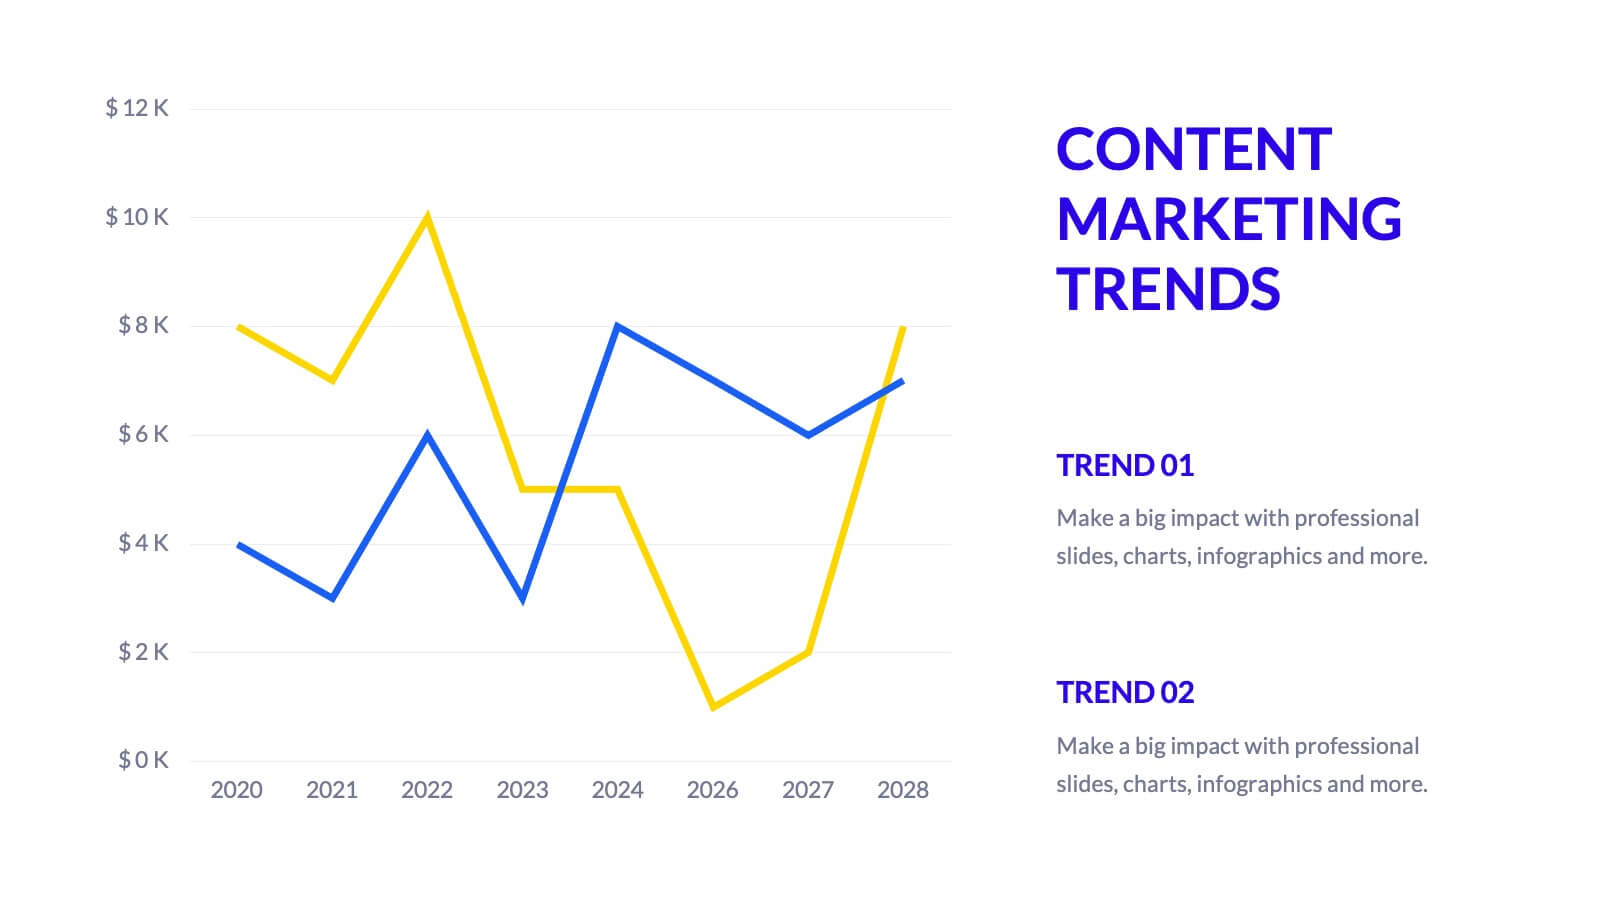
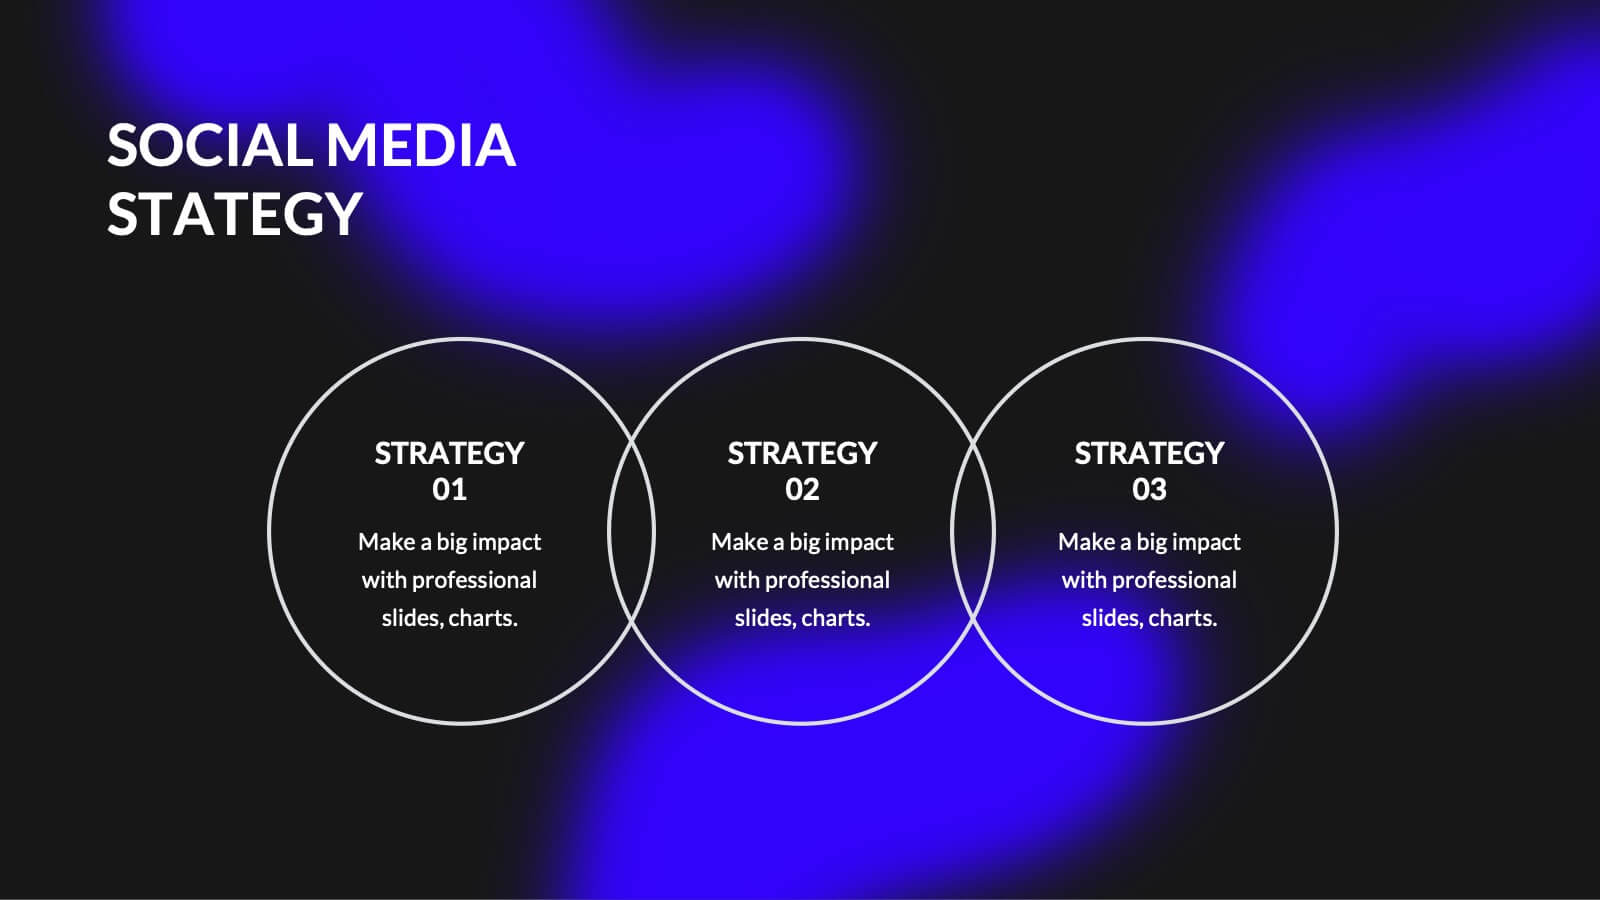
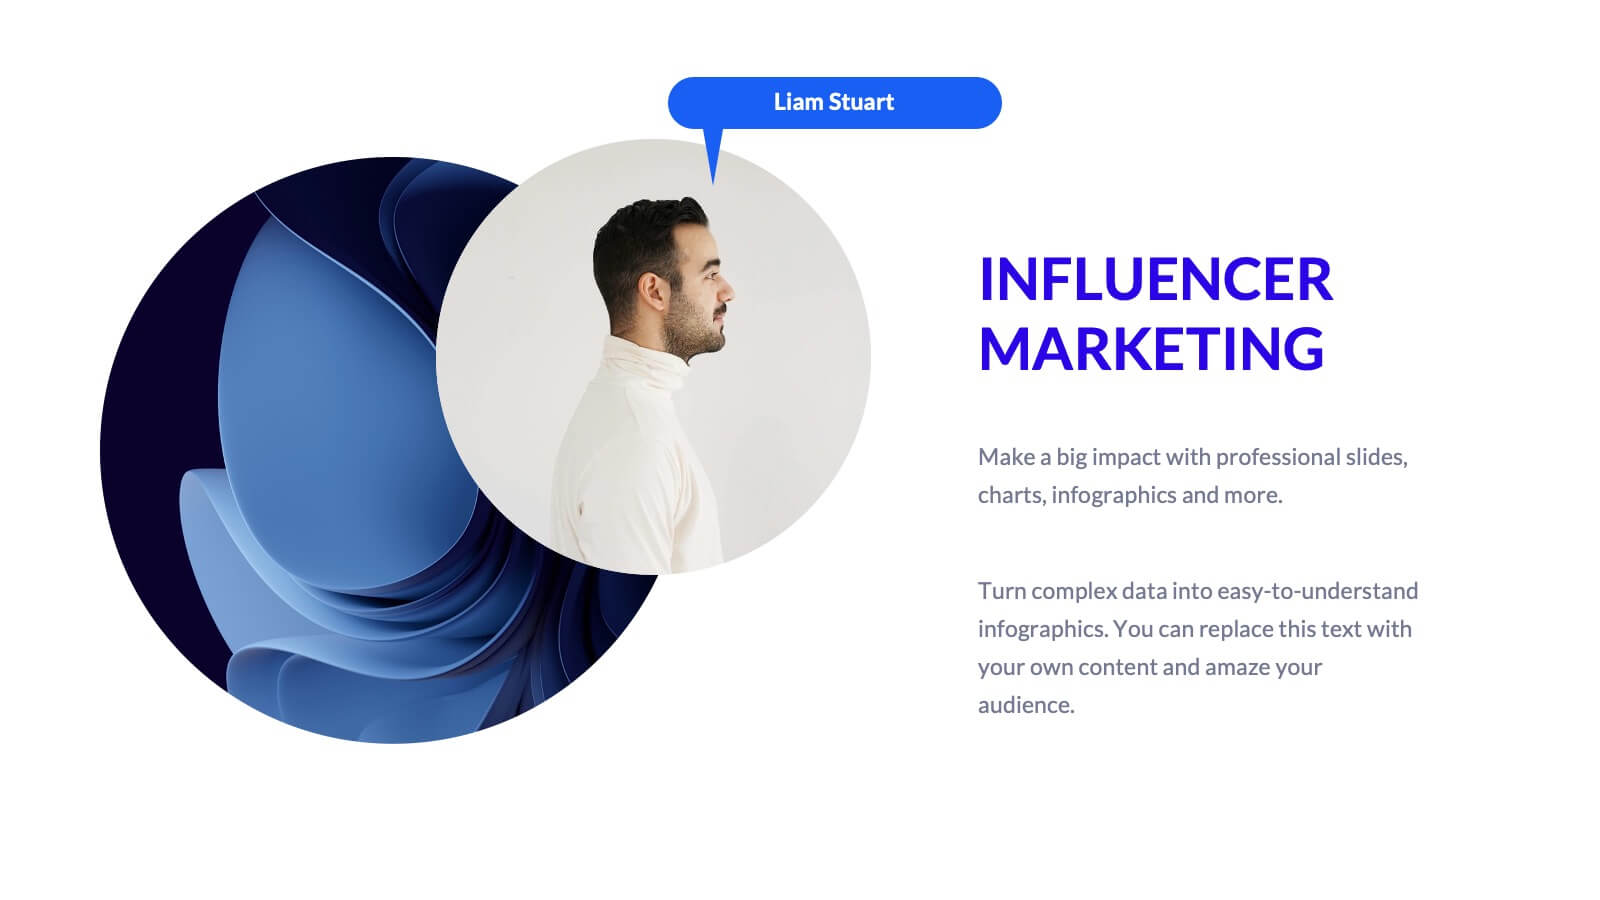
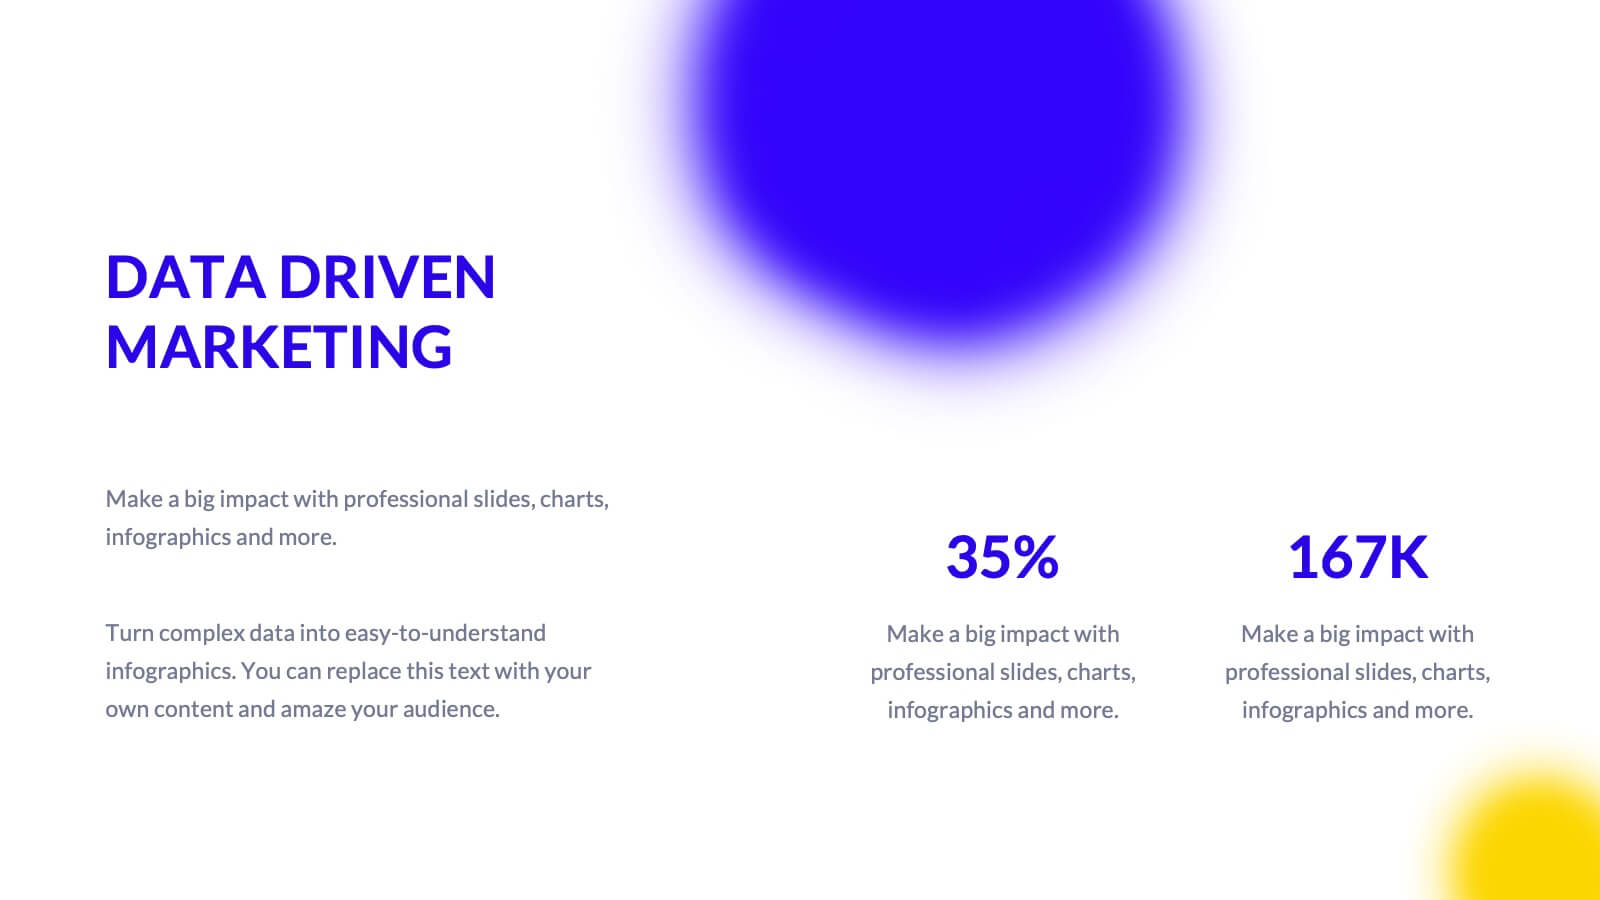
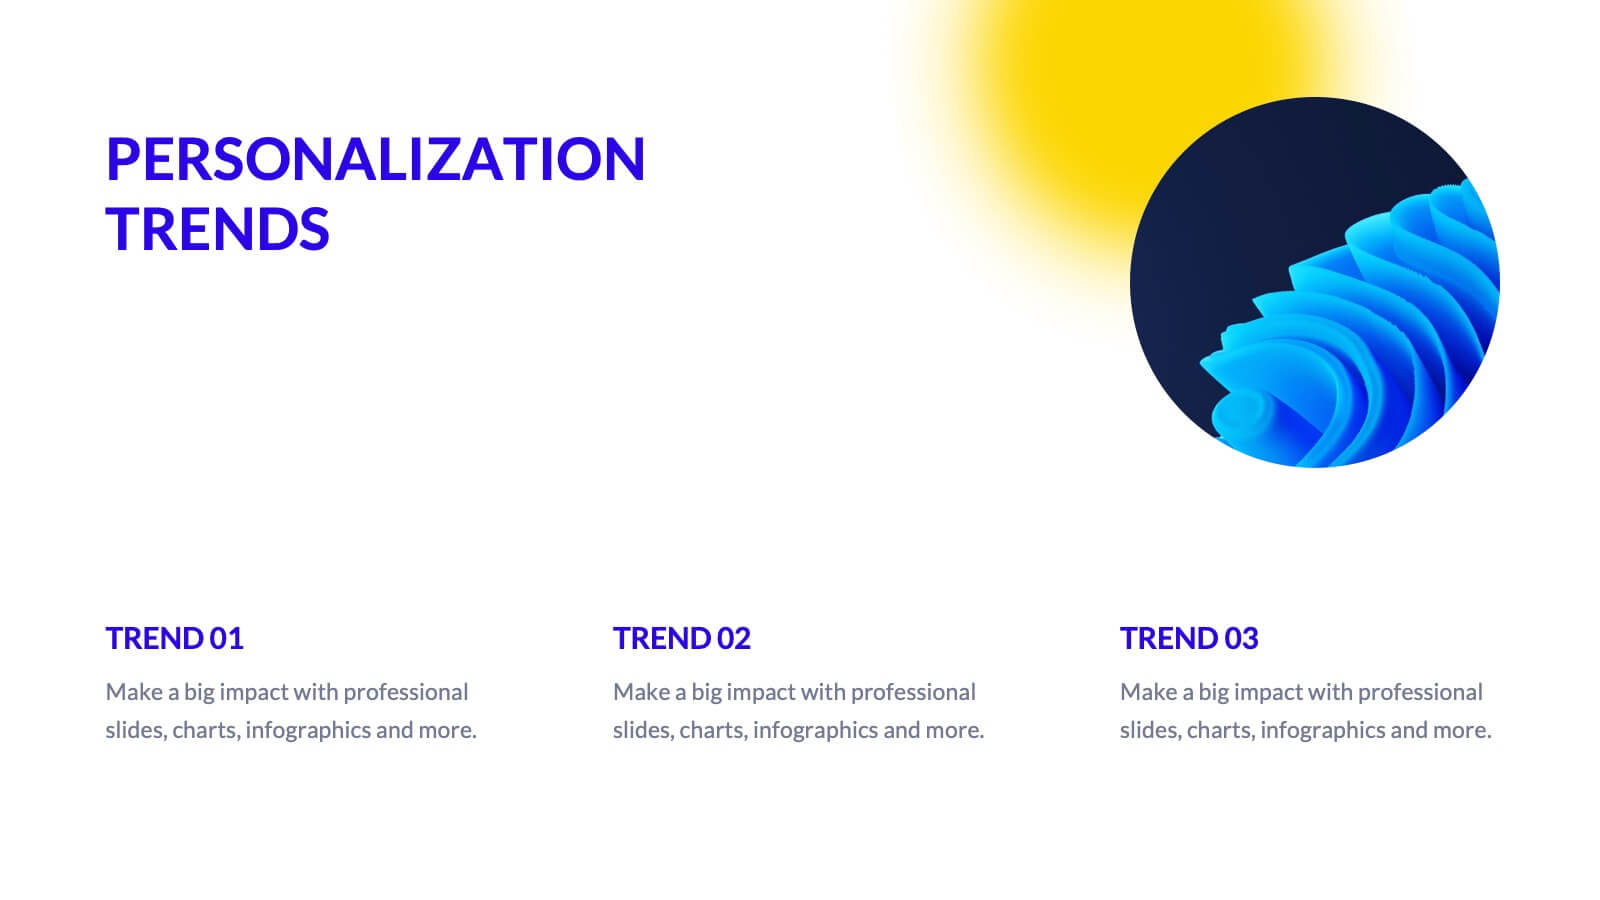
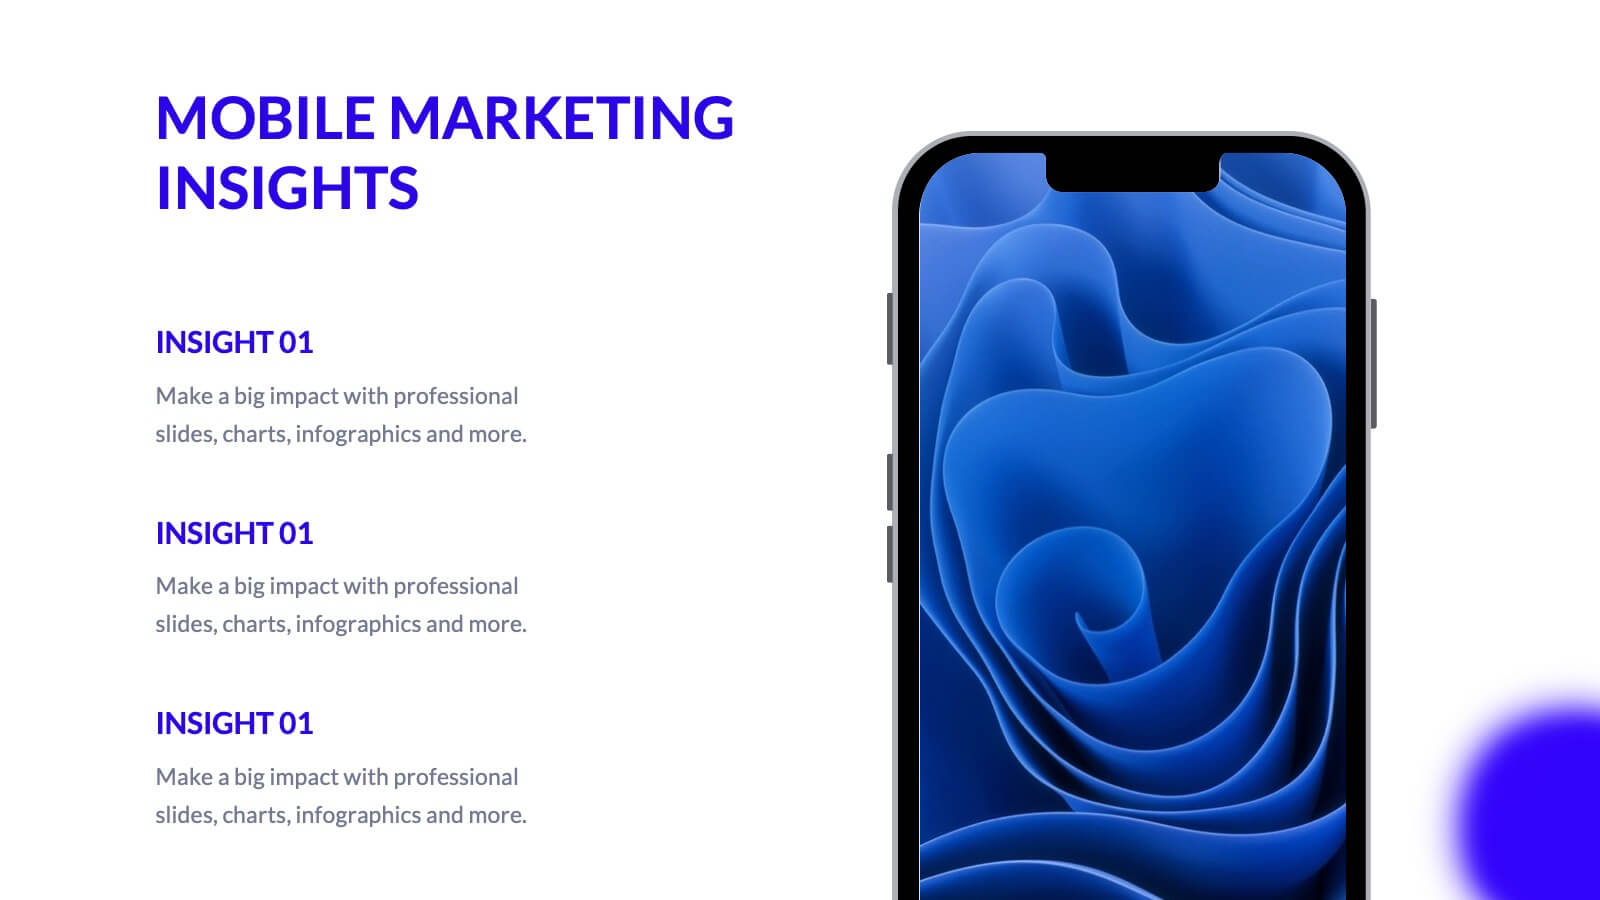
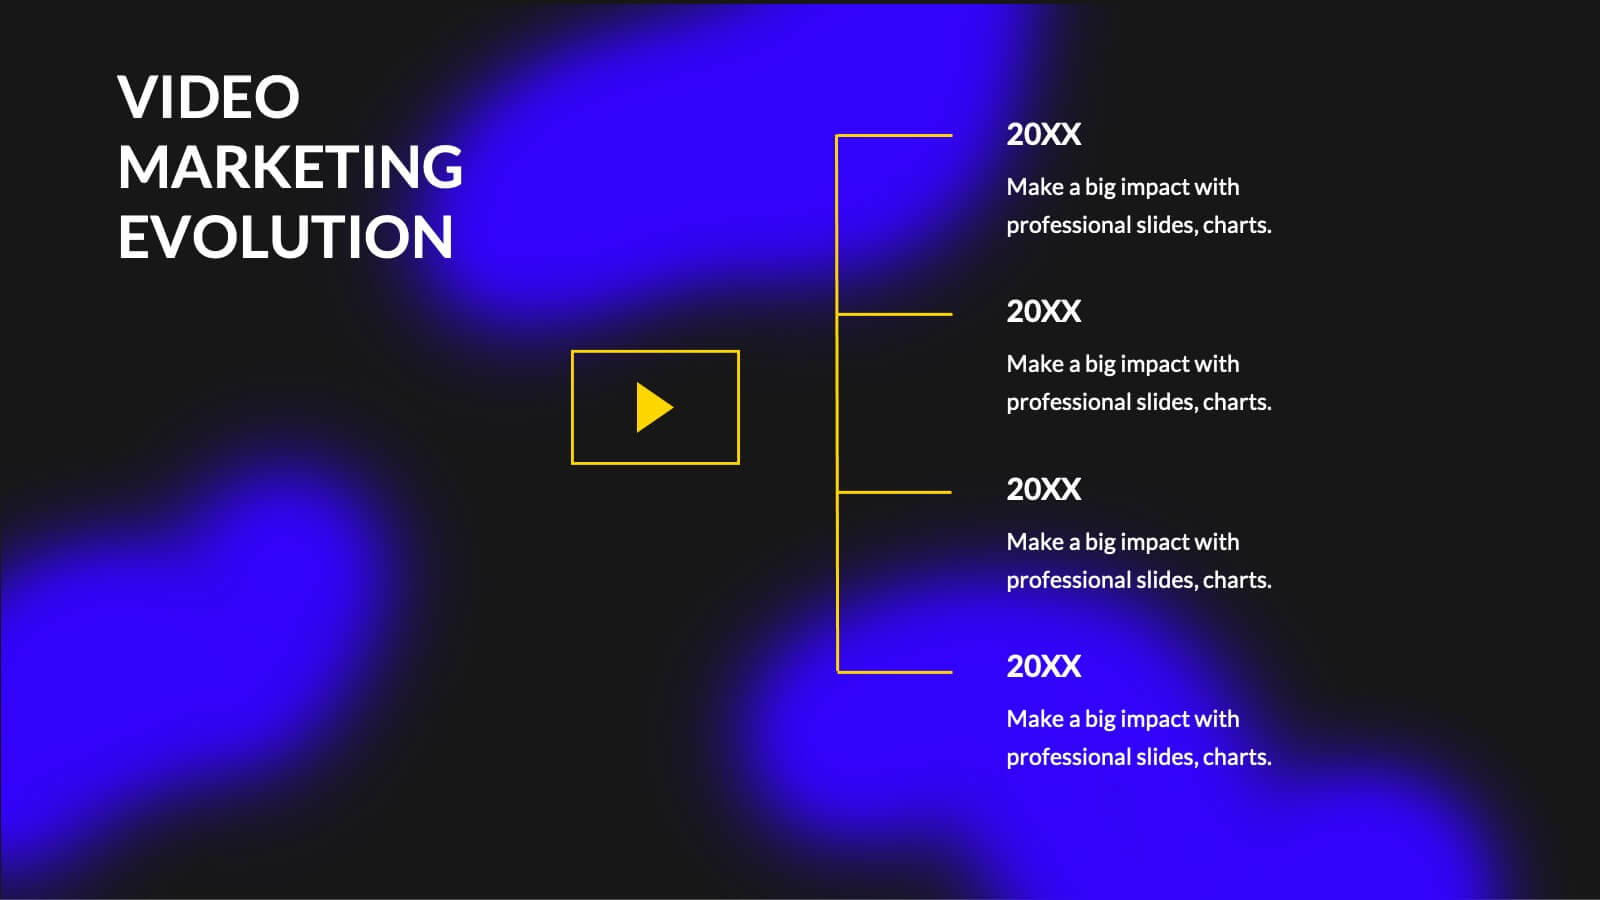
Catalyst Digital Marketing Strategy Plan Presentation
Supercharge your digital marketing strategy with this vibrant, modern presentation template. Perfect for detailing industry overviews, consumer behavior analysis, and social media strategies, it features a dynamic design that captures attention. Highlight key trends like SEO, influencer marketing, and e-commerce to engage your audience. Compatible with PowerPoint, Keynote, and Google Slides, it ensures seamless presentations on any platform.


27 diapositivas
Dusk Rebranding Project Plan Presentation
Revolutionize your brand identity with this vibrant rebranding presentation template! Perfect for showcasing your logo, color palette, and market analysis, it includes slides for brand strategy, competitive landscape, and performance metrics. Engage your audience with stunning visuals and comprehensive content. Compatible with PowerPoint, Keynote, and Google Slides for seamless presentations on any platform.


7 diapositivas
Framework Documentation Infographic
A framework infographic presents a framework for organizing and understanding complex information, to provide an overview of the key elements and relationships between them. This template is designed to break down your large amounts of information into smaller, more manageable parts. This infographic can be used in fields such as business, marketing, and strategy, as well as in education and research. Use it to explain complex concepts, theories, and models, and to provide a visual representation of how elements fit together. This can take a variety of forms, including flowcharts and diagrams.


6 diapositivas
Next-Gen Wireless Solutions Overview Presentation
Give your wireless solutions pitch a sleek, professional edge with this futuristic globe-style layout. Perfect for tech-driven topics, this infographic highlights six key areas in a clear, visually engaging format. Fully customizable and easy to use in PowerPoint, Keynote, and Google Slides—ideal for product overviews, innovation briefings, or strategy updates.


5 diapositivas
Value Chain Business Model Presentation
Spark fresh insight into how your organization creates value with this clean, arrow-based layout that makes every step feel intuitive and action-ready. This presentation breaks down key activities, support processes, and improvement opportunities in a clear visual flow perfect for strategy discussions. Fully compatible with PowerPoint, Keynote, and Google Slides.


6 diapositivas
Business Logic Flow Chart
Streamline complex processes with the Business Logic Flow Chart Presentation. This modern, curved connector design helps you visually outline up to five sequential steps or logic paths, using colorful icons and editable text fields. Ideal for business workflows, strategic plans, or data flow maps. Fully compatible with PowerPoint, Keynote, and Google Slides.


7 diapositivas
Balance Sheet and Profit Overview Presentation
Give your financial summary a clean, modern look with the Balance Sheet and Profit Overview Presentation. This slide offers a dual-column layout with icons and space for six key financial metrics or business insights—ideal for summarizing assets, liabilities, profits, and more. Easily editable in Canva, PowerPoint, and Google Slides.


7 diapositivas
Office Scenes Infographic Presentation Template
An Office Scene Infographic is a visualization of the most common types of office spaces, along with their pros and cons. This infographic template is great for a school presentation, office projects, employee onboarding programs, or planning a workplace makeover. Within this infographic, you will be able to display absolutely everything that needs to be shown within a corporate setting. This office scene template is a fully layered and customizable infographic that allows you to create your own design. Use it as an infographic, as a presentation, or even a website/app background.


10 diapositivas
Body System Educational Overview Presentation
Dive into anatomy with a slide that makes learning the human body visual, clear, and interactive. This educational overview breaks down key body systems into simple, labeled sections—perfect for classroom teaching, medical training, or health awareness campaigns. Fully editable and compatible with PowerPoint, Keynote, and Google Slides for seamless customization.


5 diapositivas
Innovation with Design Thinking Framework
Boost creativity and problem-solving with the Innovation with Design Thinking Framework Presentation. This slide features a vertically stacked rocket diagram symbolizing the five key phases of design thinking—perfect for illustrating iterative innovation processes. Each level includes editable text and icons, helping you align stakeholders around empathy, ideation, and prototyping. Ideal for workshops, innovation teams, educators, or product development presentations. Fully customizable in PowerPoint, Keynote, and Google Slides.


6 diapositivas
Organizational Change Process Presentation
Make complex transitions look simple with this modern visual template. Perfect for illustrating every stage of organizational change, this infographic-style design helps communicate key steps with clarity and focus. Easily editable and professionally designed, it's compatible with PowerPoint, Keynote, and Google Slides for seamless integration into your workflow.


2 diapositivas
Pink Ribbon Event Slide Deck Presentation
Bring awareness and compassion to your presentation with a bold ribbon design that symbolizes unity and support. Perfect for health campaigns, charity events, or educational talks, this layout helps you share key messages with clarity and impact. Fully compatible with PowerPoint, Keynote, and Google Slides for easy customization.


7 diapositivas
30 60 90 Day Plan Diagram Presentation
The 30-60-90 day plan is a document that outlines an individual's goals and objectives for the first 90 days of a new job. This template allows you the ability to set goals, review progress and analyze the results of your work. This infographic template is a multipurpose design that can be used for business, personal, and educational projects. It includes descriptive text and images to help you put together your presentation plan. It's easy to use and has been designed to be compatible with Powerpoint, Keynote, and Google Slides just add your own information and start presenting!


4 diapositivas
Product Launch and Roadmap Milestones Presentation
Highlight every phase of your product journey with this Product Launch and Roadmap Milestones presentation. Designed with a winding roadmap layout and colorful milestone markers, this template is perfect for visualizing launch plans, key deliverables, and development stages. Fully editable in Canva, PowerPoint, and Google Slides for easy customization.


34 diapositivas
Incubator Pitch Deck
An Incubator Pitch Deck is used by startups or entrepreneurs to pitch their business idea to an incubator or accelerator program, which are organizations that provide support, resources, and mentorship to early-stage startups to help them grow and succeed. This incubator pitch deck template is specifically tailored to the needs and requirements of the incubator or accelerator program. This template is designed with a professional and striking blue color palette, that adds a sense of sophistication and professionalism to your presentation. It also features a range of customizable slides that are specifically tailored for pitch presentations.


12 diapositivas
5 Steps Timeline Template
Visualize your project's progress with our vibrant "5 Steps Timeline Template." This infographic template guides you through the years 2030 to 2070, with colorful, distinct markers for each milestone. Ideal for long-term planning, each slide offers a clear path forward, ensuring your goals are both visual and attainable. Compatible with PowerPoint, Keynote, and Google Slides, this template is perfect for professionals eager to showcase their strategic vision in a memorable way.