


Características


¿Tienes alguna pregunta?
Recomendar


5 diapositivas
Social Myths & Facts Infographics
A Social Myth might be a certain belief, while a Social Fact would be the correct answer with data. This engaging and informative Infographics template is designed to help you dispel common misconceptions and provide accurate information on various social topics. With this template you can cover stereotypes, challenge myths, or present facts to promote understanding and awareness. The template features a modern design with vibrant colors and captivating visuals, making it visually appealing and easy to navigate. It includes a variety of design elements such as icons, illustrations and timelines that can all be customized.


7 diapositivas
Real Estate Housing Market Infographic
Real estate is an important asset class that plays a vital role in the economy and society. This real estate template is perfect for presenting your local housing market statistics to potential homeowners, buyers and renters. Use these charts and tables to show trends in sales prices, gross produce, average household income over time and so much more. This presentation contains 7 slides of the housing market. It is fully customizable with many photo layouts to choose from and all professional charts are included in the file. This template can be used with Powerpoint, keynote or Google Slides.


7 diapositivas
Business People Management Infographic
Business people refer to individuals involved in the world of commerce and trade, encompassing various roles within the business landscape. This Infographic is an illuminating and dynamic template designed to guide you through the art and science of managing human capital within the business sphere. Explore the key aspects of effective people management and elevate your organizational success by harnessing the power of your workforce. Compatible with Powerpoint, Keynote, and Google Slides. Discover the art of leading and engaging your team, and witness the transformation as your organization excels and grows, driven by the power of effective people management!


6 diapositivas
Strategic Wheel Diagram Presentation
Capture attention instantly with this bold and modern visual design built for strategic presentations. Ideal for mapping key processes, illustrating interconnected goals, or showcasing business strategies, it organizes ideas in a circular, easy-to-follow layout. Fully customizable and compatible with PowerPoint, Keynote, and Google Slides for seamless editing and presentation.


5 diapositivas
Restaurant Regulations Infographics
Restaurant Regulations are crucial for ensuring food safety and hygiene. This infographic is designed in vertical format, allowing for easy display on digital platforms such as social media or the restaurant's website. This is designed to help restaurants communicate regulations to their staff and customers. The use of visually appealing graphics and colors help make the information more engaging and easier to understand. It can also be customized with the restaurant's branding and logo to create a cohesive look and feel. The infographic is divided into sections, each for covering different areas of your regulations.


21 diapositivas
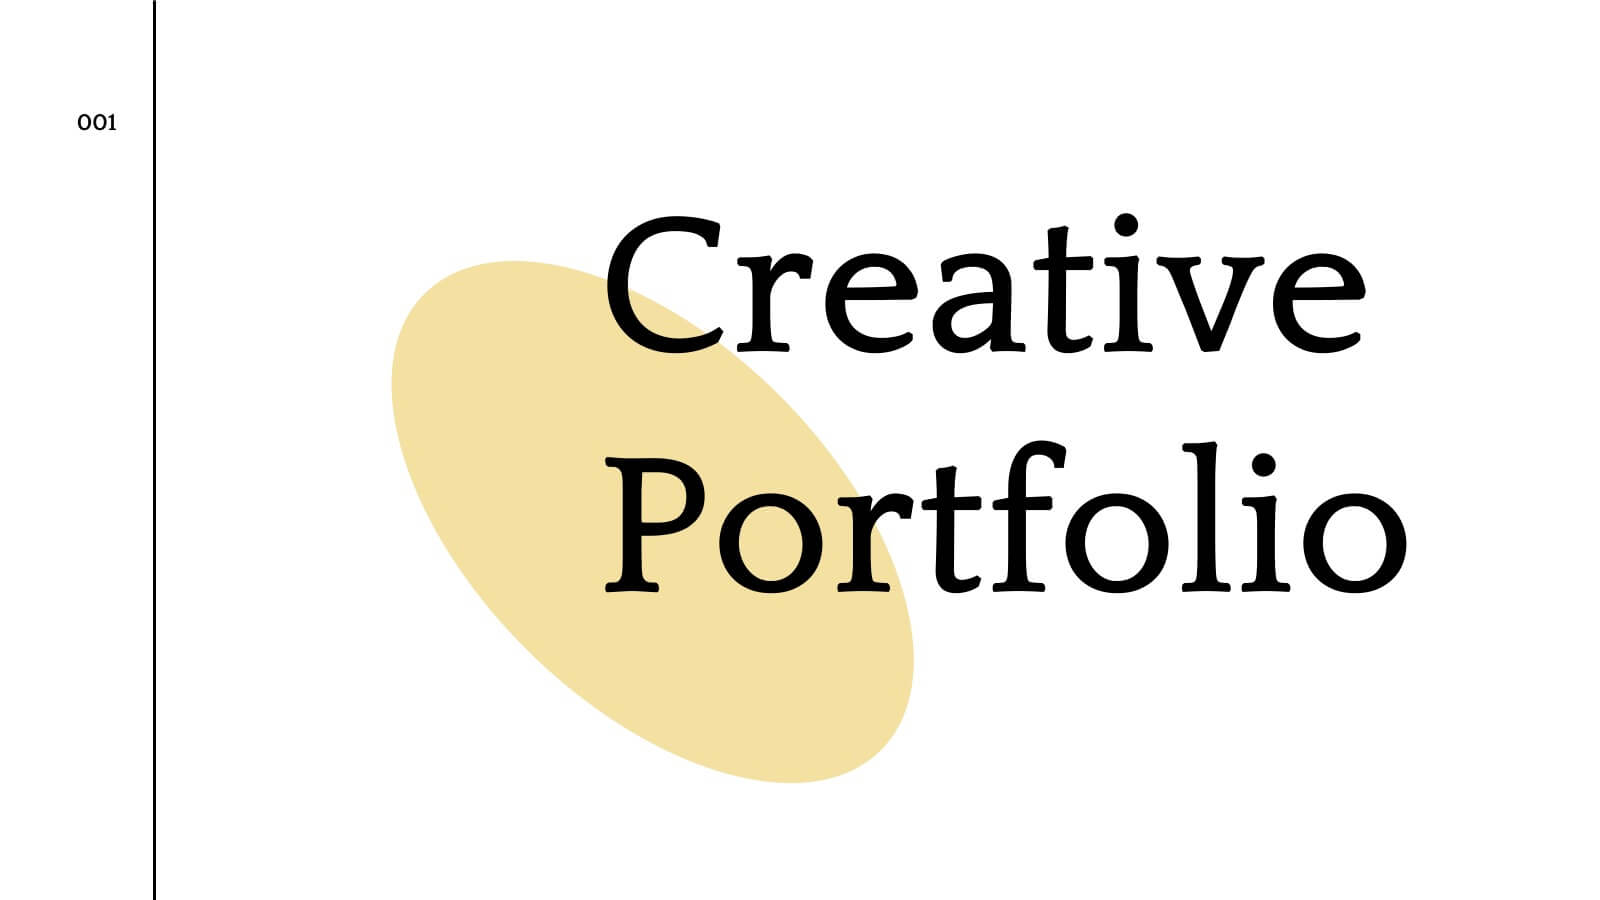
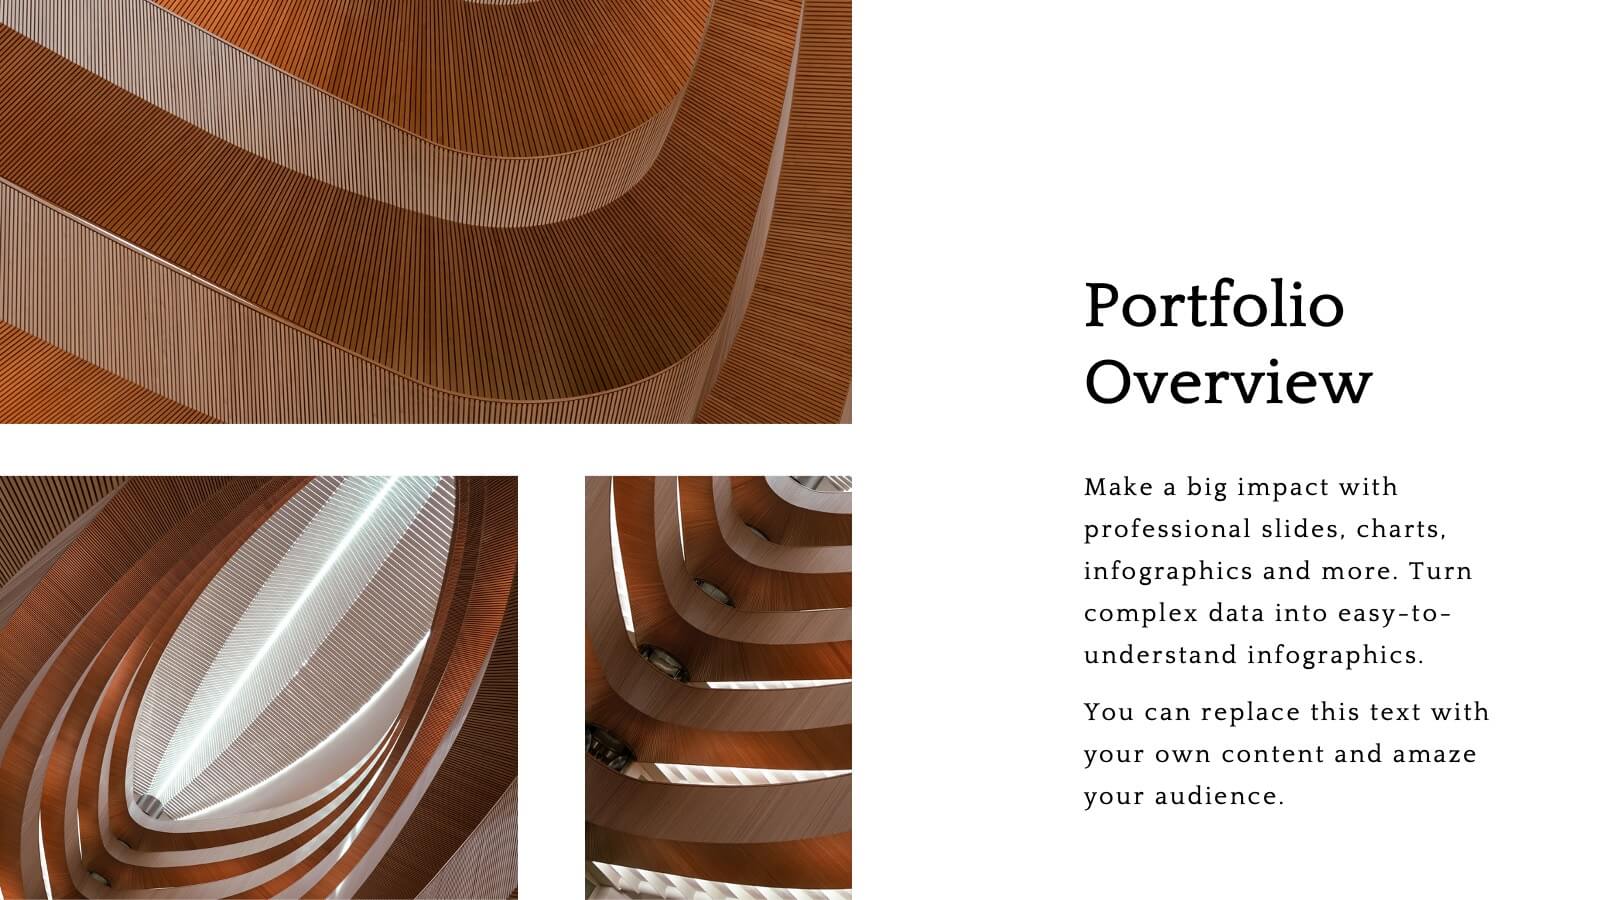
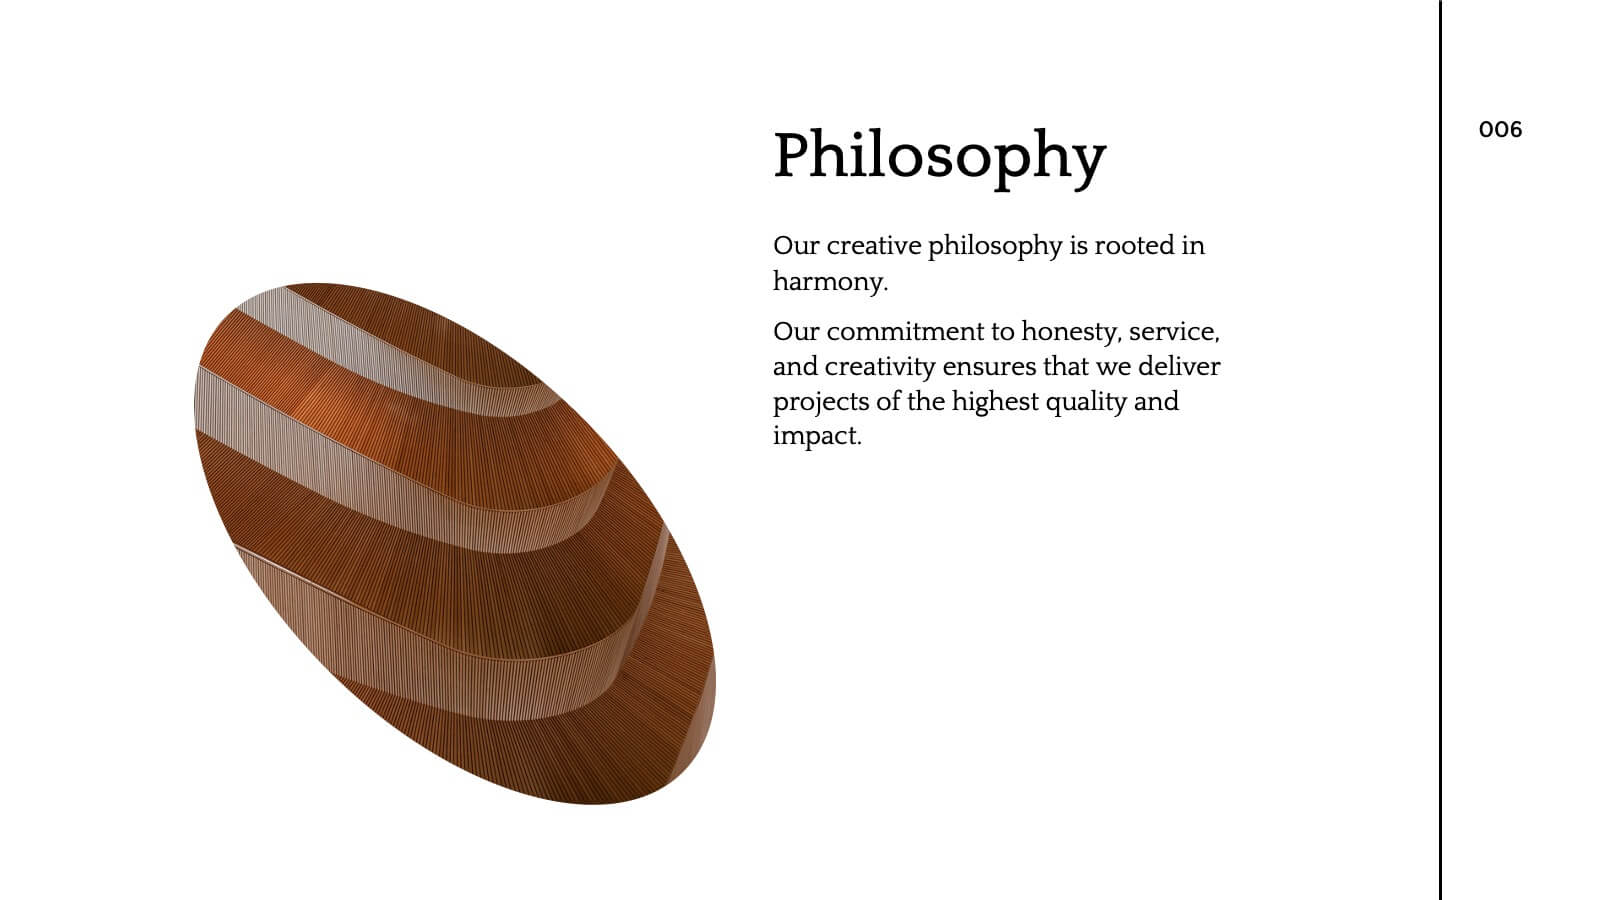
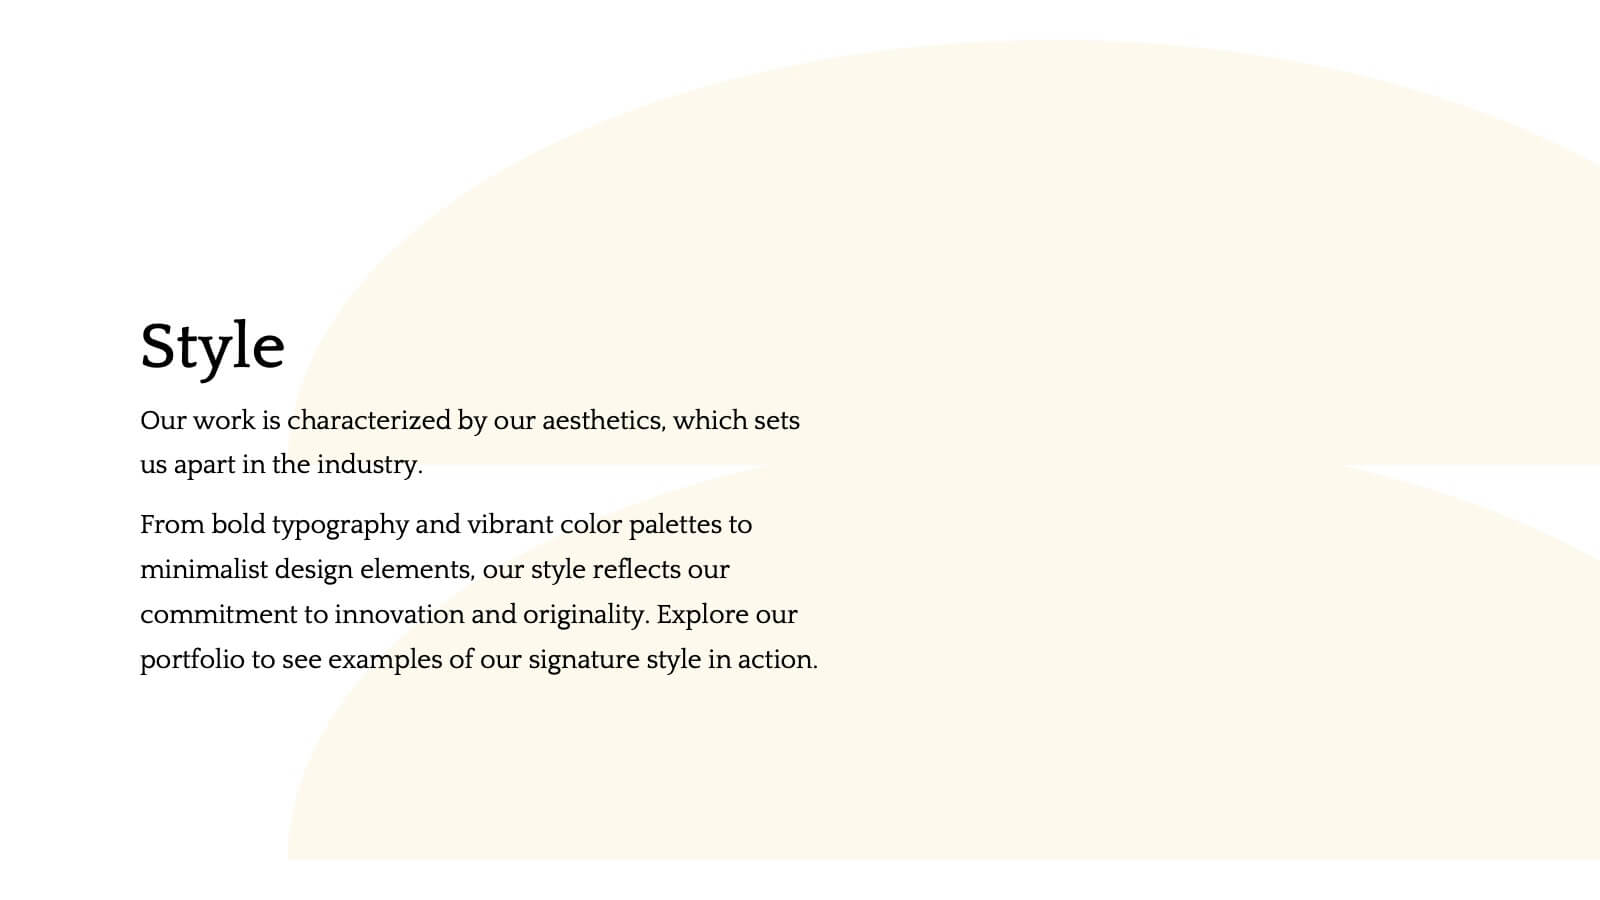
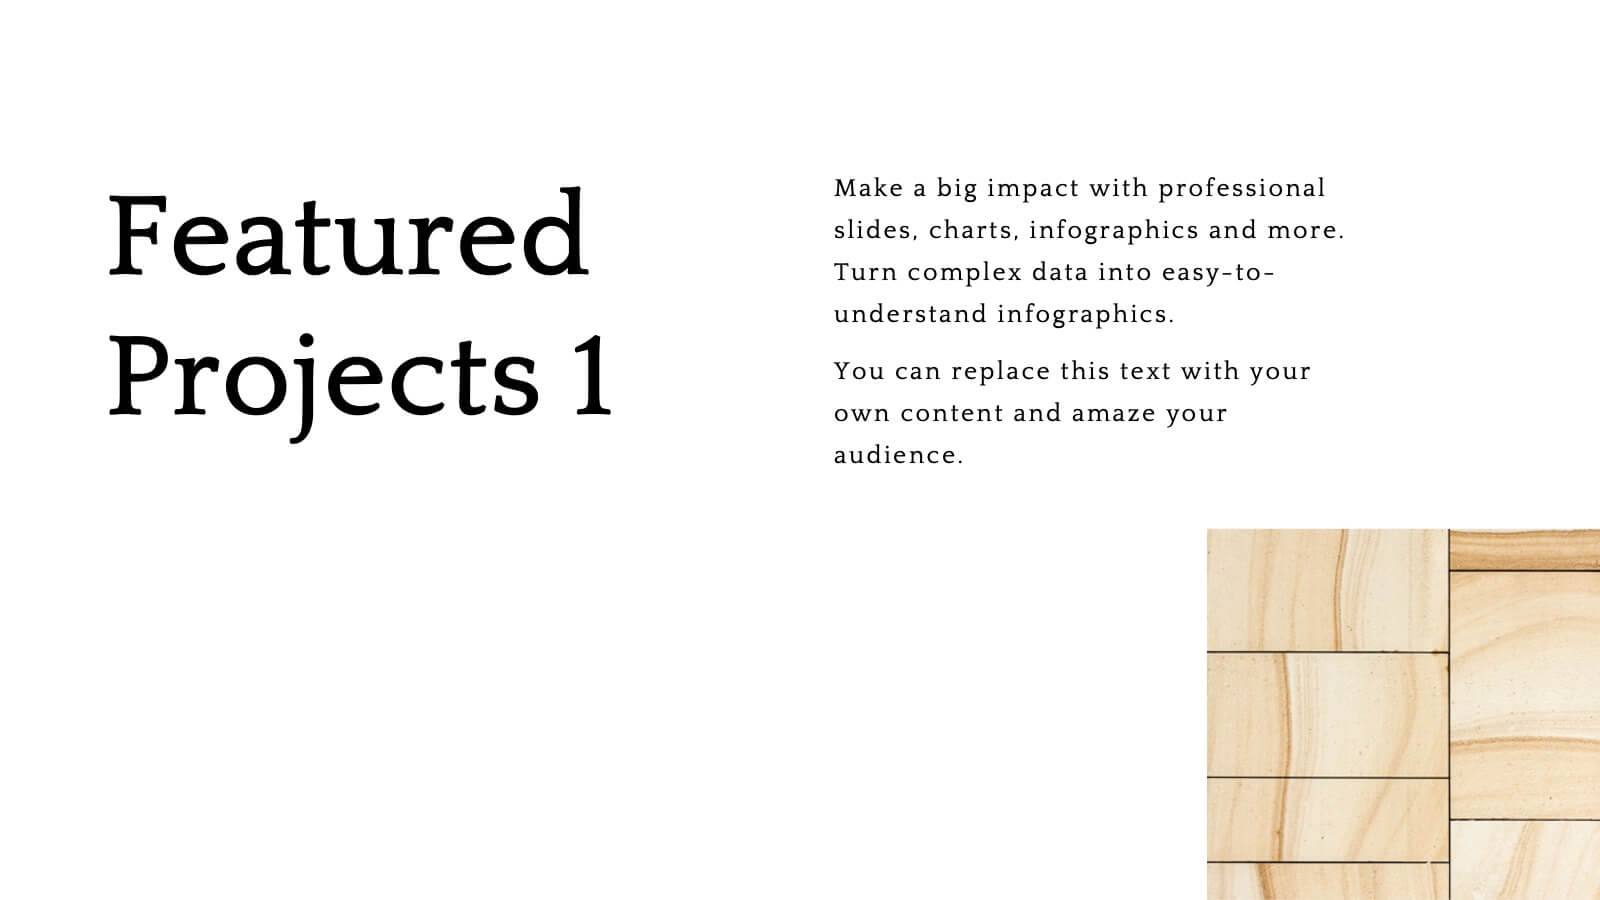
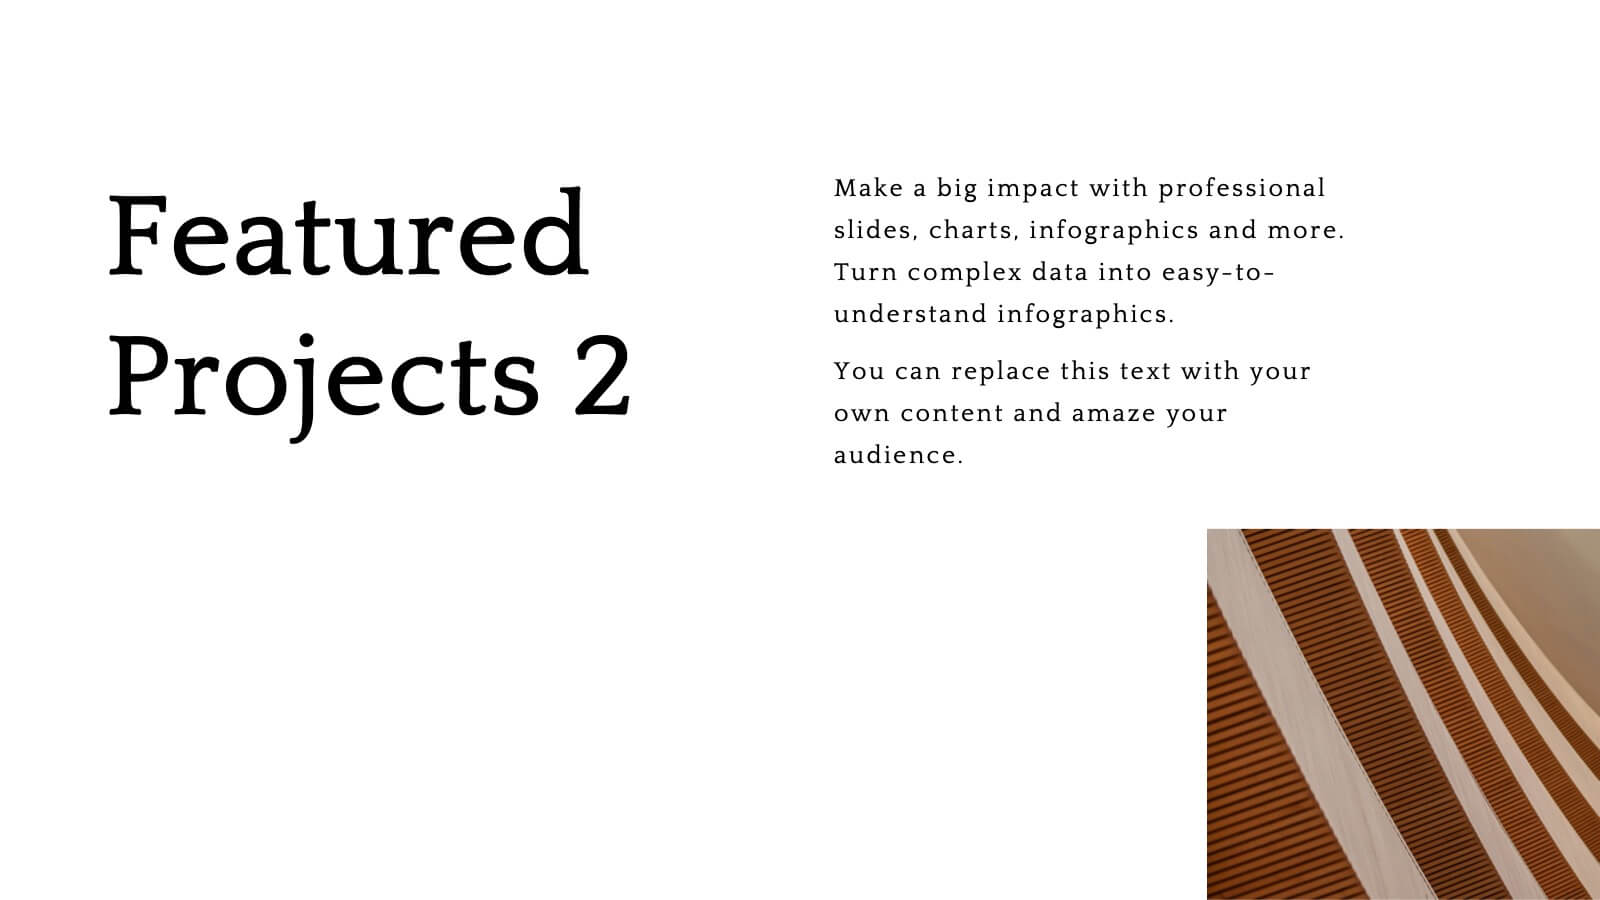
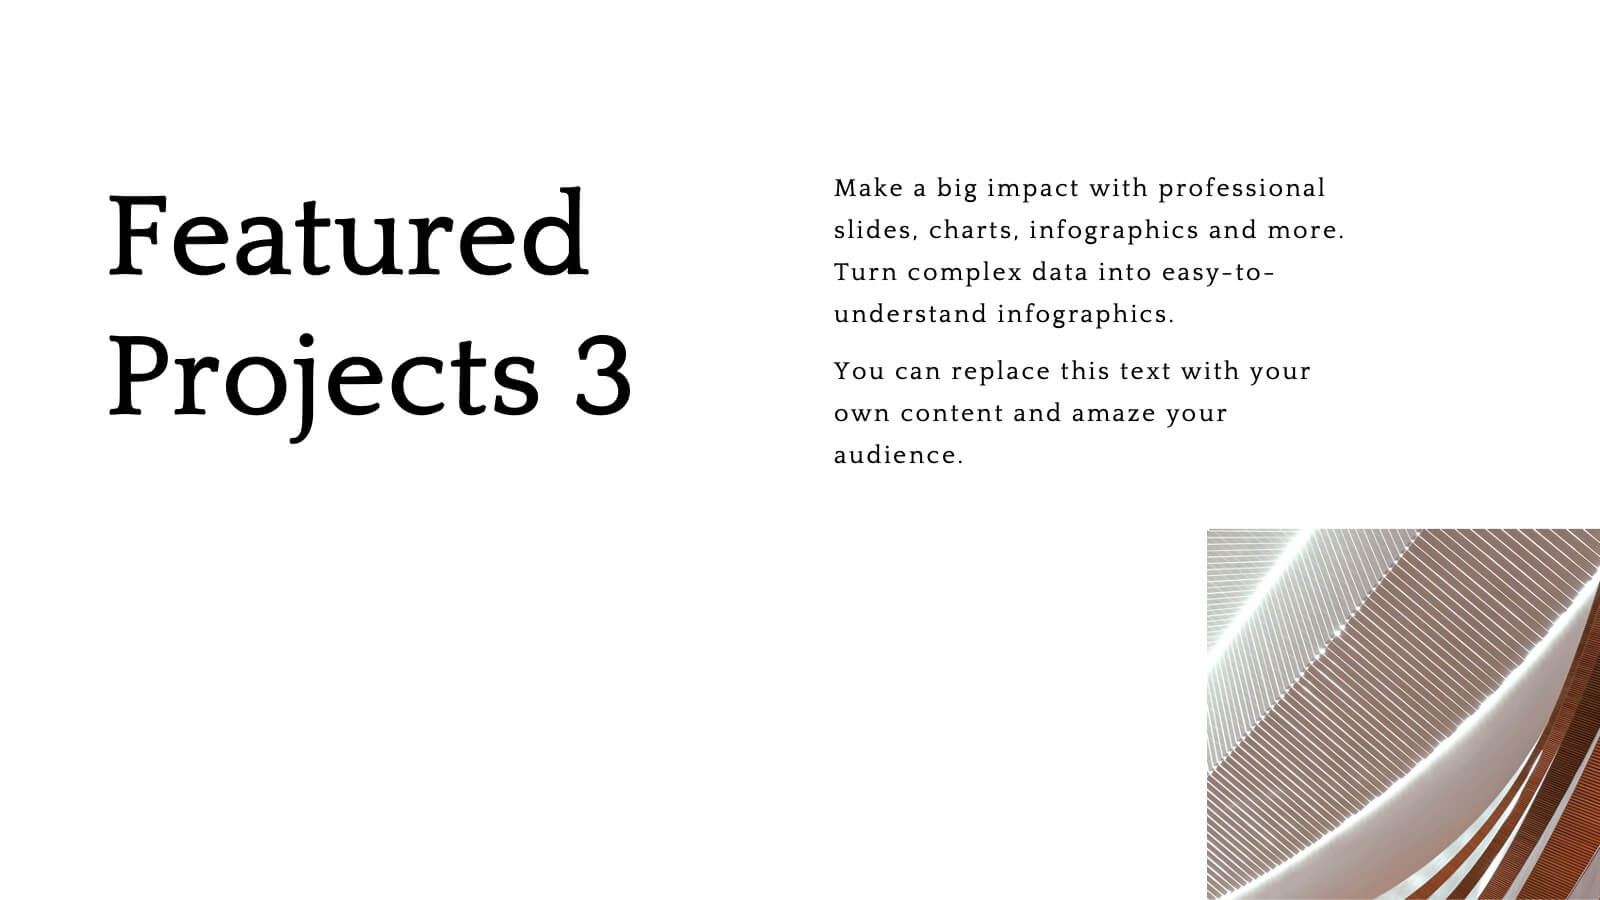
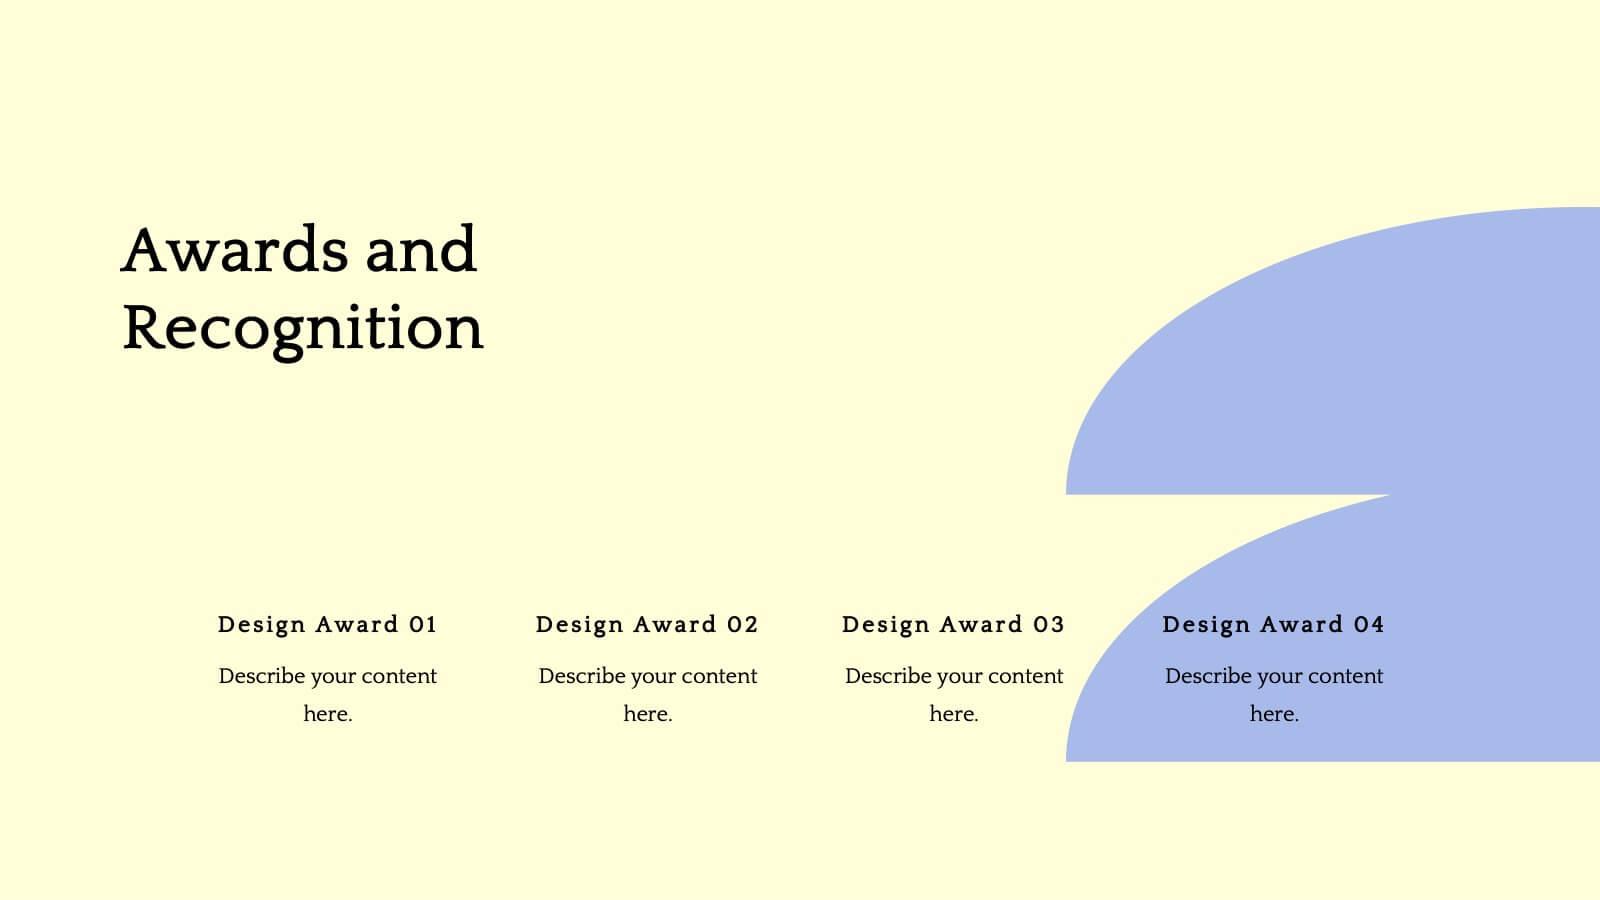
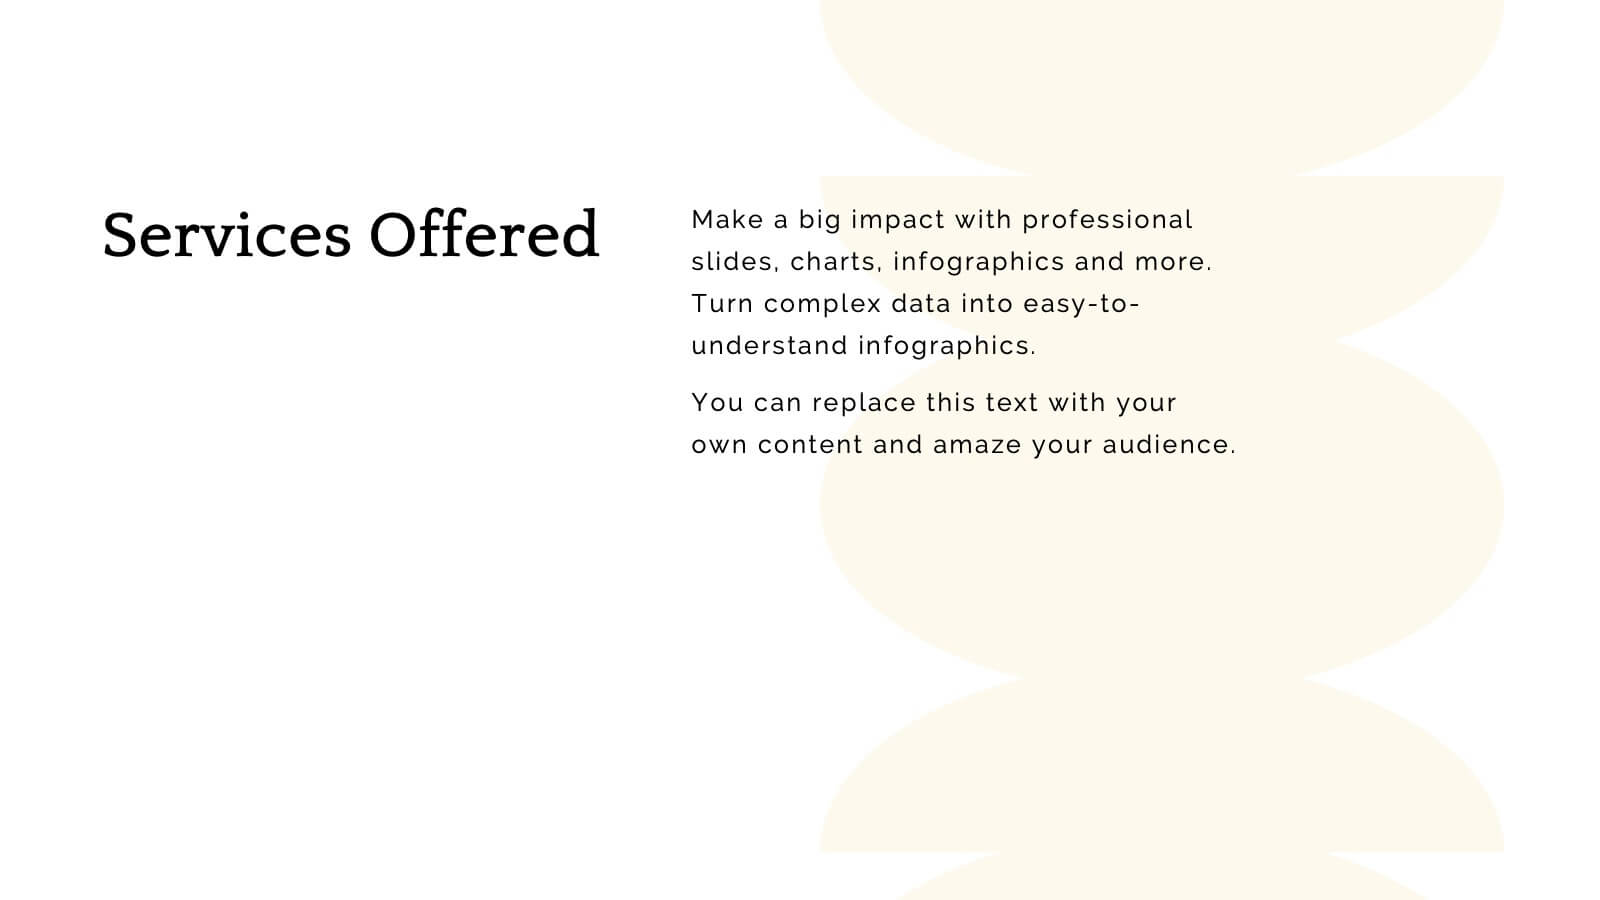
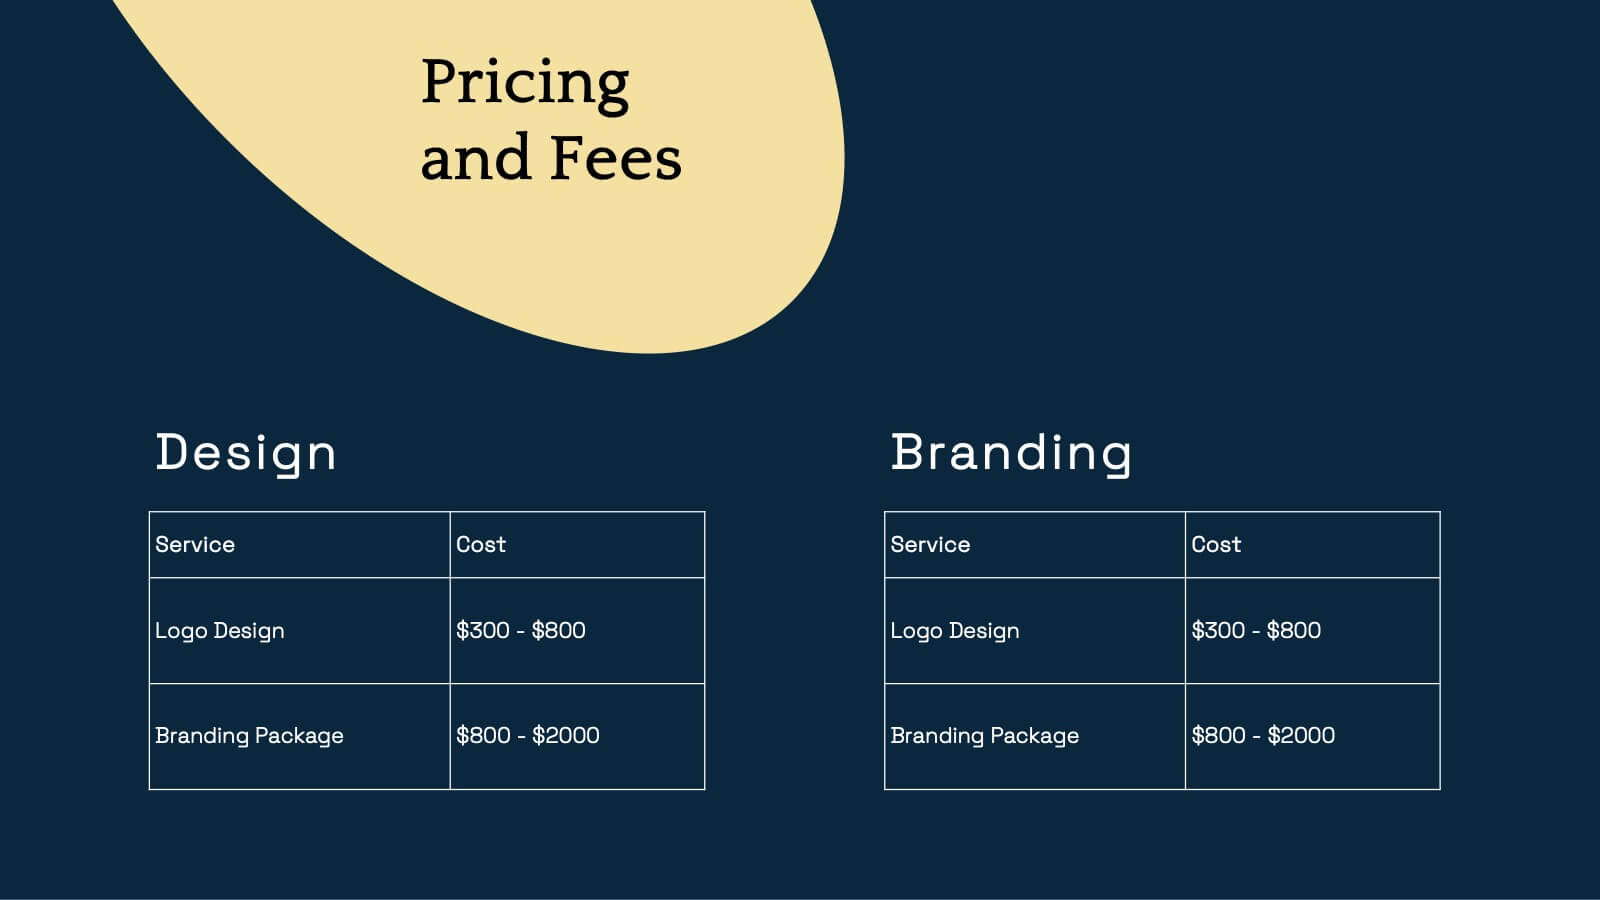
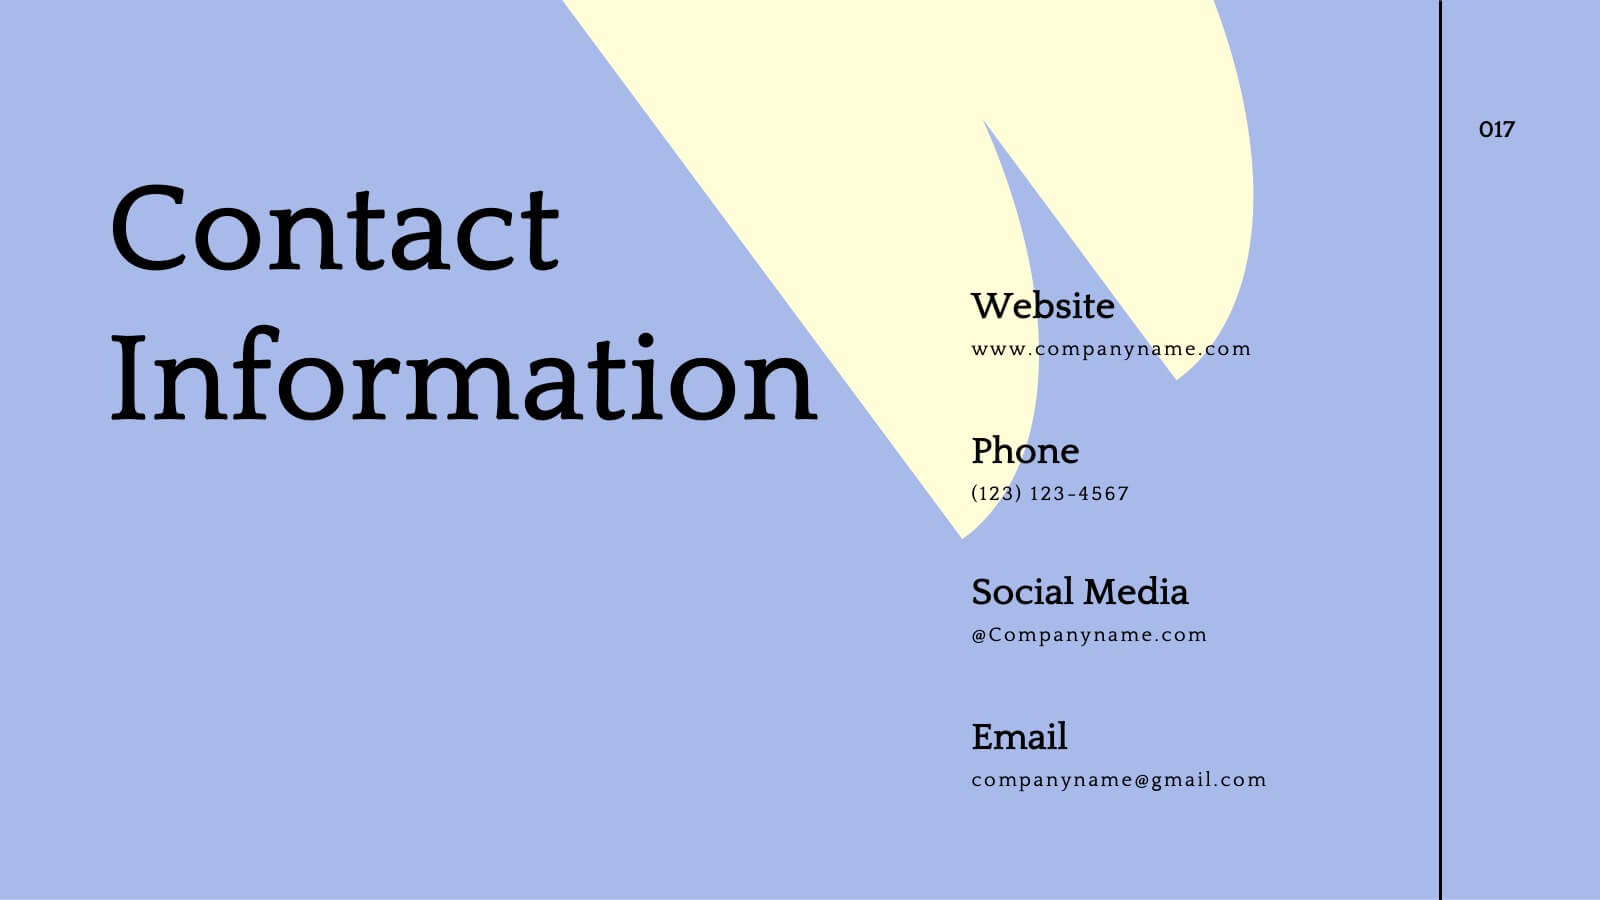
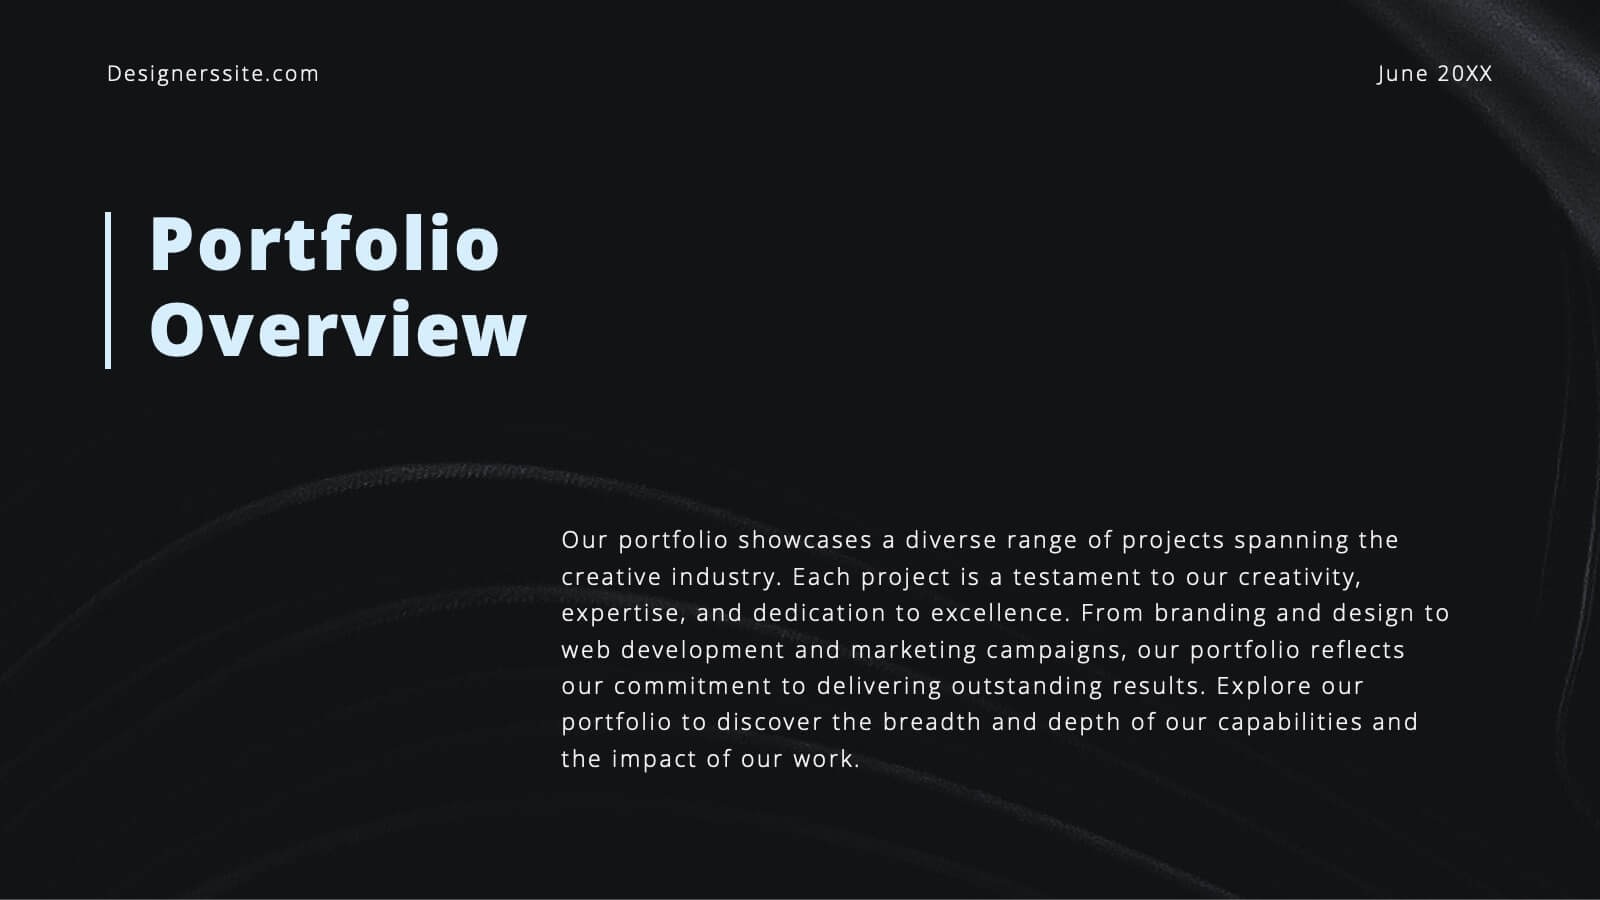
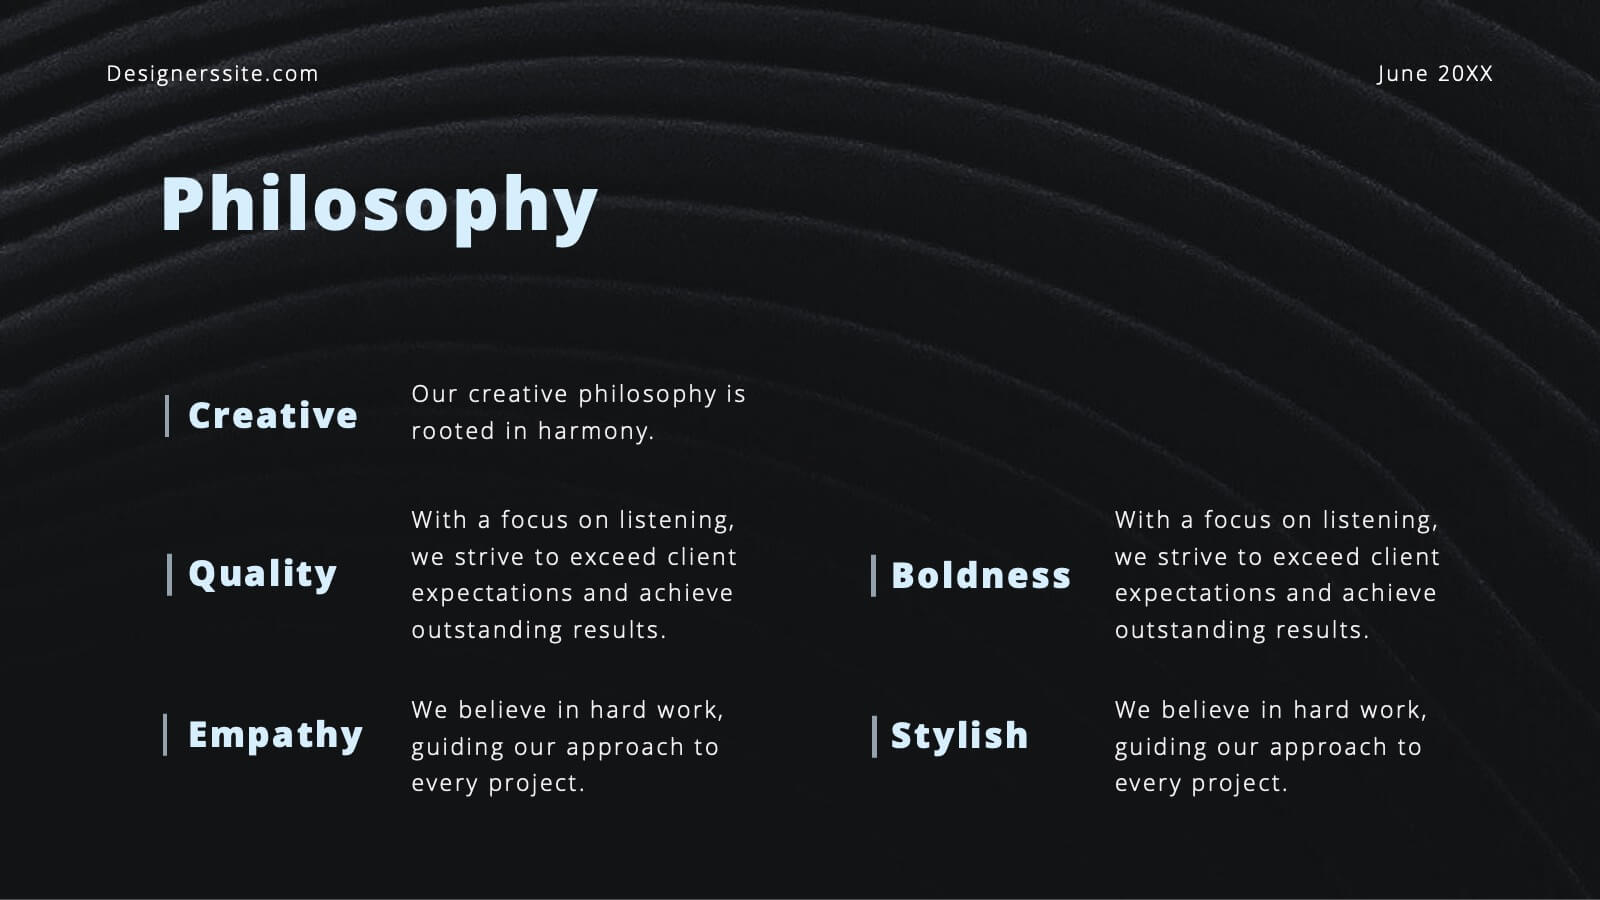
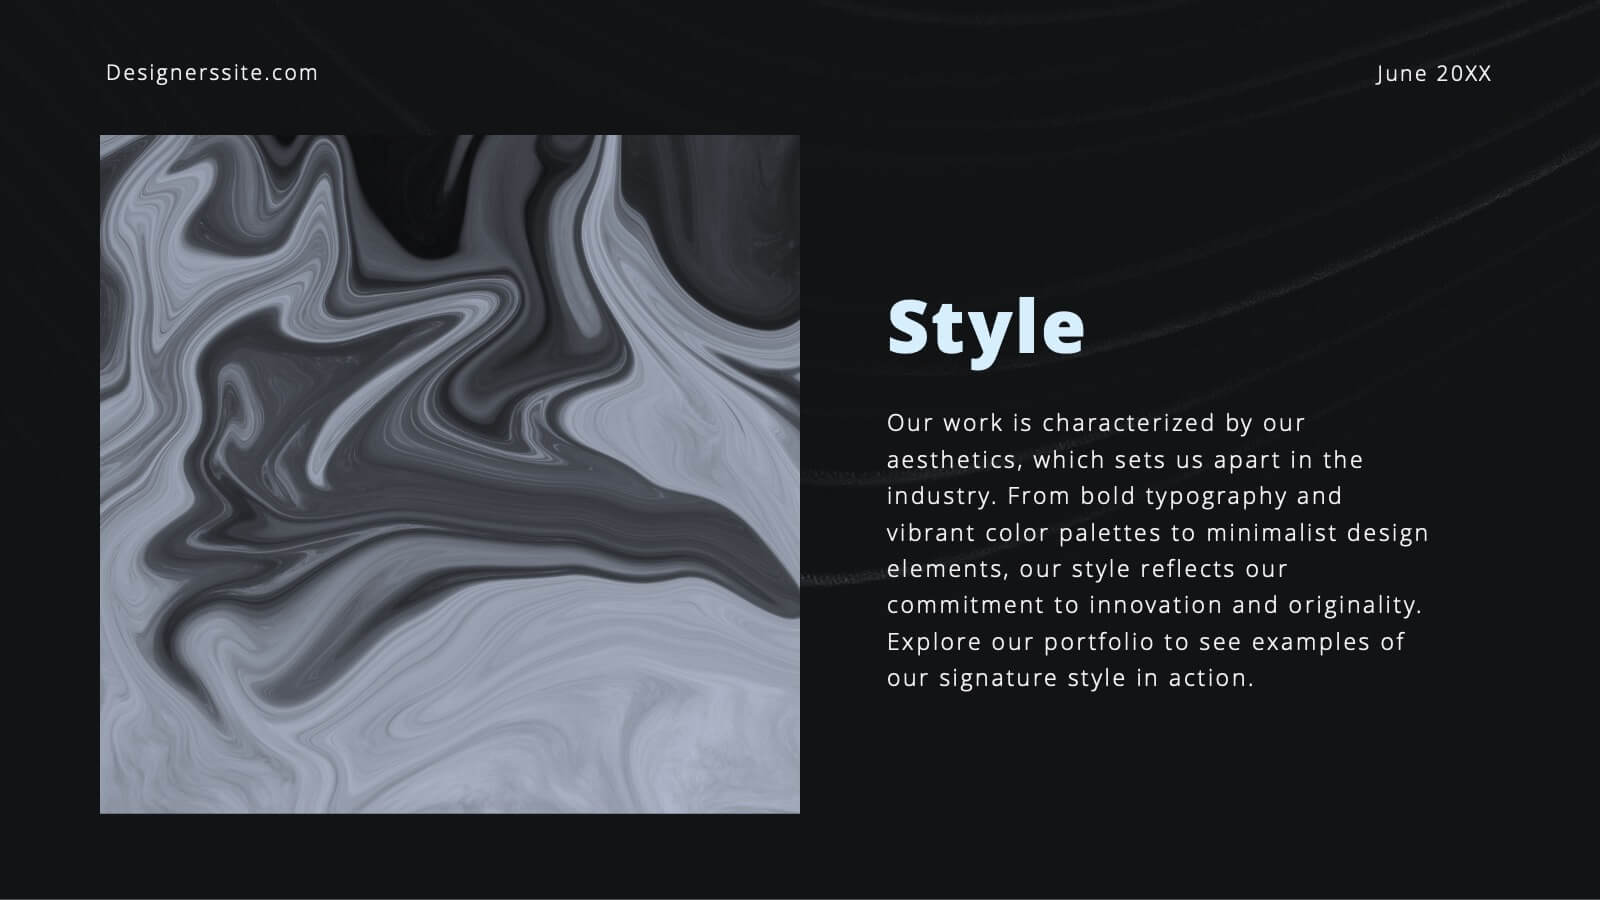
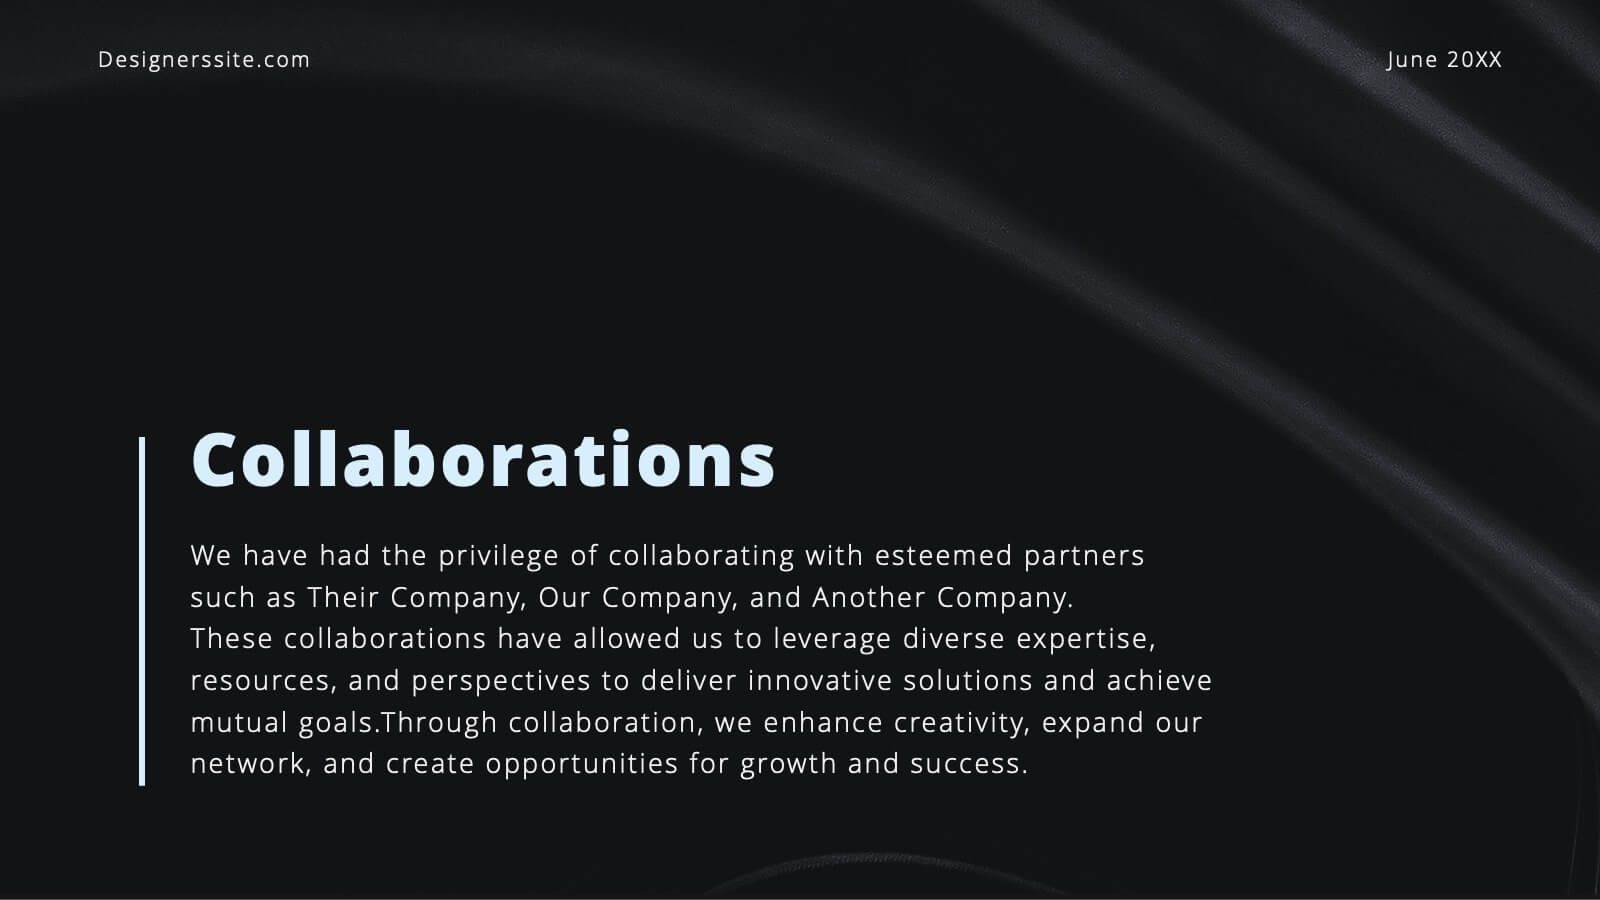
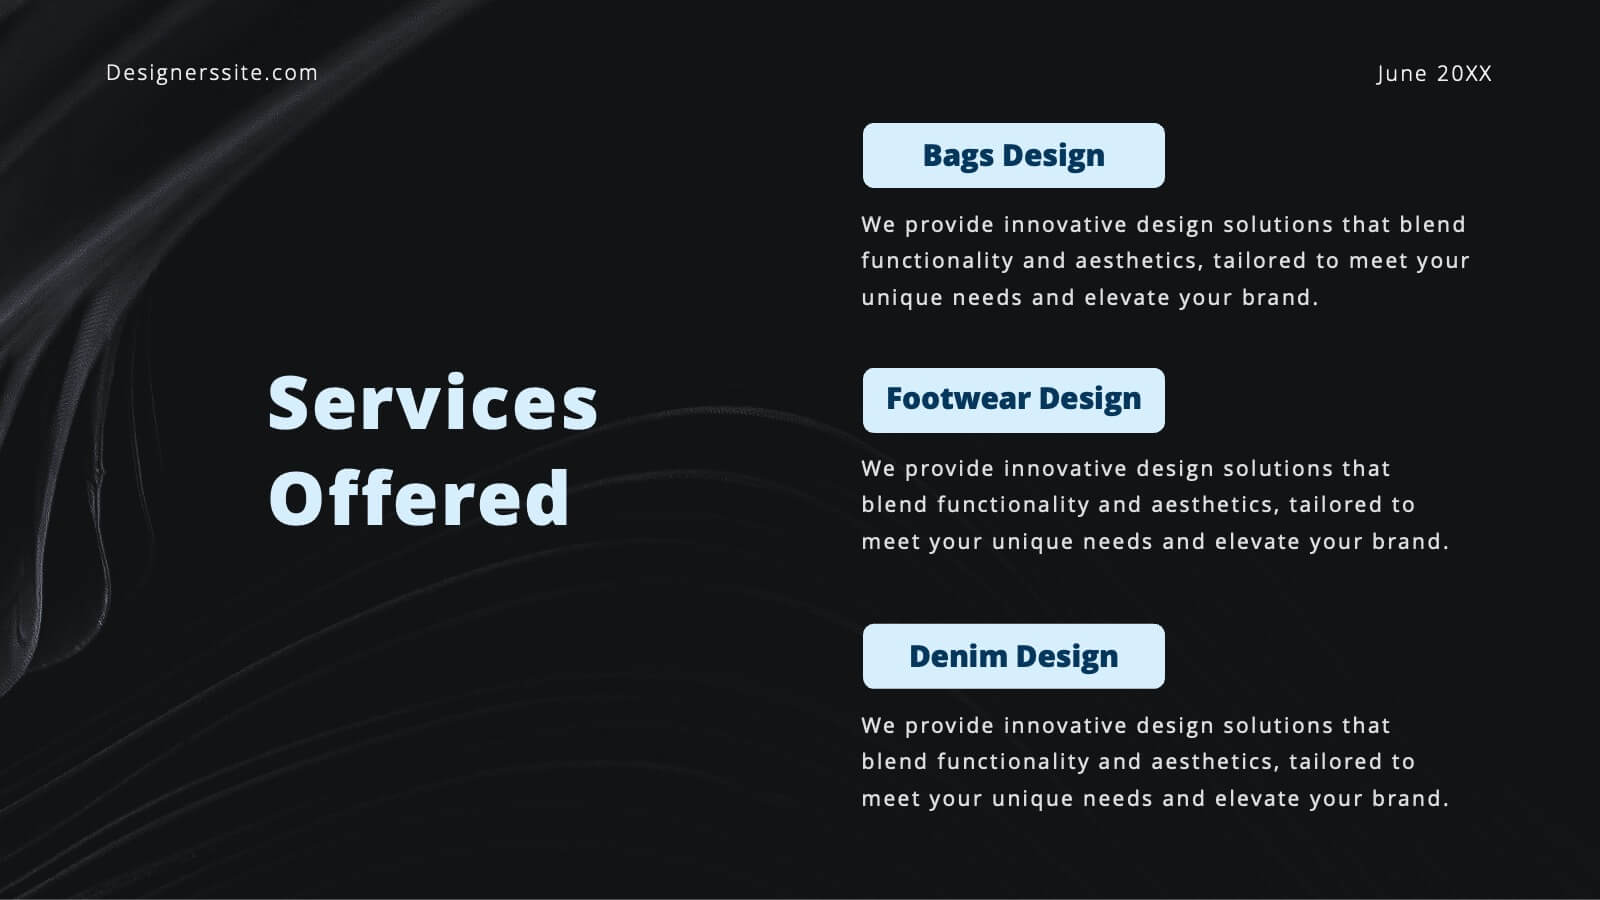
Flare Creative Portfolio Presentation
Showcase your creative work with this elegant portfolio template! Perfect for highlighting projects, client testimonials, and services offered. Ideal for artists, designers, and creatives aiming to impress clients and collaborators. Compatible with PowerPoint, Keynote, and Google Slides, this template ensures your portfolio is clear, professional, and visually stunning. Make your work shine!


6 diapositivas
Statistical Data Analysis Presentation
Delve into the details with the "Statistical Data Analysis" presentation templates, designed to simplify complex information into digestible insights. These templates feature interconnected gears symbolizing the intricate processes of data analysis, ideal for statisticians and analysts looking to present their findings effectively. Fully compatible with PowerPoint, Keynote, and Google Slides, they are a must-have for anyone presenting statistical data.


6 diapositivas
Revenue Growth Sales Slide Presentation
Showcase your business success with this Revenue Growth Sales Slide Presentation. The upward-curved arrow design highlights five key milestones, each with customizable titles, icons, and color accents. Perfect for illustrating sales performance, growth metrics, or financial forecasts. Easy to edit in PowerPoint, Keynote, or Google Slides—ideal for sales teams, analysts, and executives.


6 diapositivas
Product and Service Options
Clearly compare your offerings with this side-by-side product vs. service infographic. Perfect for illustrating feature breakdowns, pros and cons, or key differentiators between two business models. With six customizable points and modern icons, this layout is ideal for sales decks, marketing pitches, or strategy presentations. Fully editable in PowerPoint, Keynote, and Google Slides.


22 diapositivas
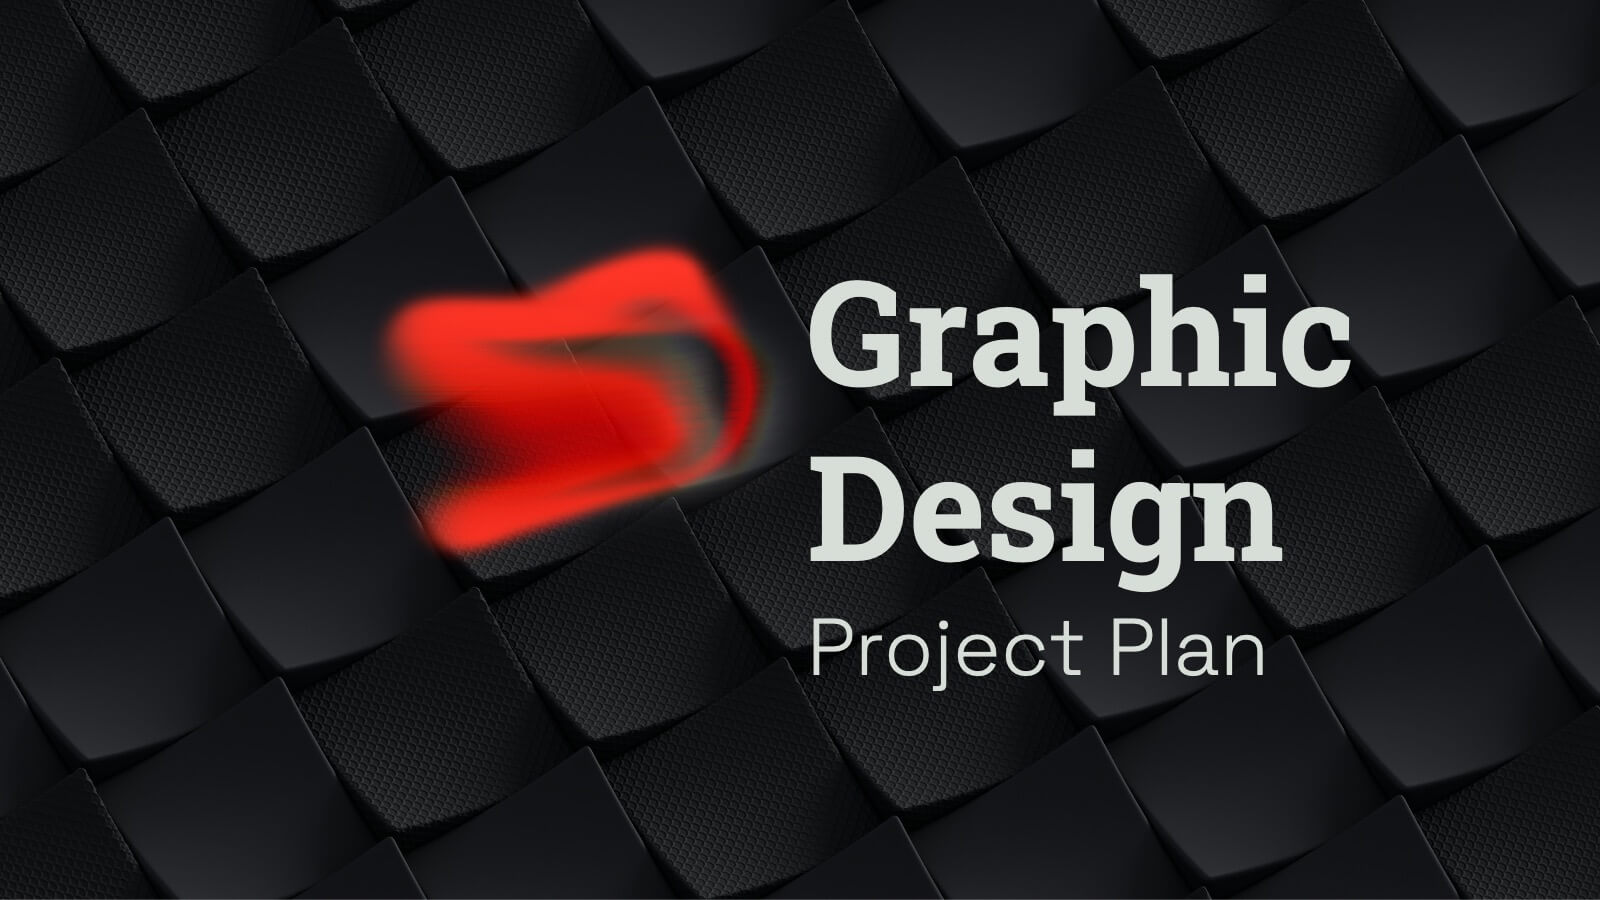
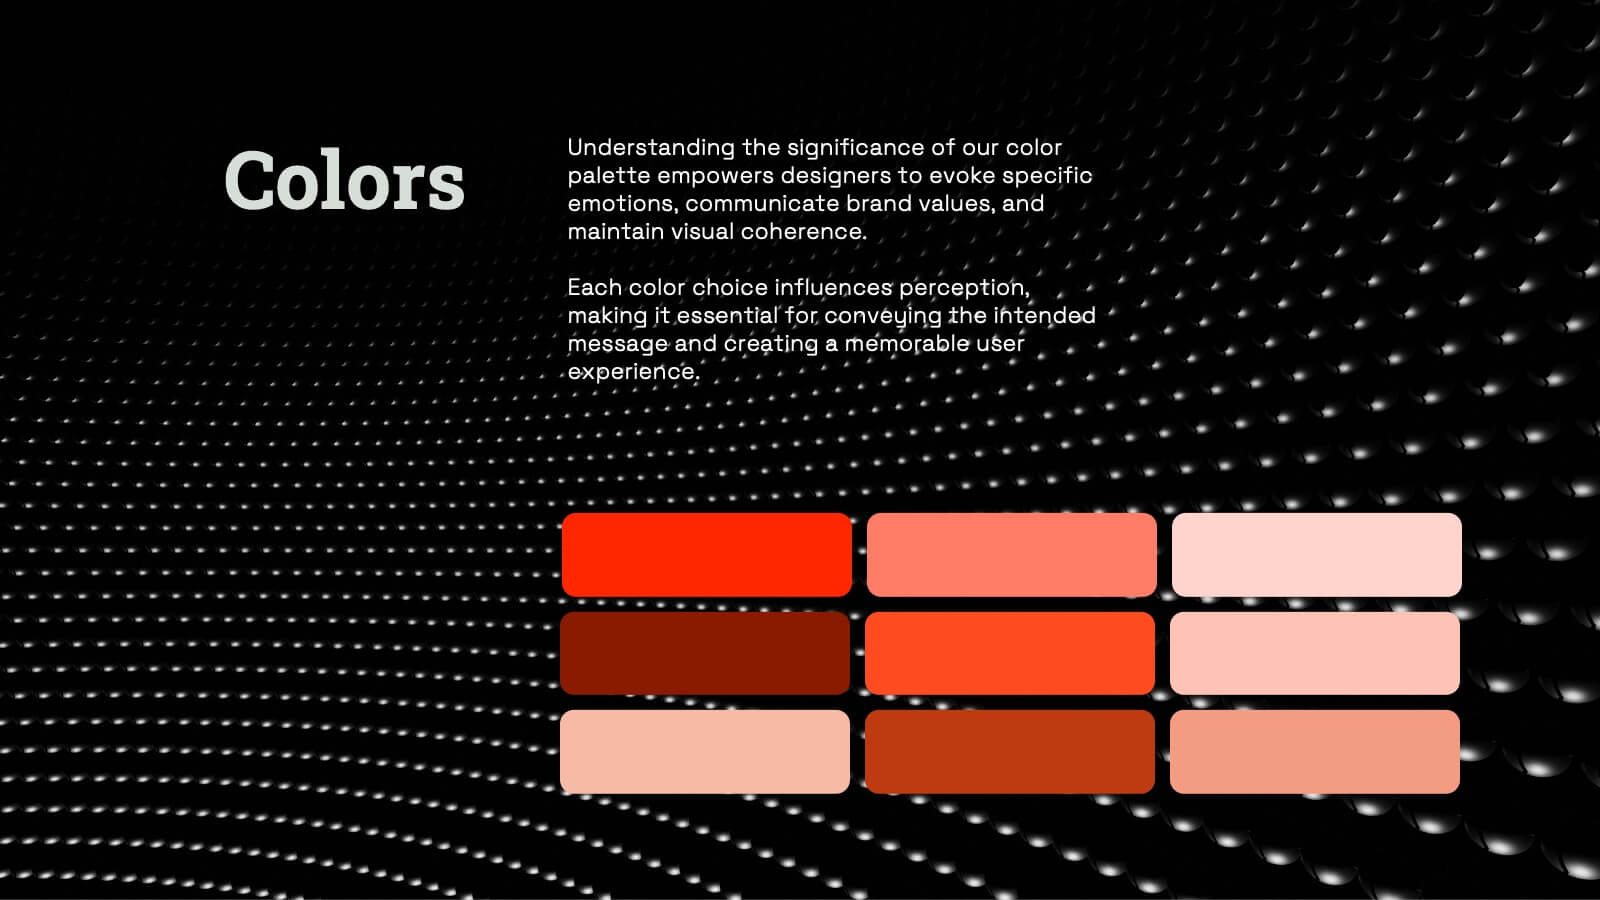
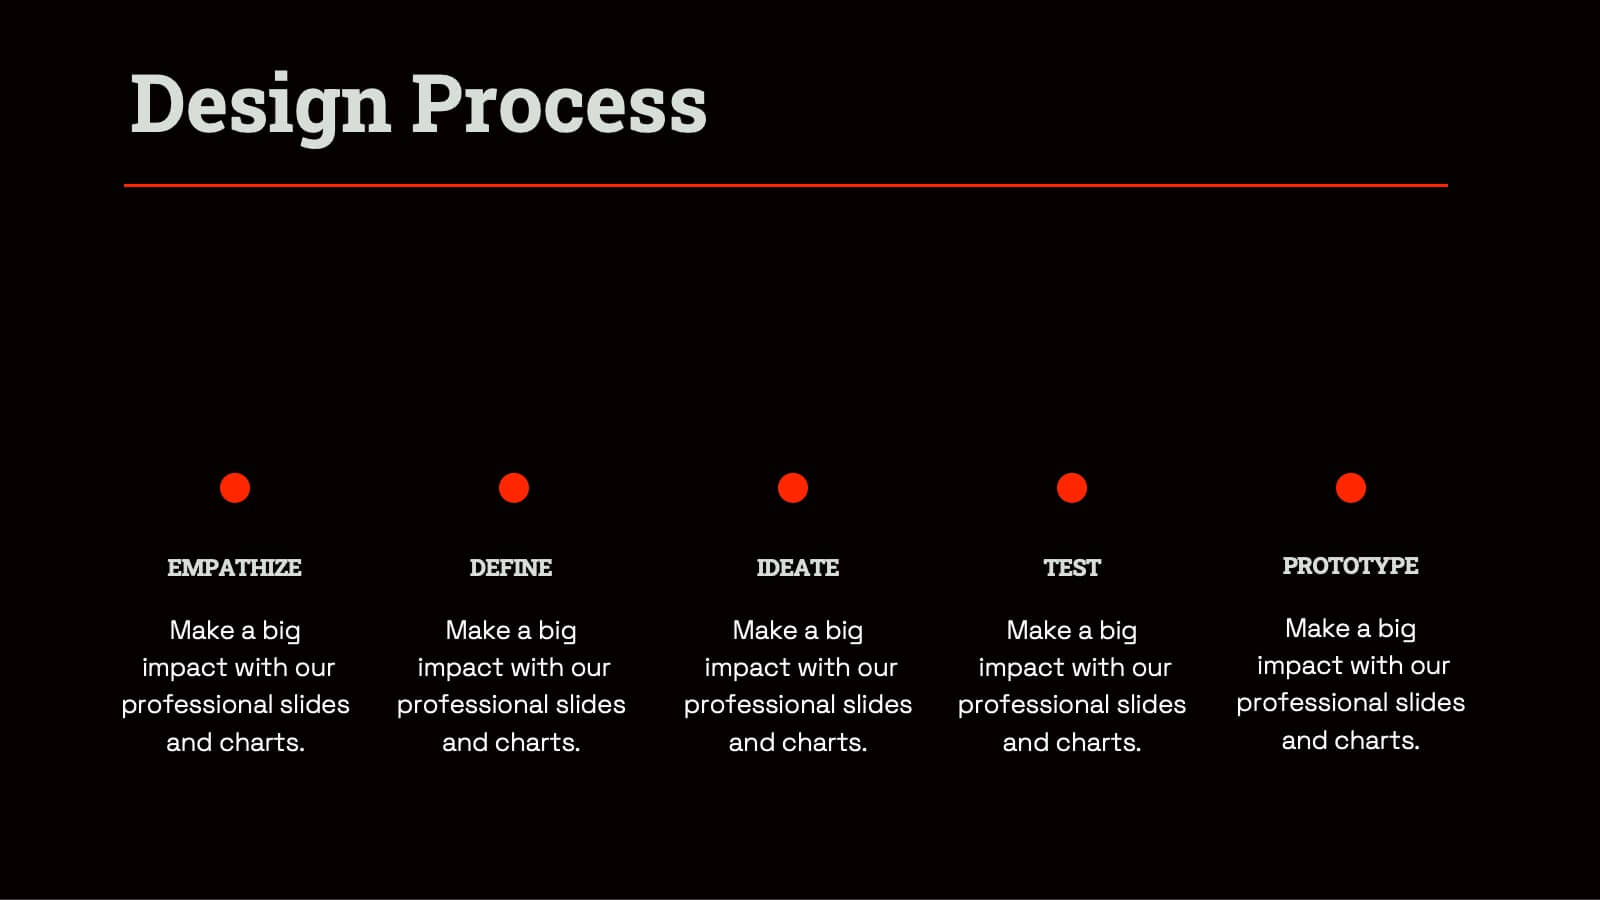
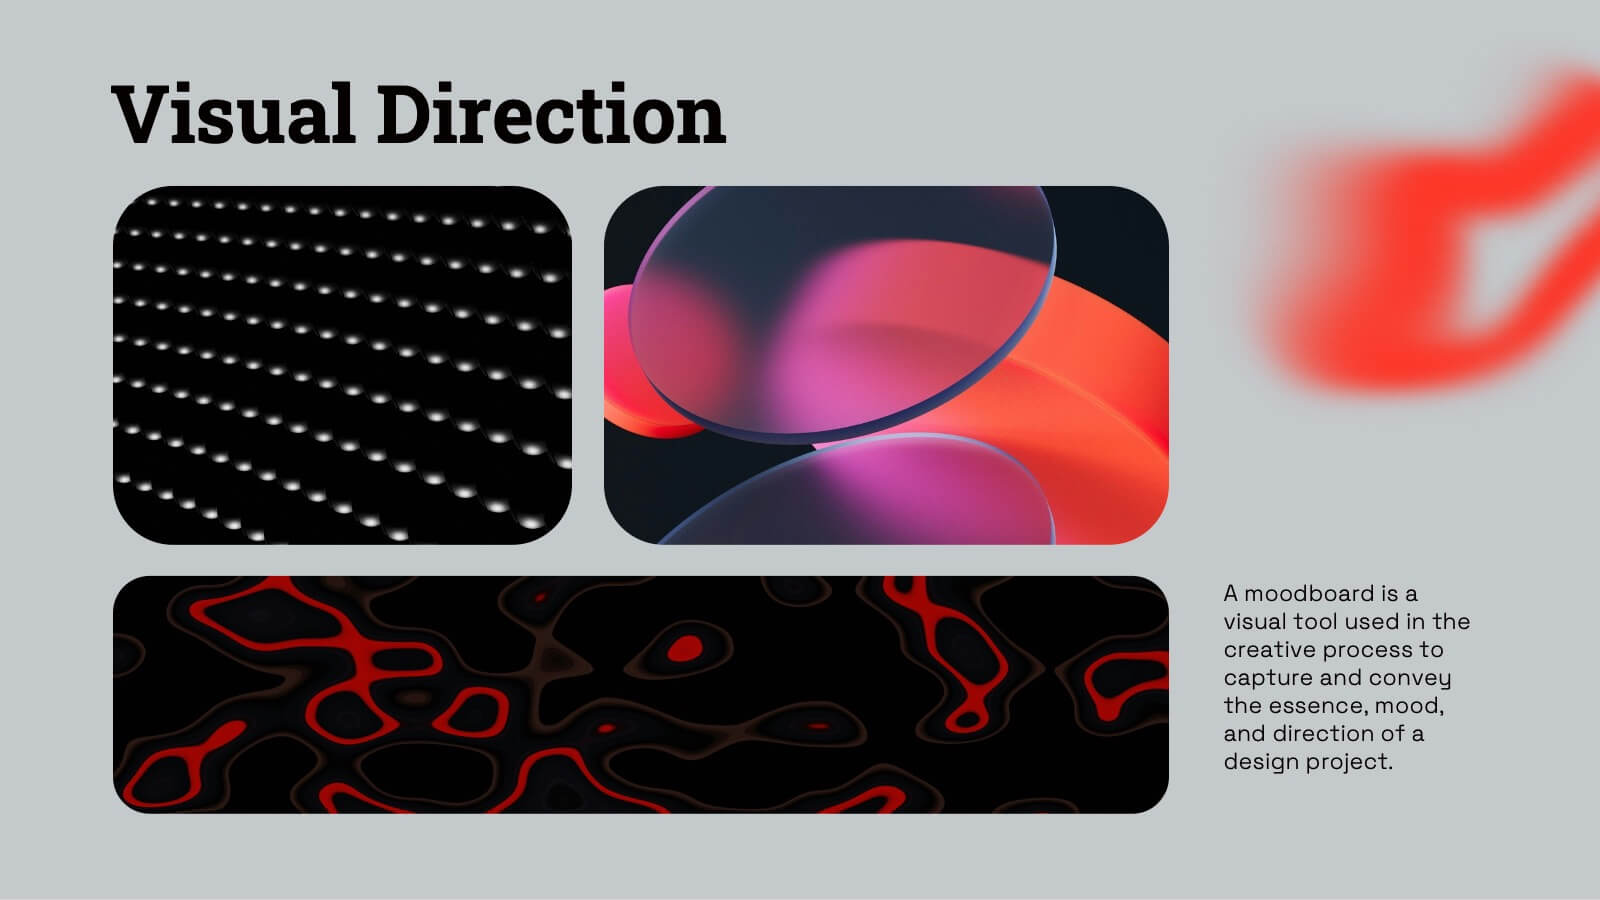
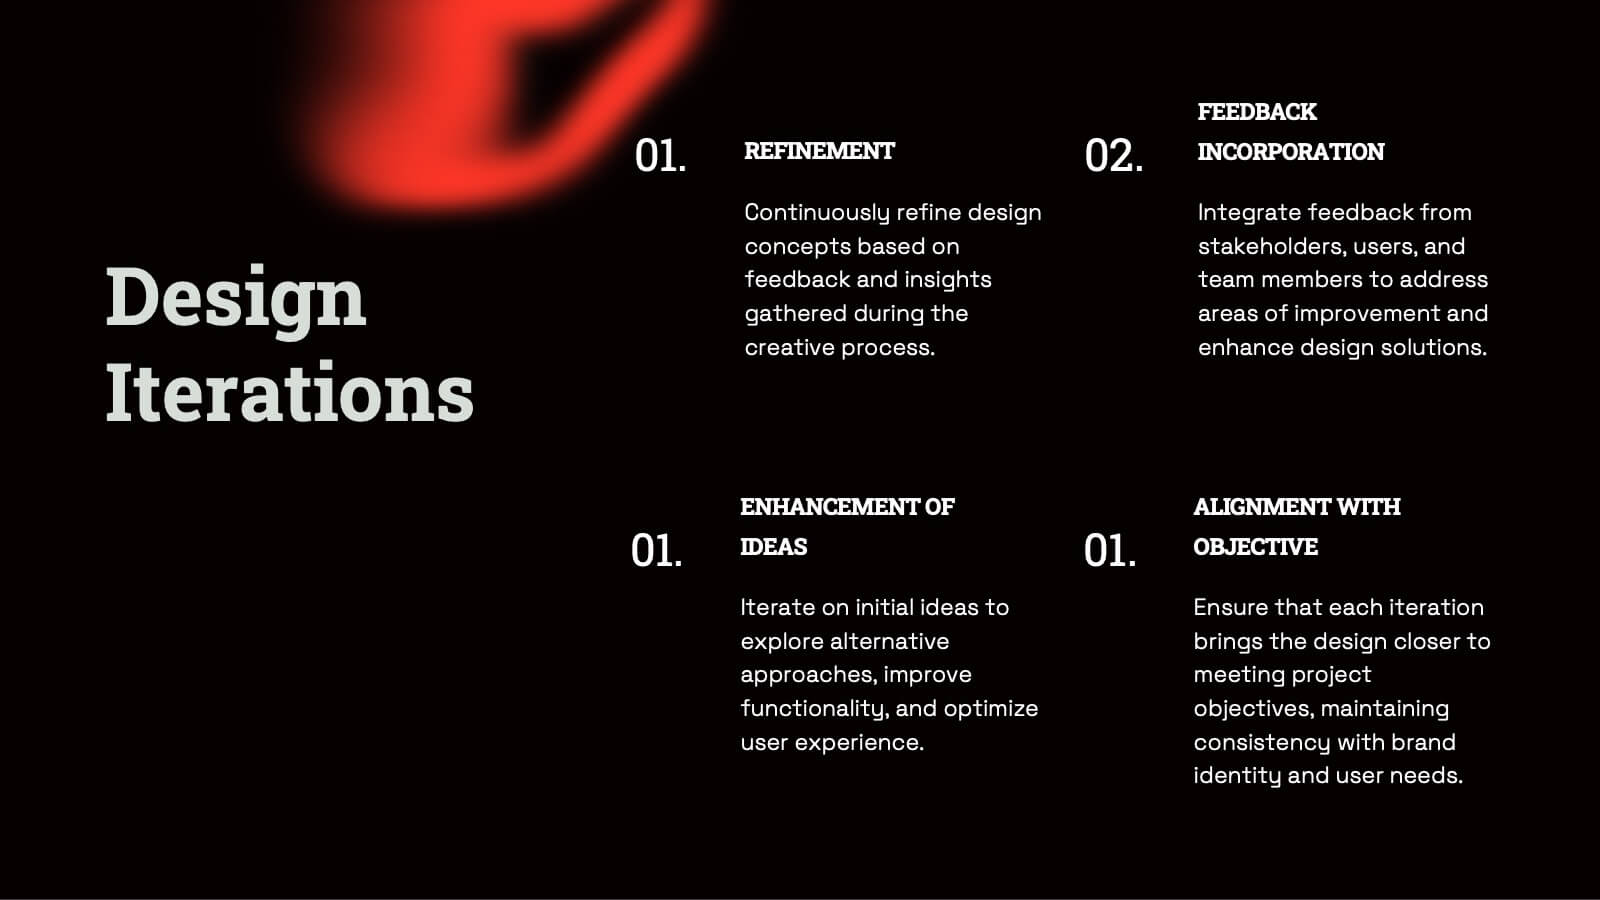
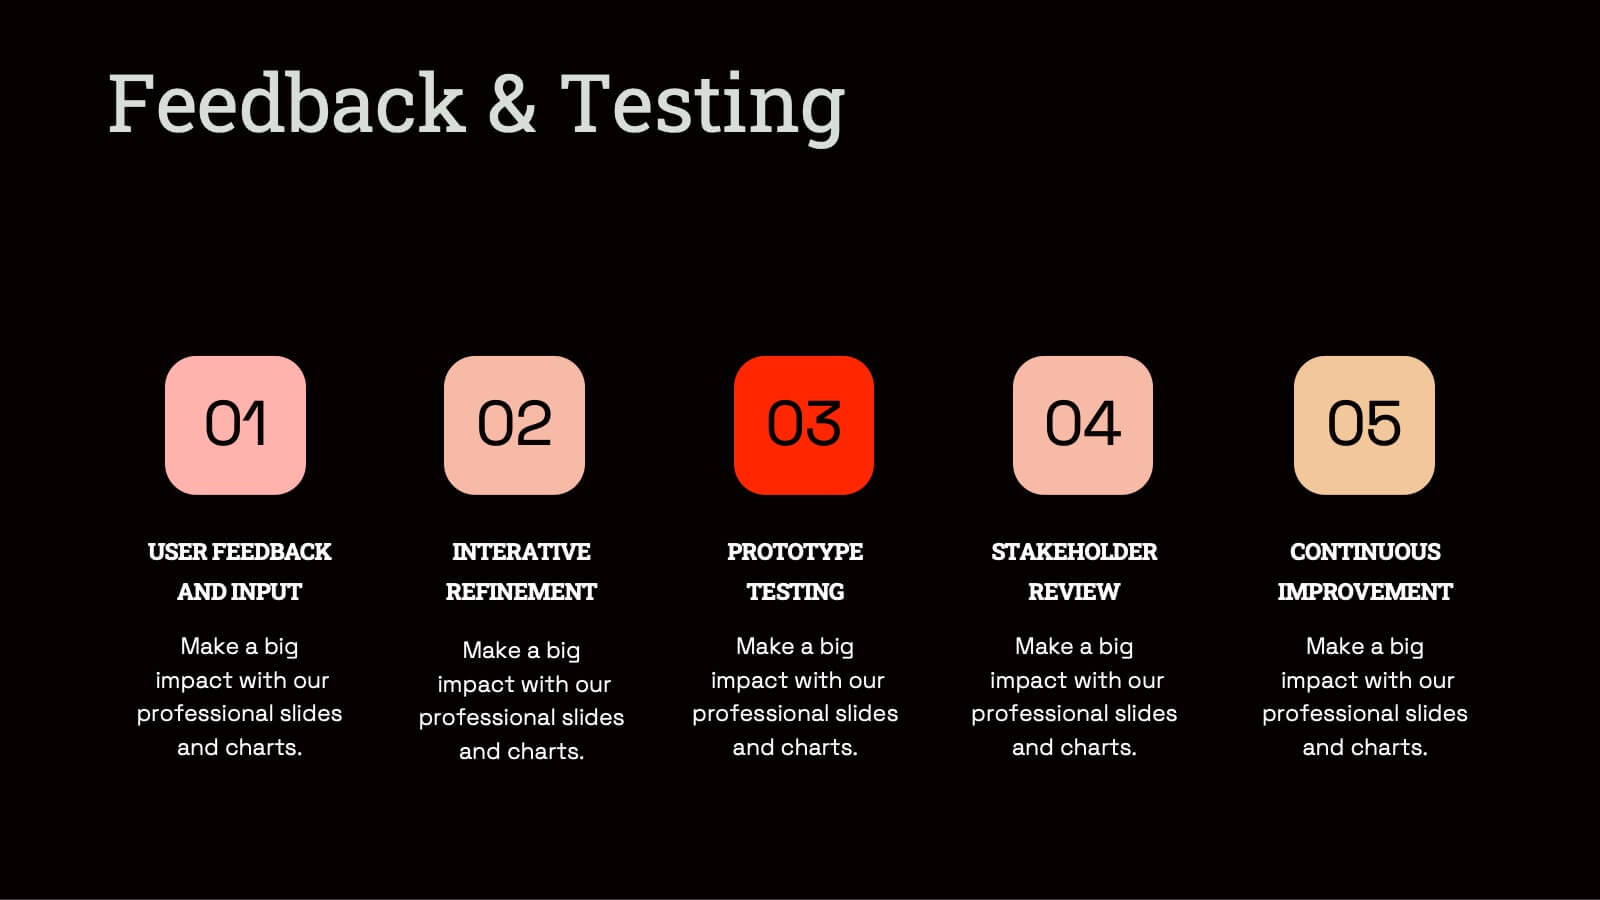
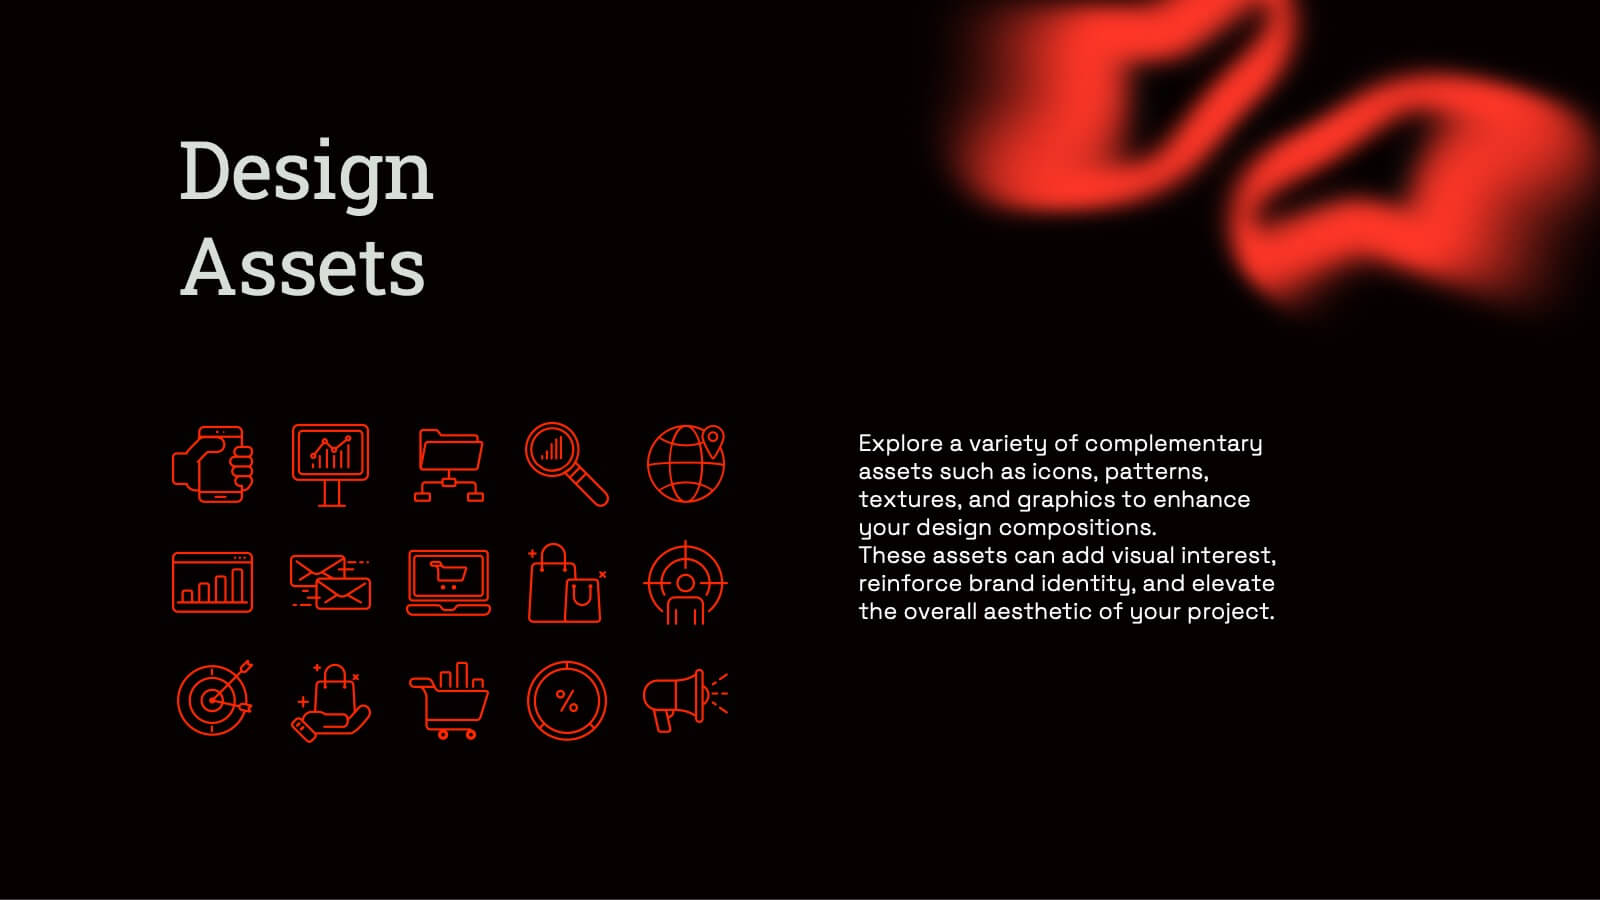
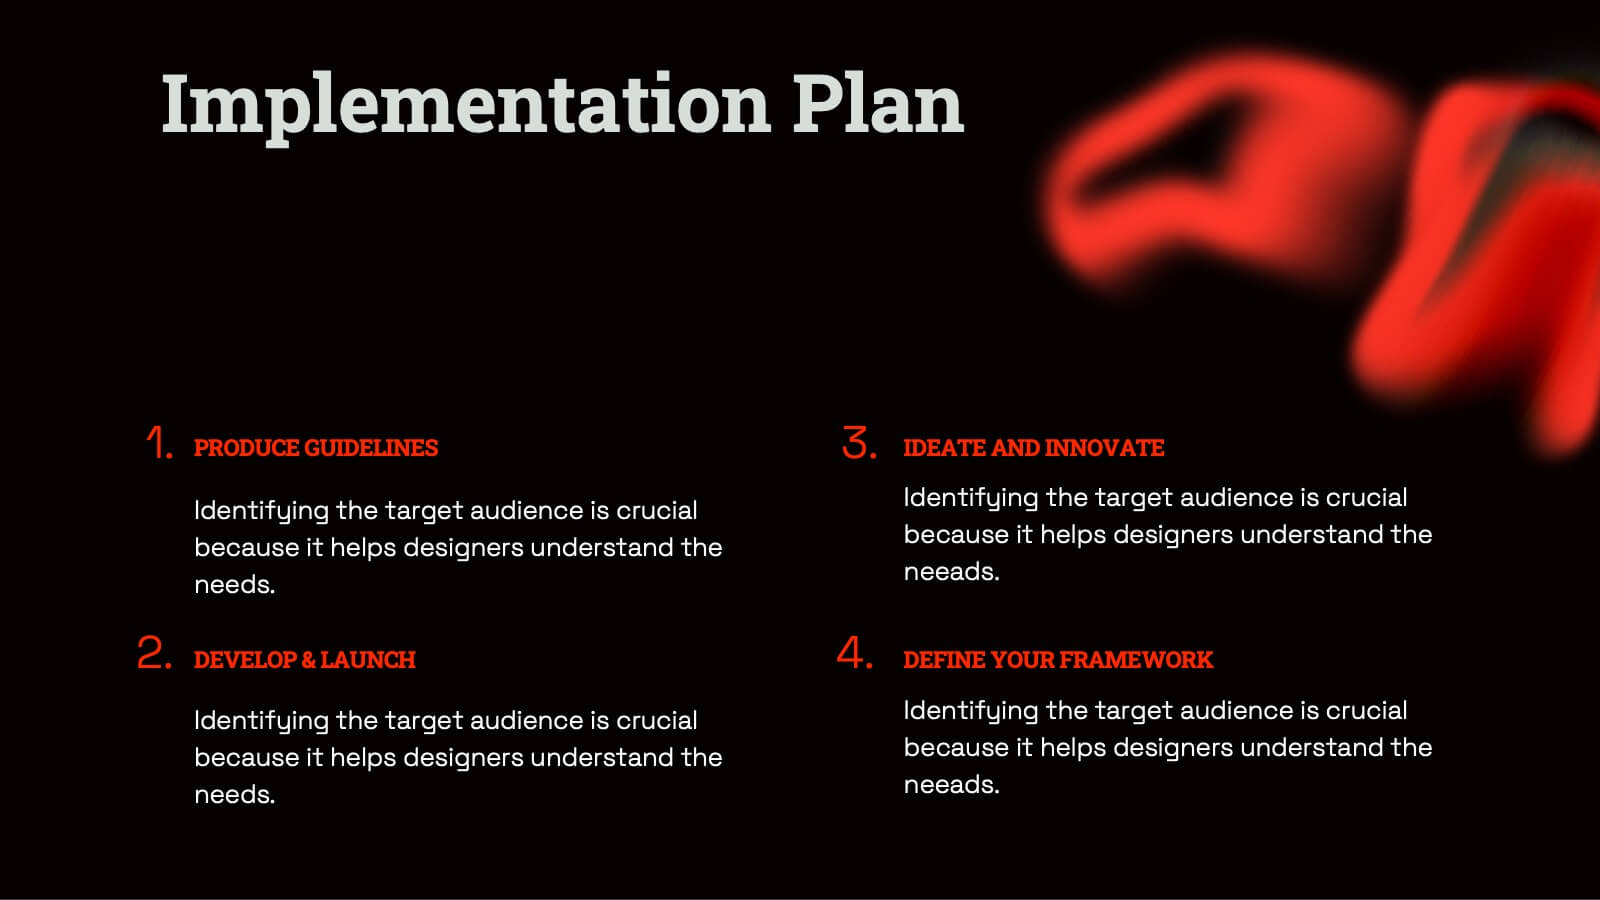
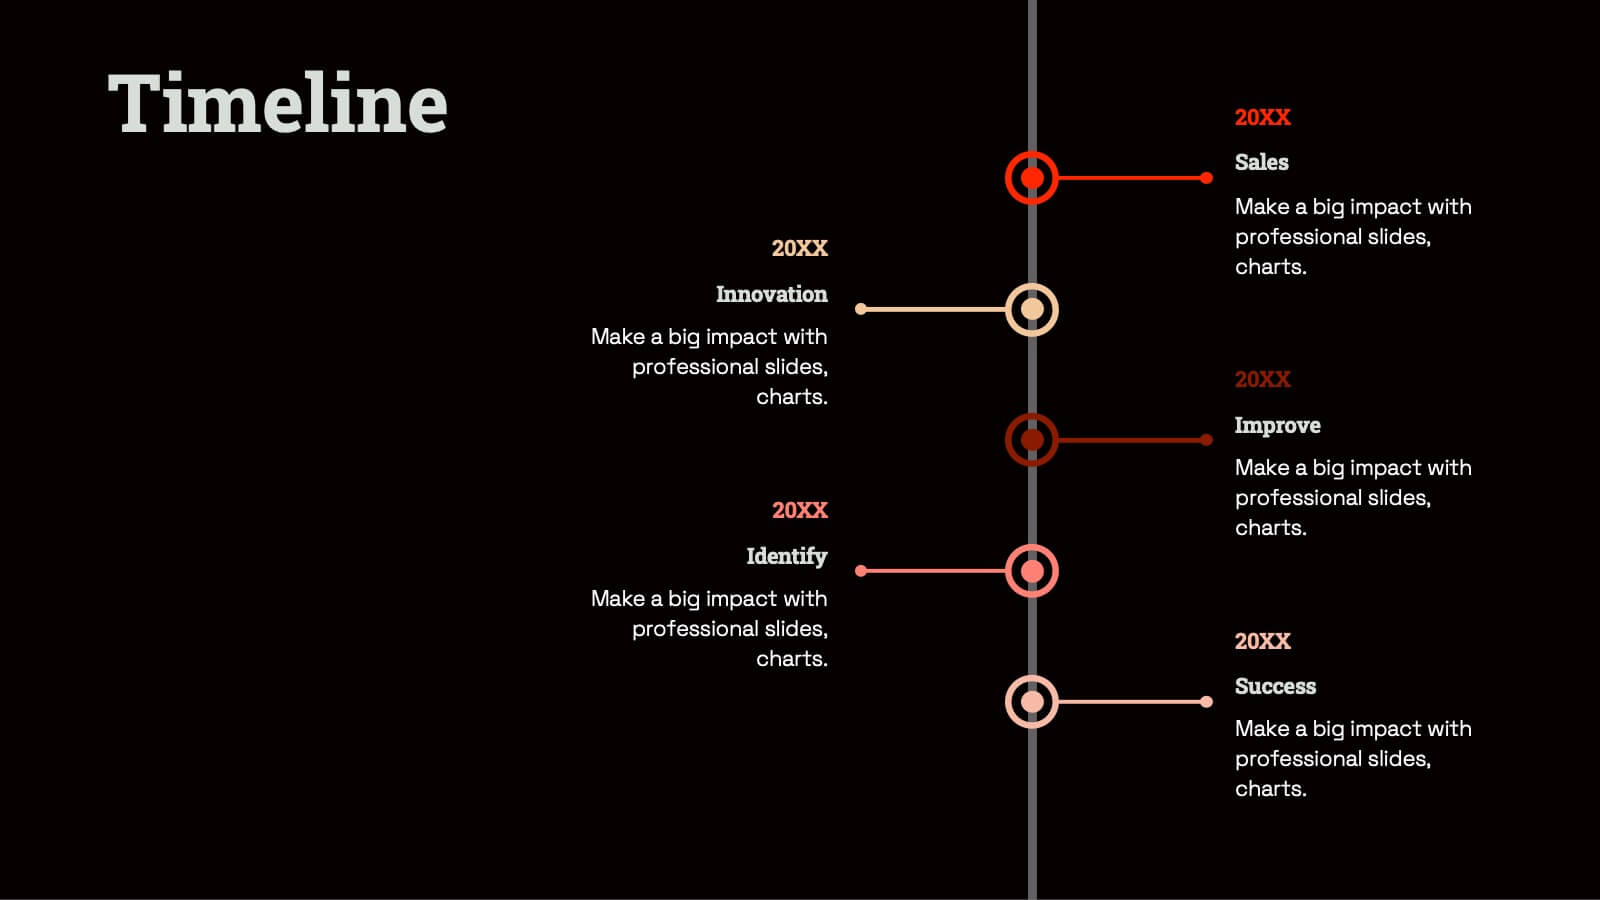
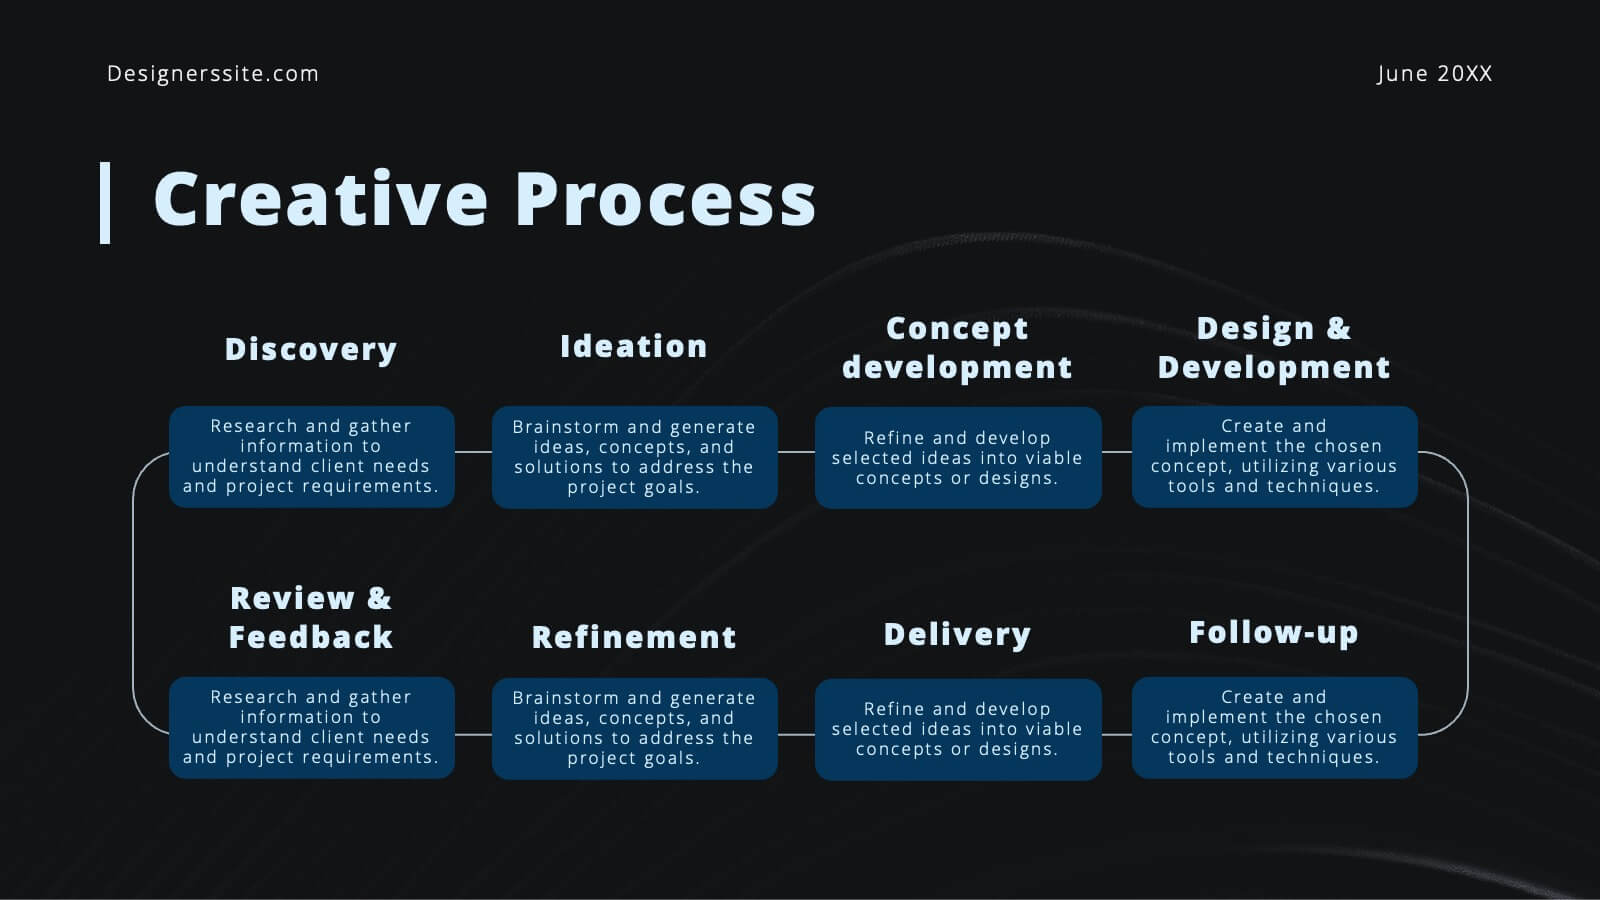
Radiant Graphic Design Project Plan Presentation
Unleash your creativity with this bold and dynamic graphic design project plan template! Perfect for showcasing design elements, textures, and typography, this template guides you through every phase, from concept development and prototyping to feedback and final presentations. Ideal for visual direction and design asset management, it’s fully compatible with PowerPoint, Keynote, and Google Slides for seamless use.


2 diapositivas
Blue Ocean Strategy Map Presentation
Make your message stand out with a clean, visual map that instantly clarifies where opportunities lie. This presentation helps you compare value factors side-by-side, reveal market gaps, and highlight strategic advantages in a simple, structured format. Fully customizable and compatible with PowerPoint, Keynote, and Google Slides.


4 diapositivas
Skills Development Training Schedule Presentation
Organize learning paths with clarity using the Skills Development Training Schedule Presentation. This structured grid layout helps you map out training modules by skill category and timeline. Ideal for internal workshops, L&D planning, or certification programs. Fully editable in PowerPoint, Keynote, Google Slides, or Canva for seamless customization.


20 diapositivas
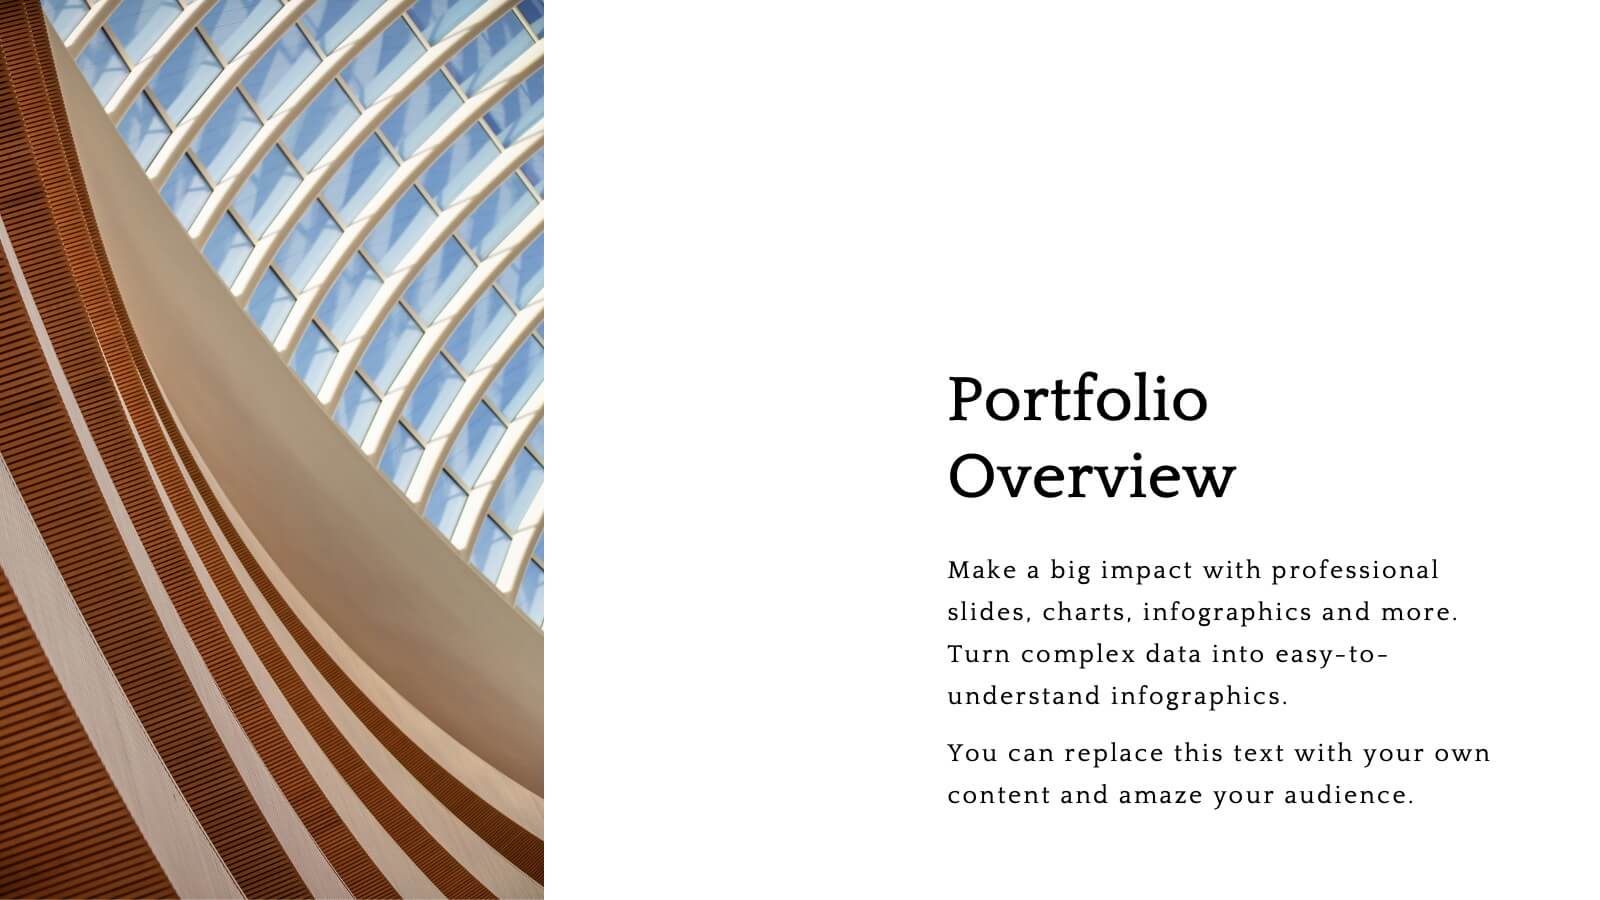
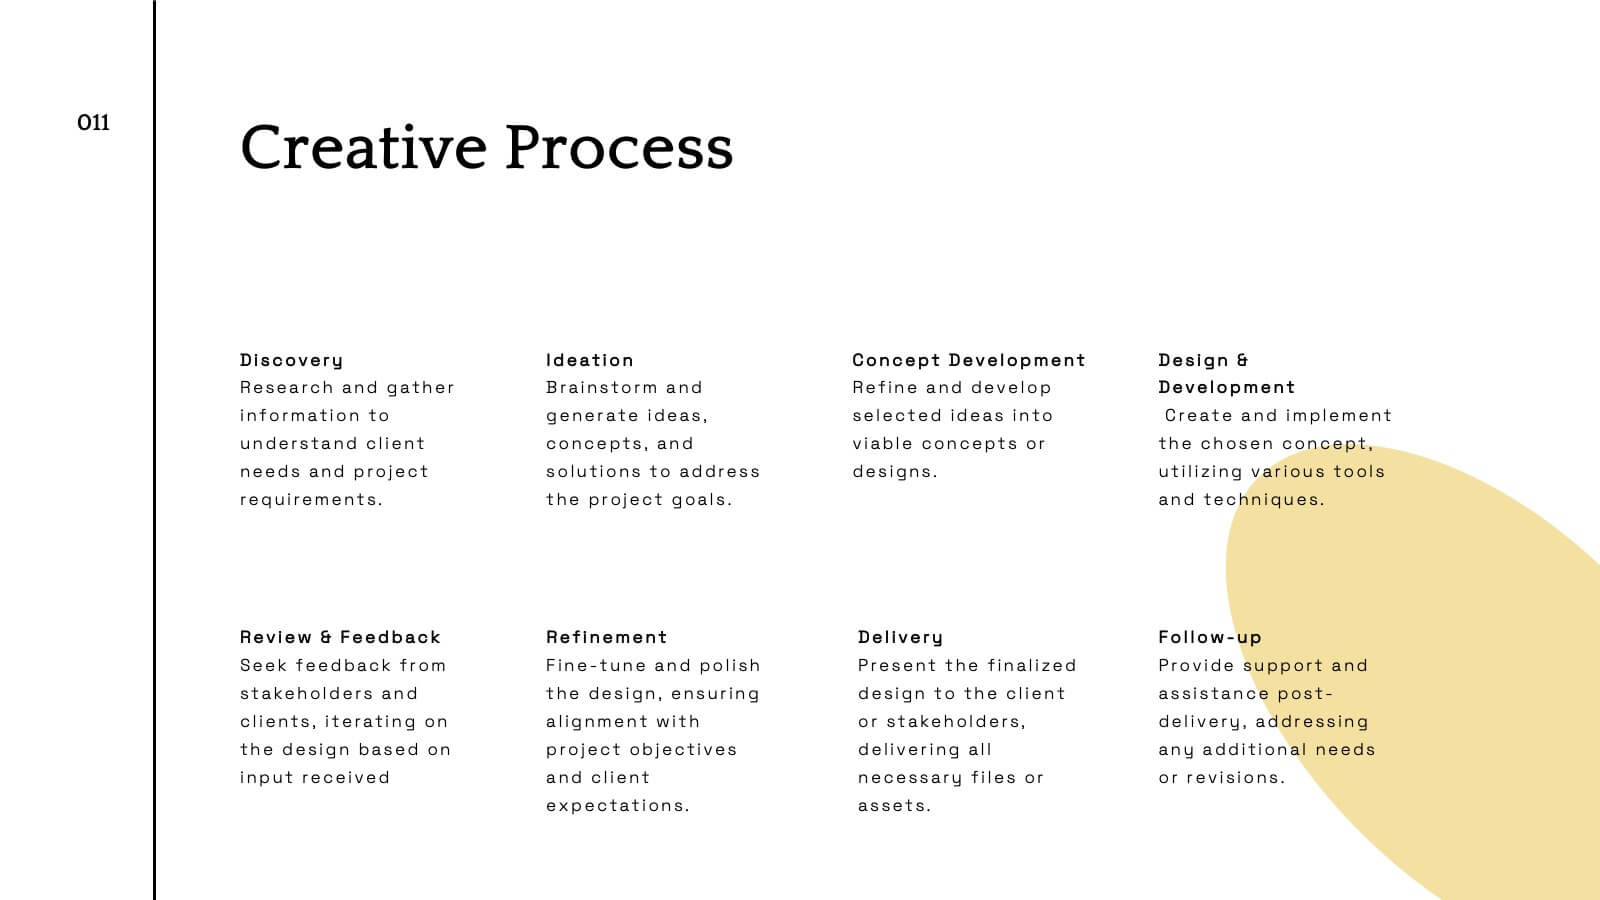
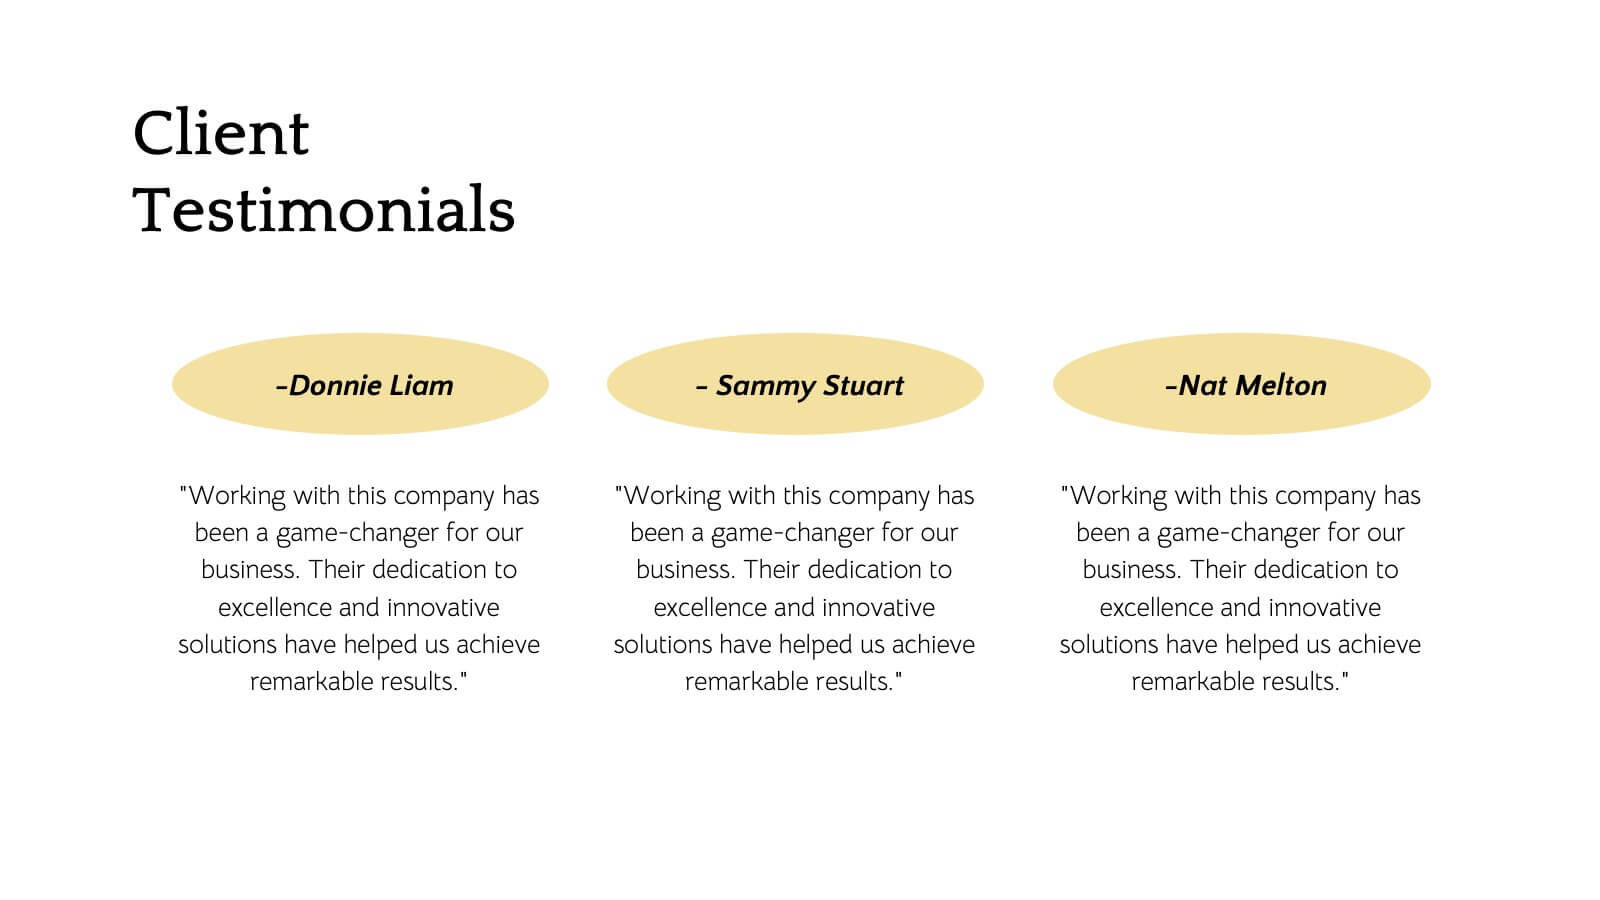
Bravo Creative Portfolio Presentation
Showcase your creative prowess with this sleek, modern portfolio presentation template. Perfect for highlighting featured projects, client testimonials, and your creative process, this template ensures your work shines. Its stylish design and professional layout make it ideal for impressing potential clients and collaborators. Compatible with PowerPoint, Keynote, and Google Slides, it's versatile for any platform.


10 diapositivas
Business Planning and Risk Assessment Presentation
Visualize risk levels and strategic priorities with this matrix-style business planning template. Ideal for mapping uncertainties against impact and likelihood, it supports clear, data-driven decisions. Fully customizable in PowerPoint, Keynote, and Google Slides—perfect for risk reports, operational planning, and stakeholder communication in corporate, finance, or project management settings.


6 diapositivas
Customer Journey Mapping with Buyer Persona Presentation
Clearly visualize the customer experience across all touchpoints with this structured journey mapping slide. Featuring a central buyer persona graphic and six customizable steps with icons, this layout helps you break down each stage of the customer path. Perfect for UX strategy, customer service insights, and product development. Fully editable and compatible with PowerPoint, Keynote, and Google Slides.


7 diapositivas
RACI Matrix Infographic Presentation Template
A RACI Matrix Infographic is a visual representation of the RACI model, which is used to clarify roles and responsibilities in an organization. The RACI model stands for Responsible, Accountable, Consulted, and Informed, and is a framework for defining the relationships between individuals and tasks in a project. This infographic displays a visual representation of the RACI matrix, showing the roles and responsibilities of each topic in a clear and organized manner. This Infographic can serve as a useful tool for managers and teams, as it can help to ensure clear communication and organization.


7 diapositivas
Porter's Five Forces Analysis Infographic
Unveil the key elements influencing your industry with Porter's Five Forces Analysis Infographic. Drenched in vibrant shades of yellow, blue, and white, this template offers a lucid visualization of the five crucial forces that determine the competitive intensity in the market. Ideal for business analysts, strategy planners, or management students, it offers a nuanced understanding of market dynamics. Its engaging design captures attention while facilitating comprehensive discussions on potential opportunities or threats. With compatibility across PowerPoint, Keynote, and Google Slides, it promises smooth transitions during presentations.