


Características


¿Tienes alguna pregunta?
Recomendar


4 diapositivas
Employee and Team Performance Analysis
Visualize individual and team contributions with this clear and structured performance analysis template. Showcase key metrics, employee growth, and team achievements using easy-to-read layouts and progress indicators. Ideal for HR reports, performance reviews, and team evaluations. Fully editable in PowerPoint, Keynote, and Google Slides.


6 diapositivas
Geometric Patterns Infographics
Step into the fascinating realm of geometric patterns! This infographic invites you to explore the captivating world of shapes and symmetries. From the mesmerizing allure of intricate designs to the mathematical precision behind each pattern, we'll reveal the secrets that make geometric patterns a timeless art form. Delve into the core principles of geometric patterns. Gain insights into the geometry behind these intricate designs, from basic shapes like circles and squares to more complex constructions. Uncover the history and cultural significance of these patterns, from ancient civilizations to contemporary art and design. With this captivating infographic, compatible with PowerPoint, Keynote, and Google Slides, sharing your enthusiasm for geometric patterns has never been easier. Empower yourself with the knowledge to appreciate and create these mesmerizing designs. Dive into the world of geometric patterns and embark on a journey of artistic exploration and appreciation.


7 diapositivas
Business 3D Infographic
Bring a new dimension to your business presentations with our 3D Business Infographics. These dynamic visuals are perfect for professionals and educators who want to add depth to their data representation and make complex information more accessible. Our 3D Business Infographics collection features a range of formats, from layered pyramids to multidimensional bar graphs, allowing for innovative depictions of hierarchies, relationships, and progressions. Whether you're illustrating strategic frameworks, financial analysis, or project milestones, these graphics can enhance understanding and engagement. Customizable for any business context, these infographics are designed to stand out in reports, presentations, or educational materials. Their SEO-friendly nature ensures that your content is more likely to be seen and shared, extending your reach. Use these 3D infographics to make a strong visual impact that communicates your business concepts with clarity and creativity.


7 diapositivas
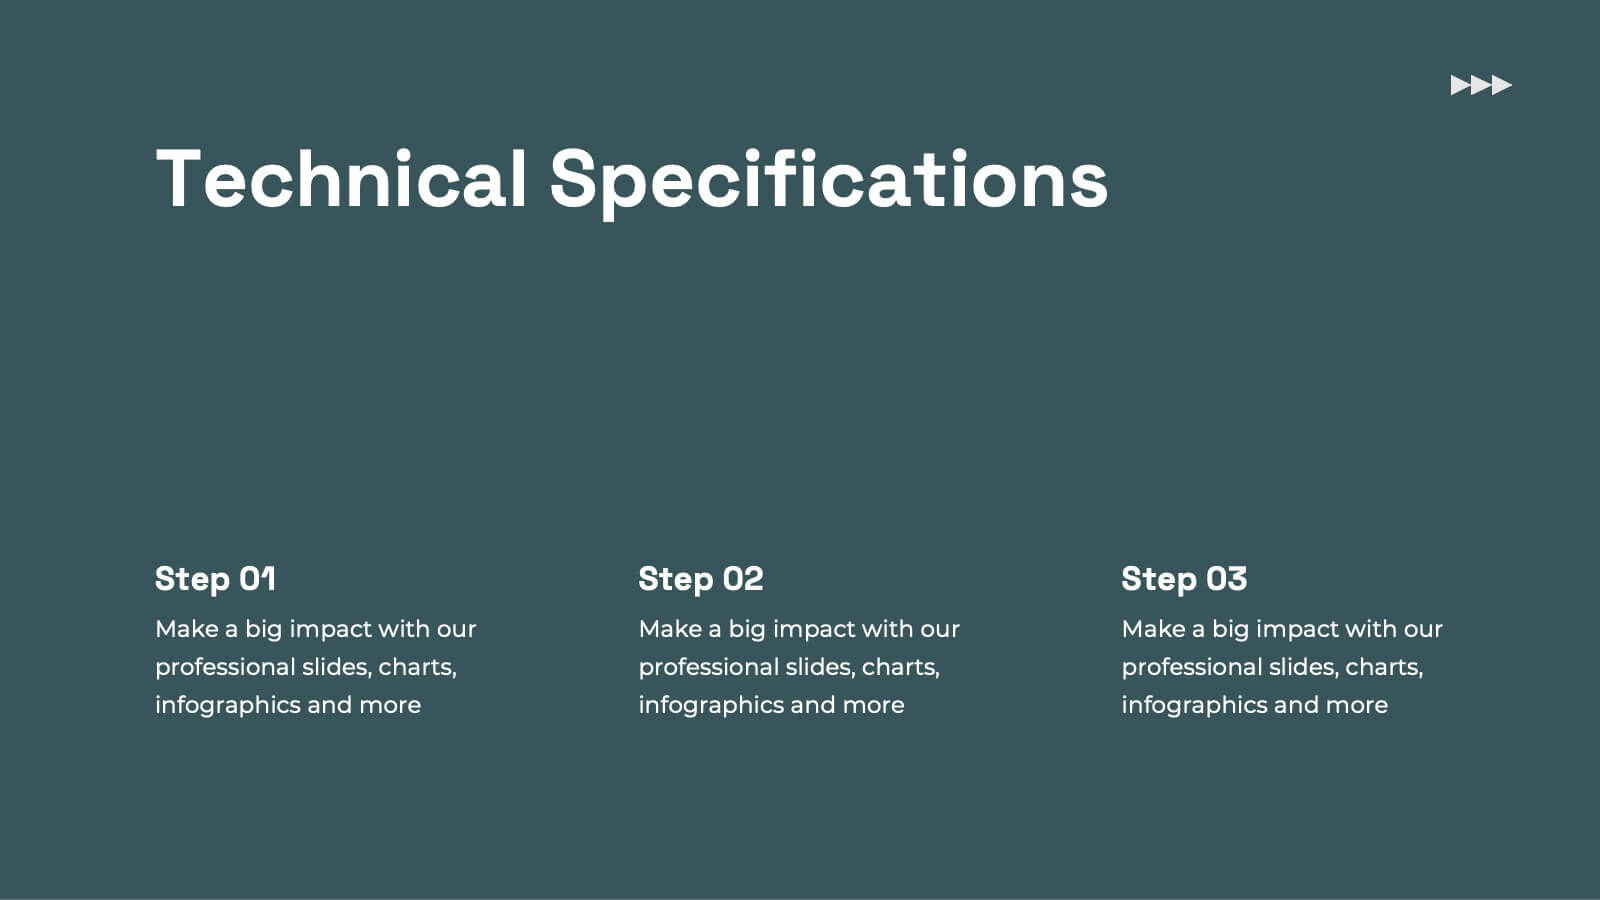
IT Enterprise Architecture Infographic
IT Architecture, is a structured framework used to conceptualize software, hardware, network infrastructure, and related technology components and their relationships within an organization. This infographic template serves as a visual compass navigating the intricate realm of Information Technology architecture. Compatible with Powerpoint, Keynote, and Google Slides. Let the elegant design and comprehensive content guide you through the foundational pillars of digital excellence. Present an architectural framework illustration, outlining the fundamental structure that supports an organization's digital journey.


19 diapositivas
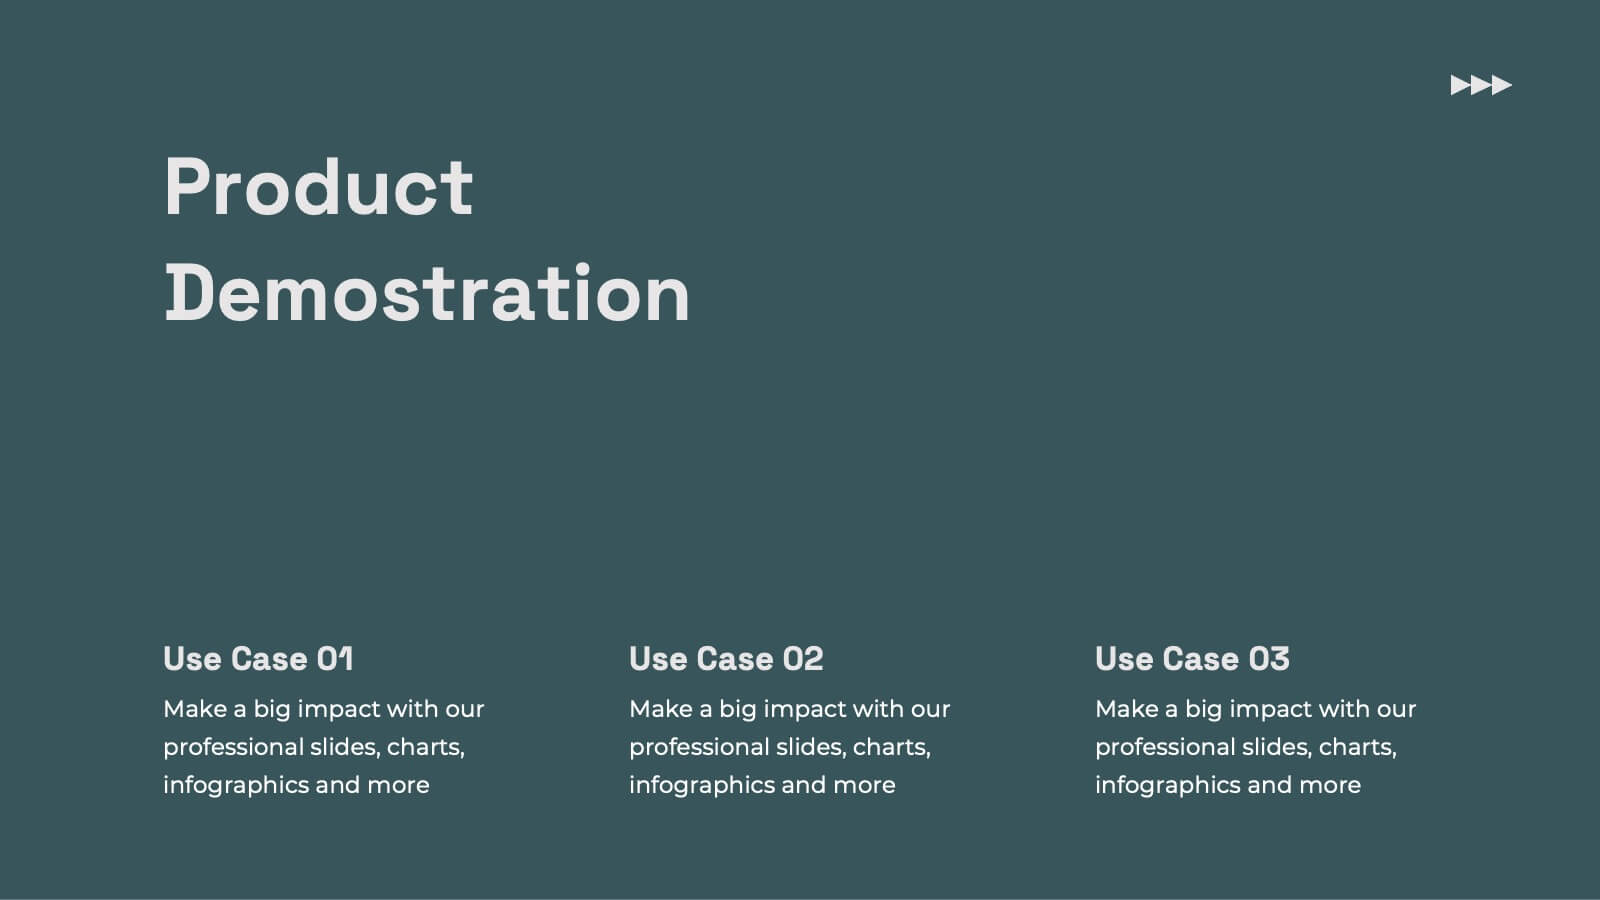
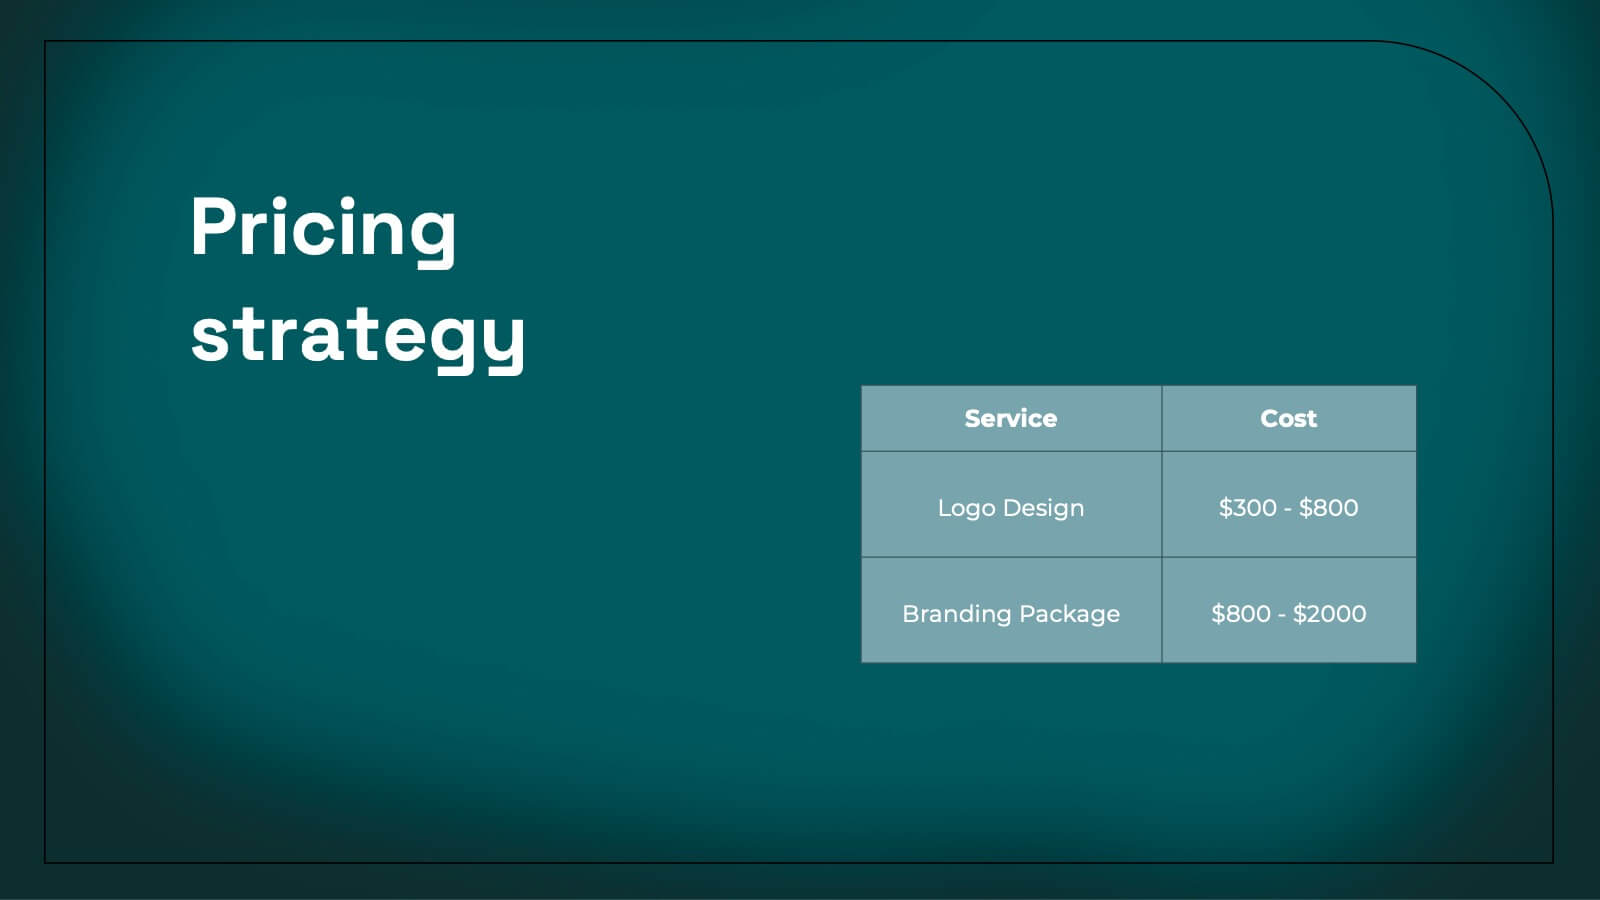
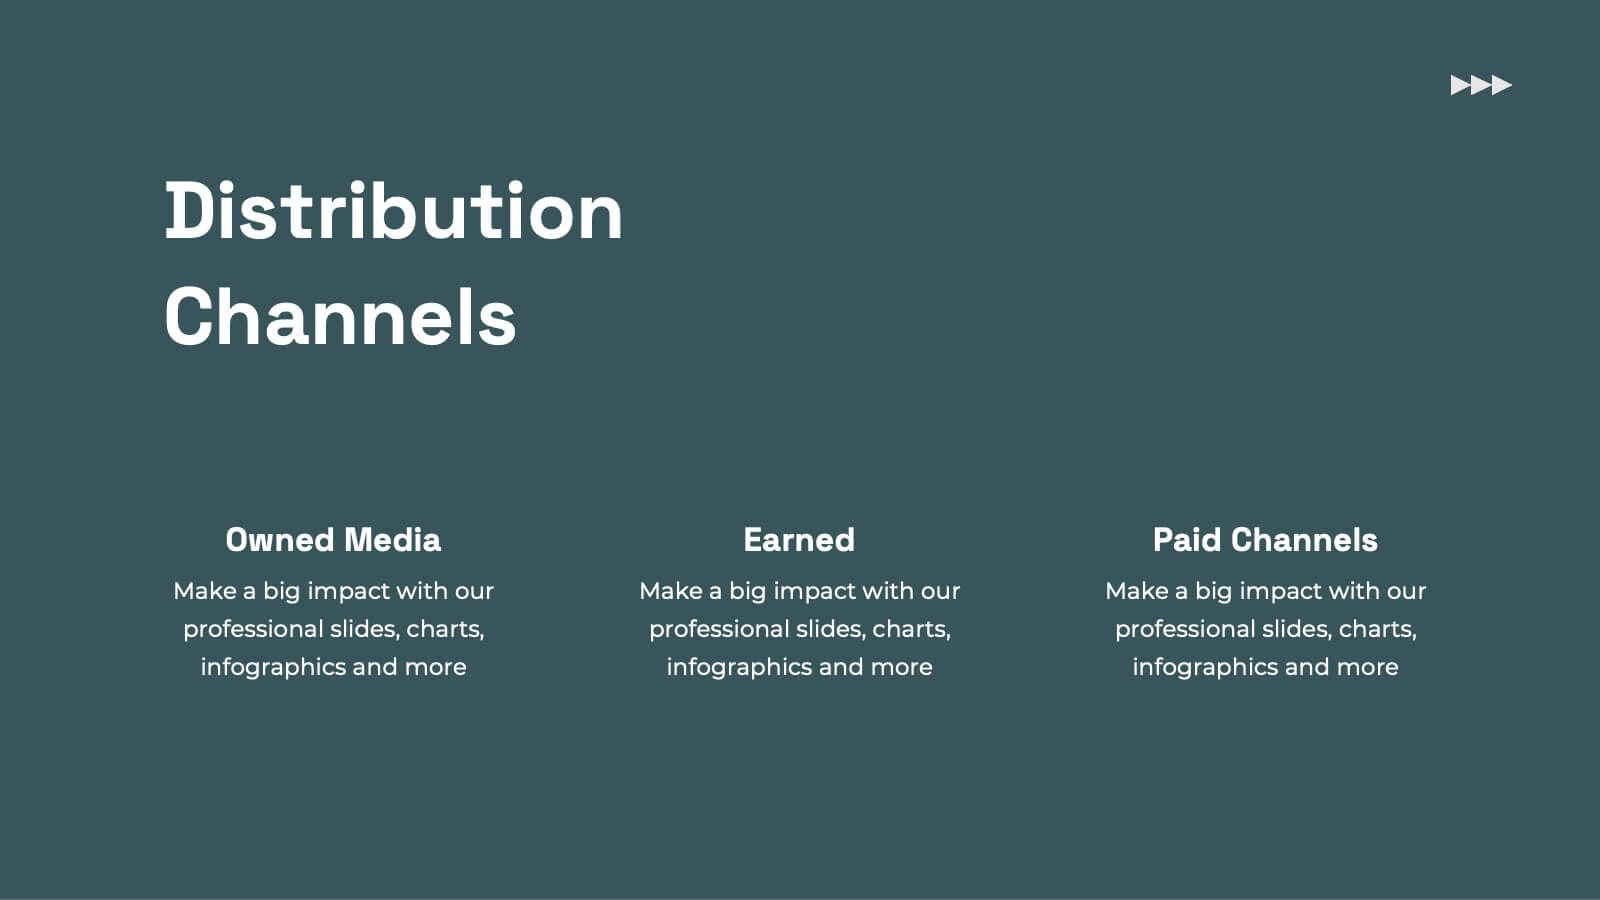
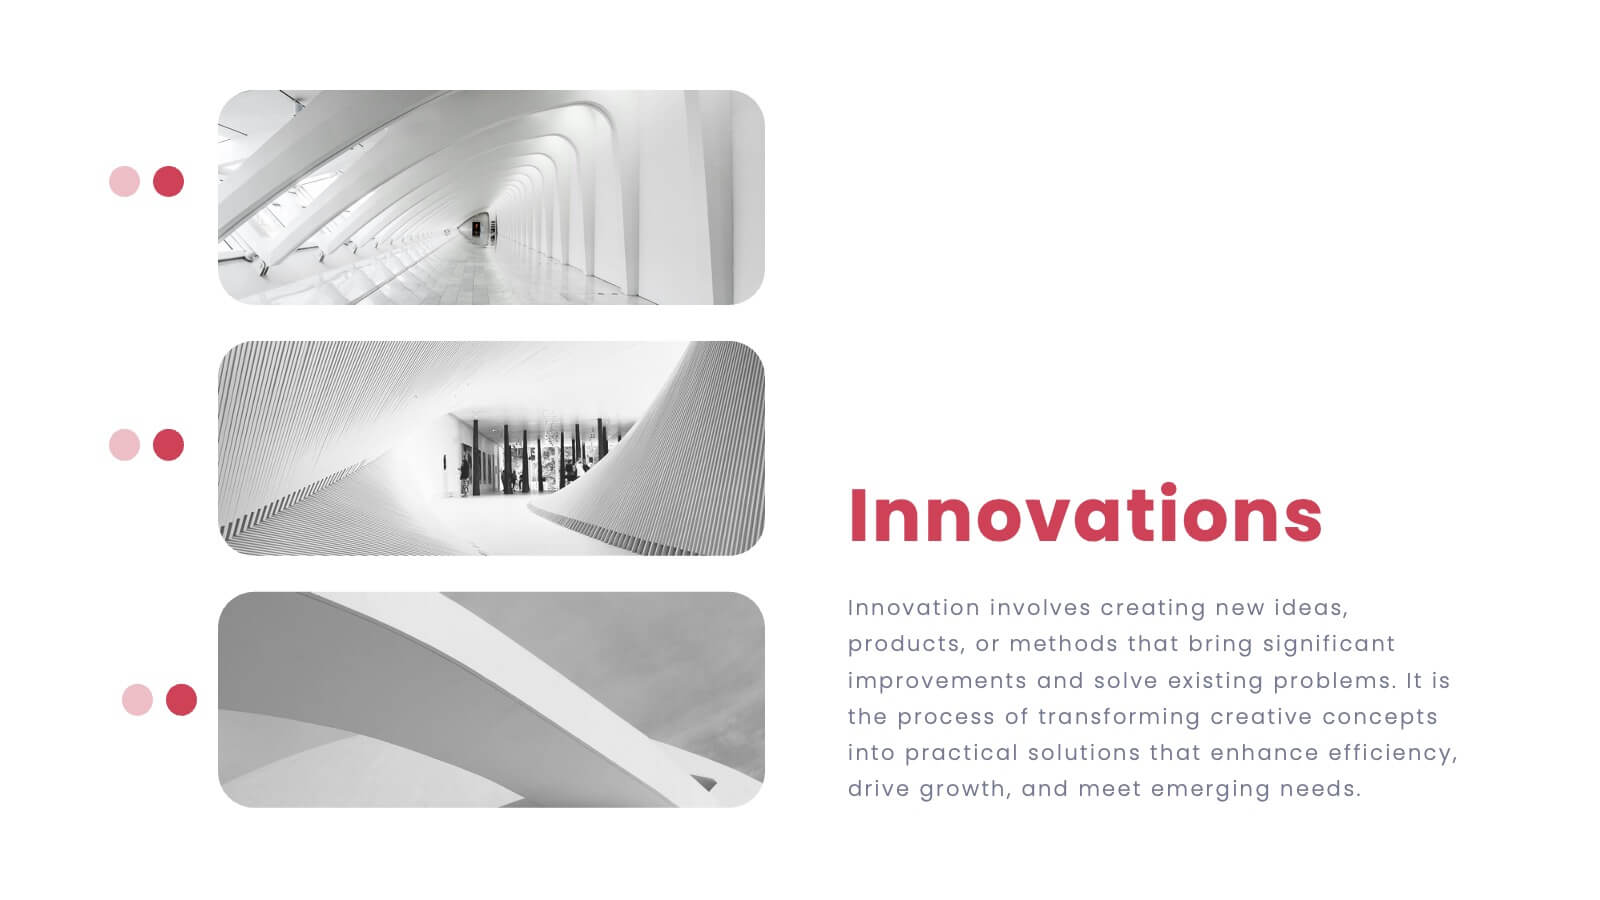
Kale Product Strategy Report Presentation
Unleash the power of your product with this bold and dynamic product strategy report template! Elevate your presentation with eye-catching designs that showcase product features, competitive analysis, and pricing strategies like never before. Captivate your audience from start to finish and leave a lasting impression. Fully compatible with PowerPoint, Keynote, and Google Slides!


21 diapositivas
Ember Echo Graphic Design Project Plan Presentation
The Ember Graphic Design Project Plan template is the perfect canvas for your creative journey! Kickstart your project with a sleek and professional introduction that sets the tone for your design vision. This template is designed to guide you through every step of the design process, from the initial brief to the final presentation. Highlight your target audience, concept development, and design elements with beautifully crafted slides that capture the essence of your project. Dive into the specifics with dedicated sections for brand identity components, textures, and the design process itself, ensuring that every detail is covered. The template also includes mood boards, prototypes, and design assets, making it easy to showcase your work in progress. With feedback and testing slides, you can iterate and refine your designs before presenting the final product. This template is fully compatible with PowerPoint, Keynote, and Google Slides, making it versatile and easy to use for any creative project.


7 diapositivas
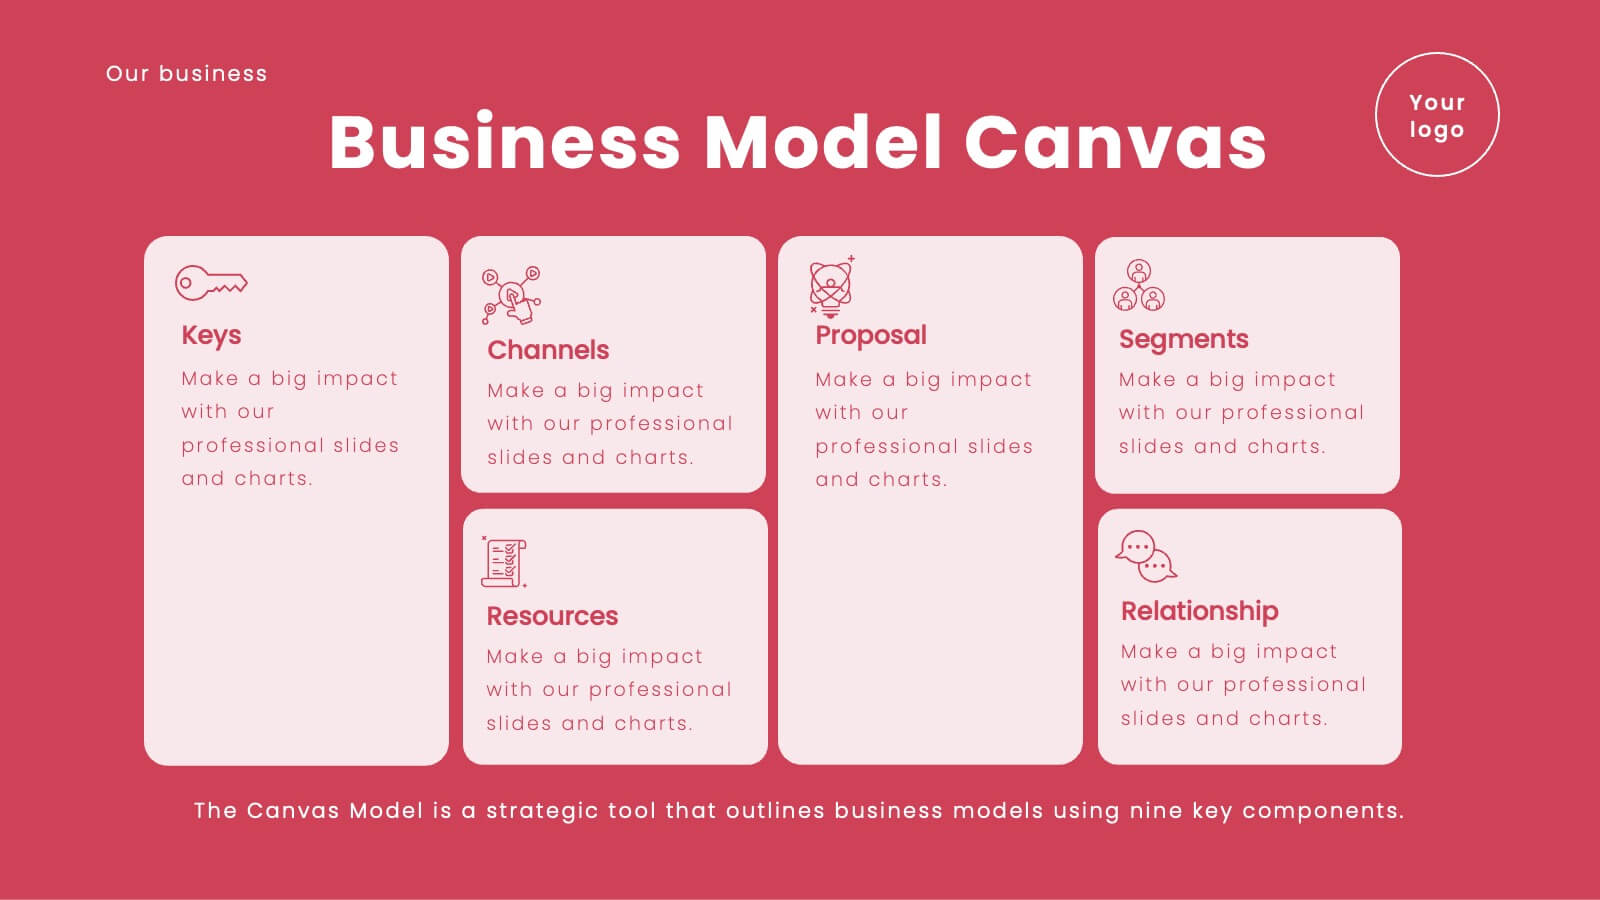
Digital Business Strategy Infographic
Navigate the complex landscape of digital business strategy with this comprehensive infographic template, which is meticulously designed to aid business strategists, entrepreneurs, and students in understanding and developing effective business plans. This resource breaks down the core components of a successful business strategy into digestible, visually engaging segments. The template spans several key areas of strategic planning including execution, governance, planning, marketing, and innovation. Each section is clearly delineated with vibrant colors and icons that correspond to different aspects of business strategy, such as venture, capital, and brand positioning. The layout is thoughtfully organized to guide the viewer through the process step-by-step, making complex concepts accessible and straightforward. Utilizing a clean and professional design, this template is ideal for presentations, educational materials, or as a visual aid during business meetings. It provides a clear roadmap for aligning digital tools and platforms with business objectives, highlighting the pathways to profitability and market expansion. Whether for internal strategy sessions, academic purposes, or entrepreneurial pitches, this infographic is an invaluable tool for conveying the essentials of digital business strategy effectively and efficiently.


22 diapositivas
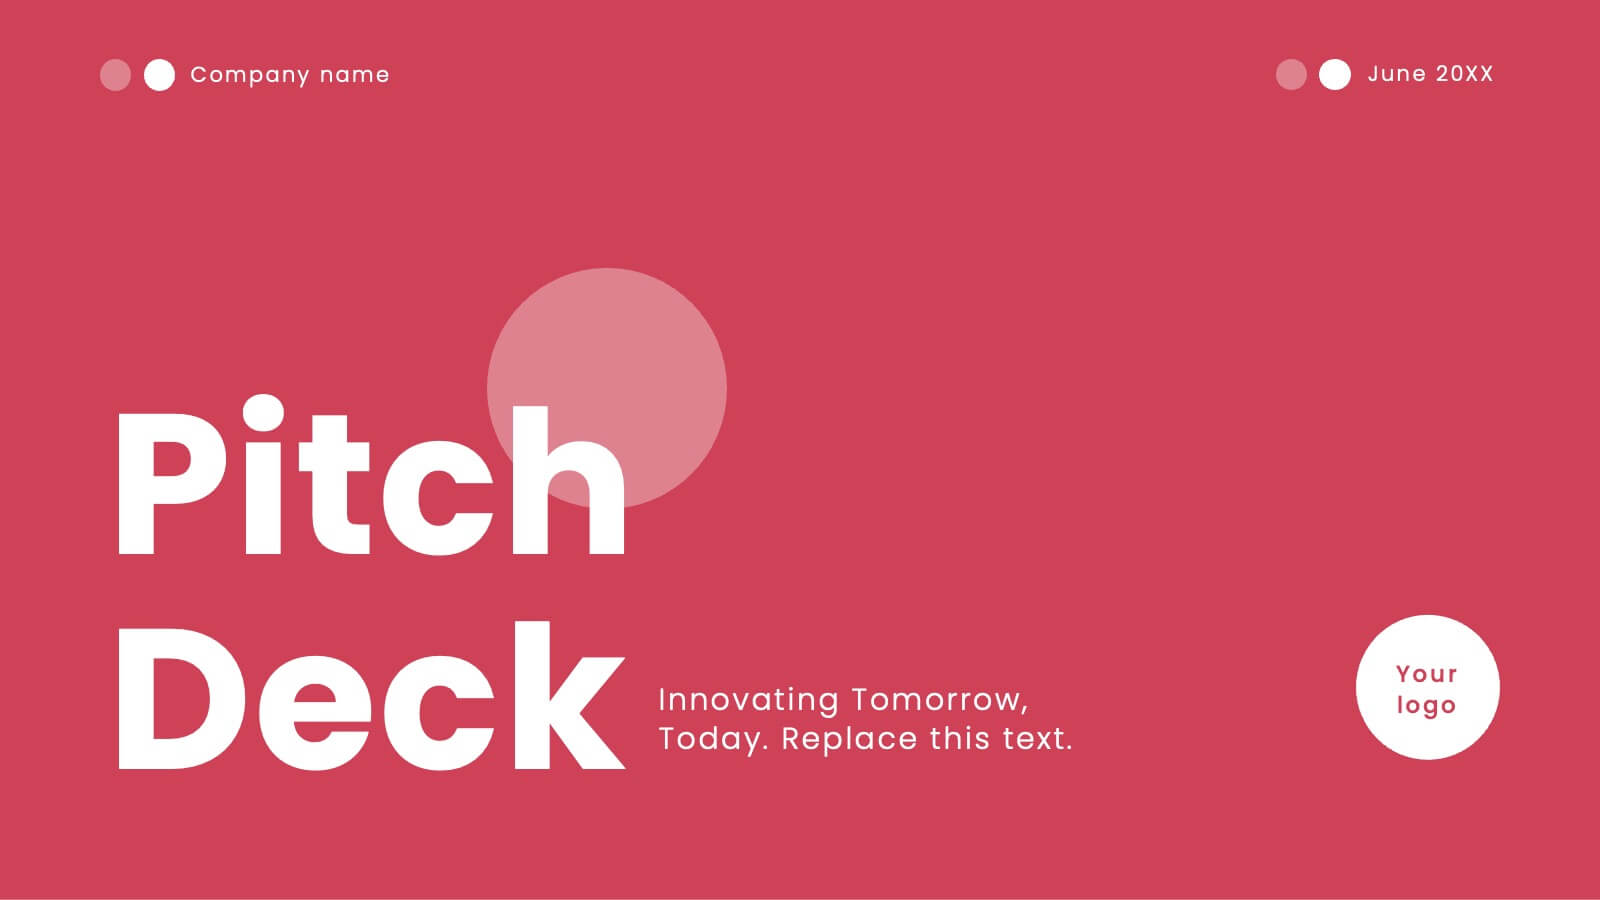
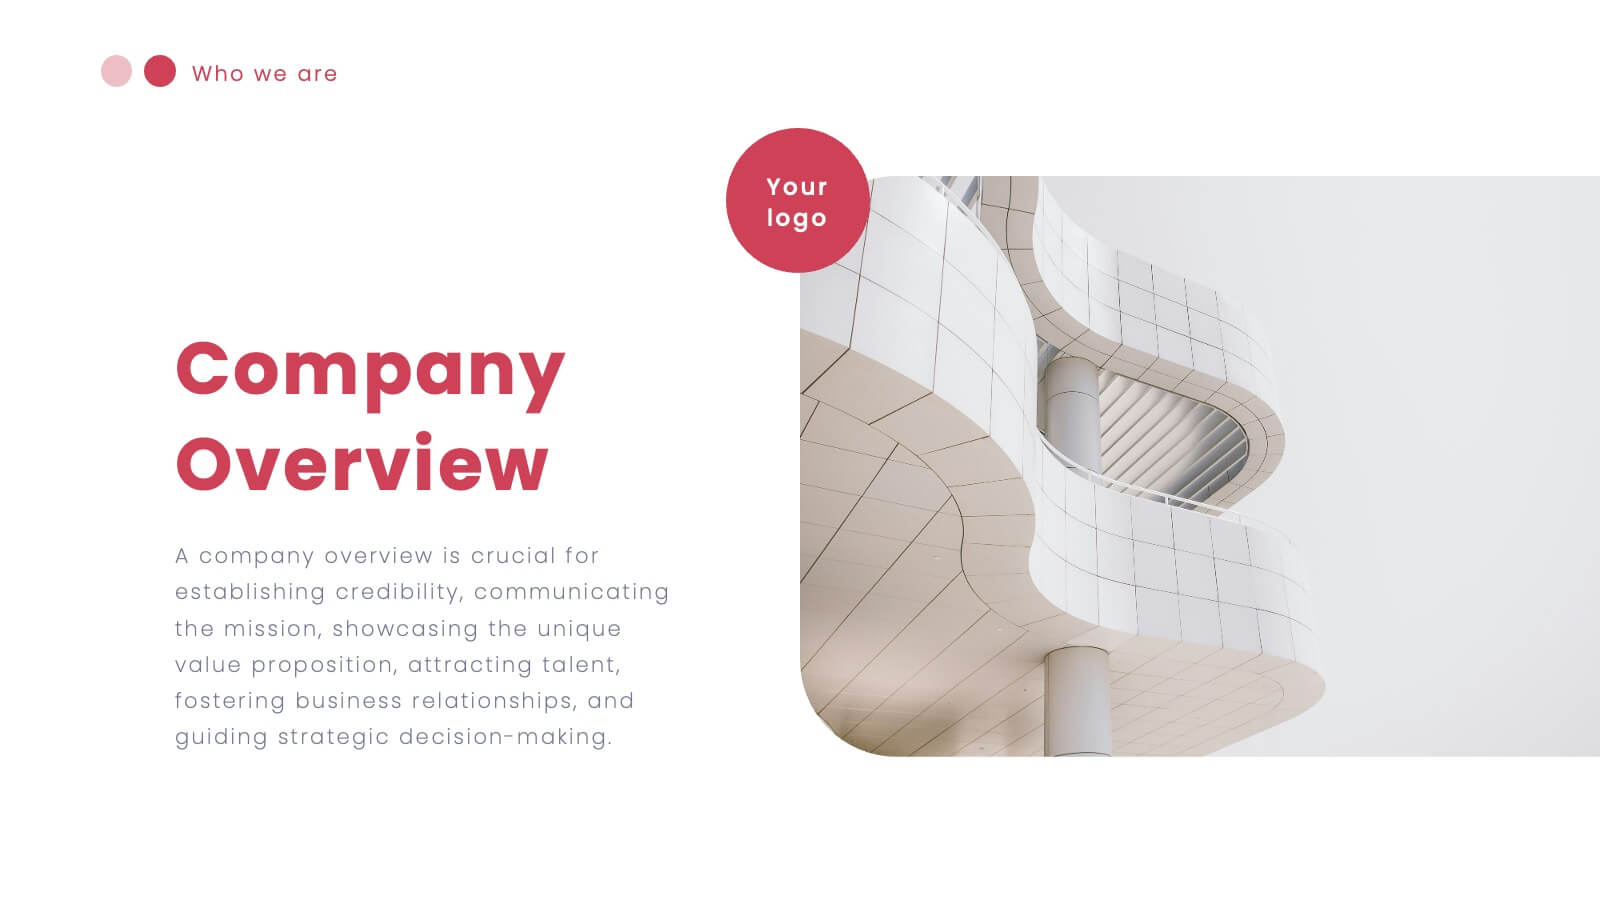
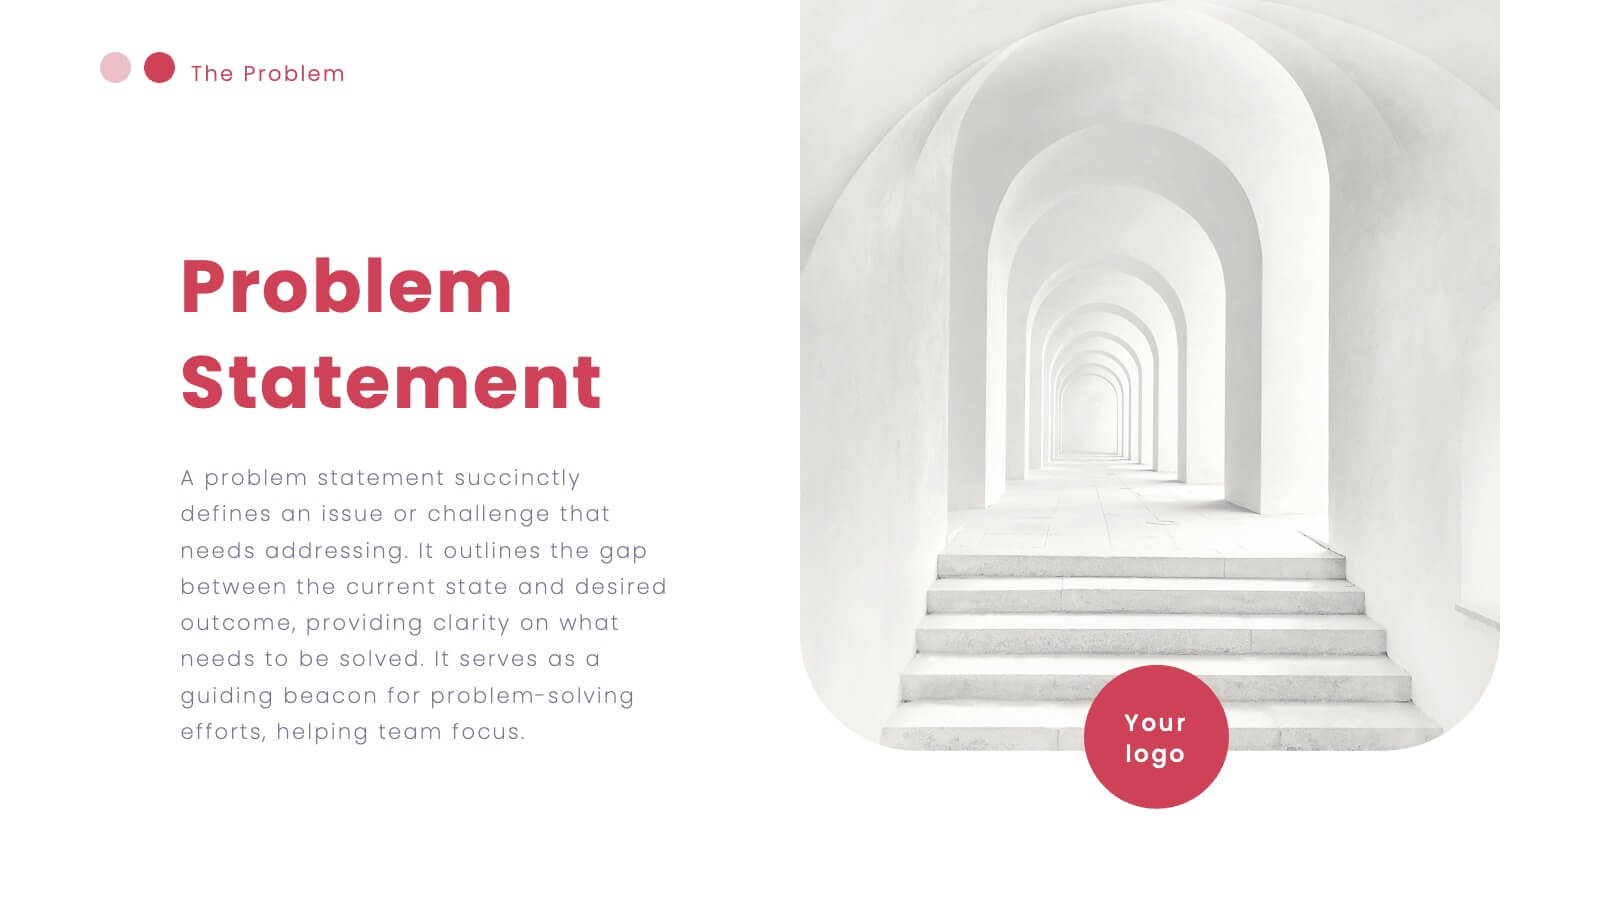
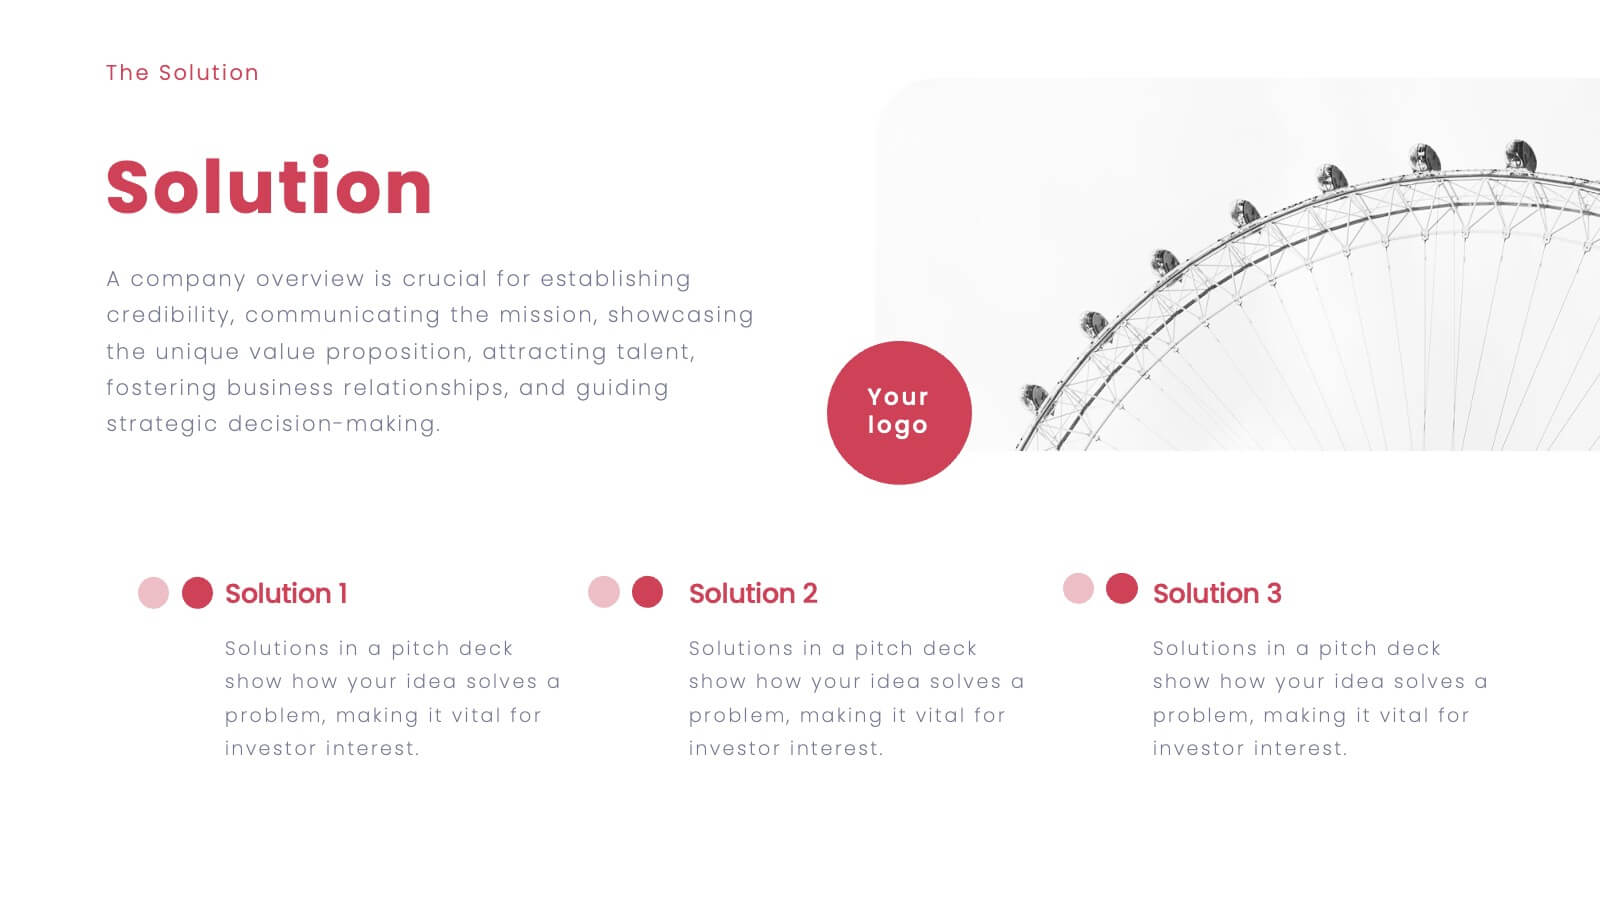
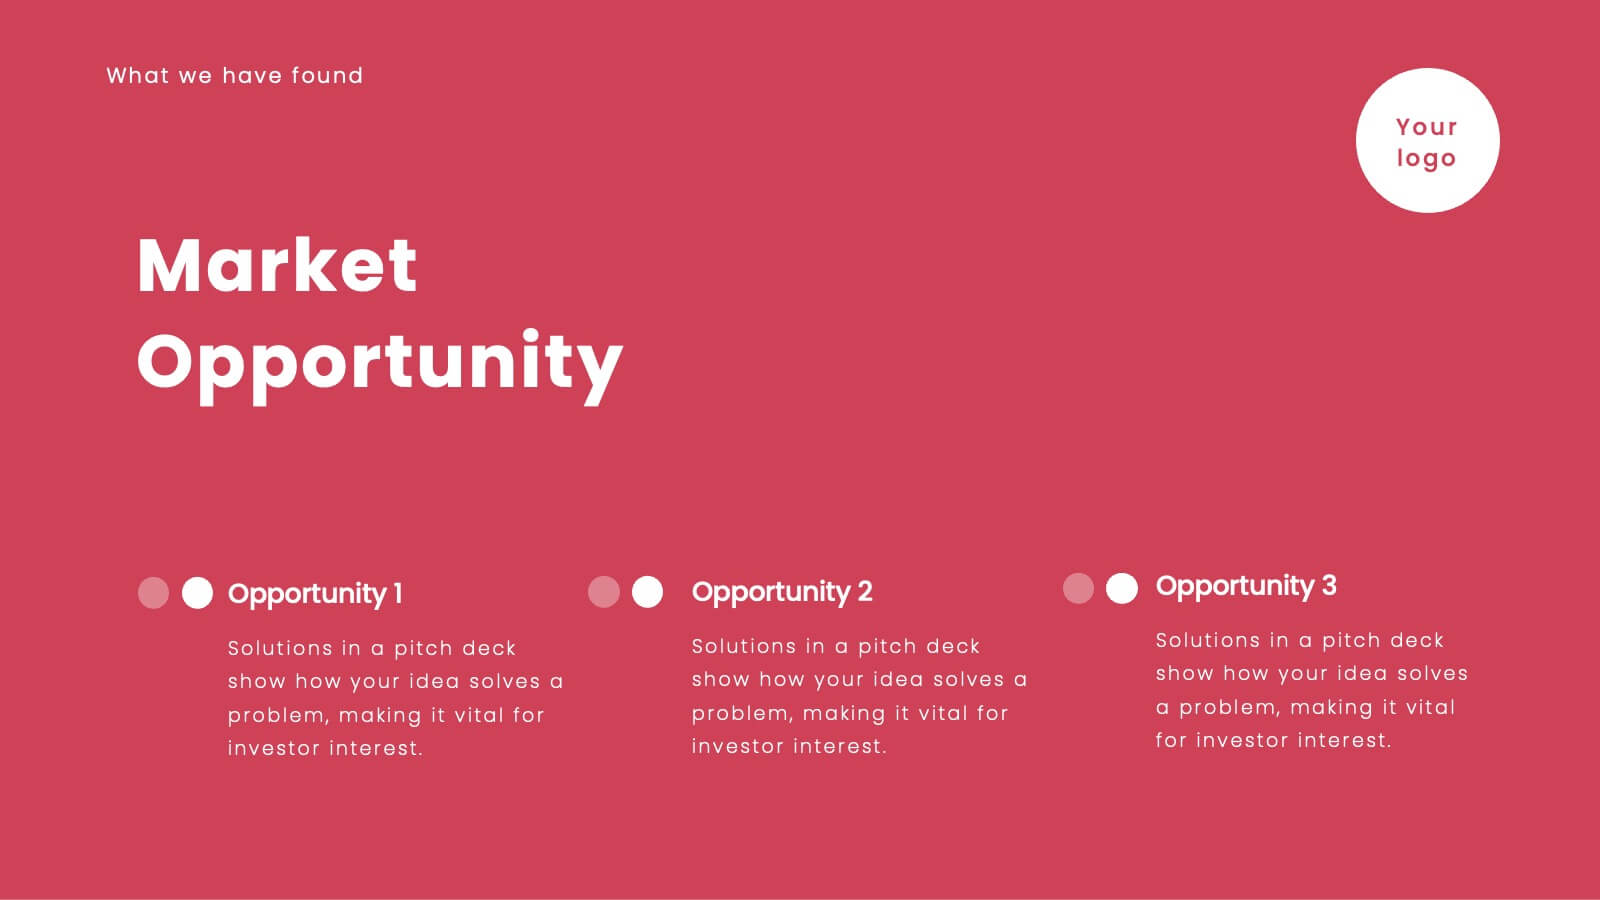
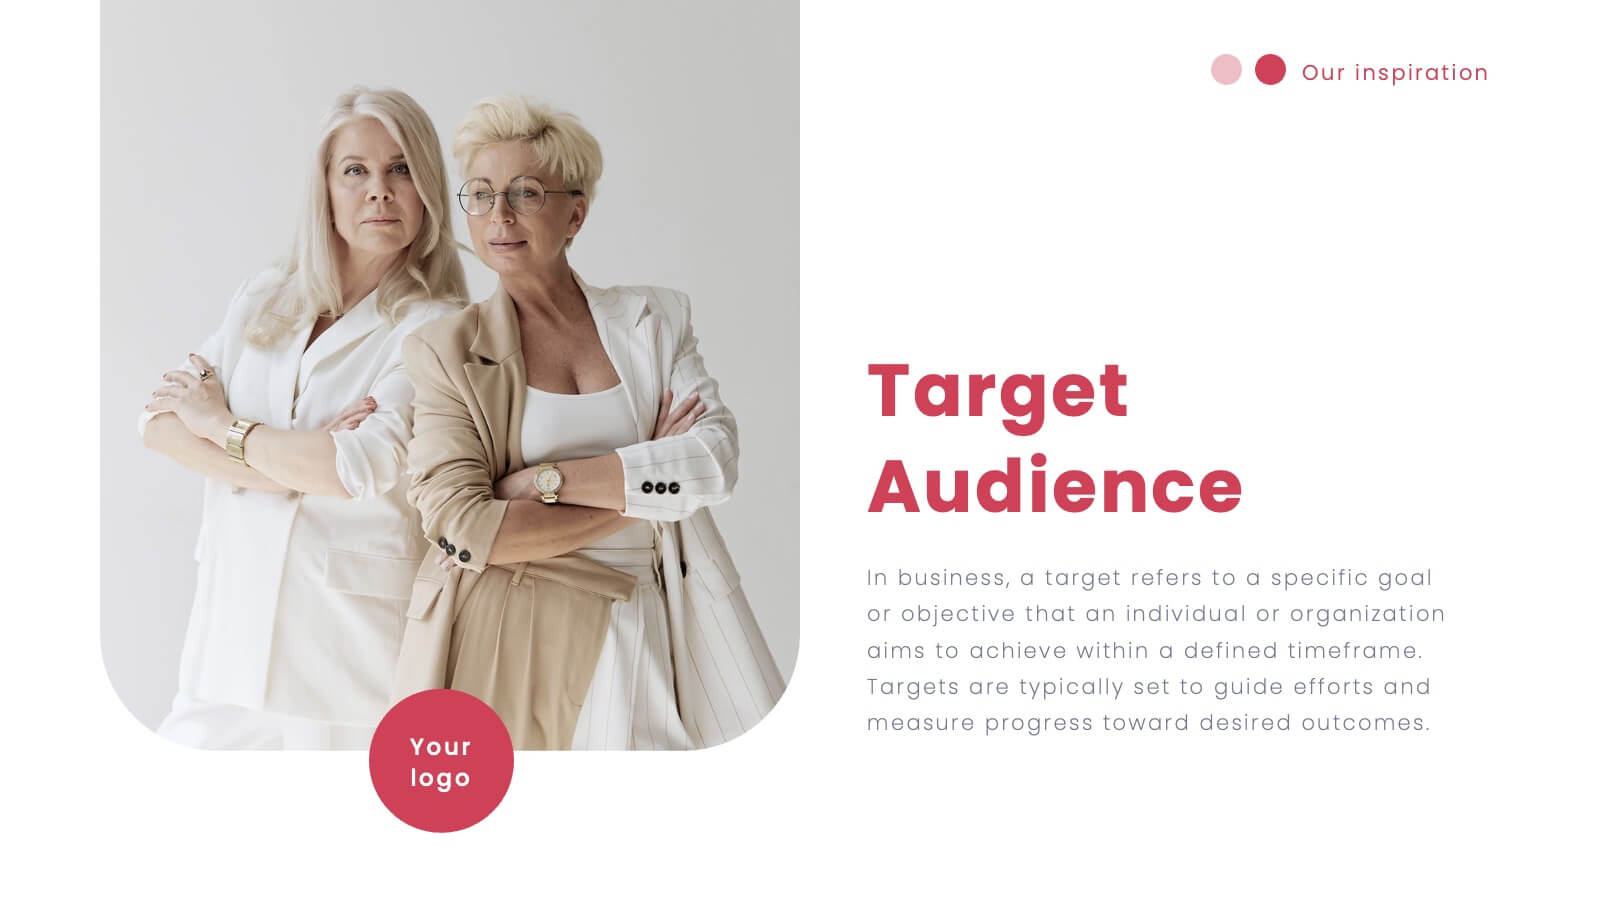
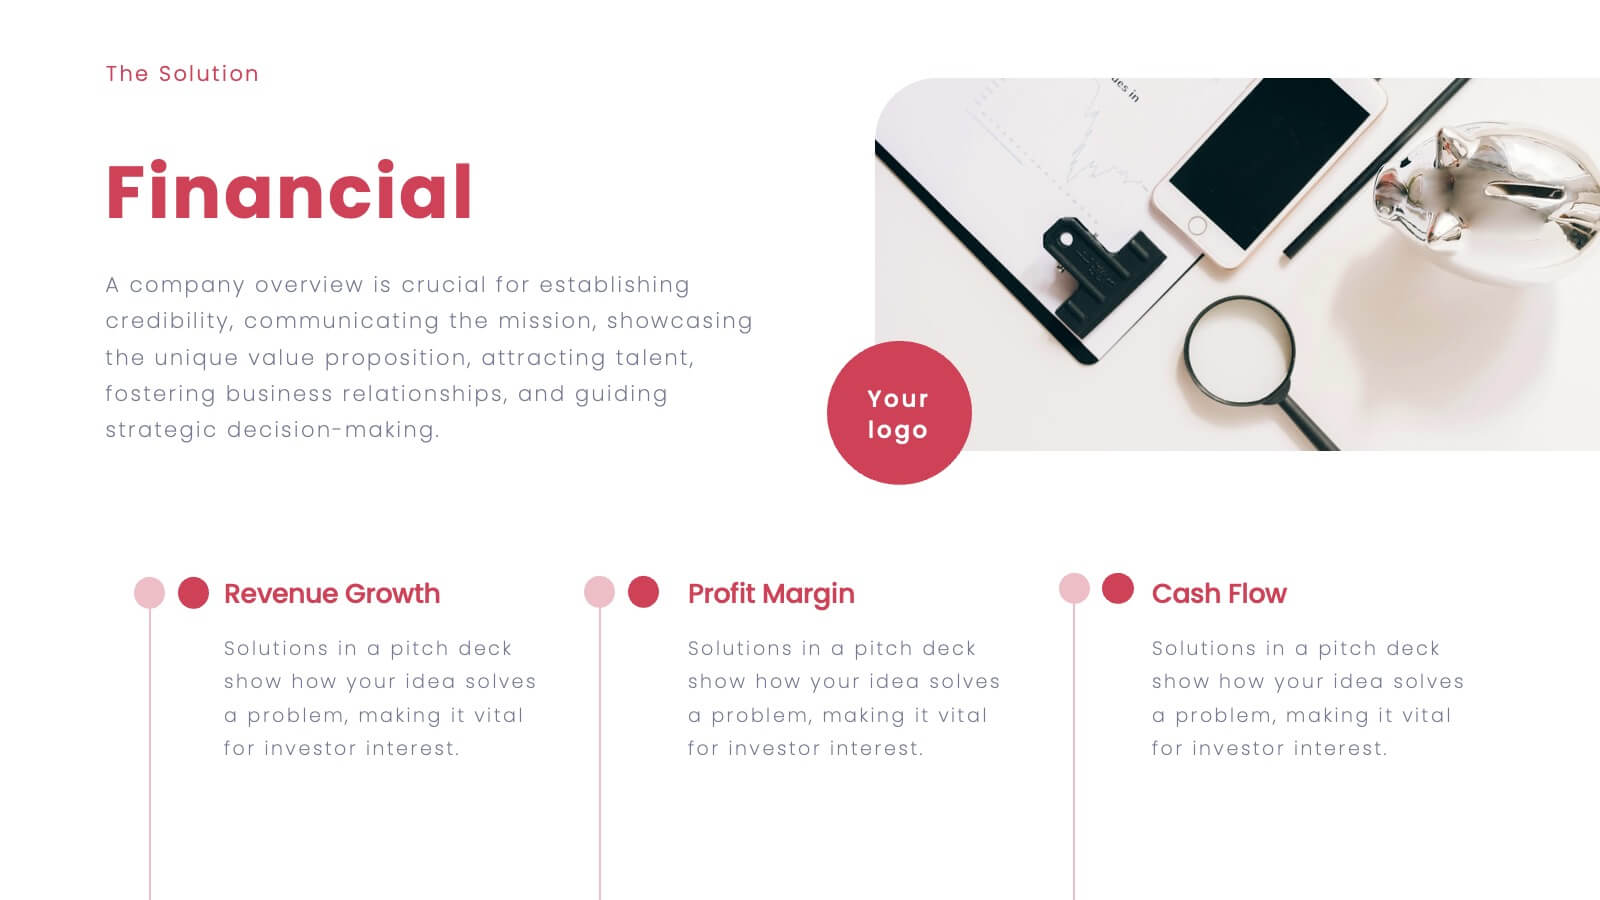
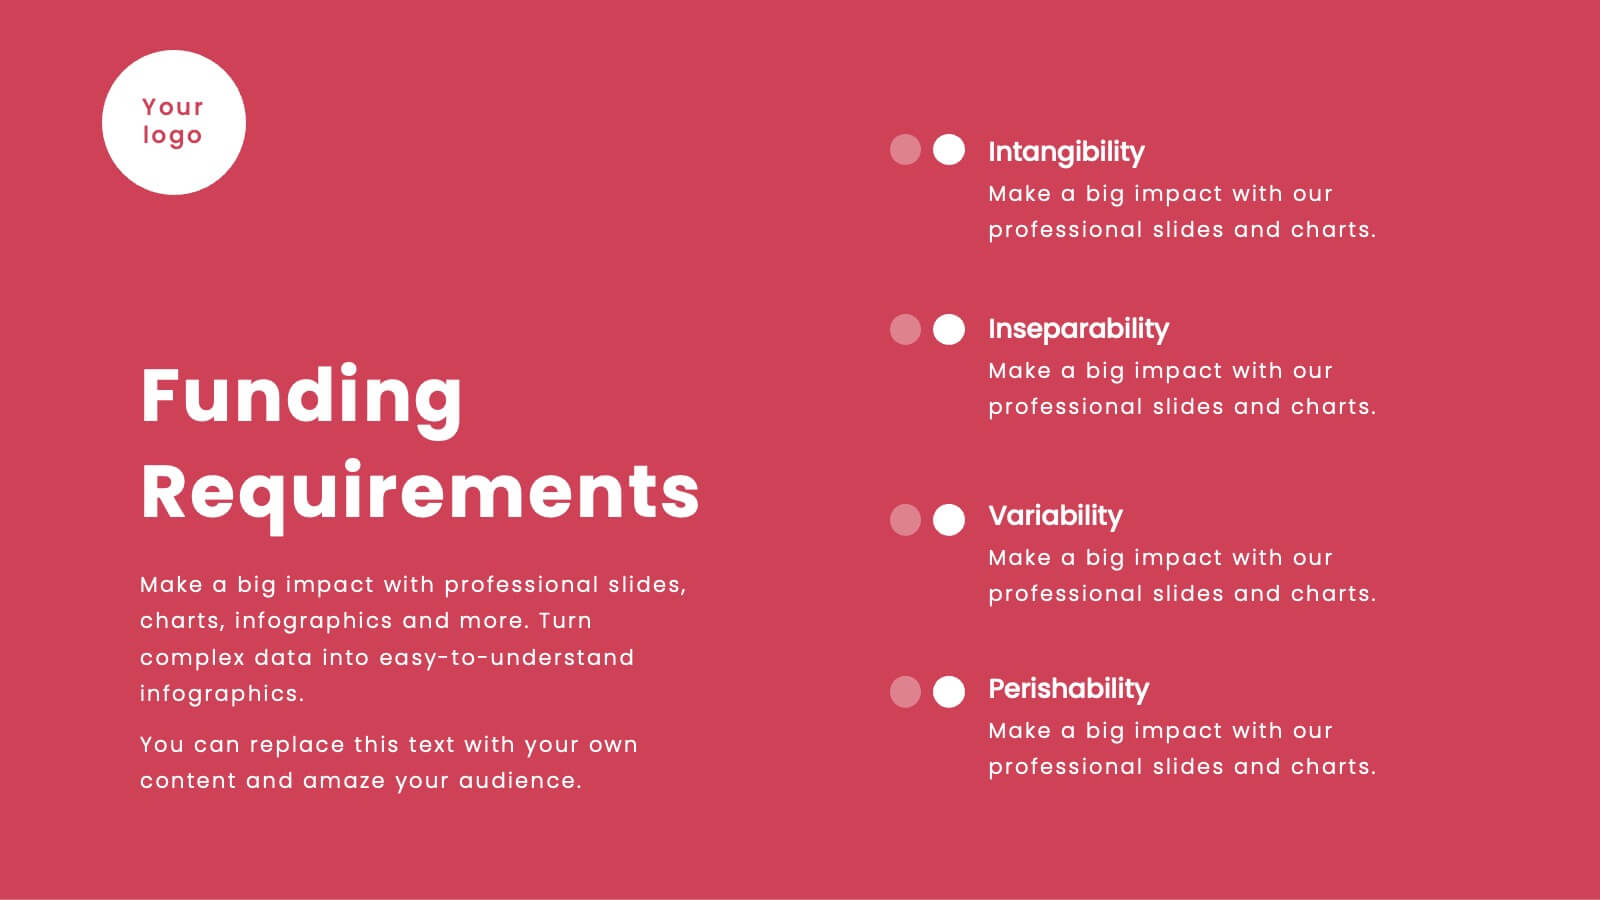
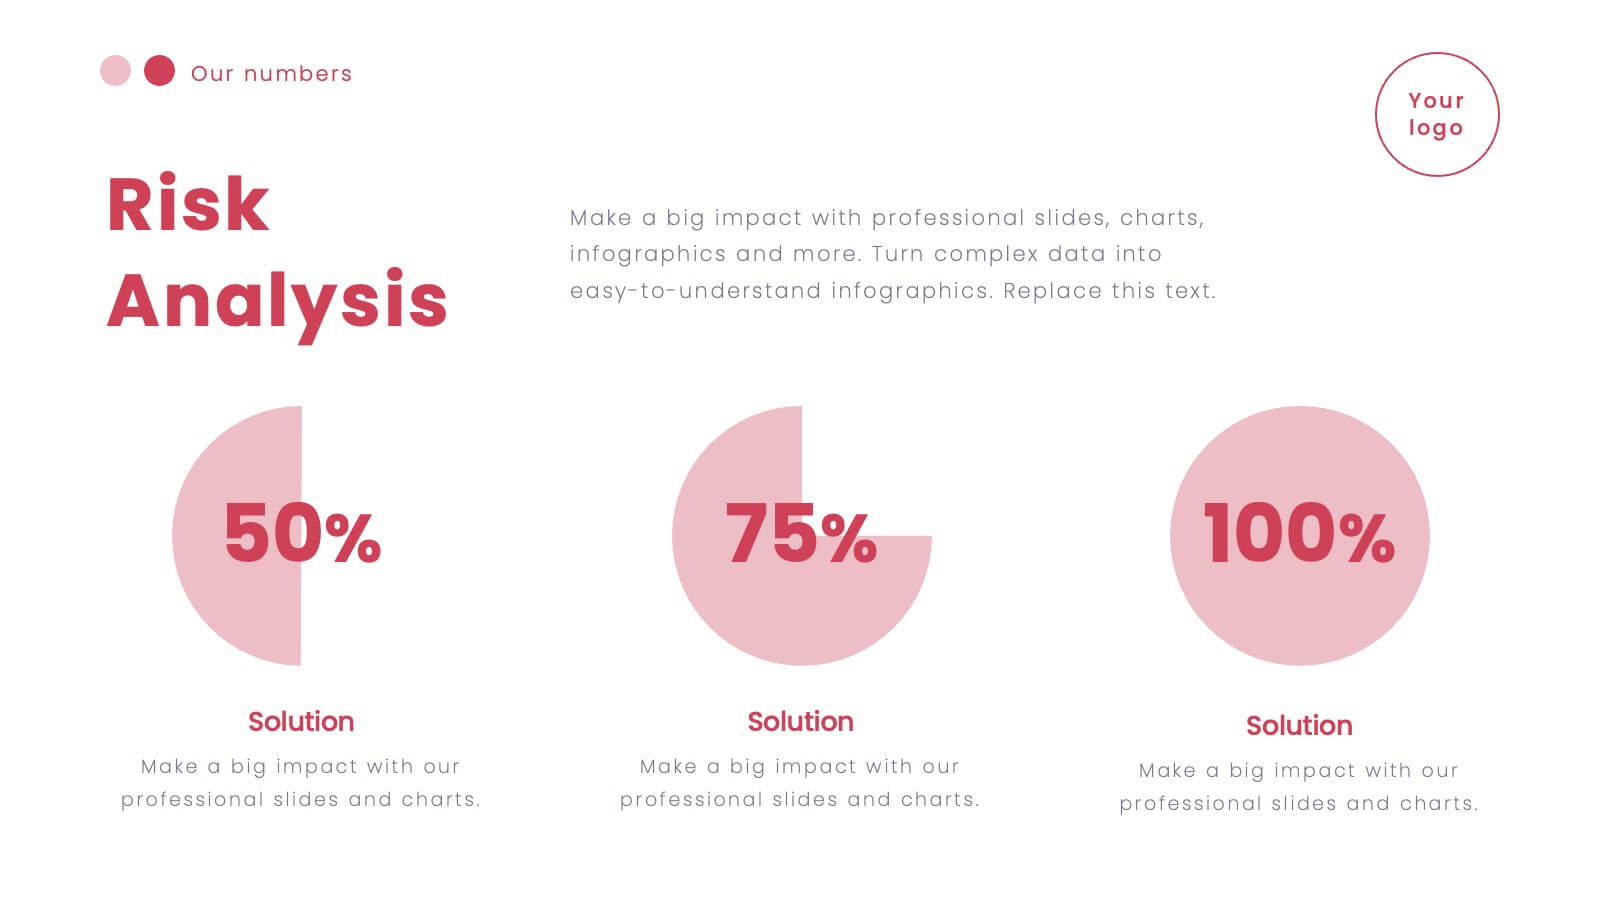
Vortex Startup Pitch Deck Presentation
Launch your ideas into action with this vibrant red pitch deck template, designed to captivate and inform potential investors. It covers everything from company overview to financials and market strategy, ensuring your vision is communicated effectively. Compatible with PowerPoint, Google Slides, and Keynote, this template is perfect for startups seeking to impress and engage.


5 diapositivas
Food Business Pitch Deck Presentation
Bring your food concept to life with a lively, story-driven presentation that highlights flavor, creativity, and business potential. This slide design helps you explain your menu vision, branding approach, and restaurant strategy in a clean and engaging format. Fully compatible with PowerPoint, Keynote, and Google Slides.


23 diapositivas
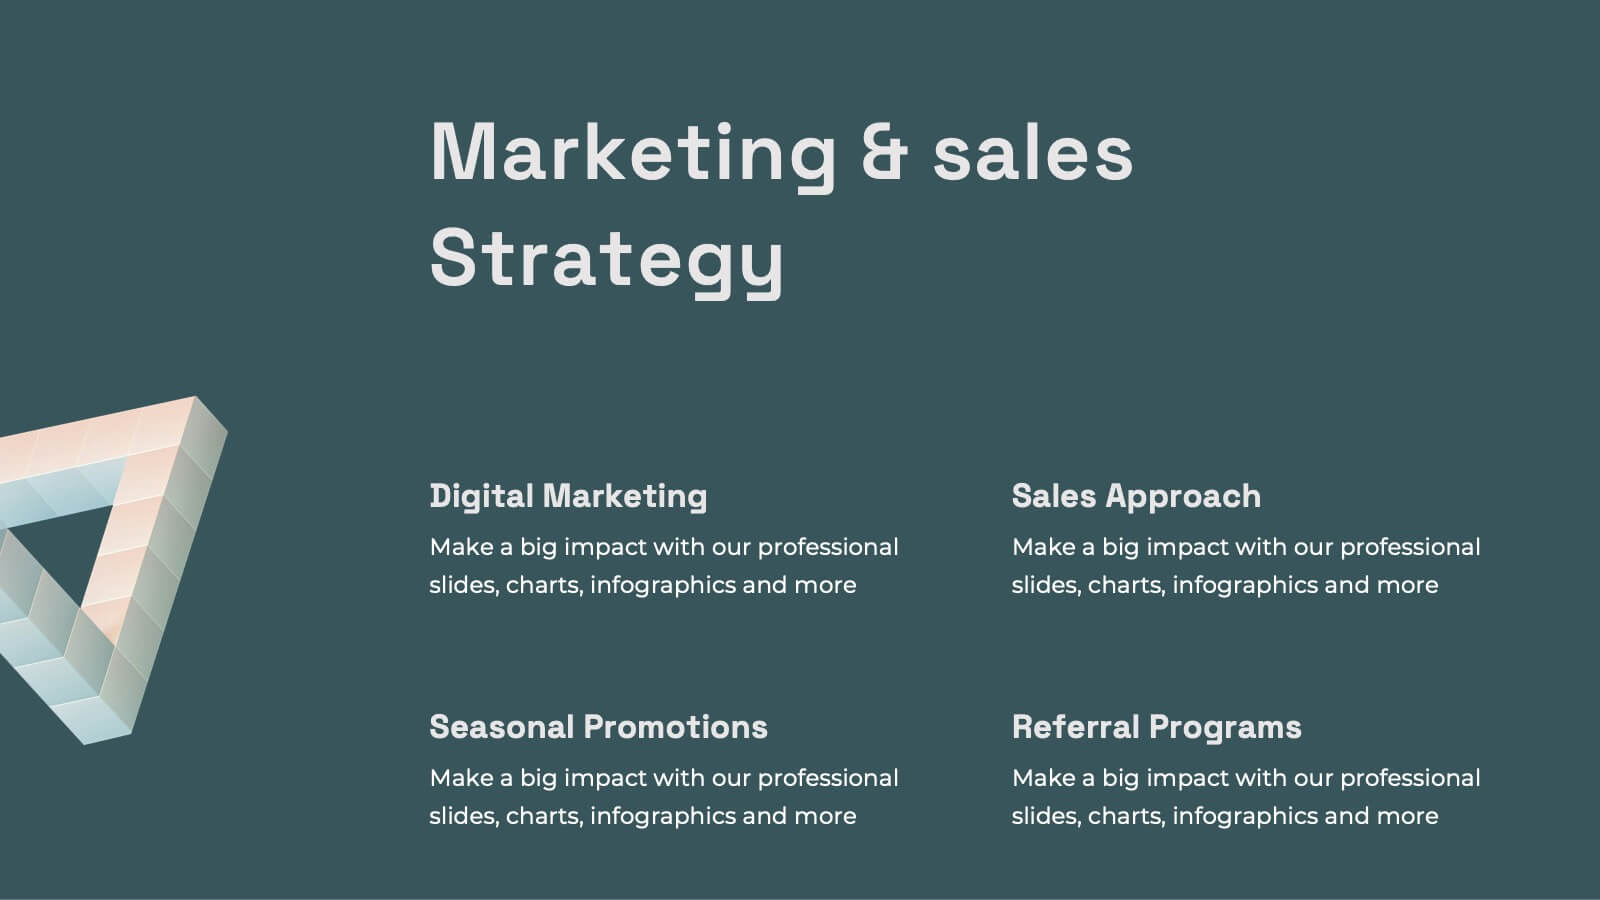
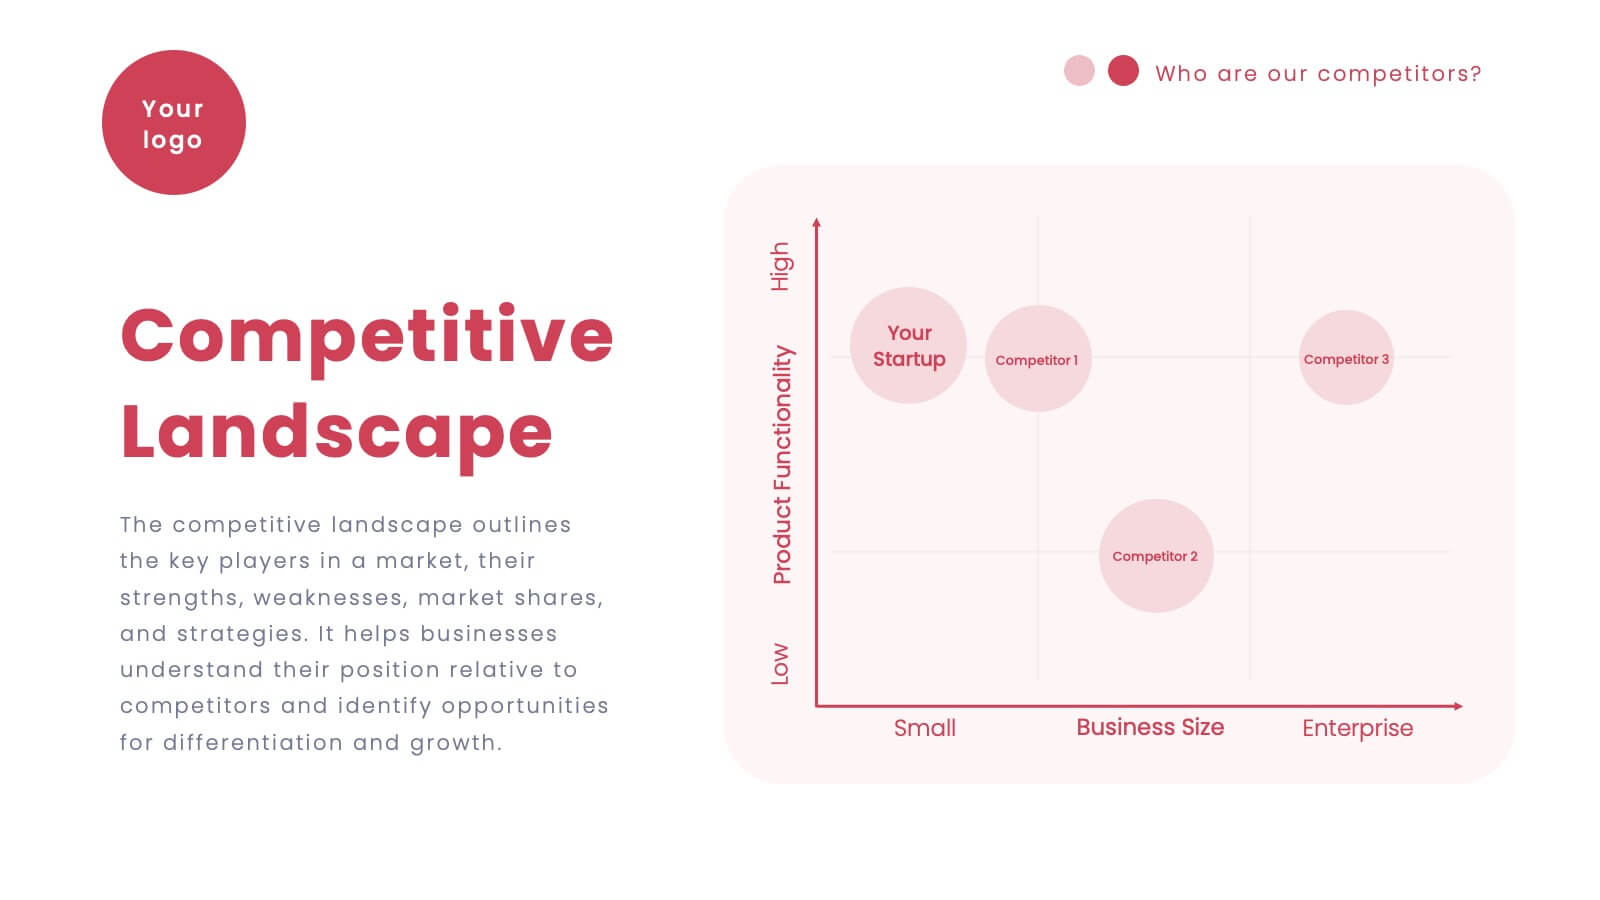
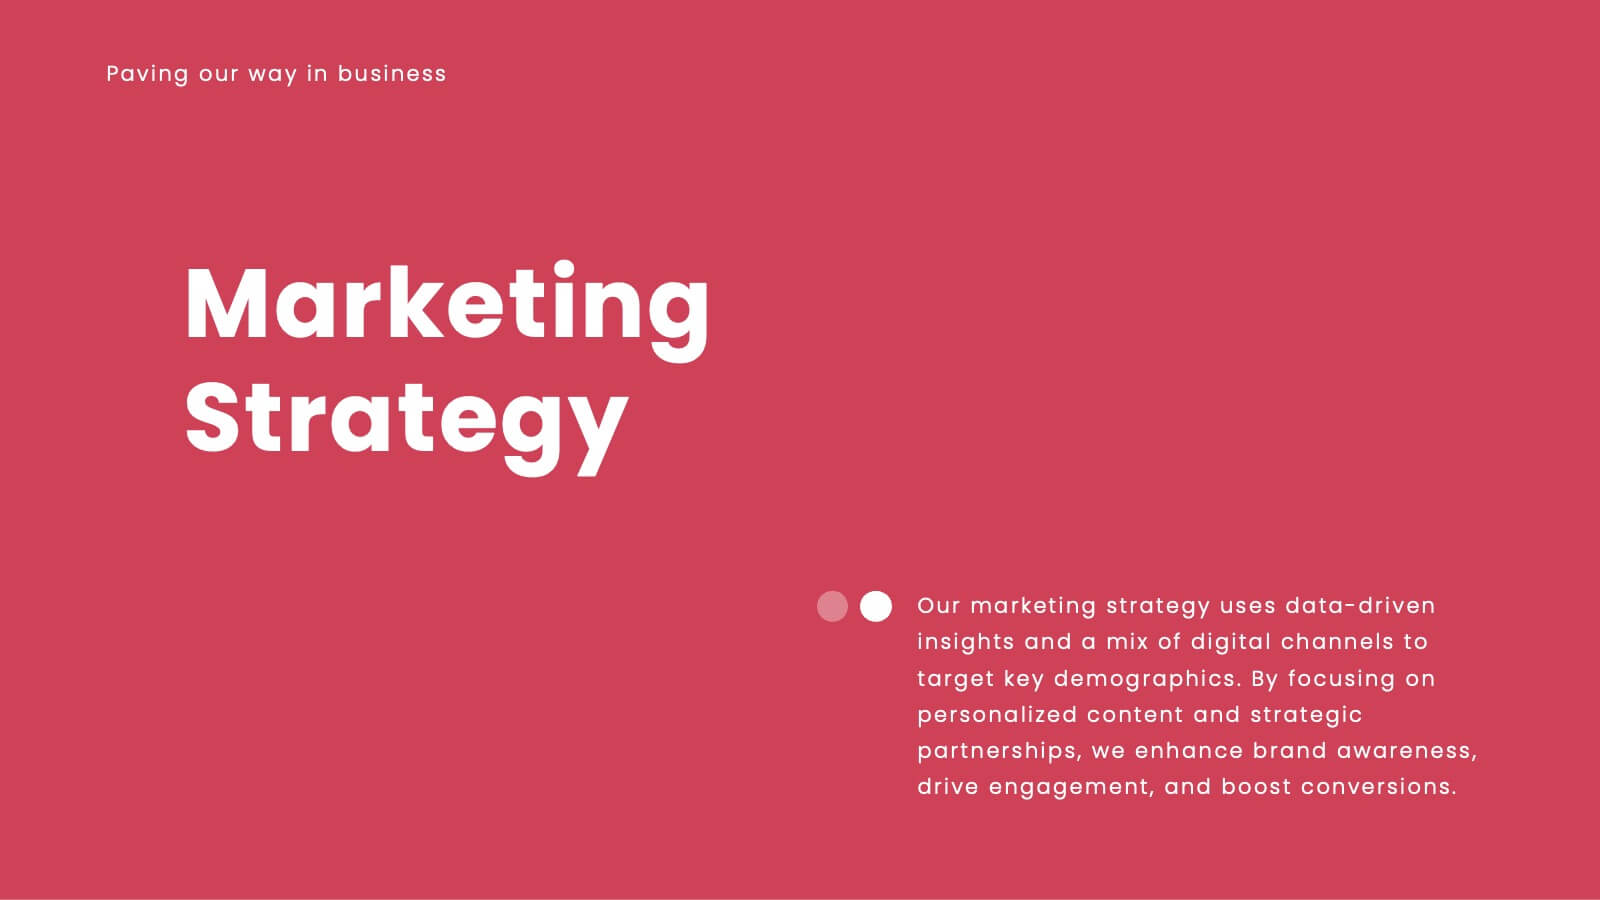
Soundscape Marketing Strategy Plan Presentation
Craft a compelling marketing strategy with a modern and sophisticated presentation template designed for marketers, agencies, and entrepreneurs. Perfectly organized, this template allows you to present strategic objectives, SWOT analysis, and competitive landscape insights in a structured manner. Communicate key challenges, value propositions, and resource allocations with sleek, minimalistic slides. Visualize your timeline, team expertise, and communication strategy using editable graphics and streamlined layouts. Dedicated slides for performance metrics and risk management ensure your plan resonates with stakeholders and decision-makers. Compatible with PowerPoint, Google Slides, and Keynote, this fully customizable template empowers you to deliver your strategy with impact and clarity. Elevate your presentation with professional design elements that captivate your audience and drive actionable results.


8 diapositivas
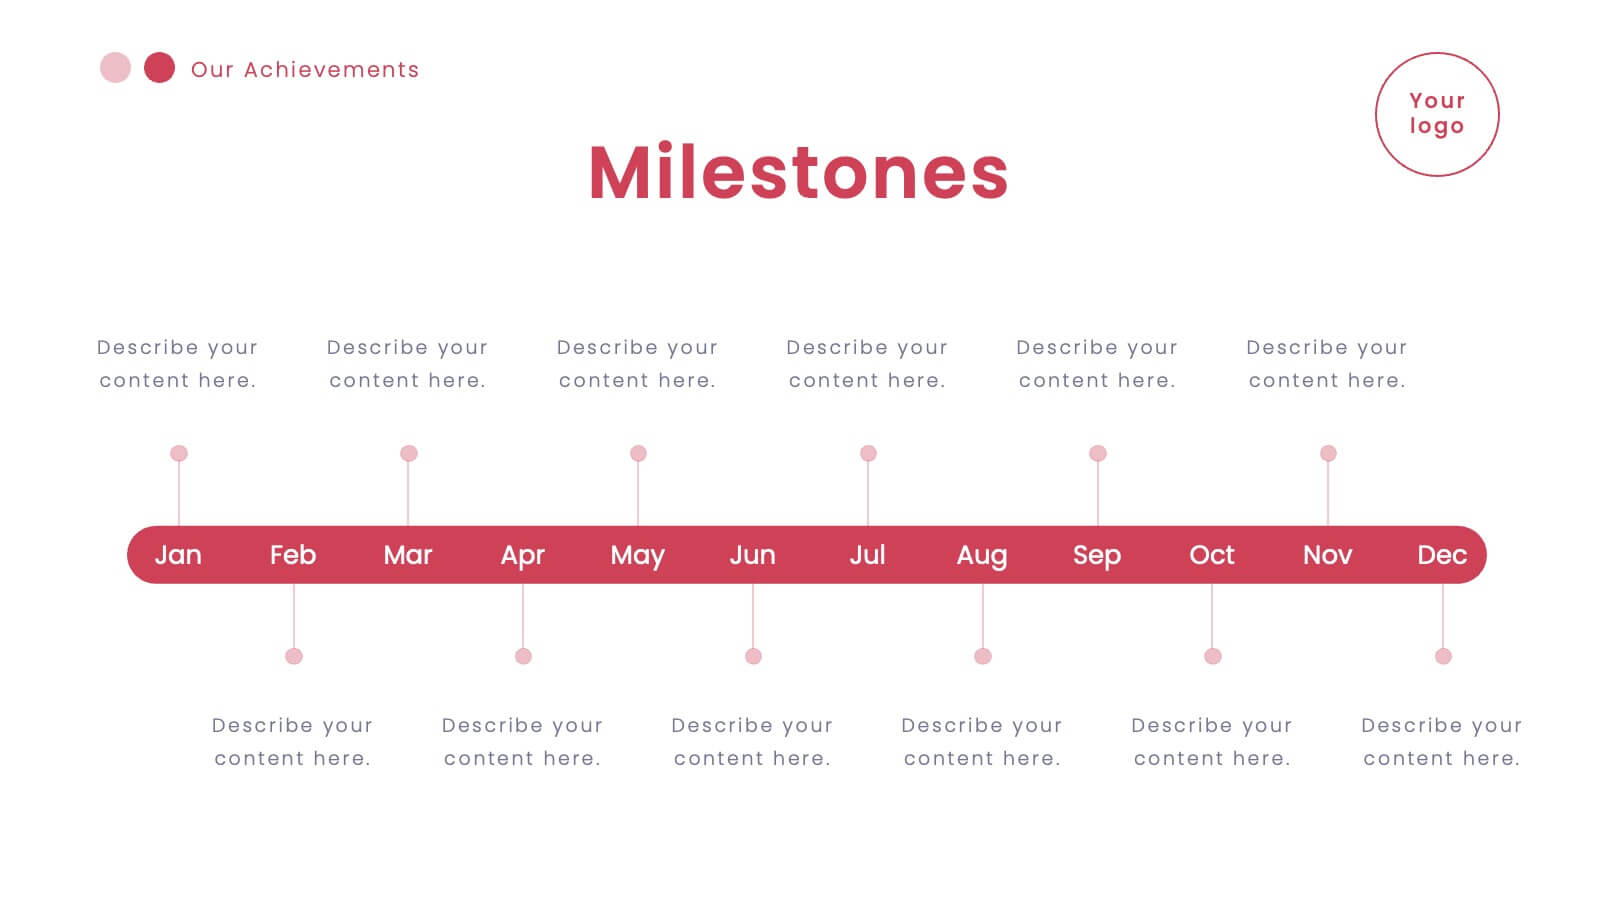
Project Milestones and Deliverables Presentation
Visualize your project’s journey with this step-by-step milestone timeline—ideal for tracking key phases, task ownership, or delivery checkpoints. The diagonal path connects colorful icons and editable text blocks, helping teams align on objectives and timelines. Compatible with PowerPoint, Keynote, and Google Slides.


21 diapositivas
Vespera Project Management Plan Presentation
This Project Management Plan Presentation template is a professional and well-structured tool to outline project goals, scope, timelines, and resources. It covers key elements like deliverables, budget breakdown, risk management, and stakeholder analysis. Fully customizable and compatible with PowerPoint, Keynote, and Google Slides for seamless collaboration.


7 diapositivas
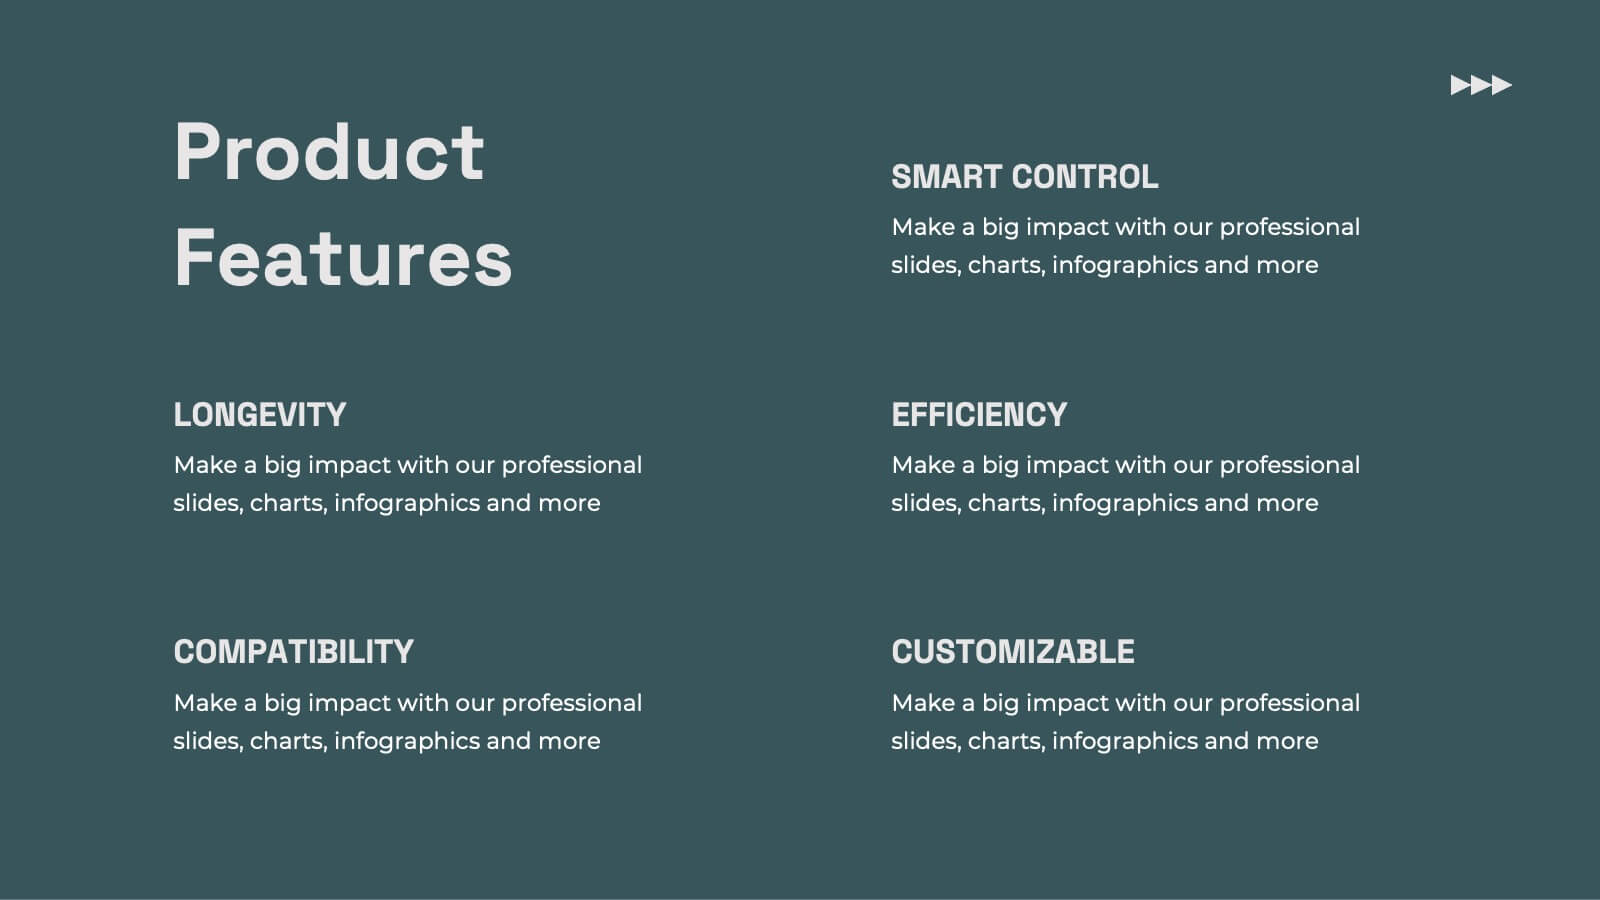
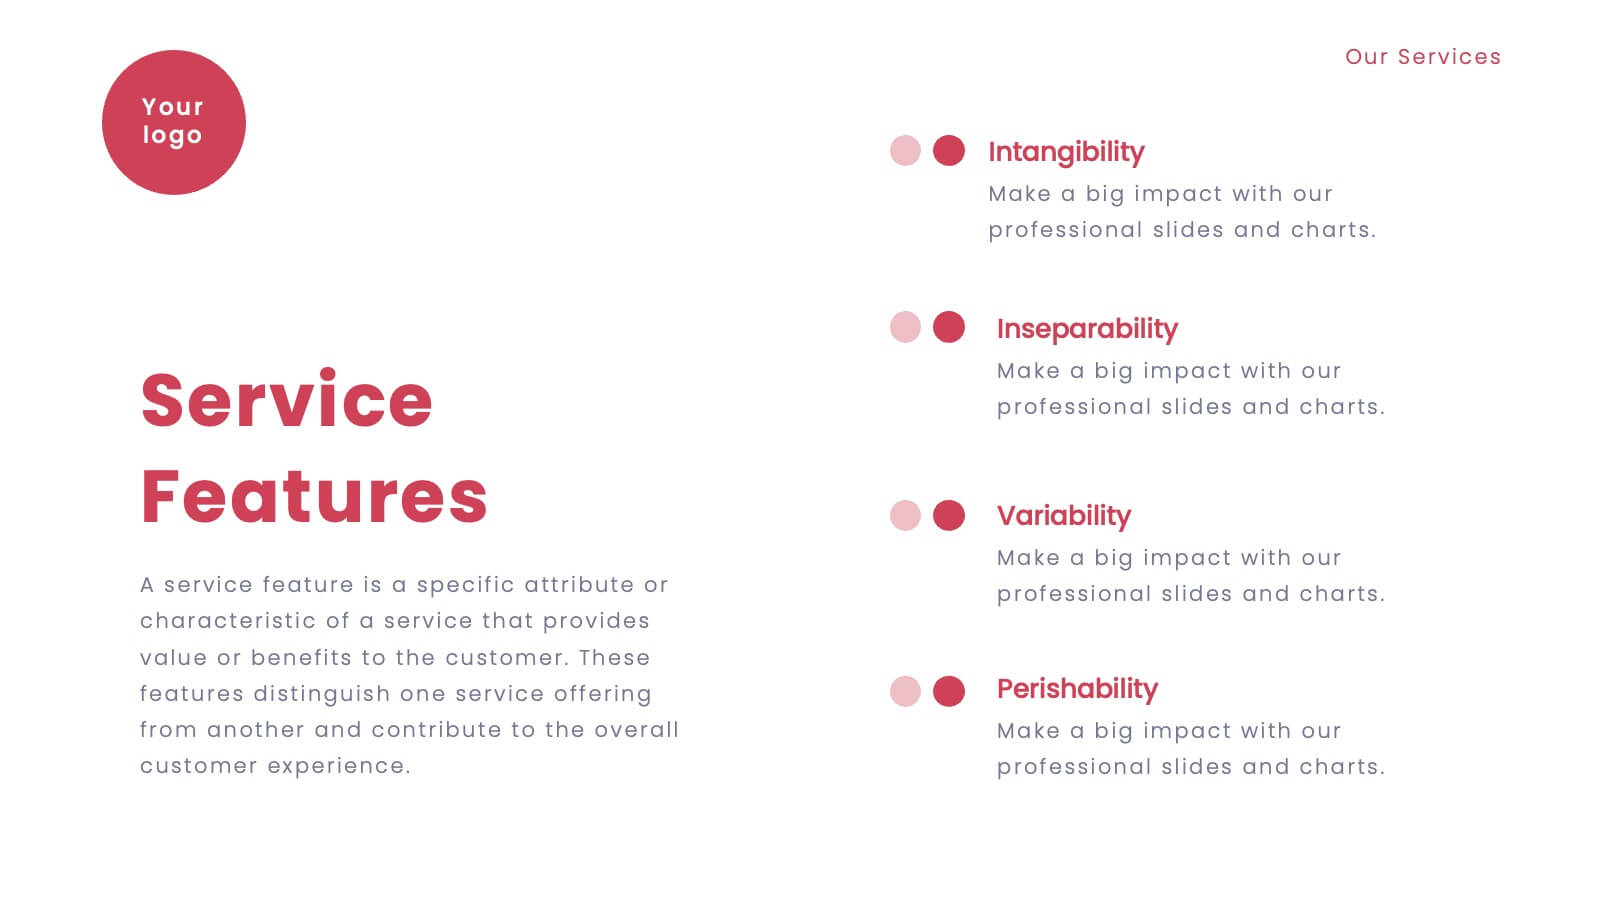
Benefits vs Features Slide Presentation
Make your message stand out by clearly distinguishing what your product does from why it matters. This clean and structured layout helps you explain features and highlight their real-world benefits, keeping audiences engaged and informed. Fully customizable and compatible with PowerPoint, Keynote, and Google Slides for smooth presentation use.


6 diapositivas
Hospital Management System Presentation
Bring structure and efficiency to your healthcare operations with this professional presentation. Designed to simplify complex hospital workflows, it helps visualize patient management, service coordination, and system processes with clarity. Ideal for administrators and consultants, it’s fully editable and compatible with PowerPoint, Keynote, and Google Slides for seamless customization.


5 diapositivas
3-Level Concentric Diagram Presentation
Bring clarity and structure to your ideas with a clean, layered diagram design that simplifies complex concepts. Perfect for showcasing stages, hierarchies, or interconnected systems, it keeps your audience engaged with visual balance and flow. Fully compatible with PowerPoint, Keynote, and Google Slides for effortless customization and presentation flexibility.


5 diapositivas
Empowered Leadership and Influence Strategy
Showcase impactful leadership journeys with the Empowered Leadership and Influence Strategy Presentation. This slide features a bold mountain-style layout that symbolizes growth, with five colorful peaks representing key leadership steps or principles. Perfect for professional development workshops, executive coaching, or team-building presentations. Fully editable and compatible with PowerPoint, Keynote, and Google Slides.


19 diapositivas
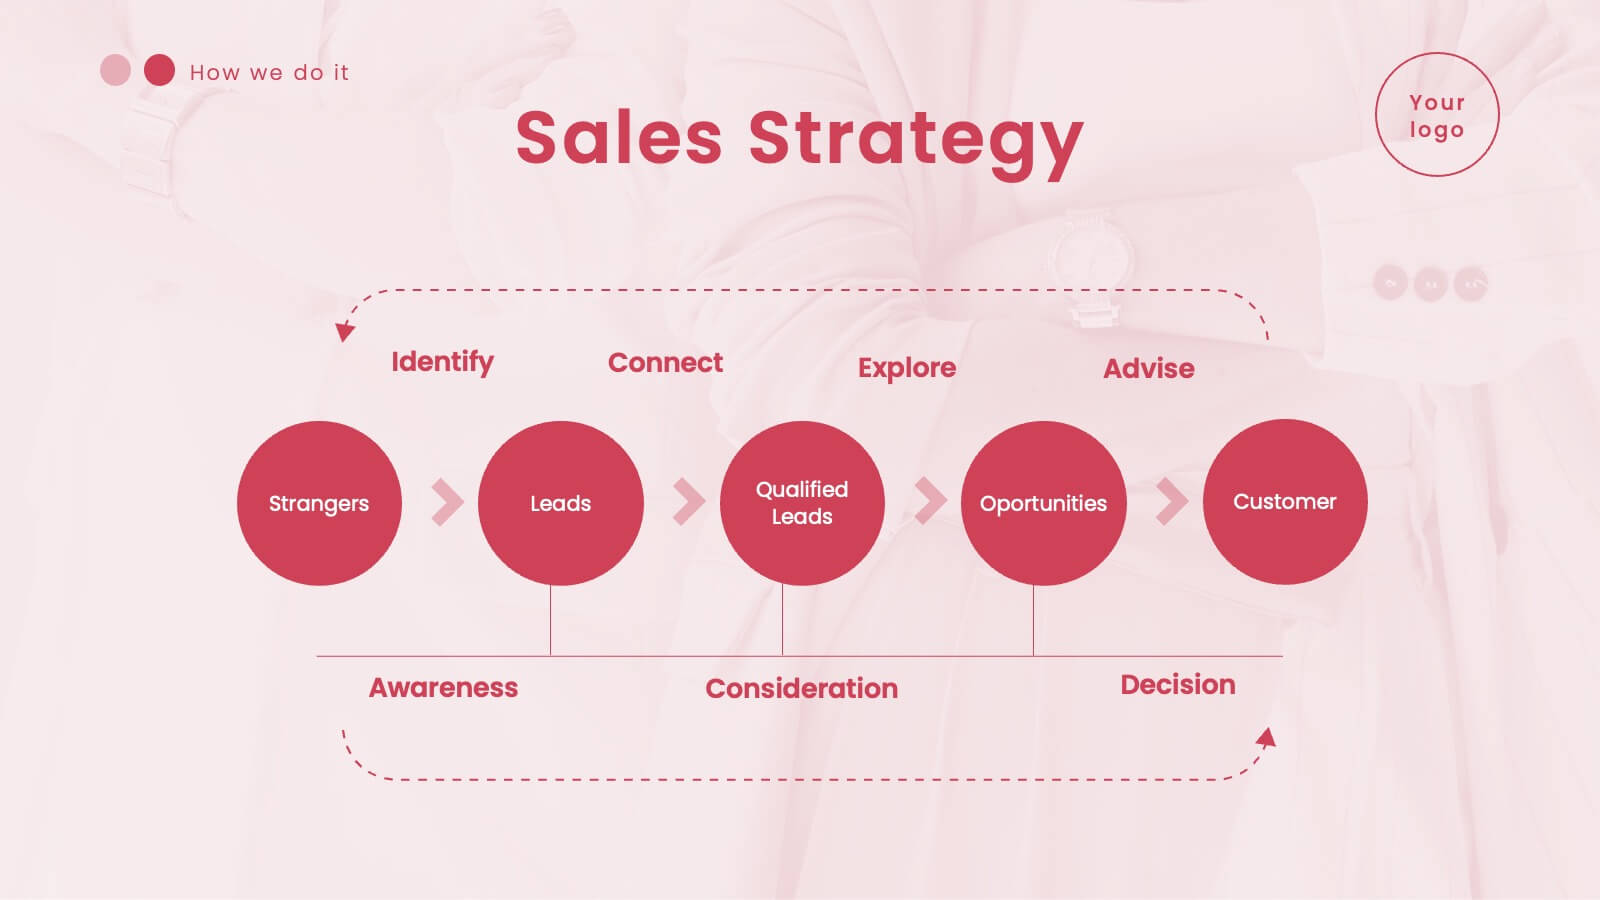
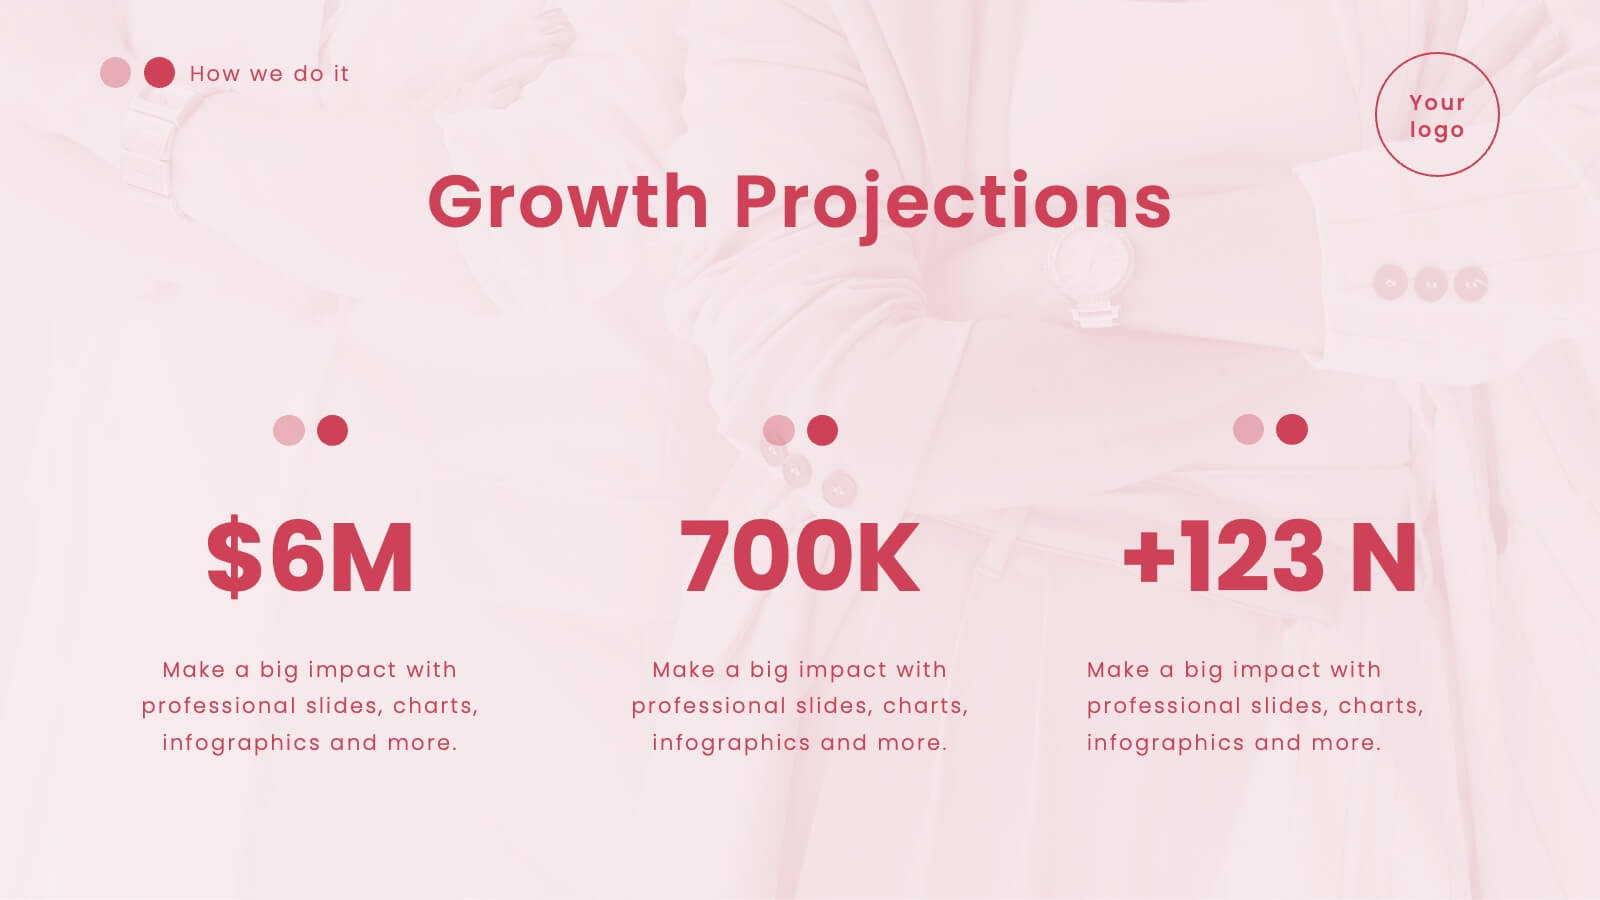
Kinetic Sales Forecast Presentation
Forecast your sales with style using this vibrant template! Perfect for detailing company overview, sales process, team, and strategy. Includes sections for case studies, pricing, and future opportunities. Ideal for sales teams to impress stakeholders. Compatible with PowerPoint, Keynote, and Google Slides.