


Características


¿Tienes alguna pregunta?
Recomendar


7 diapositivas
Process Solution Infographic
Streamline intricate workflows with our process solution infographic. Anchored in a pristine white base and infused with varying shades of professional blue, our template elegantly delineates step-by-step solutions and systematic approaches. Decked with meticulous infographics, representative icons, and versatile image placeholders, it transforms complexities into a navigable visual journey. Masterfully curated for Powerpoint, Keynote, or Google Slides. An invaluable asset for process managers, business analysts, strategists, or any organization keen on optimizing workflows. Navigate processes with confidence; let each slide chart the path to optimized solutions.


5 diapositivas
Feedback Assessment with Smile Ratings Presentation
Visually capture user sentiment with this Feedback Assessment with Smile Ratings slide. Featuring a curved layout with emoticons ranging from happy to unhappy, it’s ideal for showcasing satisfaction levels, survey results, or evaluation stages. Fully customizable in Canva, PowerPoint, or Google Slides—perfect for reports, workshops, or performance reviews.
3 diapositivas
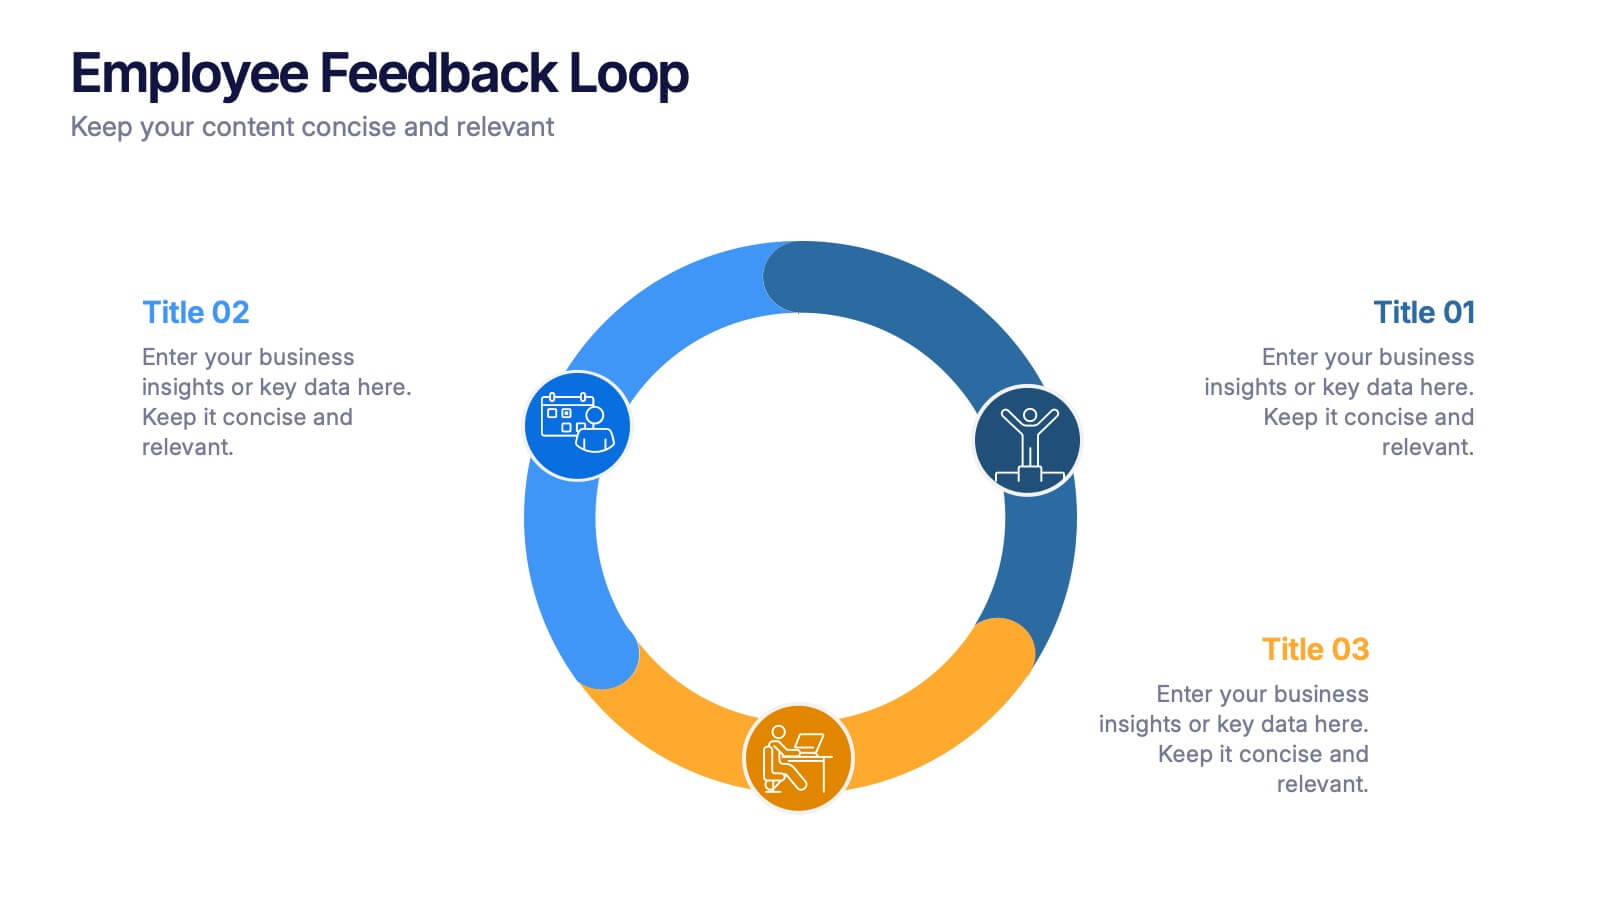
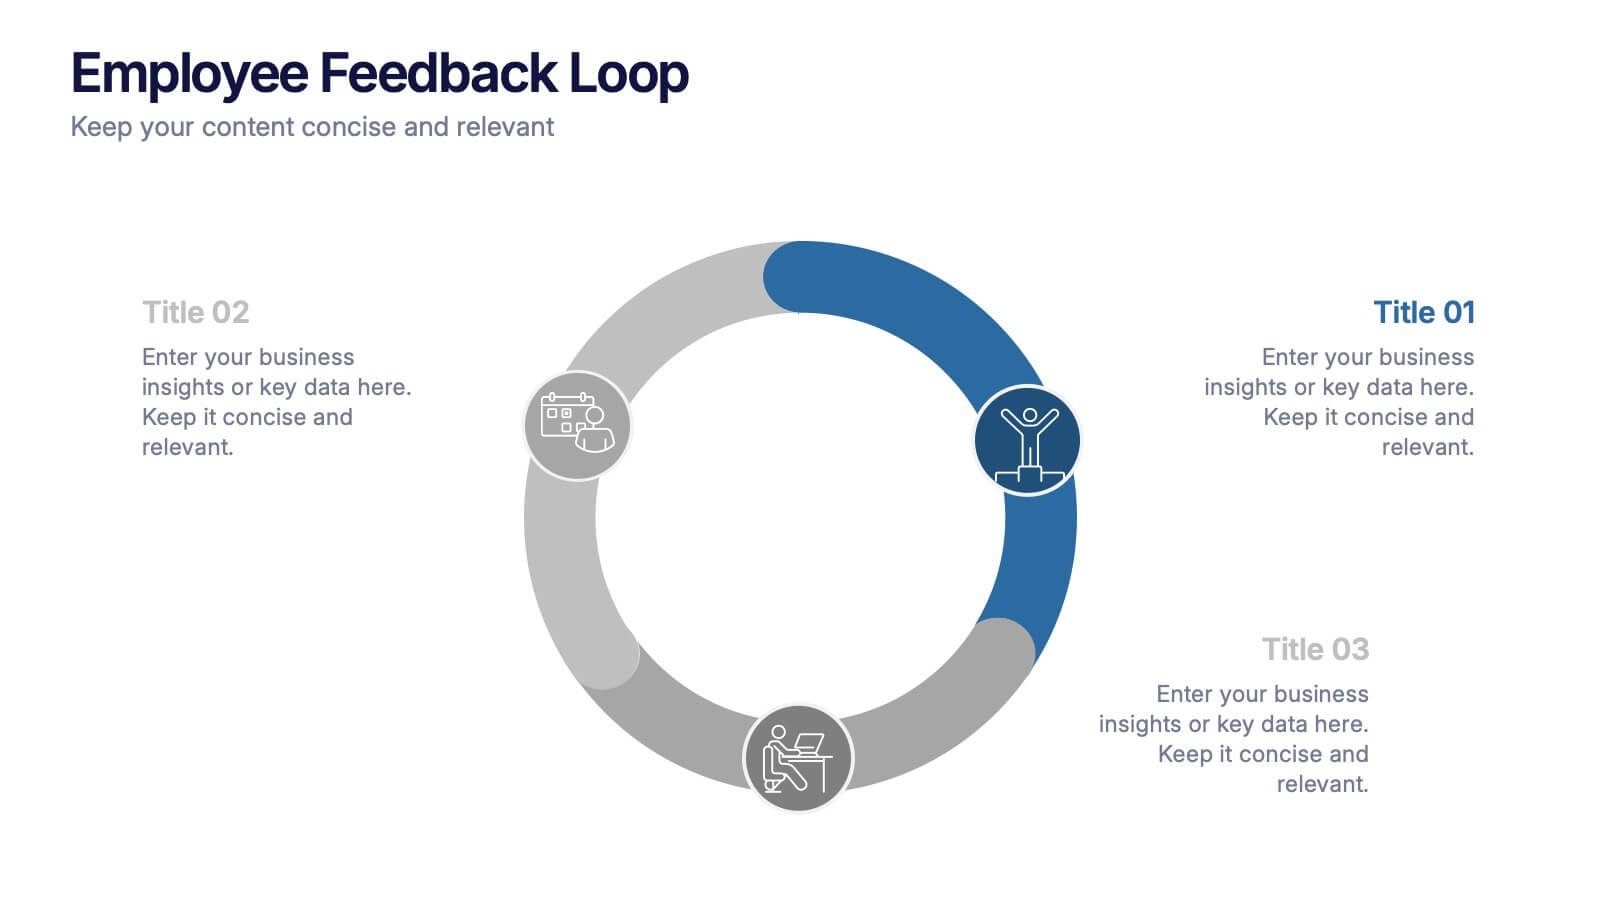
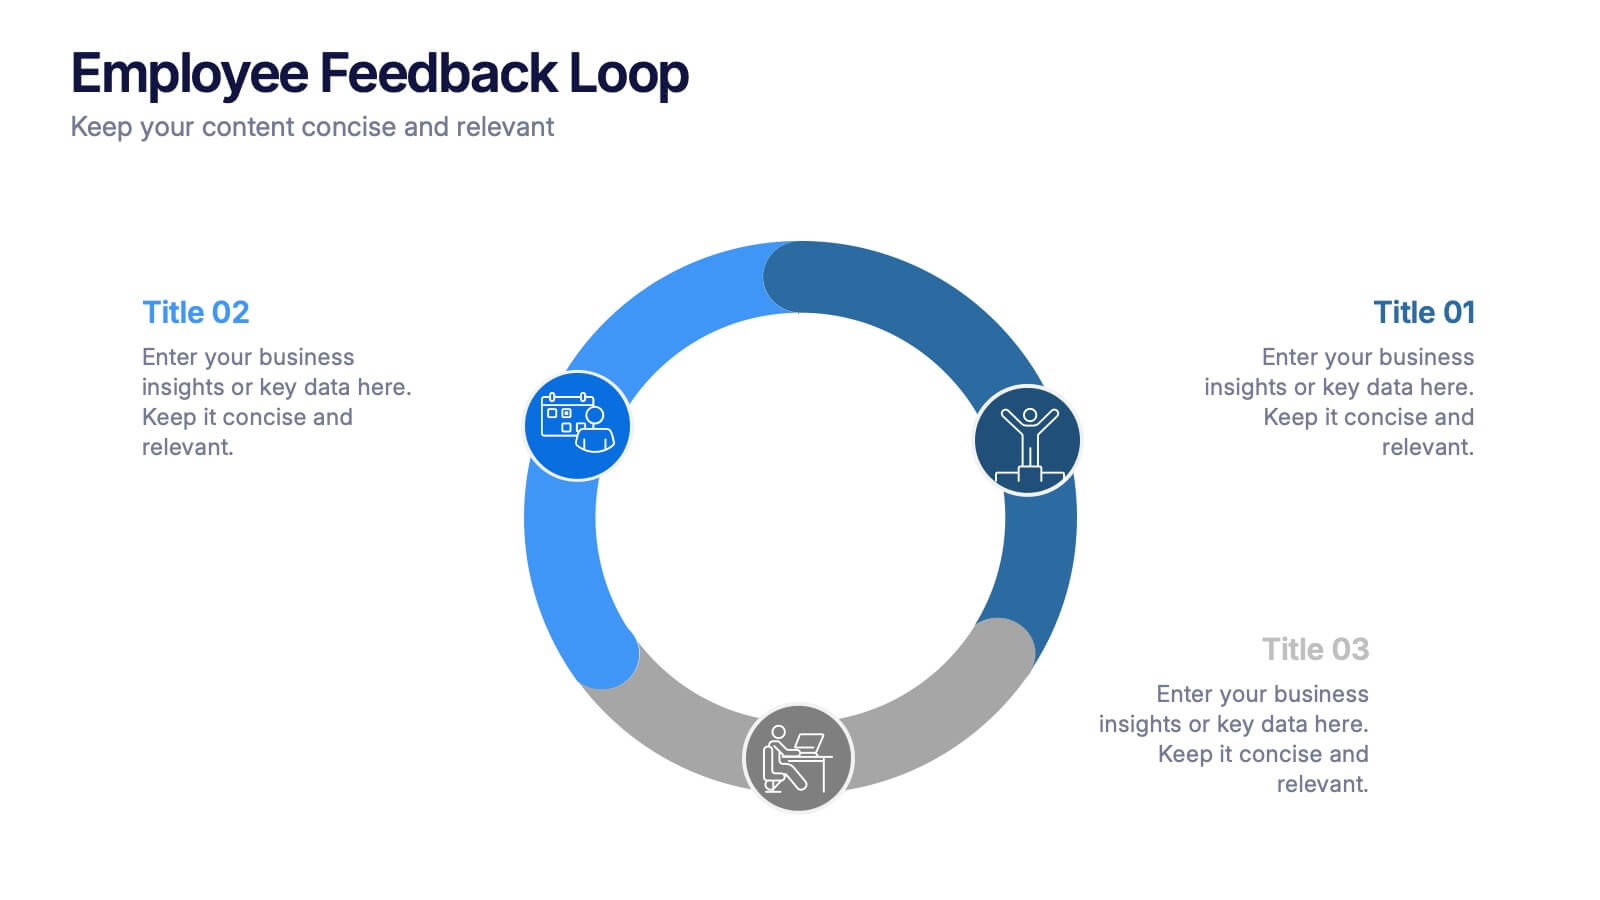
Employee Feedback Loop Presentation
Keep your team connected and continuously improving with this engaging presentation design. Ideal for showcasing communication strategies, feedback cycles, and performance insights, it helps visualize the process of collecting and acting on employee input. Fully customizable and compatible with PowerPoint, Keynote, and Google Slides for effortless, professional presentations.


5 diapositivas
Leadership and Workforce Culture
Inspire growth from the ground up with this bold, step-by-step visual that captures the journey of leadership and team development. From culture-building to individual progress, this layout helps you illustrate each stage clearly and confidently. Fully compatible with PowerPoint, Keynote, and Google Slides.


6 diapositivas
Funding and Return on Investment Overview Presentation
Showcase your funding strategy and ROI journey with this growth-themed infographic. The plant-inspired design visually represents financial progress across six stages, making it perfect for startups, business proposals, or investor updates. Fully editable in PowerPoint, Google Slides, and Keynote for seamless customization and a polished, professional presentation experience.


19 diapositivas
Prism Design Strategy Proposal Presentation
Bring your design strategy to life with this modern and stylish presentation template! Perfect for showcasing your design concepts, processes, and elements, this template ensures that your ideas are communicated effectively. With a sleek layout for design briefs, mood boards, prototypes, and project timelines, it's the ideal tool for creative professionals. Customize it easily in PowerPoint, Keynote, or Google Slides to make a lasting impression on your audience.


20 diapositivas
Leafsong Design Strategy Proposal Presentation
This Design Strategy Presentation Template is perfect for showcasing your creative process, key design elements, and project planning. Covering essential aspects like moodboards, prototypes, and design assets, it ensures a structured and visually appealing approach. Fully customizable and compatible with PowerPoint, Keynote, and Google Slides.


5 diapositivas
Online Advertising and SEO Marketing Presentation
Elevate your digital marketing strategy with this engaging infographic template! Designed for clarity, it simplifies online advertising and SEO concepts, covering key metrics, trends, and strategies. Perfect for teams, clients, or stakeholders, it’s fully customizable and compatible with PowerPoint, Keynote, and Google Slides for seamless presentations that captivate and inform.


3 diapositivas
Service and Product Benefits Overview Presentation
Clearly contrast key features with the Service and Product Benefits Overview Presentation. This modern split-layout design helps you showcase differences between service offerings and tangible products in a clean, side-by-side format. Use it to highlight value propositions, customer benefits, or decision-making factors. Fully editable and compatible with PowerPoint, Keynote, and Google Slides.


10 diapositivas
Agile Project Status Review Presentation
Streamline your Agile methodologies with our "Agile Project Status Review" presentation templates. Designed to enhance visual communication, these templates help you effectively display project phases from start to finish. Ideal for dynamic project management, they are compatible with PowerPoint, Keynote, and Google Slides, ensuring seamless integration into your workflow.


7 diapositivas
Cyber Security Infographic Presentation Template
Cybersecurity helps protect your business from cybercrime and unauthorized access to data. It is a crucial step to safeguard your business from malicious attacks that can lead to confidential data being stolen, as well as loss of revenue through fraudulent transactions. With this template you can ensure that you and your business are well informed on the importance of cybersecurity. This template will provide you with a good starting point to create a cybersecurity strategy. This template includes illustrations on goals, benefits, limitations and recommendations based on your audience's needs.


6 diapositivas
Environmental Services Infographic
The environment refers to the natural world and the surroundings in which living organisms exist. This infographic template highlights various aspects of environmental services and their importance in promoting sustainability and protecting the environment. The infographic utilizes visually appealing graphics, icons, and illustrations related to the environment, nature, and sustainability. These visuals capture viewers' attention and make the information more engaging. This infographic is designed to educate viewers on the different types of environmental services and their impact on environmental conservation and resource management.


7 diapositivas
IT Architecture Solution Infographic
Enhance your presentations with our IT Architecture Solution infographic, tailored for optimal clarity in Powerpoint, Keynote, and Google Slides. This infographic offers a comprehensive visual tool to simplify complex IT structures, ideal for professionals aiming to articulate intricate systems with ease. Its design facilitates a clear understanding of hierarchical IT frameworks, making it perfect for educational environments, business meetings, and tech conferences. Our IT Architecture Solution infographic is crafted to aid in the seamless conveyance of IT strategies and structures. The intuitive layout provides a straightforward narrative to IT infrastructure, ensuring your audience grasps technical details without feeling overwhelmed. This infographic is a must-have for anyone presenting IT concepts, delivering a balanced combination of simplicity and detail that caters to both novice and expert levels. With compatibility across various presentation platforms, this infographic integrates smoothly into your existing slides, enhancing your ability to communicate effectively in the digital age. Elevate your IT presentations with this essential visual aid.


2 diapositivas
Elegant Title Slide Design Presentation
Dress your presentation in sophistication with the "Elegant Title Slide," where simplicity meets style. This template elegantly frames your opening remarks in a polished and refined layout, highlighted by a chic, contemporary office backdrop. Perfect for any business aiming to impress, it's fully compatible with PowerPoint, Keynote, and Google Slides. Elevate your presentation game with this seamlessly designed slide.


10 diapositivas
SEO and Social Media Marketing Presentation
Shine a spotlight on your brand’s digital growth with this bold and professional layout designed to showcase analytics, engagement, and SEO strategies. Ideal for marketers, strategists, and agencies, it transforms data into visuals that persuade and inform. Fully compatible with PowerPoint, Keynote, and Google Slides for easy editing.


8 diapositivas
Value Chain Optimization and Analysis Presentation
Streamline Your Business for Maximum Efficiency with this Value Chain Optimization and Analysis presentation template. This visually engaging template is designed to map, analyze, and enhance the key activities in your value chain, helping businesses identify opportunities for cost reduction, performance improvements, and strategic advantages. Featuring a clean flowchart layout, intuitive color-coded sections, and editable placeholders, this template is ideal for business analysts, consultants, and executives. Fully compatible with PowerPoint, Keynote, and Google Slides, ensuring seamless customization and professional delivery.


6 diapositivas
Career Objective Infographic
Objective slides help communicate goals, aims, and purpose of the presentation to the audience. This infographic template is a visual representation that communicates your career goals, aspirations, and the value you bring to potential employers. This template serves as a roadmap for your presentation, helping both you and your audience understand the purpose and direction of your objective. Compatible with Powerpoint, Keynote, and Google Slides. This showcases your career objectives and key qualifications. Use a design that reflects your industry and personal brand while conveying your career objectives effectively.