


Características


¿Tienes alguna pregunta?
Recomendar


7 diapositivas
Stock Market Sectors Infographic
Dive deep into the intricacies of stock market sectors with our comprehensive infographic. Utilizing a palette of white, green, and red, this visual tool breaks down the vast expanse of the stock market into distinct sectors, making it easier to comprehend and analyze. Ideal for investors, stock market enthusiasts, financial educators, and students alike, this infographic provides a clear snapshot of the financial landscape. With its effortless integration into PowerPoint, Keynote, and Google Slides, sharing and presenting this crucial market information becomes seamless and engaging.


5 diapositivas
Investment Opportunity Business Case
Visualize the value behind your proposal with this key-themed layout, ideal for presenting compelling reasons to invest. Each section highlights a unique point, making it easy to walk stakeholders through critical benefits and insights. Fully editable and compatible with PowerPoint, Keynote, and Google Slides.


7 diapositivas
Sales Cycle Infographic
A sales cycle, refers to the series of stages or steps that a salesperson or a sales team follows to convert a prospective customer into a paying customer. This infographic template is a structured approach to lead a potential customer from the initial contact to making a purchase. Compatible with Powerpoint, Keynote, and Google Slides. This is an illustrative guide to the fundamental stages of the sales journey. Equip yourself with an understanding of how sales progress, from prospecting to closing the deal, enabling you to optimize your strategies and drive success in the dynamic world of sales.


8 diapositivas
Business Competitive Analysis
Break down your market strategy into clear, actionable steps with this streamlined analysis slide. Featuring an 8-step horizontal layout with bold icons and color-coded segments, it helps visualize competitive research and planning at a glance. Easily customizable in PowerPoint, Keynote, and Google Slides.


21 diapositivas
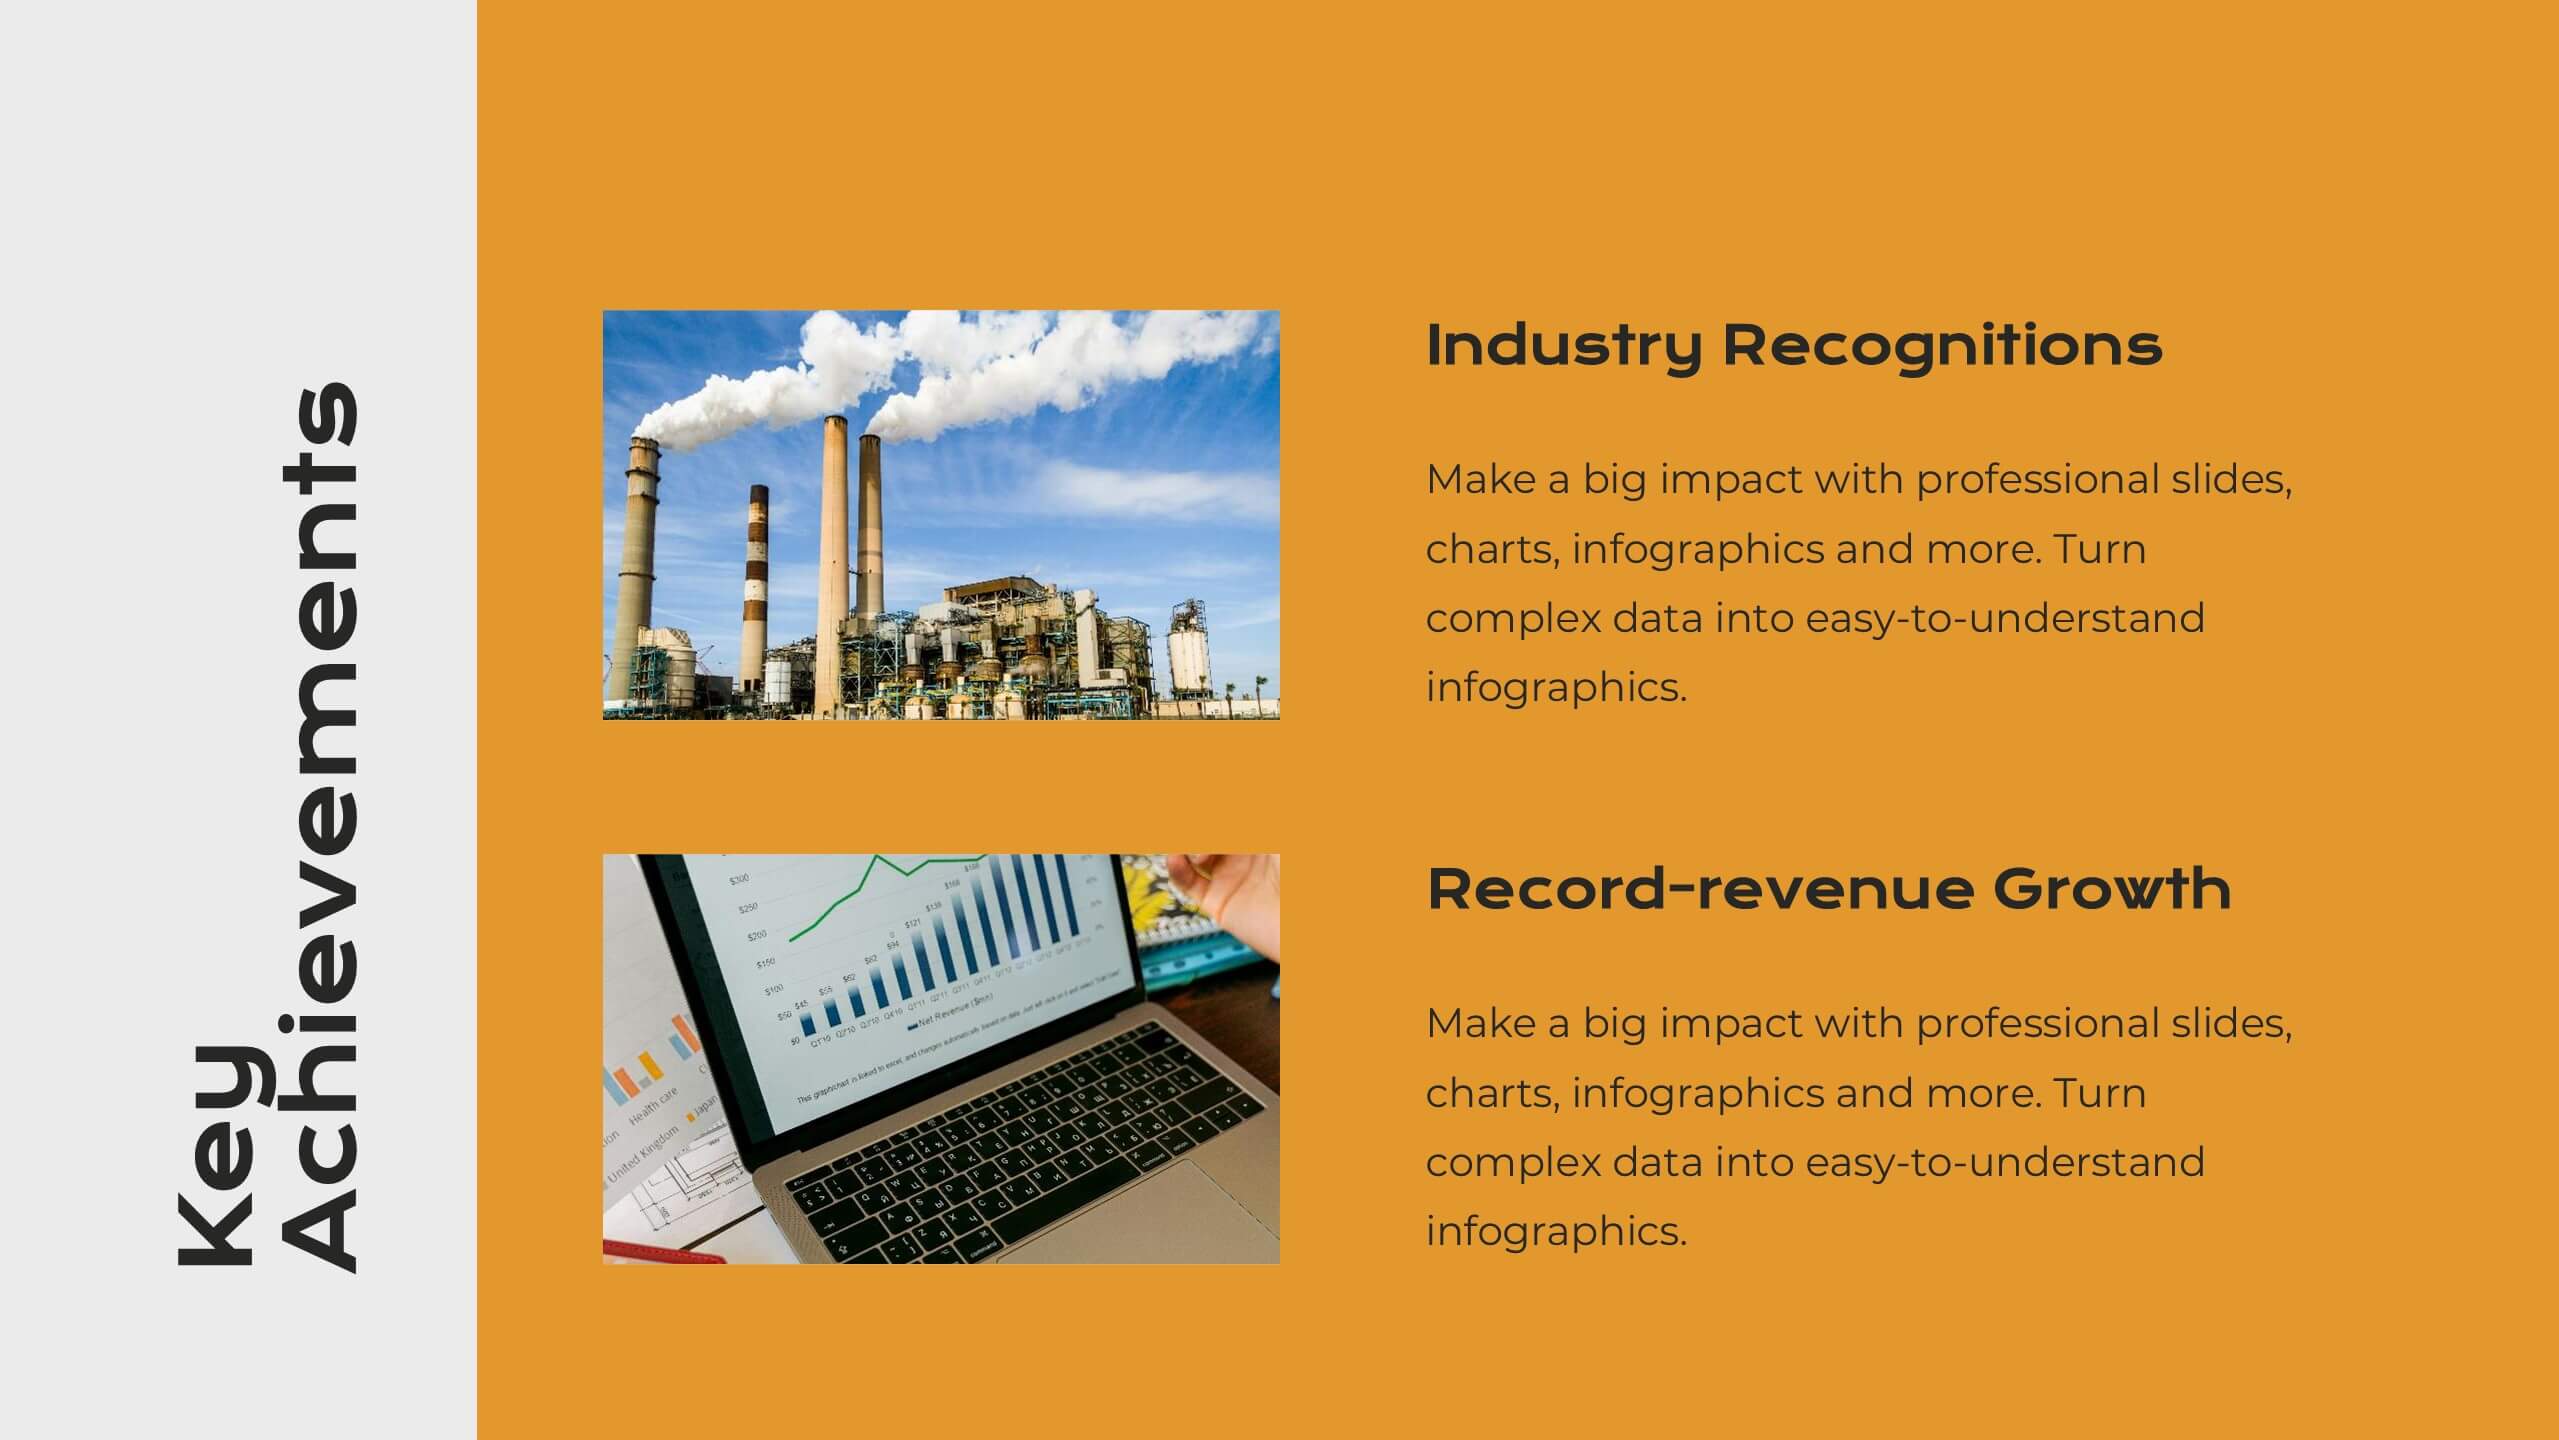
Delta Marketing Campaign Presentation
This dynamic Marketing Campaign template covers everything from market presence to target audience and financial highlights. With a sleek, professional design, it helps you showcase your brand’s unique selling points and industry recognition. Compatible with PowerPoint, Keynote, and Google Slides for easy, impactful presentations.


7 diapositivas
Gap Analysis Infographic Presentation Template
A Gap Analysis is a tool that can significantly help you achieve your goals. It tells you where the gaps are in between two things, and how to fill them. Use our gap analysis template for your next project to understand the strengths and weaknesses of your business in relation to competitors, industry trends and best practices. This template has sections for naming the gap analysis and describing its objectives, identifying gaps between current state performance levels and desired state performance levels, discussing how these gaps could be addressed and identify further actions to be taken.


21 diapositivas
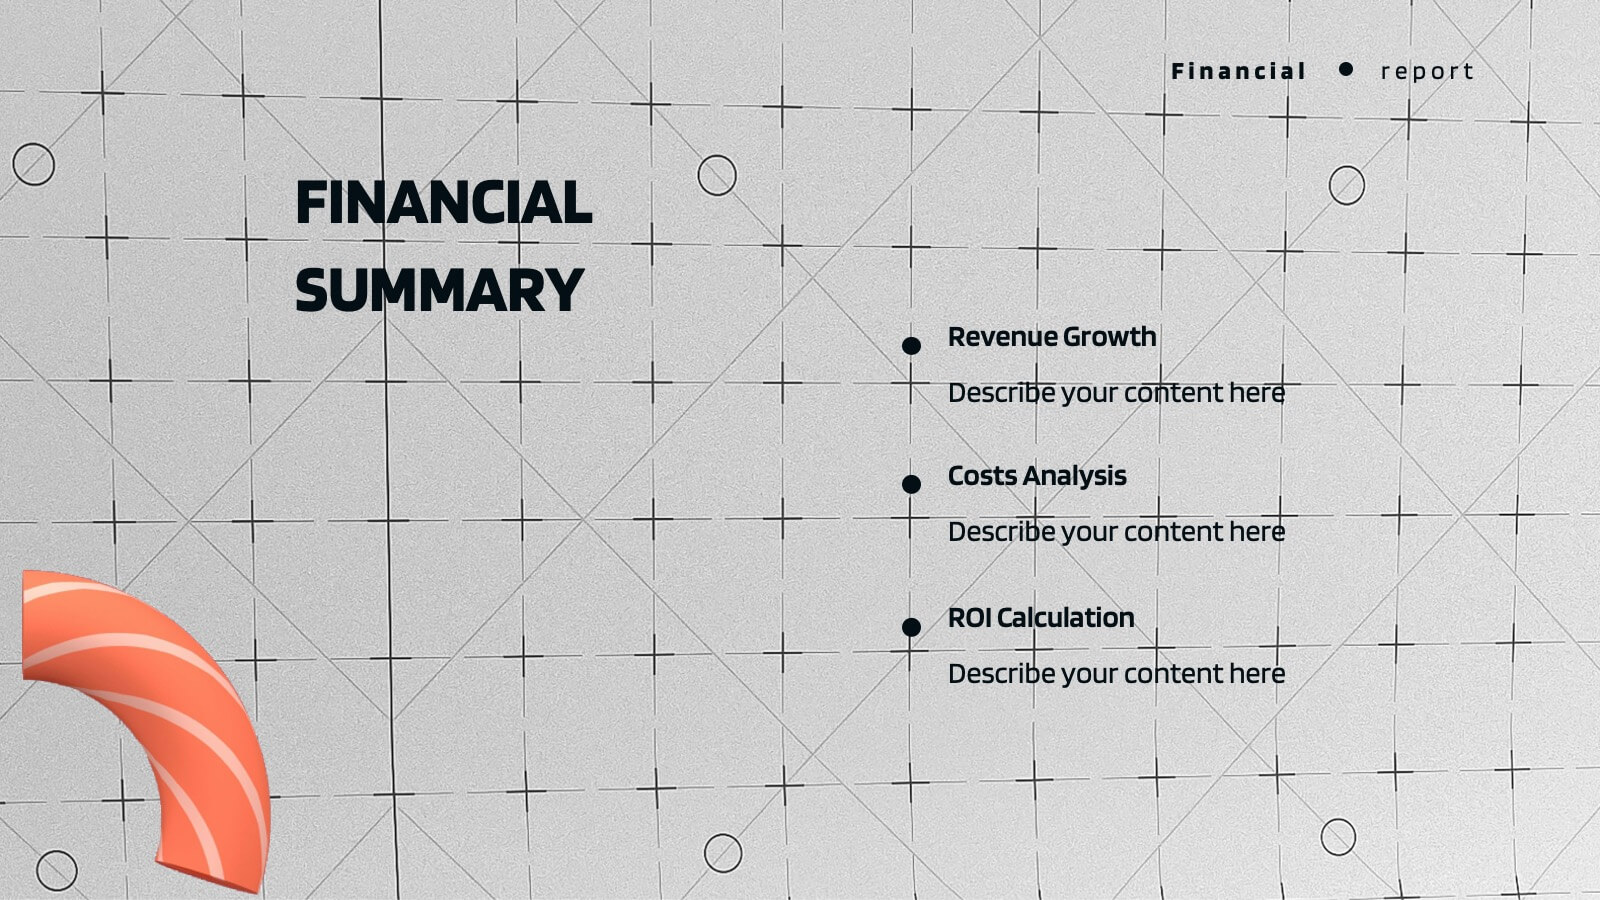
Auster Financial Report Presentation
Present financial insights with clarity using this comprehensive report template. Highlight key metrics, performance, project progress, competitor analysis, and strategic initiatives. Includes sections for team productivity, market trends, goals, and recommendations. Perfect for business reviews and updates. Fully customizable for PowerPoint, Keynote, and Google Slides.


5 diapositivas
USA Demographic Map Presentation
Visualize regional insights effortlessly with this USA Demographic Map Presentation. Featuring editable color-coded state maps and matching infographic sections, this template is ideal for presenting population data, customer distribution, or market segmentation. Fully compatible with PowerPoint, Keynote, and Google Slides.


5 diapositivas
Experience-Based Smile Scorecard Presentation
Measure sentiment with ease using this Experience-Based Smile Scorecard slide. Designed with a vertical battery-style layout, each tier represents a distinct emotional level—from dissatisfied to happy. Ideal for visualizing user experiences, customer feedback, or service quality. Fully editable and compatible with PowerPoint, Canva, and Google Slides.


7 diapositivas
Circle Planning Infographic
Embark on holistic planning with our circle planning infographic. Encased within a pure white canvas and punctuated with harmonious green, insightful purple, and strategic blue, our template encapsulates the cyclical nature of meticulous planning. Endowed with concise infographics, indicative icons, and adaptable image placeholders, it elucidates the continuity and stages of planning processes. Flawlessly designed for Powerpoint, Keynote, or Google Slides. An irreplaceable tool for project managers, business strategists, educators, or any professional aiming for a rounded approach to planning.


21 diapositivas
Synergywave Financial Report Presentation
Deliver your financial insights with clarity using this comprehensive report presentation! It covers key sections like performance metrics, sales updates, market trends, and strategic initiatives, ensuring all critical data is well-organized. Whether for stakeholders or internal reviews, this template ensures seamless communication. Fully compatible with PowerPoint, Keynote, and Google Slides.


3 diapositivas
Governance and Compliance Slide Presentation
Bring structure and clarity to complex corporate processes with this modern triangle-based presentation design. Ideal for showcasing governance principles, compliance strategies, and operational standards, it visually balances accountability and efficiency. Fully editable and compatible with PowerPoint, Keynote, and Google Slides for seamless professional customization.


5 diapositivas
IT Infrastructure and Architecture
Visualize your tech ecosystem with this layered pyramid infographic designed for showcasing IT infrastructure components. Ideal for CIOs, network architects, or IT consultants, this slide highlights five essential levels—from hardware to services. Fully editable in PowerPoint, Keynote, and Google Slides.


5 diapositivas
Agriculture Industry Infographics
Delve into the heart of the agricultural sector with our agriculture industry infographics. Cast in the earthy tones of green and yellow, reflecting growth and harvest, this template brings the farming industry to your fingertips. Its creative, vertical design infused with farm-style aesthetics makes it perfect for agricultural educators, and farming consultants seeking to present data with a touch of nature's essence. Compatible with Powerpoint, Keynote, and Google Slides. The template boasts graphics, intuitive icons, and flexible image placeholders. From showcasing industry trends to unraveling complex farming processes.


5 diapositivas
Key Business Question Breakdown Presentation
Present critical insights with this keyhole-themed layout, perfect for outlining strategic business questions or core decision points. The six-segment format allows you to break down complex topics into clear, actionable areas. Fully customizable in Canva, PowerPoint, or Google Slides—ideal for planning, workshops, or stakeholder presentations.


8 diapositivas
Chain of Command Mapping Presentation
Clarify your organizational flow with the Chain of Command Mapping Presentation. This template is ideal for visualizing reporting lines, departmental authority, and team structures in a clean, easy-to-follow format. Featuring modern icons, varied layouts, and editable labels, it helps simplify decision-making and responsibility tracking. Fully customizable in PowerPoint, Keynote, Canva, and Google Slides.


6 diapositivas
Team Collaboration Overview Presentation
Showcase team structure and collaboration dynamics with this clear, visual overview. Highlight roles, communication flow, and key contributors using a clean layout with up to five team members. Ideal for onboarding, planning, or reporting sessions. Fully editable in PowerPoint, Keynote, and Google Slides—perfect for any organizational or project-based setting.