


Características


¿Tienes alguna pregunta?
Recomendar


4 diapositivas
RACI Matrix for Role Assignment Presentation
Simplify team roles and task ownership with this RACI Matrix for Role Assignment slide. Clearly map out who is Responsible, Accountable, Consulted, and Informed for each project task across team members. Ideal for project planning, team meetings, or stakeholder alignment. This structured matrix layout allows easy customization for names, tasks, and role indicators. Fully editable and compatible with PowerPoint, Keynote, and Google Slides.


5 diapositivas
Cognitive Psychology Framework Presentation
Unlock insights in the most visual way possible with this bold, brain-powered slide! This presentation template helps simplify complex ideas behind how we think, reason, and remember—perfect for research, education, or team workshops. Fully customizable and compatible with PowerPoint, Keynote, and Google Slides for seamless editing across platforms.


4 diapositivas
Strategic Risk Assessment and Control Presentation
Highlight layered risk priorities with the Strategic Risk Assessment and Control Presentation. This visual template uses a 3D concentric model (D to A) to illustrate escalating risk levels or control measures. Ideal for risk managers and compliance teams. Fully editable in PowerPoint, Google Slides, and Canva for seamless customization.


7 diapositivas
Strategic Matrix Comparison Framework Presentation
Easily compare business risks, priorities, or strategic choices with this matrix comparison framework. Featuring editable grids for mapping likelihood and impact, it’s perfect for decision-making and performance analysis. Highlight key categories using color-coded segments. Fully customizable and compatible with PowerPoint, Google Slides, and Keynote for professional presentations.


6 diapositivas
Business Scheduling Calendar Presentation
The "Business Scheduling Calendar" presentation template provides a clear and structured visual tool for planning and tracking tasks across a business quarter or year. Each week is distinctly highlighted, and tasks can be listed under specific days to enhance week-to-week planning. This format is highly beneficial for organizations aiming to maintain a visual overview of key tasks and deadlines, ensuring nothing is overlooked. The design allows for easy updates and can be adjusted to suit different time frames or project scales, making it an essential tool for effective time management and project planning
21 diapositivas
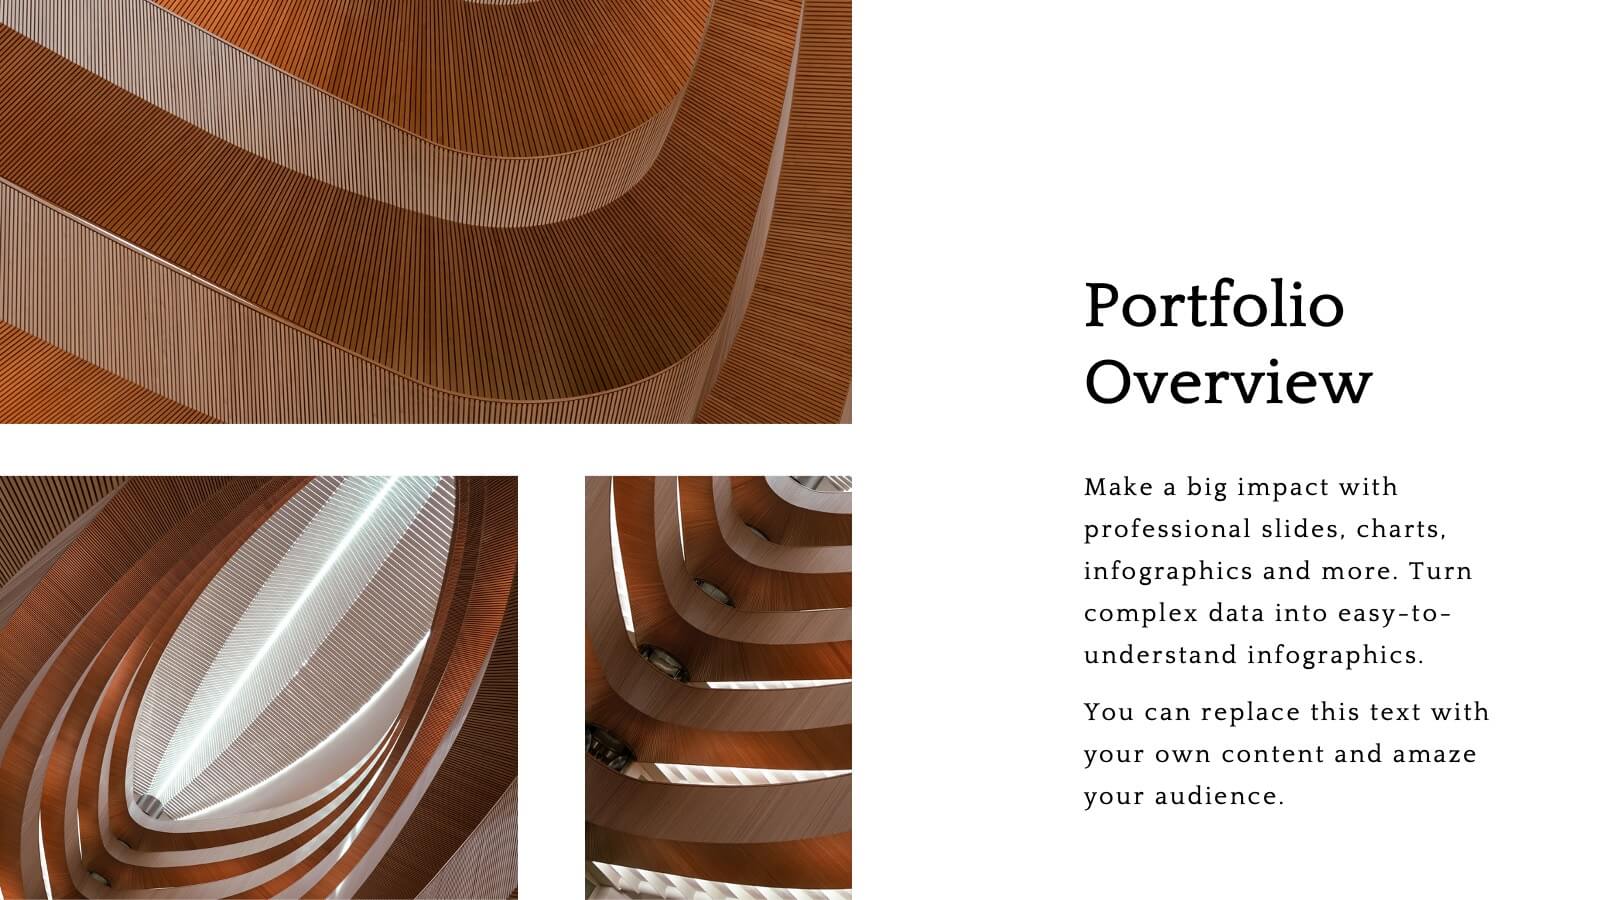
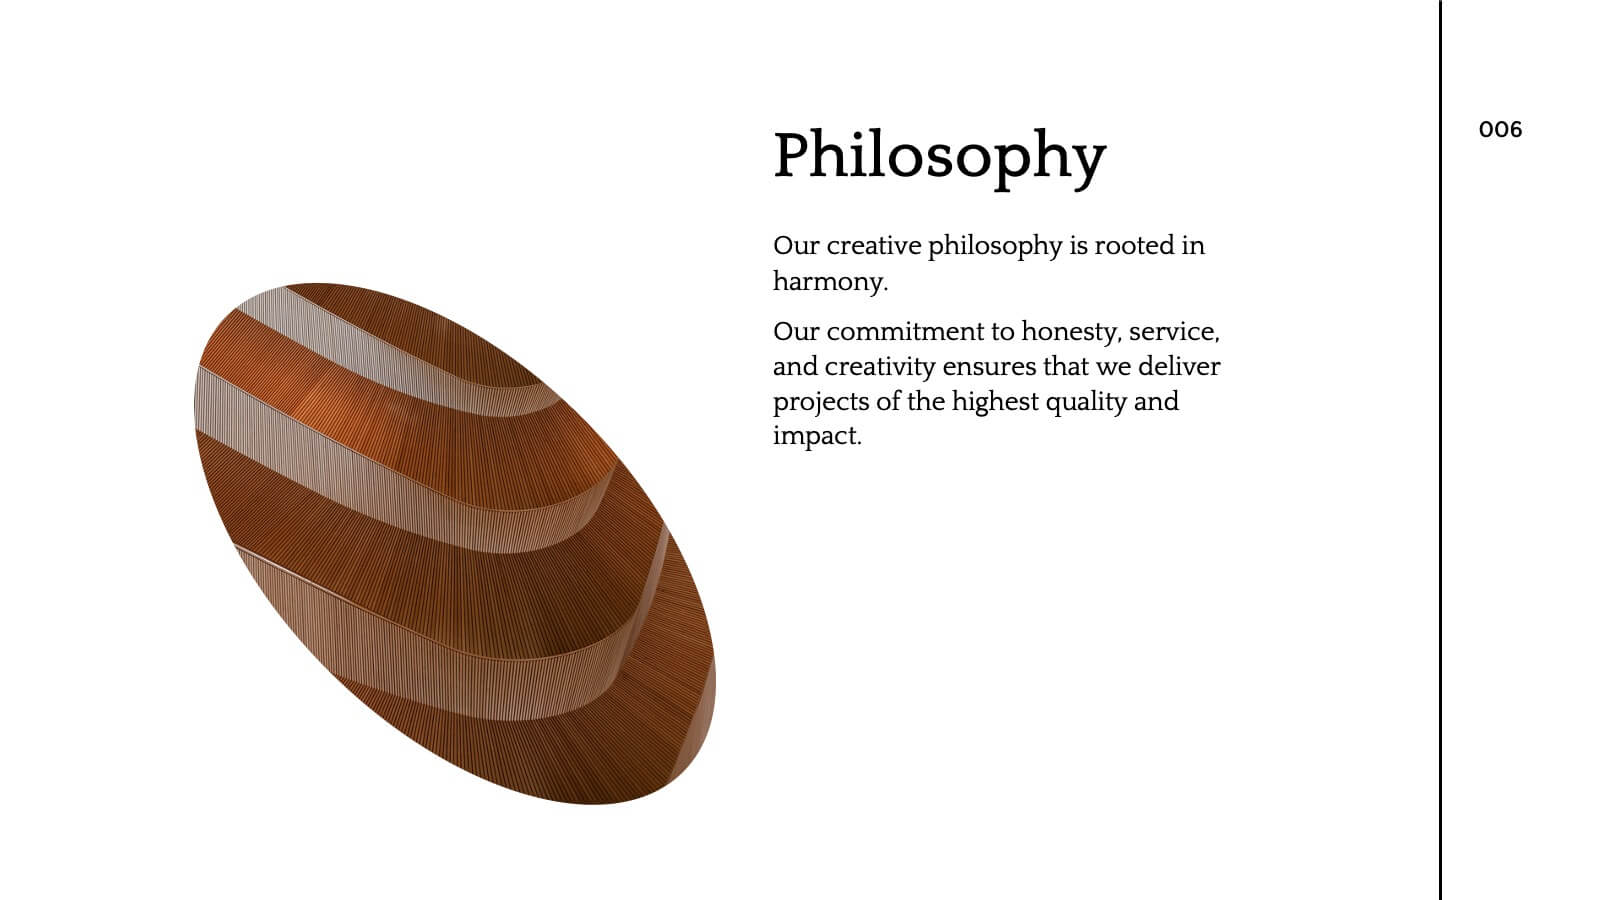
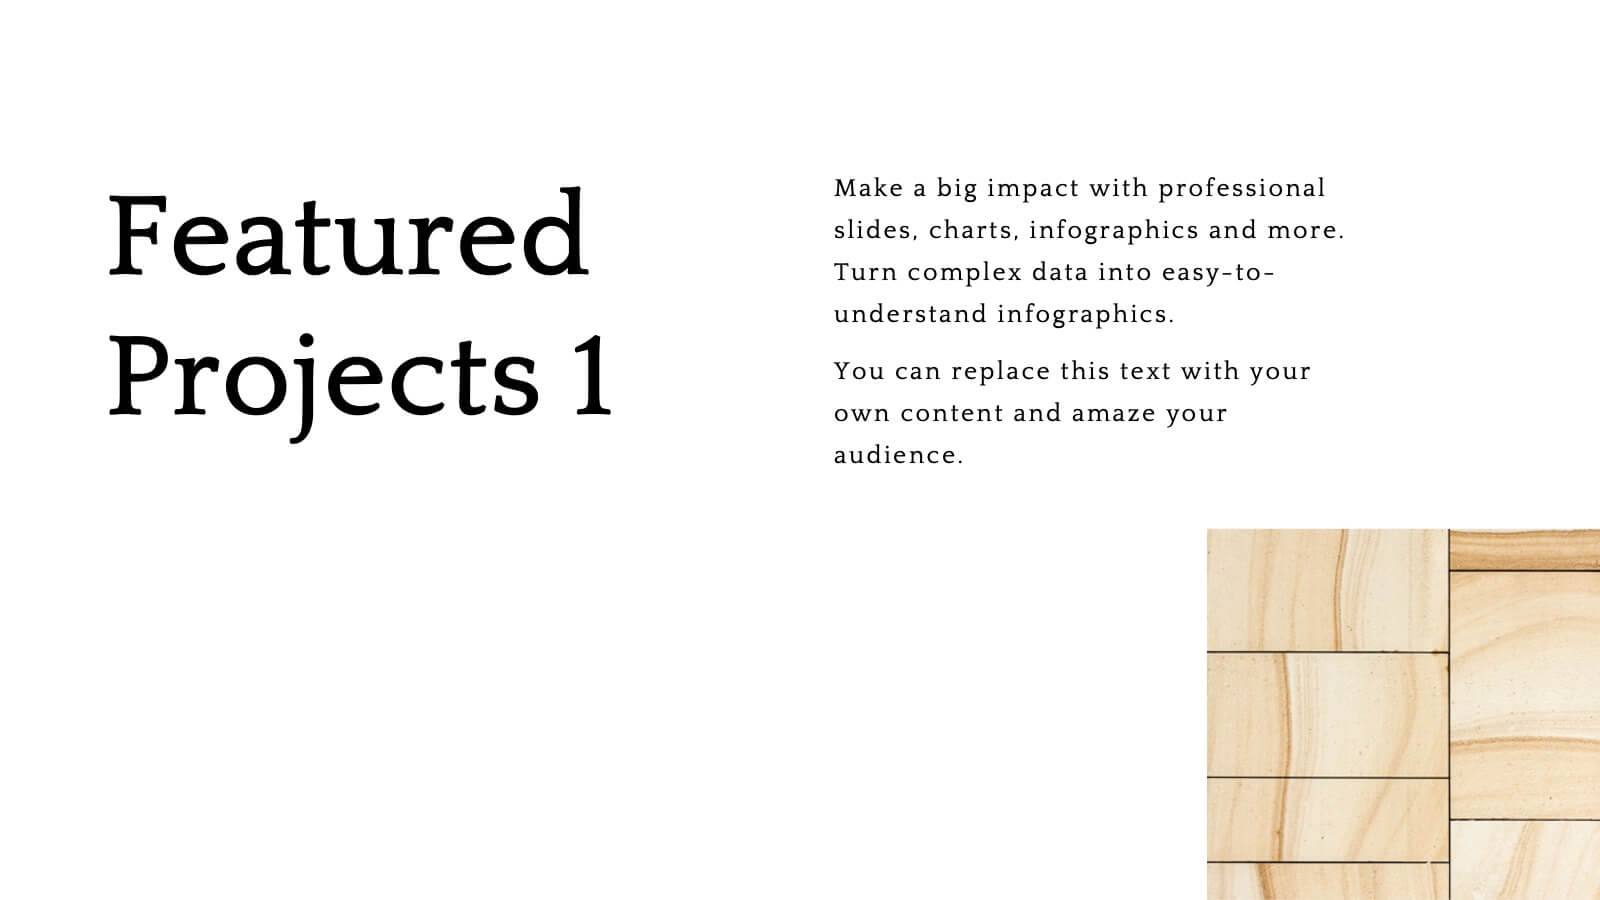
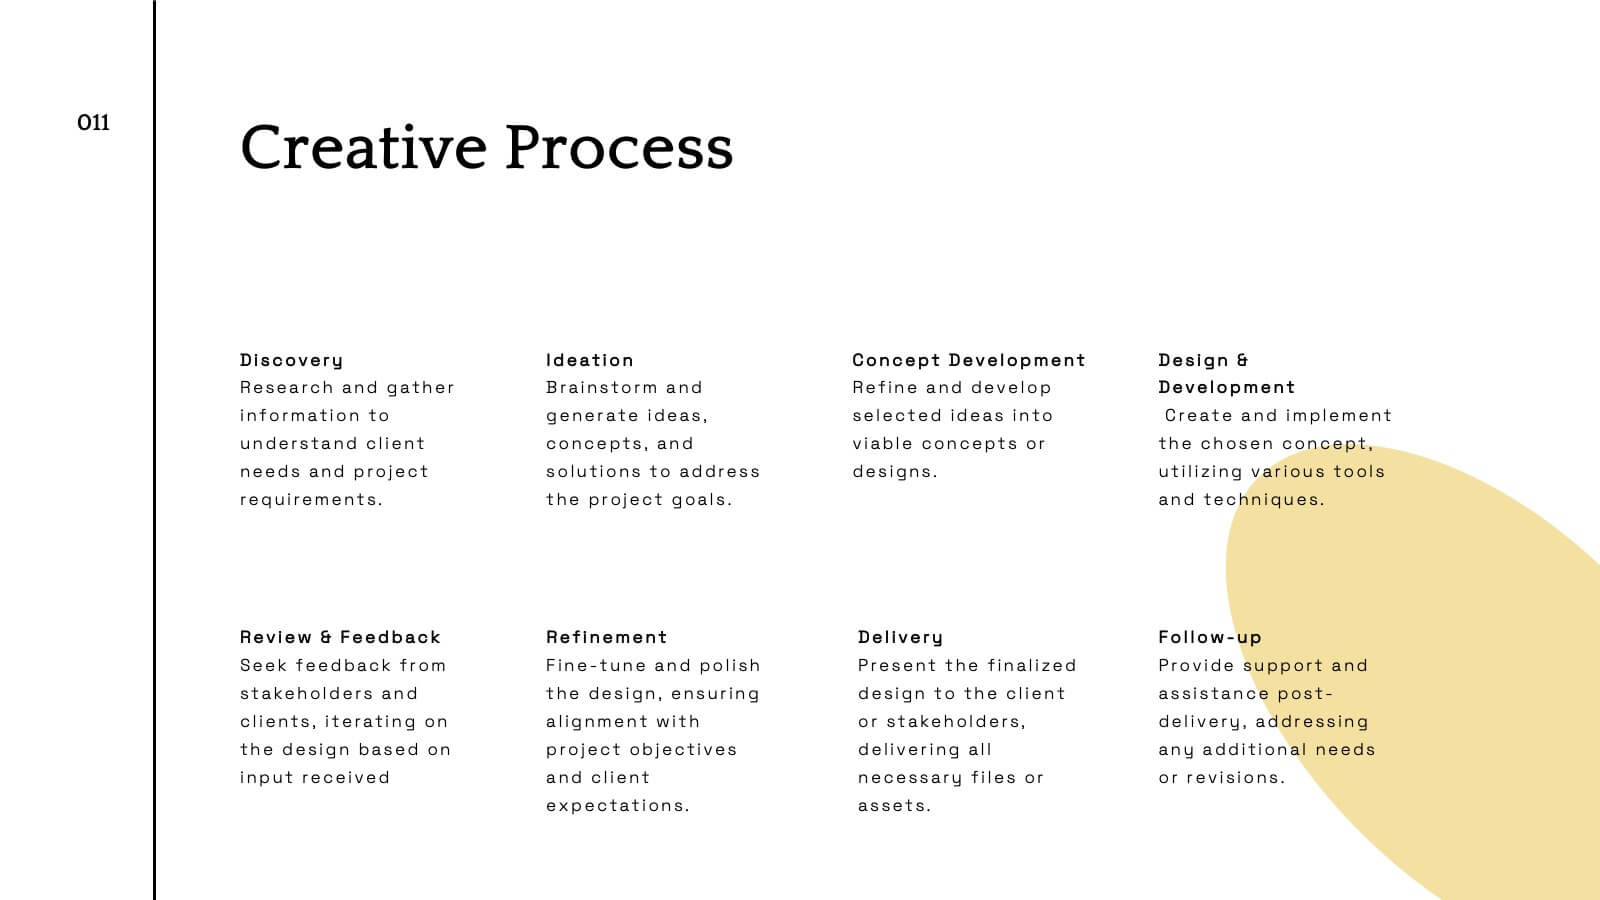
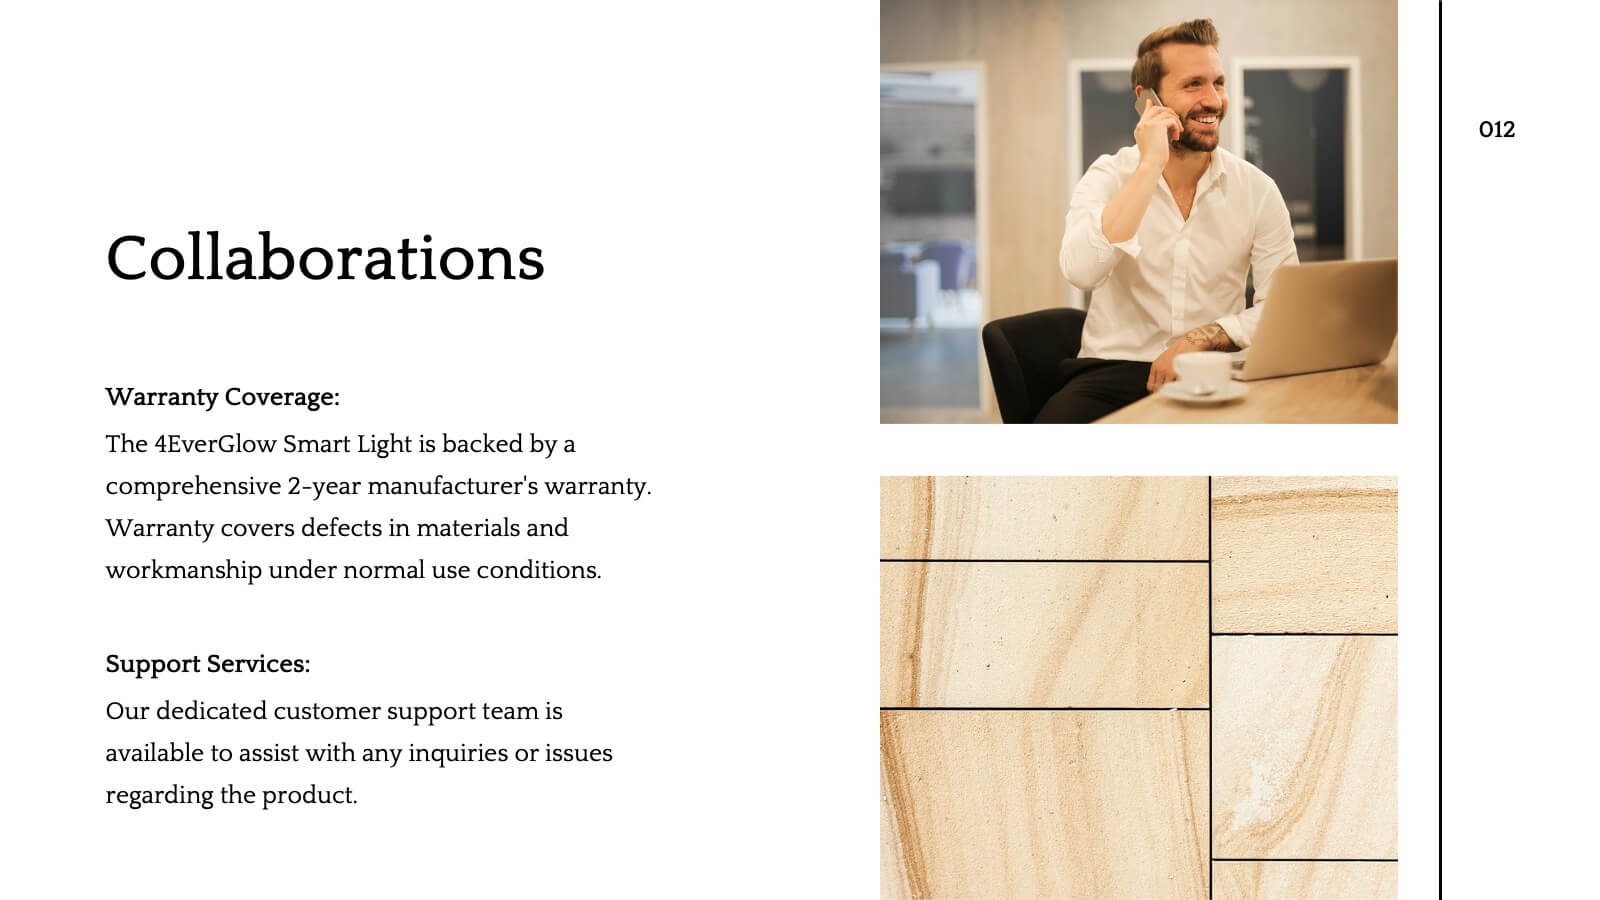
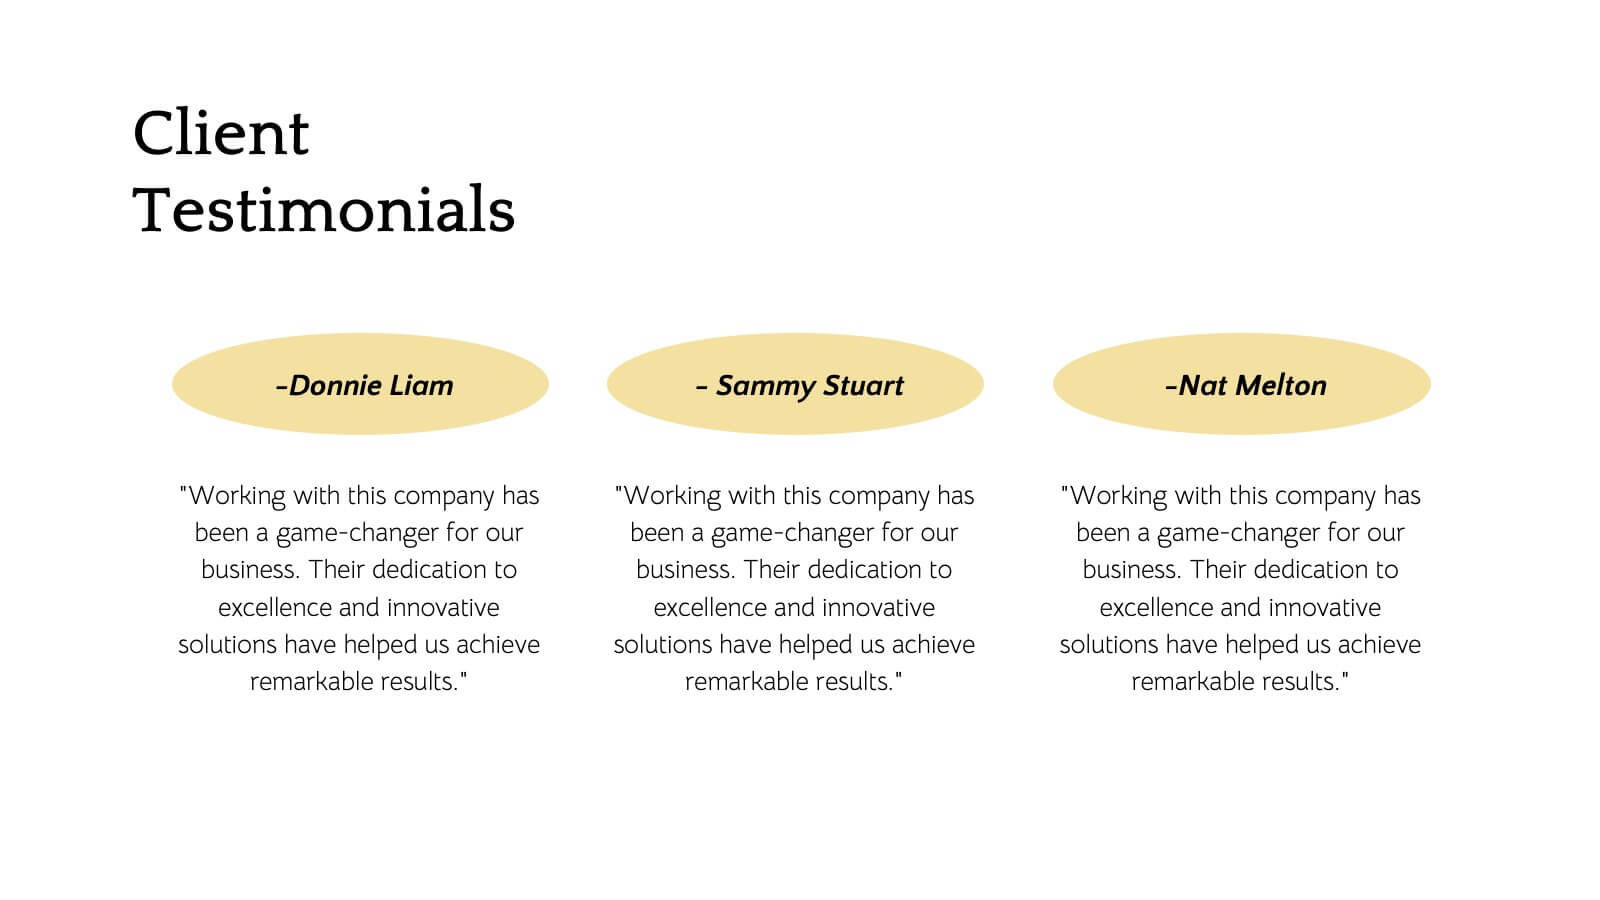
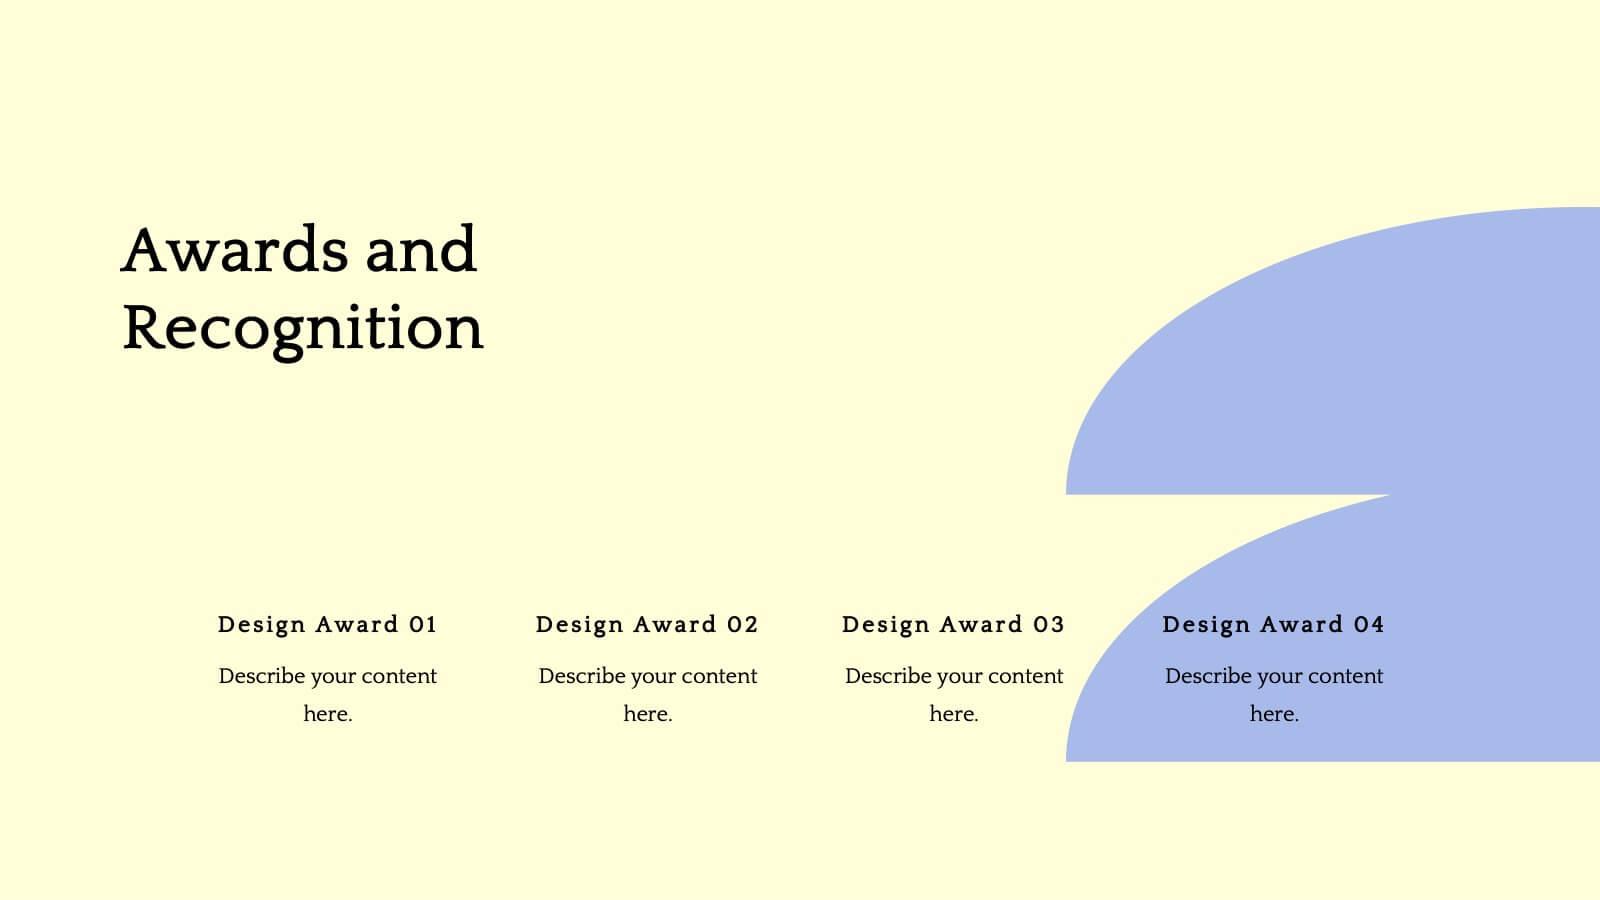
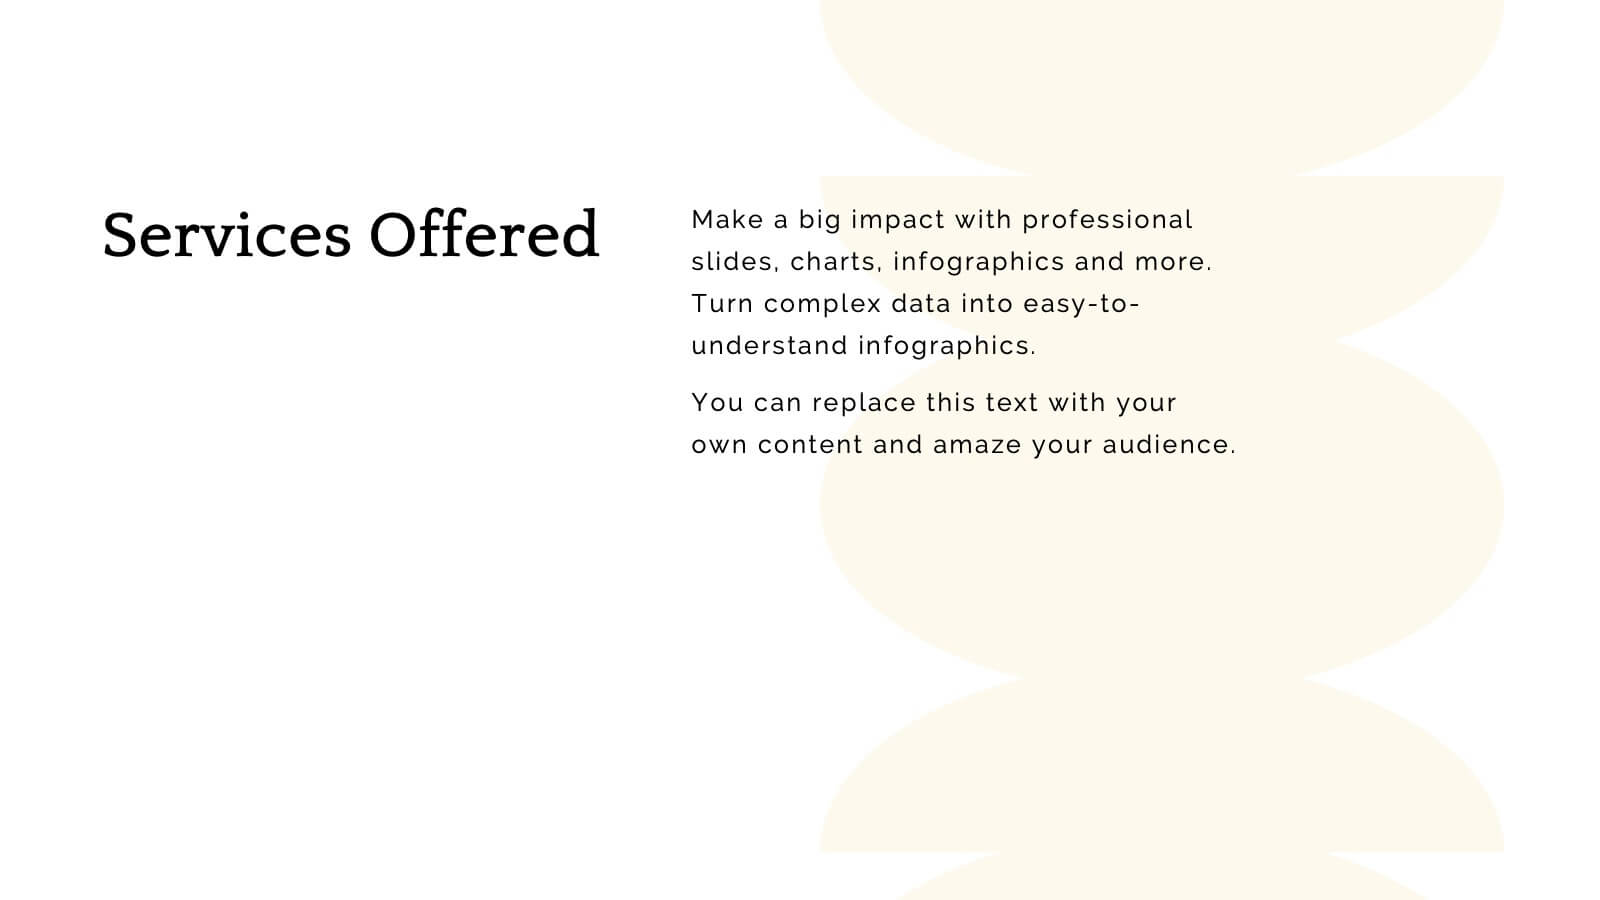
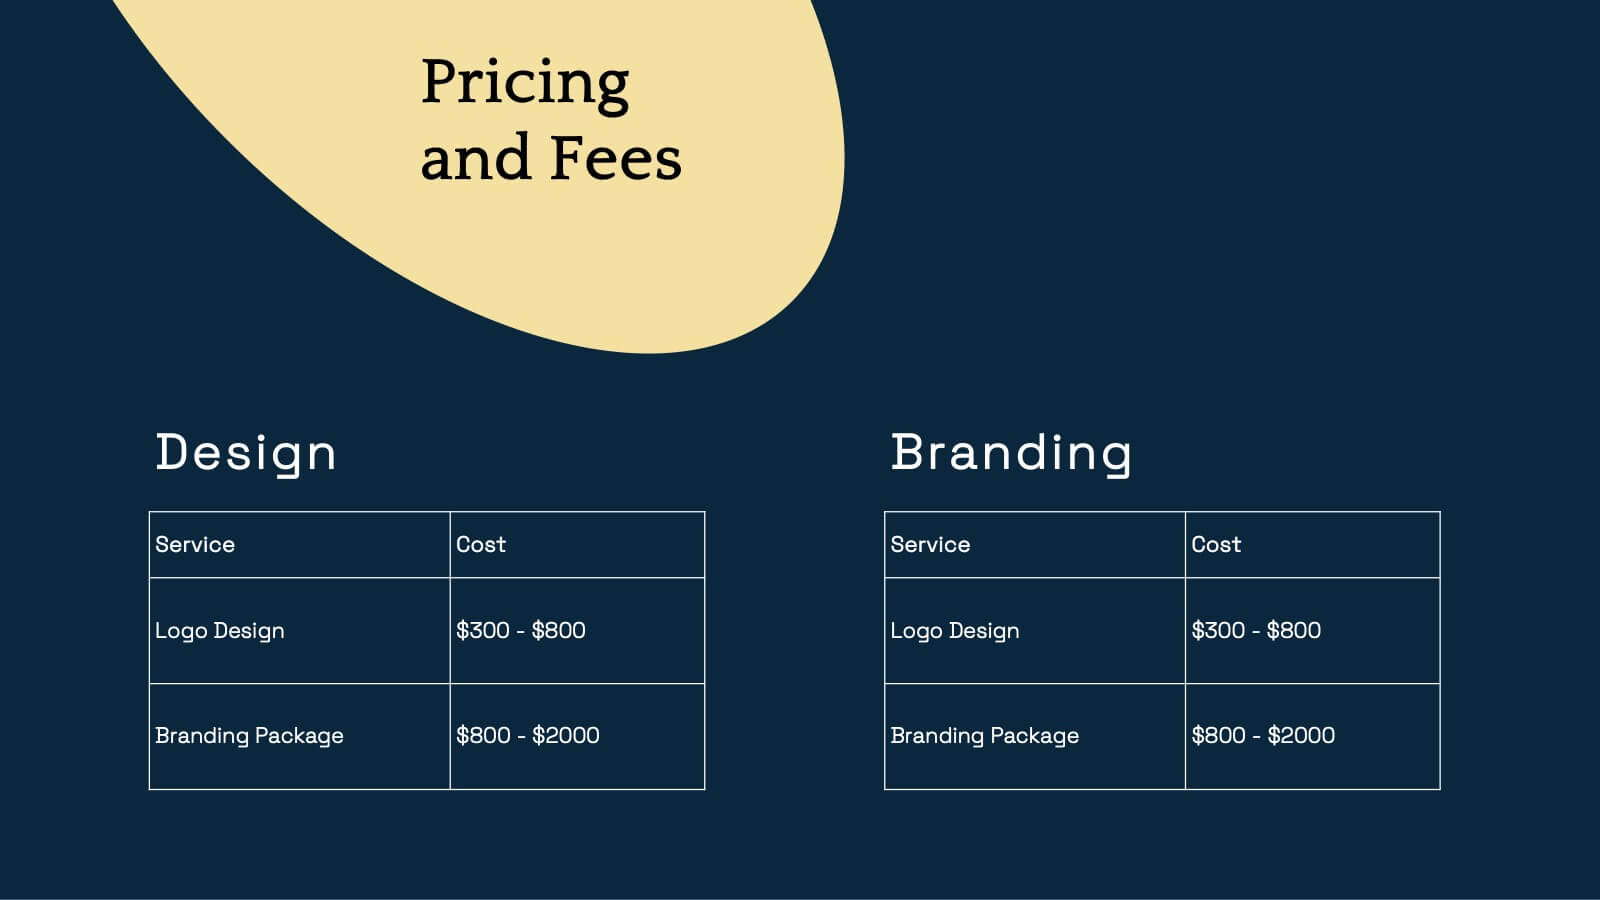
Flare Creative Portfolio Presentation
Showcase your creative work with this elegant portfolio template! Perfect for highlighting projects, client testimonials, and services offered. Ideal for artists, designers, and creatives aiming to impress clients and collaborators. Compatible with PowerPoint, Keynote, and Google Slides, this template ensures your portfolio is clear, professional, and visually stunning. Make your work shine!


5 diapositivas
Water Sustainability & Resource Use Presentation
Visualize environmental impact with this unique cloud-and-rainfall diagram layout. Ideal for presenting five key points related to sustainability, resource management, or water usage. Each droplet icon guides attention across your content clearly. Fully editable and compatible with PowerPoint, Keynote, and Google Slides for effortless customization and impactful storytelling.


5 diapositivas
Value Chain Business Model Presentation
Spark fresh insight into how your organization creates value with this clean, arrow-based layout that makes every step feel intuitive and action-ready. This presentation breaks down key activities, support processes, and improvement opportunities in a clear visual flow perfect for strategy discussions. Fully compatible with PowerPoint, Keynote, and Google Slides.


3 diapositivas
Sustainabilitiy Management Plan Framework Presentation
Turn your sustainability goals into a clear, actionable plan with this dynamic presentation design. Ideal for showcasing environmental strategies, performance metrics, and corporate responsibility initiatives, it combines clarity with visual balance to engage audiences. Fully editable and compatible with PowerPoint, Keynote, and Google Slides for seamless customization and delivery.


5 diapositivas
Problem Framing and Opportunity Identification Presentation
Spot challenges and uncover growth potential with this Problem Framing and Opportunity Identification presentation. Ideal for strategy sessions, this layered pyramid layout helps you organize problems from surface-level to root causes while aligning them with strategic opportunities. Fully editable in Canva, PowerPoint, or Google Slides for seamless customization.


4 diapositivas
Mental Health Awareness Presentation
Bright visuals meet deep meaning in this engaging slide, designed to spotlight key facts and insights. This template helps present vital information on emotional well-being, stigma reduction, and support strategies with clarity and empathy. Fully editable and easy to use in PowerPoint, Keynote, and Google Slides for seamless presentation delivery.


4 diapositivas
Business Framework Strategies Presentation
Bring your ideas to life with a smooth, flowing sequence that makes complex strategies feel simple and intuitive. This presentation guides audiences through each stage of your business framework with clear visuals and focused messaging, helping you communicate structure, goals, and direction effortlessly. Fully compatible with PowerPoint, Keynote, and Google Slides.


5 diapositivas
Process Improvement Using Five Steps Framework Presentation
Visualize progress with clarity using the Process Improvement Using Five Steps Framework Presentation. This stepped layout helps you illustrate sequential actions, milestones, or improvements across five stages. Ideal for strategy, operations, or performance initiatives. Easy to customize in PowerPoint, Keynote, Google Slides, and Canva to fit your workflow needs.


22 diapositivas
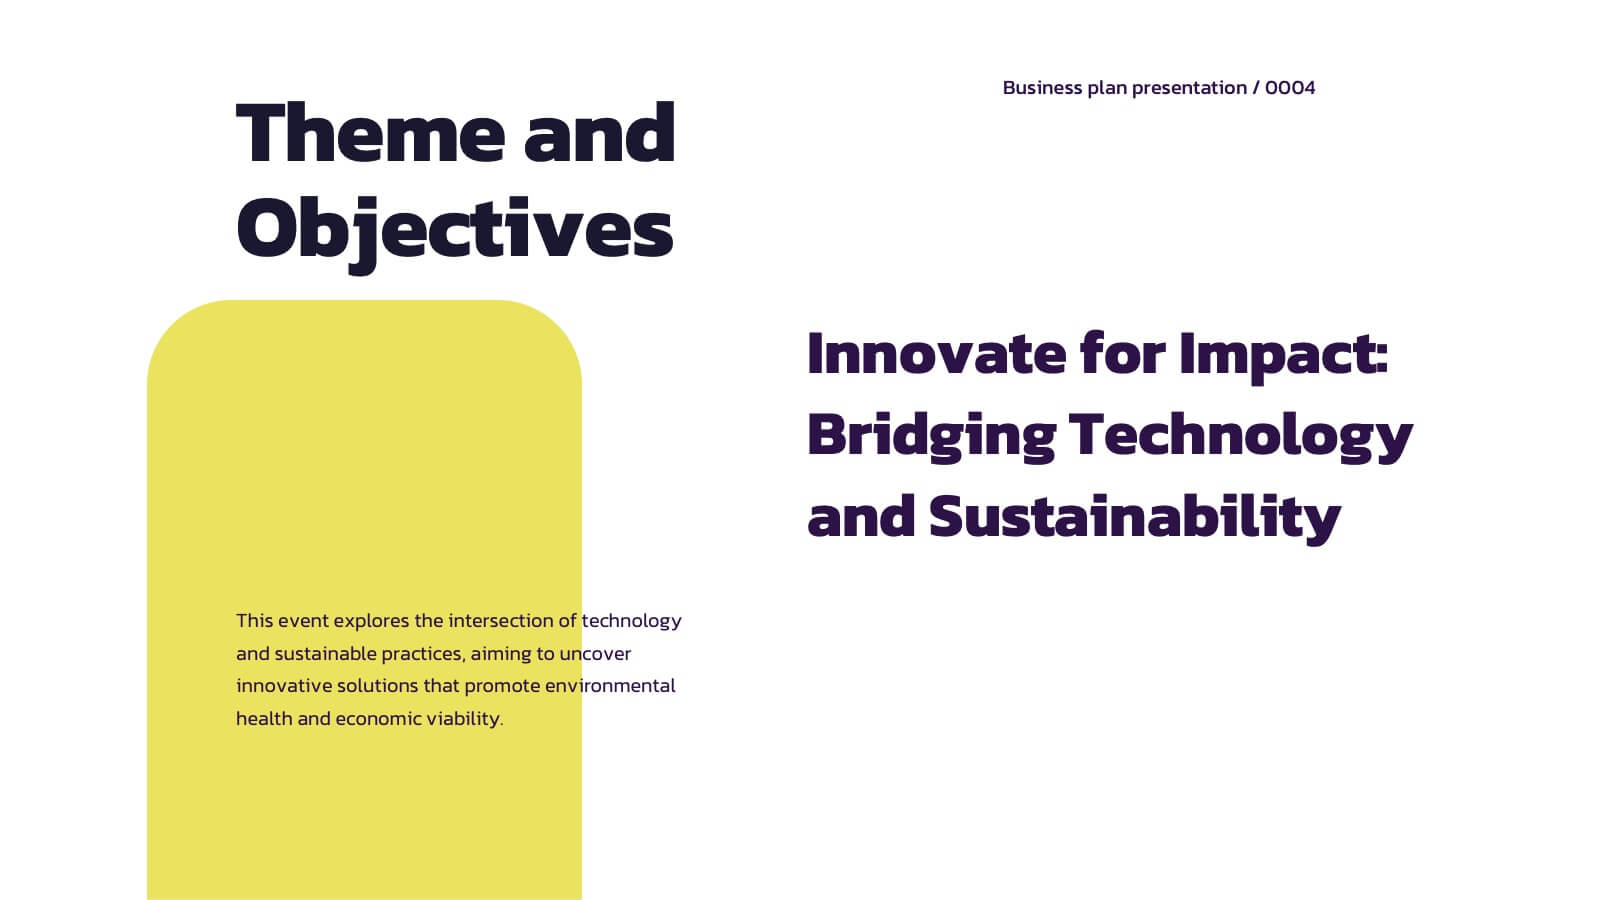
Crystal Business Plan Presentation
This business plan template is ideal for presenting strategies, conference overviews, and session details. With slides for keynote speakers, breakout sessions, and networking breaks, it offers a dynamic and professional layout. Compatible with PowerPoint, Keynote, and Google Slides, it ensures a clear and organized flow for any business presentation.


23 diapositivas
Quest Qualitative Research Findings Presentation
This dynamic and sleek research template presents qualitative findings with style and clarity. Dive into research objectives, data collection, key findings, and future directions, all showcased with a minimalist black-and-white design. Perfect for impactful presentations, this template is compatible with PowerPoint, Keynote, and Google Slides, making it versatile for any audience!


26 diapositivas
Quantum Computing Presentation
Step into the future of technology with this fascinating presentation on quantum computing. Covering key concepts like quantum bits, superposition, entanglement, and real-world applications, this template helps simplify complex ideas for any audience. Fully customizable and compatible with PowerPoint, Keynote, and Google Slides for a seamless and insightful presentation experience.


24 diapositivas
Djinn Brand Identity Presentation
Unleash the power of your brand with this sleek and modern presentation template! From brand identity components to target audience personas, this template covers everything you need to craft a cohesive and compelling brand strategy. Whether showcasing brand guidelines or success stories, it’s designed for maximum clarity and impact. Compatible with PowerPoint, Keynote, and Google Slides for effortless presentations.