


Características


¿Tienes alguna pregunta?
Recomendar


5 diapositivas
Agriculture in The United States Infographics
Agriculture has been a crucial sector in the United States since its founding, with a rich history of innovation and productivity. These Infographics are visual representation of the agricultural industry in the US, covering statistics, trends, and insights about the sector. Use these to include information about the top crops grown in the country as well as the states with the highest agricultural output. The design incorporates nature-inspired icons and a customizable color palette that reflects the natural elements associated with agriculture such as green and brown hues. The vertical layout also allows for easy scrolling and viewing on digital platforms.


21 diapositivas
Frostfire Agile Project Plan Presentation
The Agile Project Plan Presentation Template features 21 cohesive slides including timelines, objectives, stakeholder analysis, and budget breakdowns. Its modern brown and lavender design ensures clarity and professionalism. Perfect for project managers and teams, it’s fully customizable and compatible with PowerPoint, Keynote, and Google Slides for seamless collaboration and presentations.


3 diapositivas
Agile Workflow and Team Roles Presentation
Visualize team roles, responsibilities, and task flow using this agile loop diagram. Ideal for Scrum teams, project managers, and product owners. Clearly outline percentages, priorities, and stages in the process. Fully editable in PowerPoint, Keynote, and Google Slides—perfect for training, team updates, or workflow overviews.


24 diapositivas
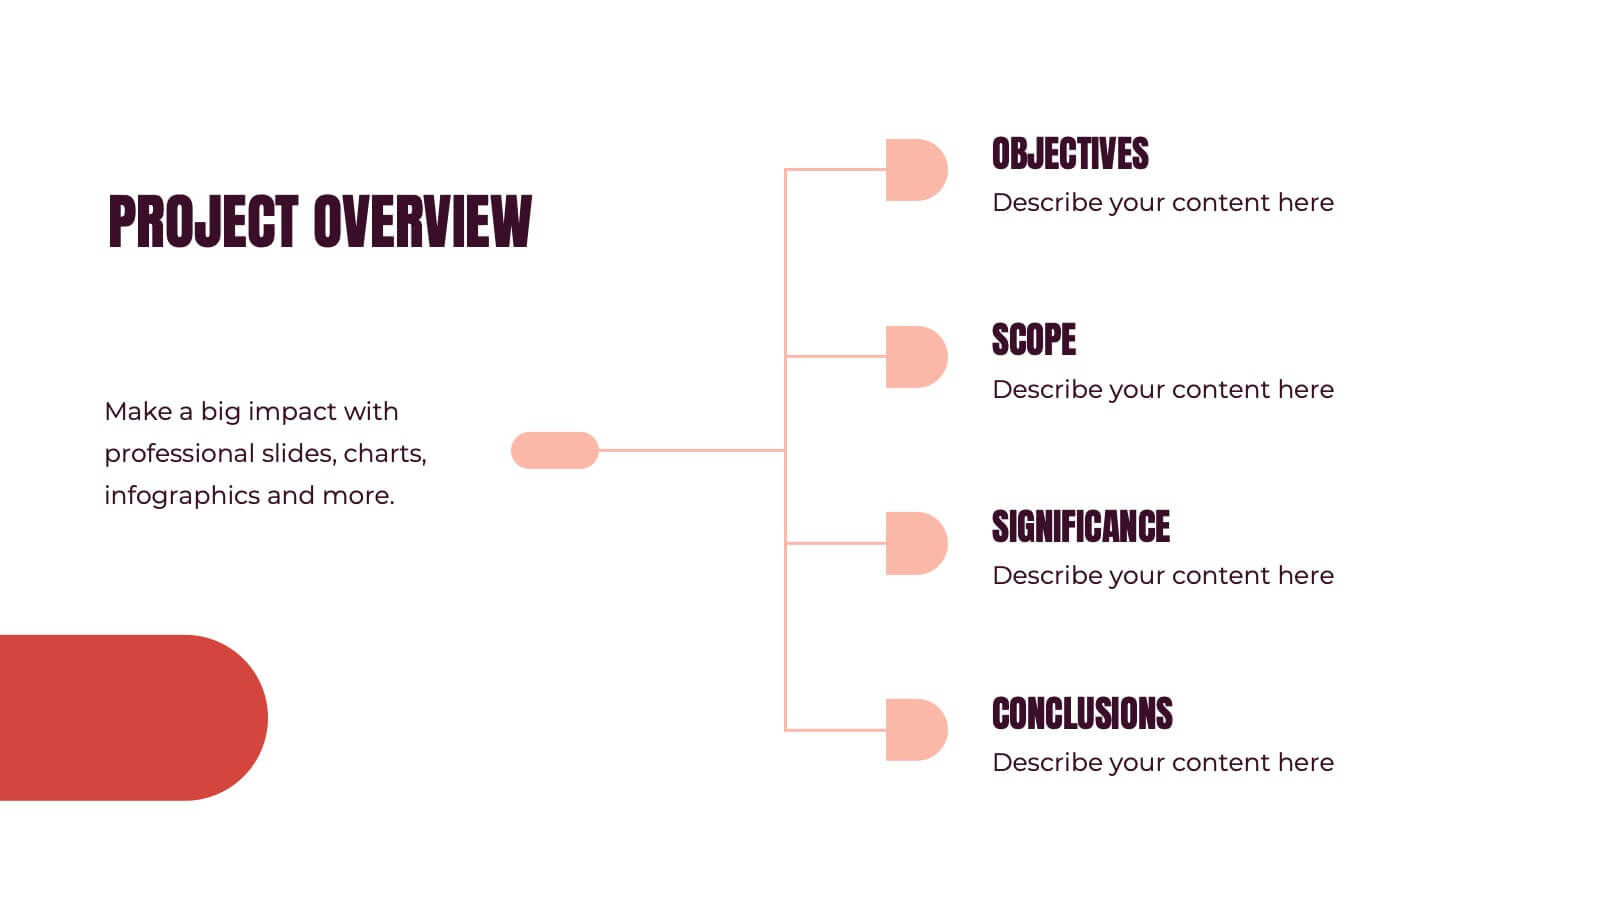
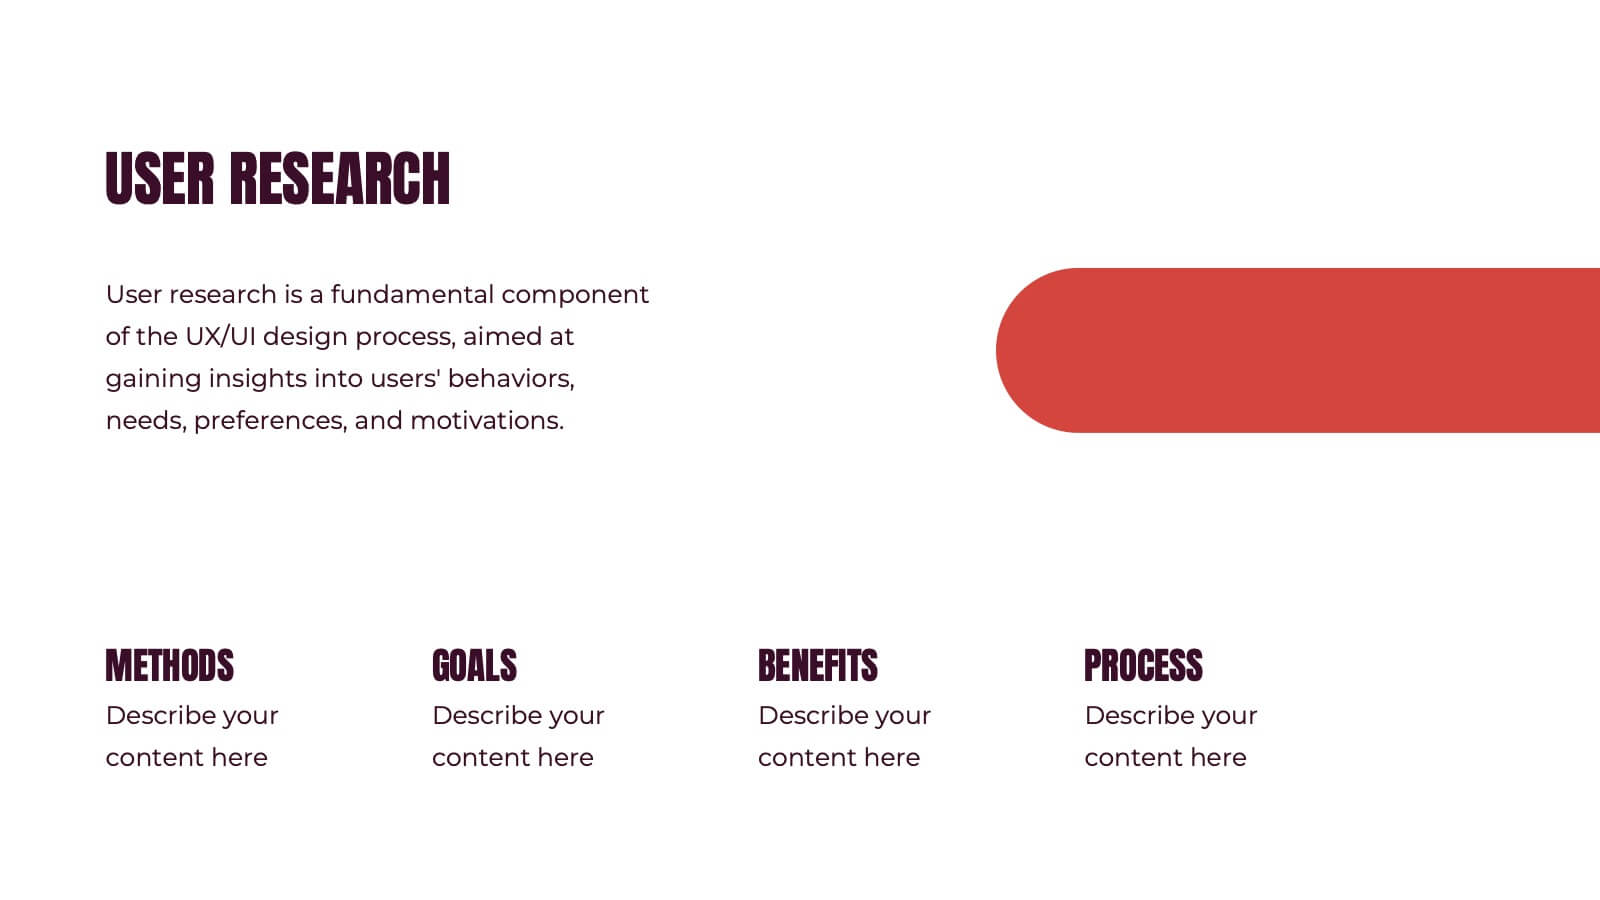
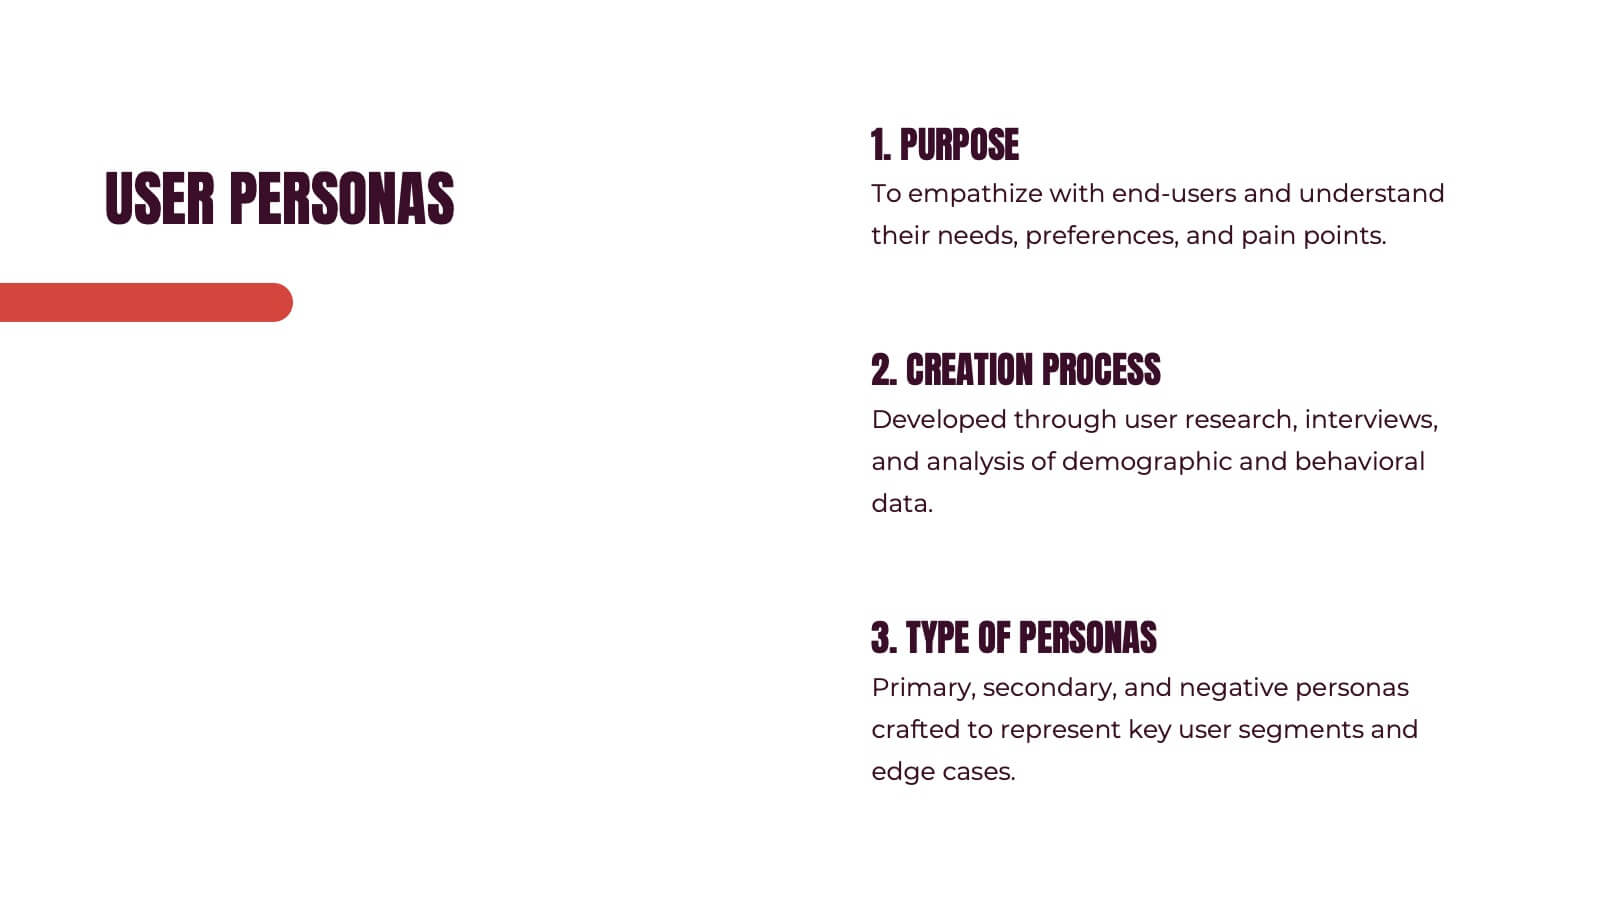
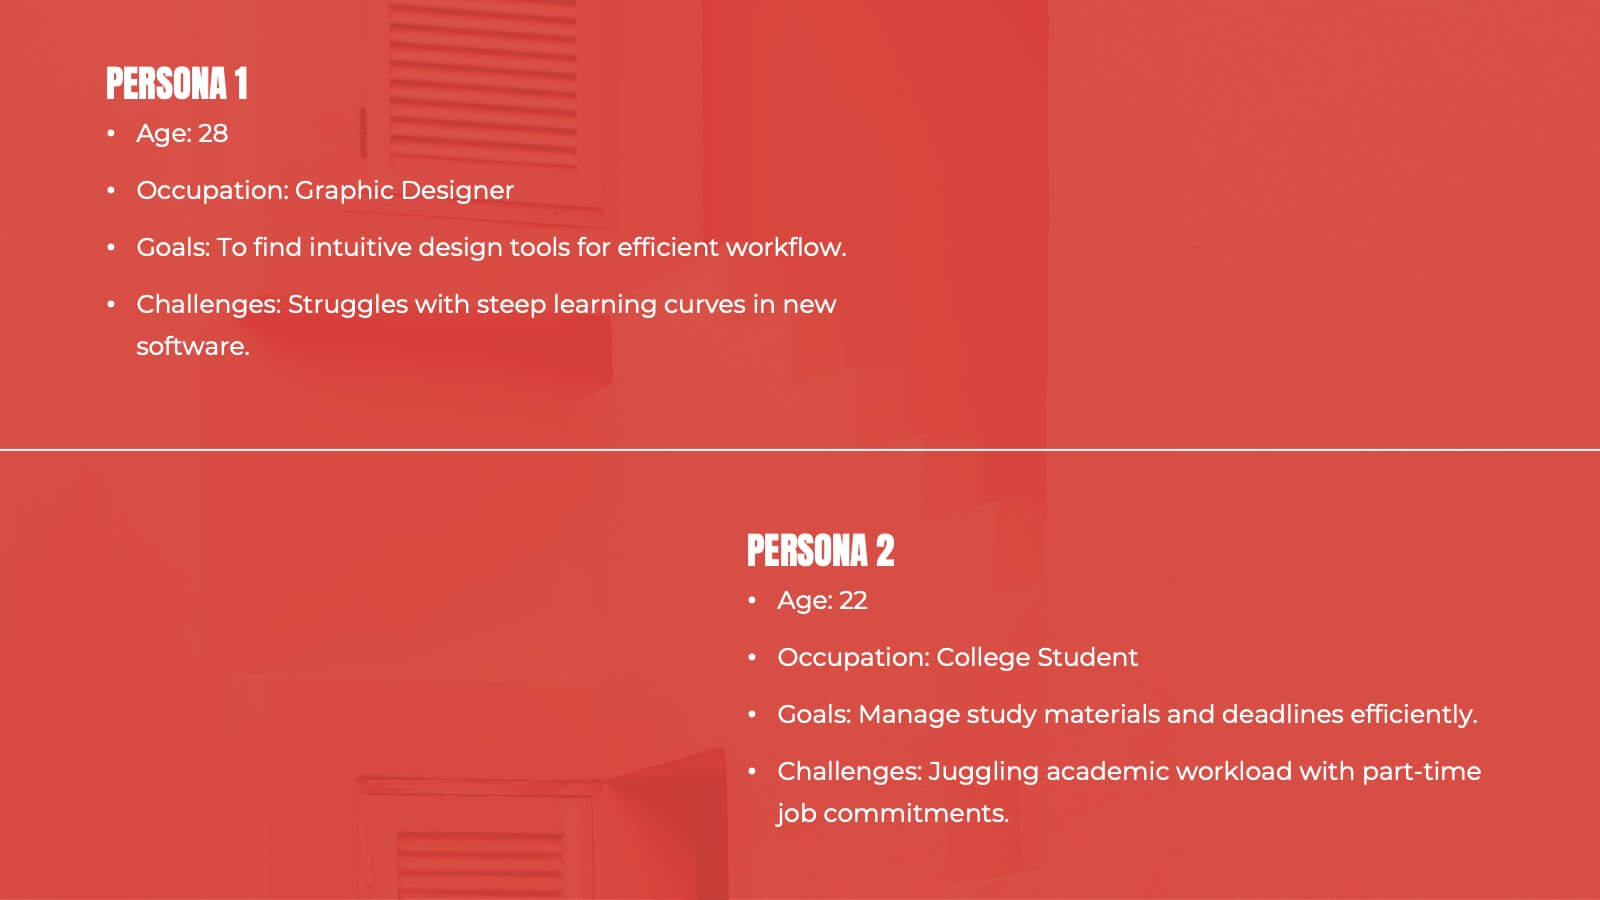
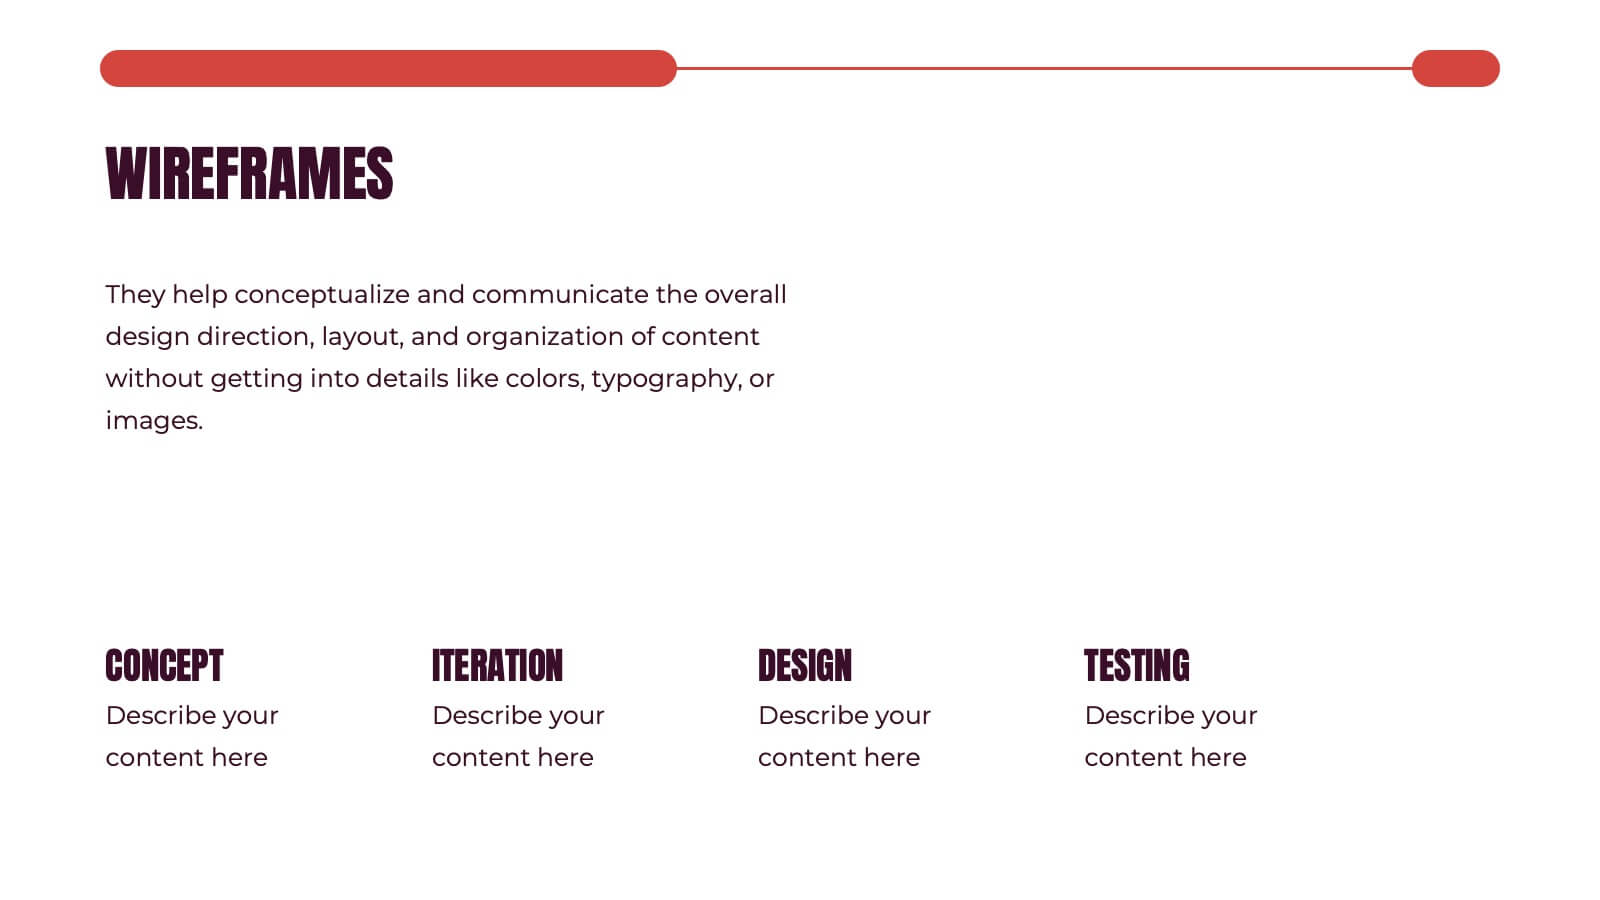
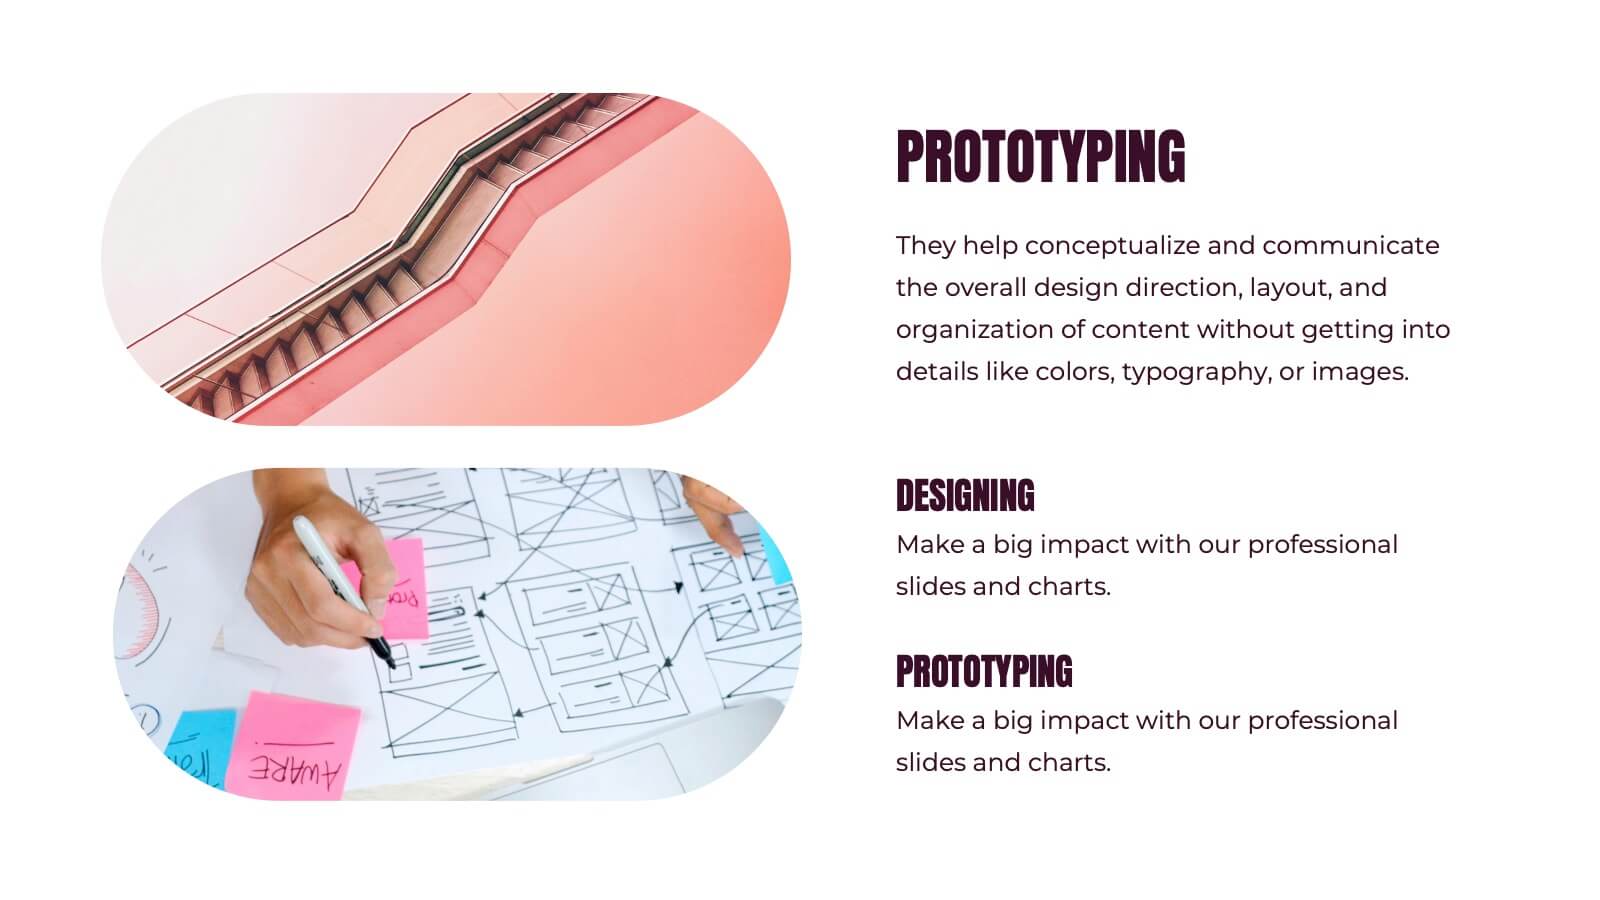
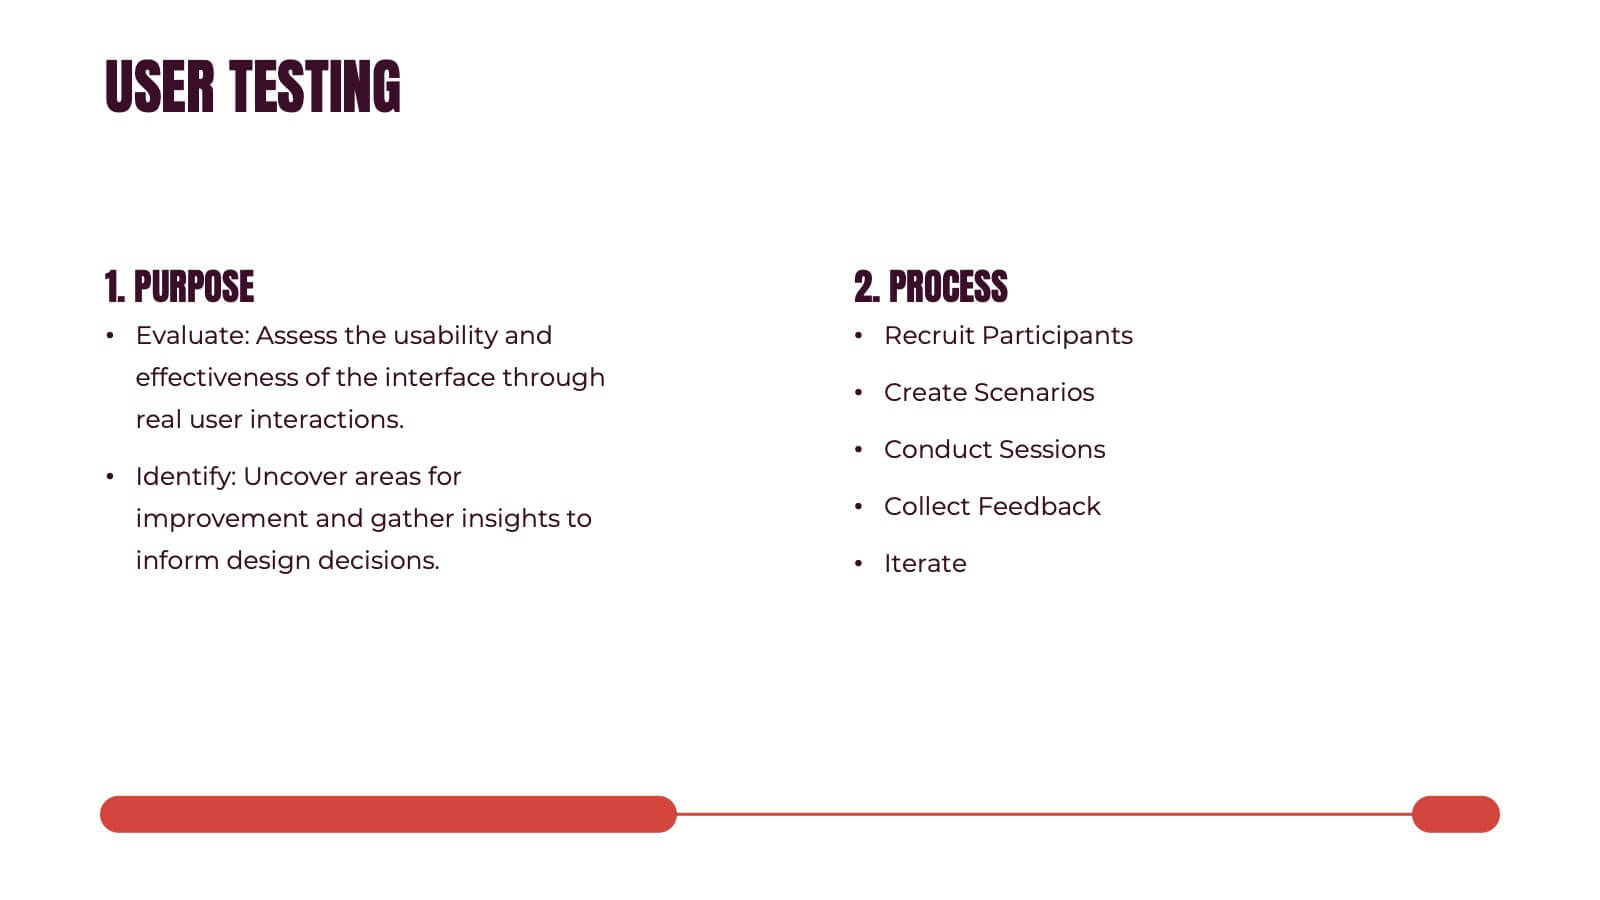
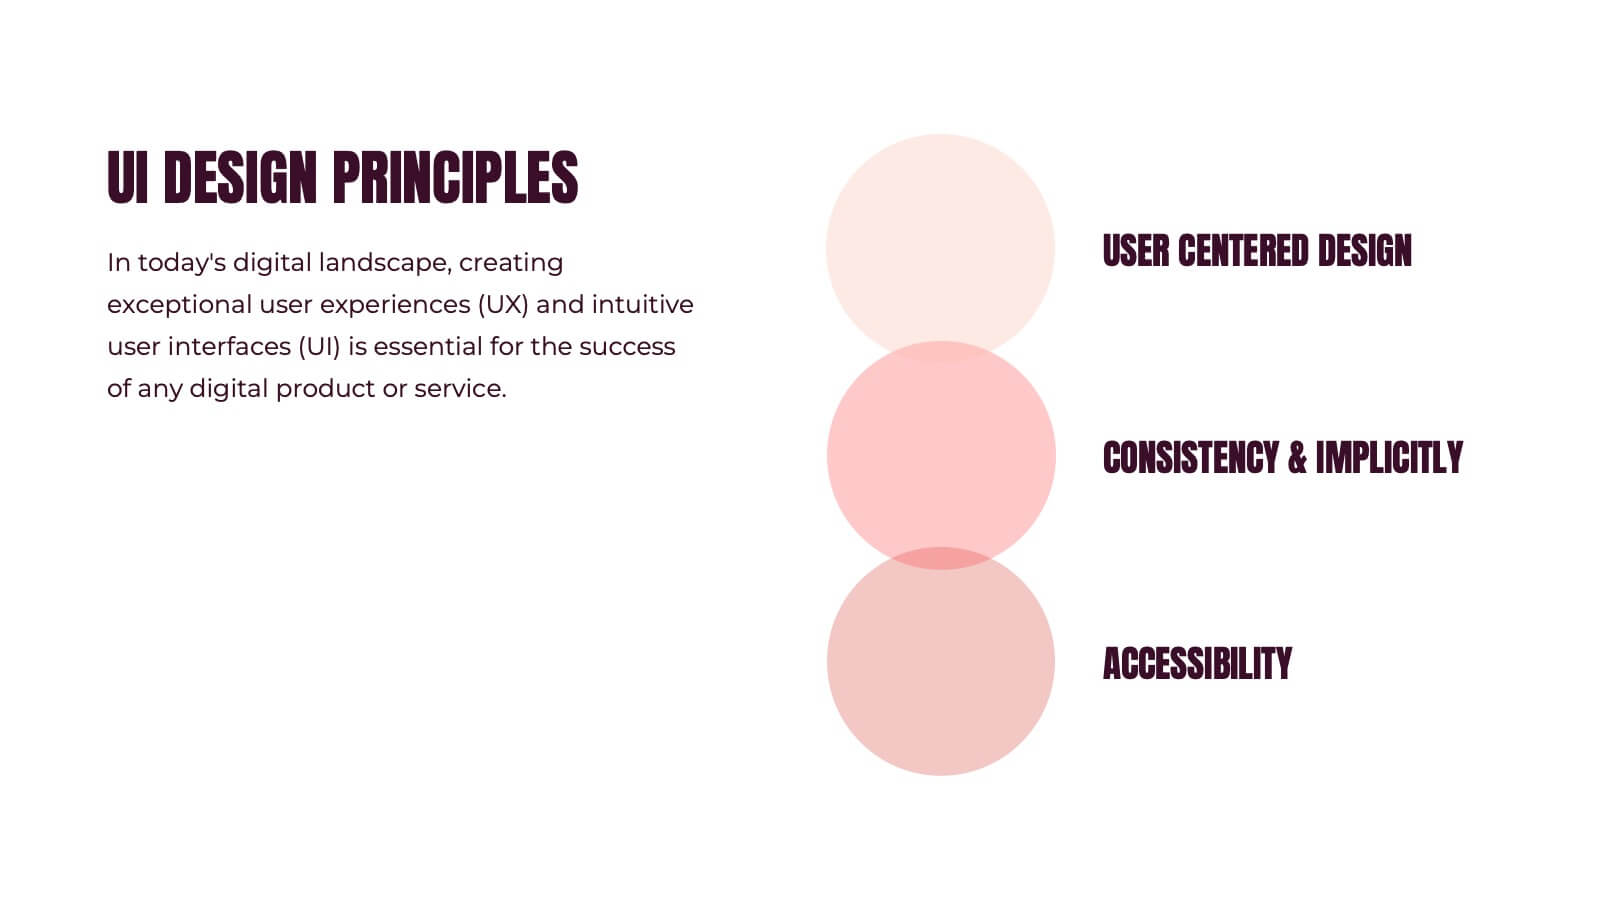
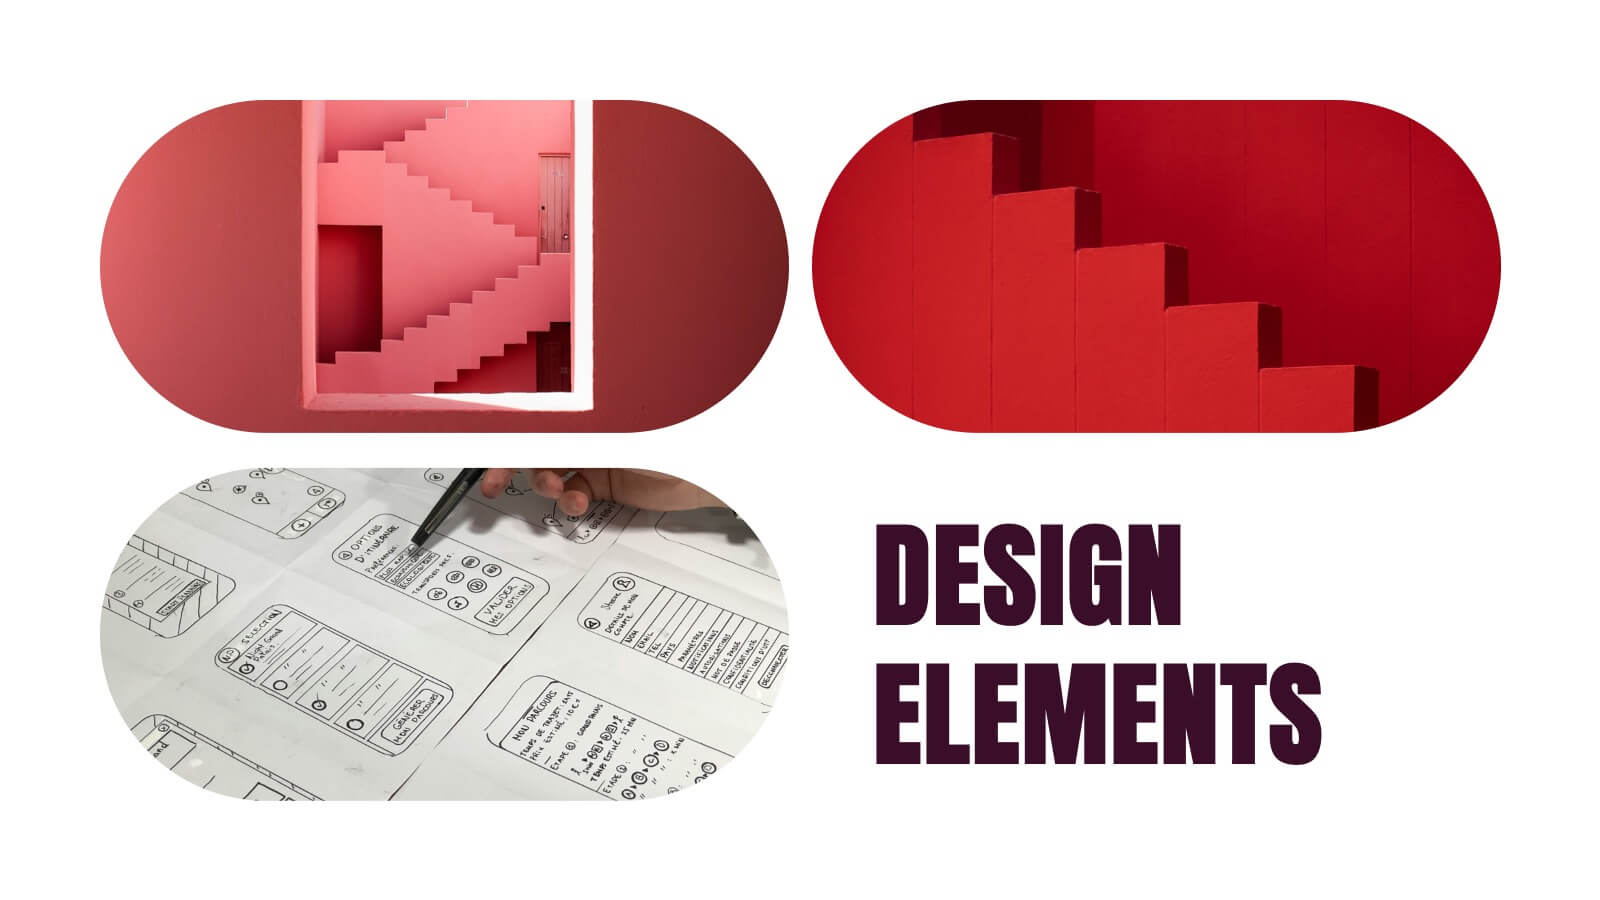
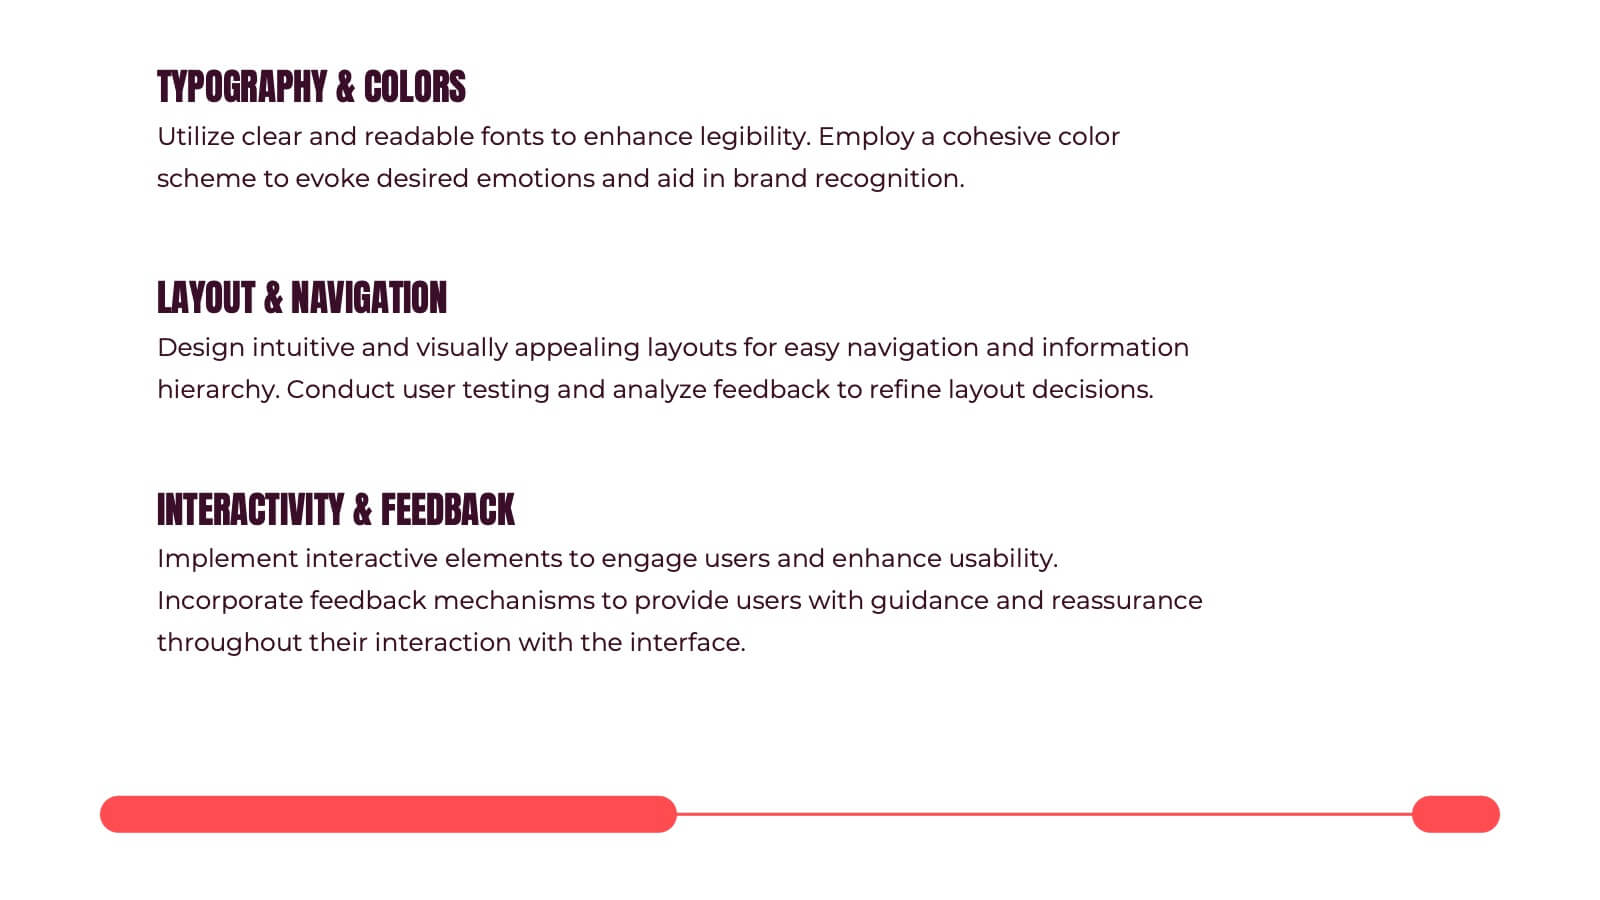
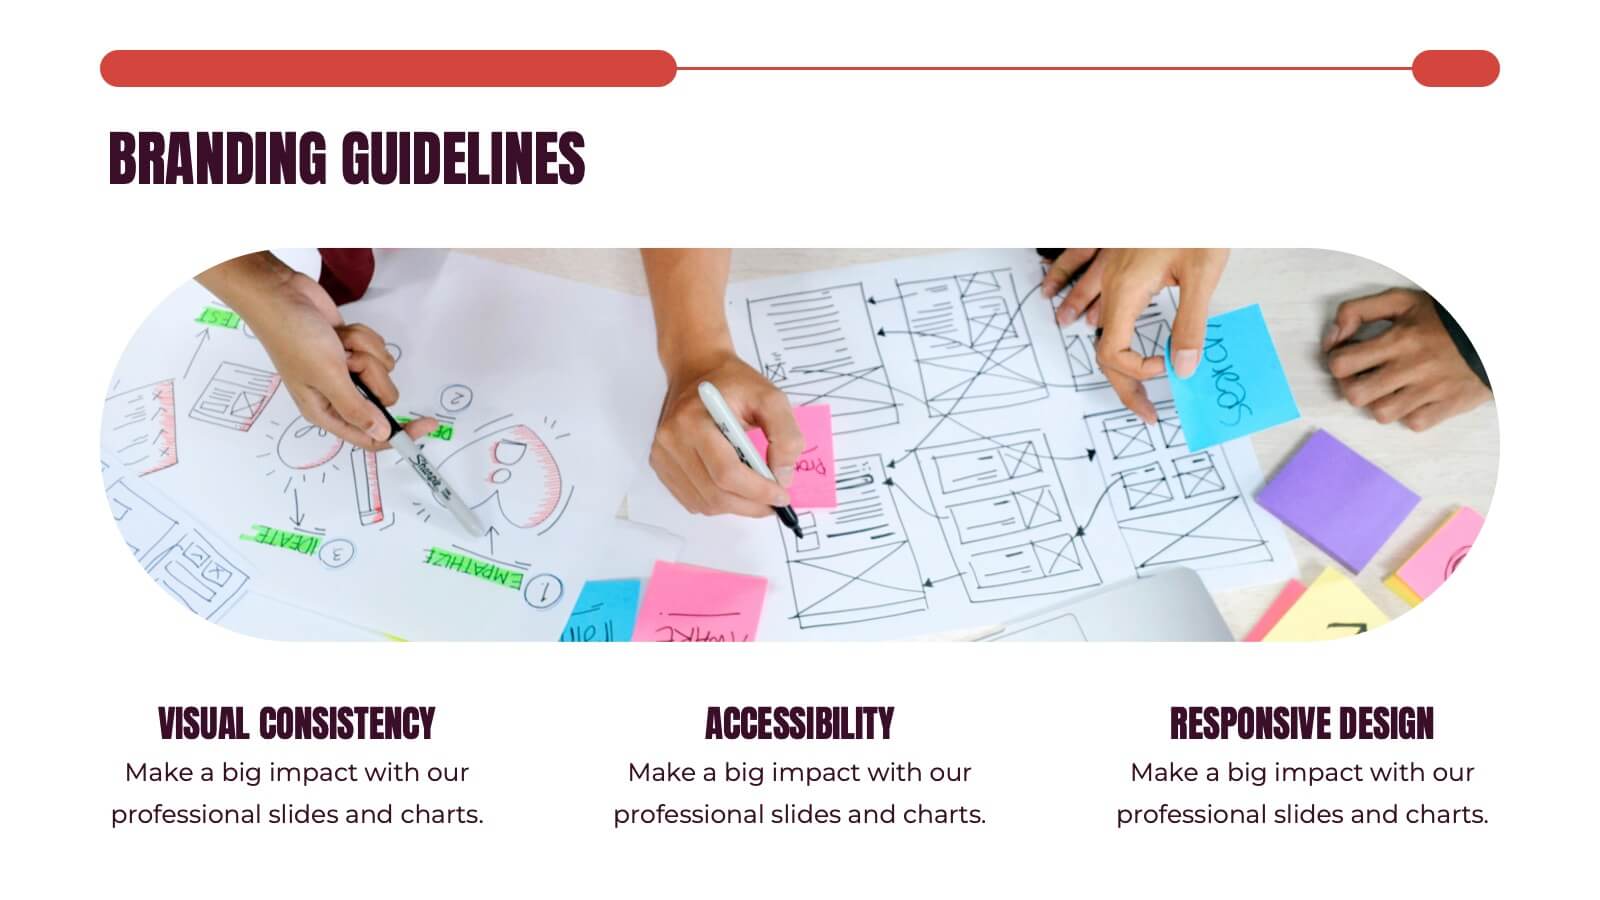
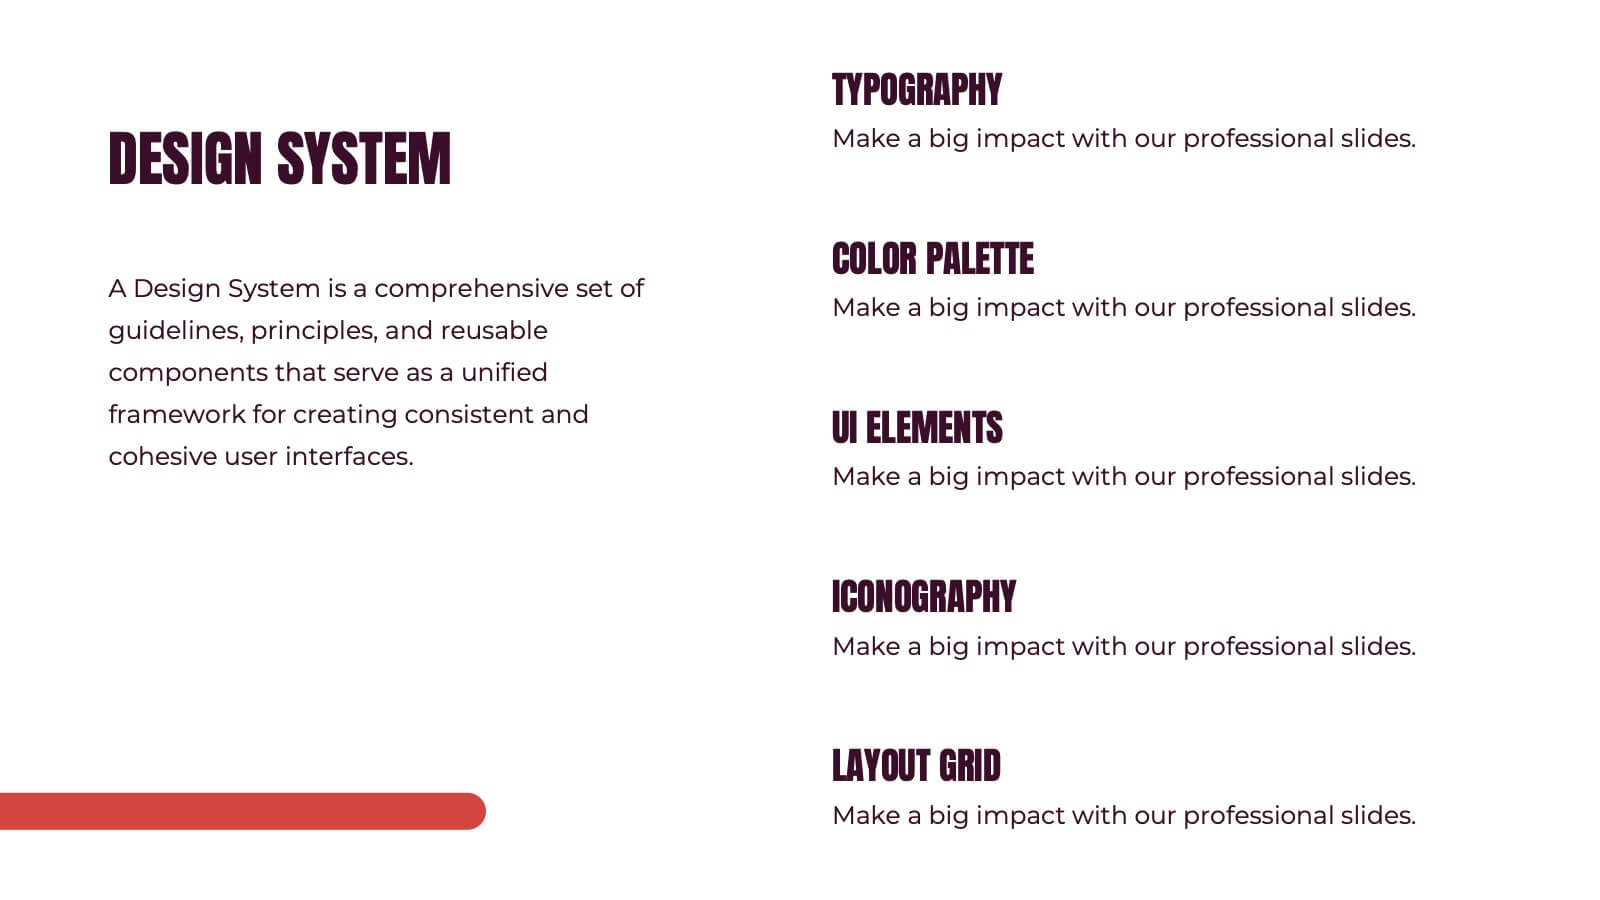
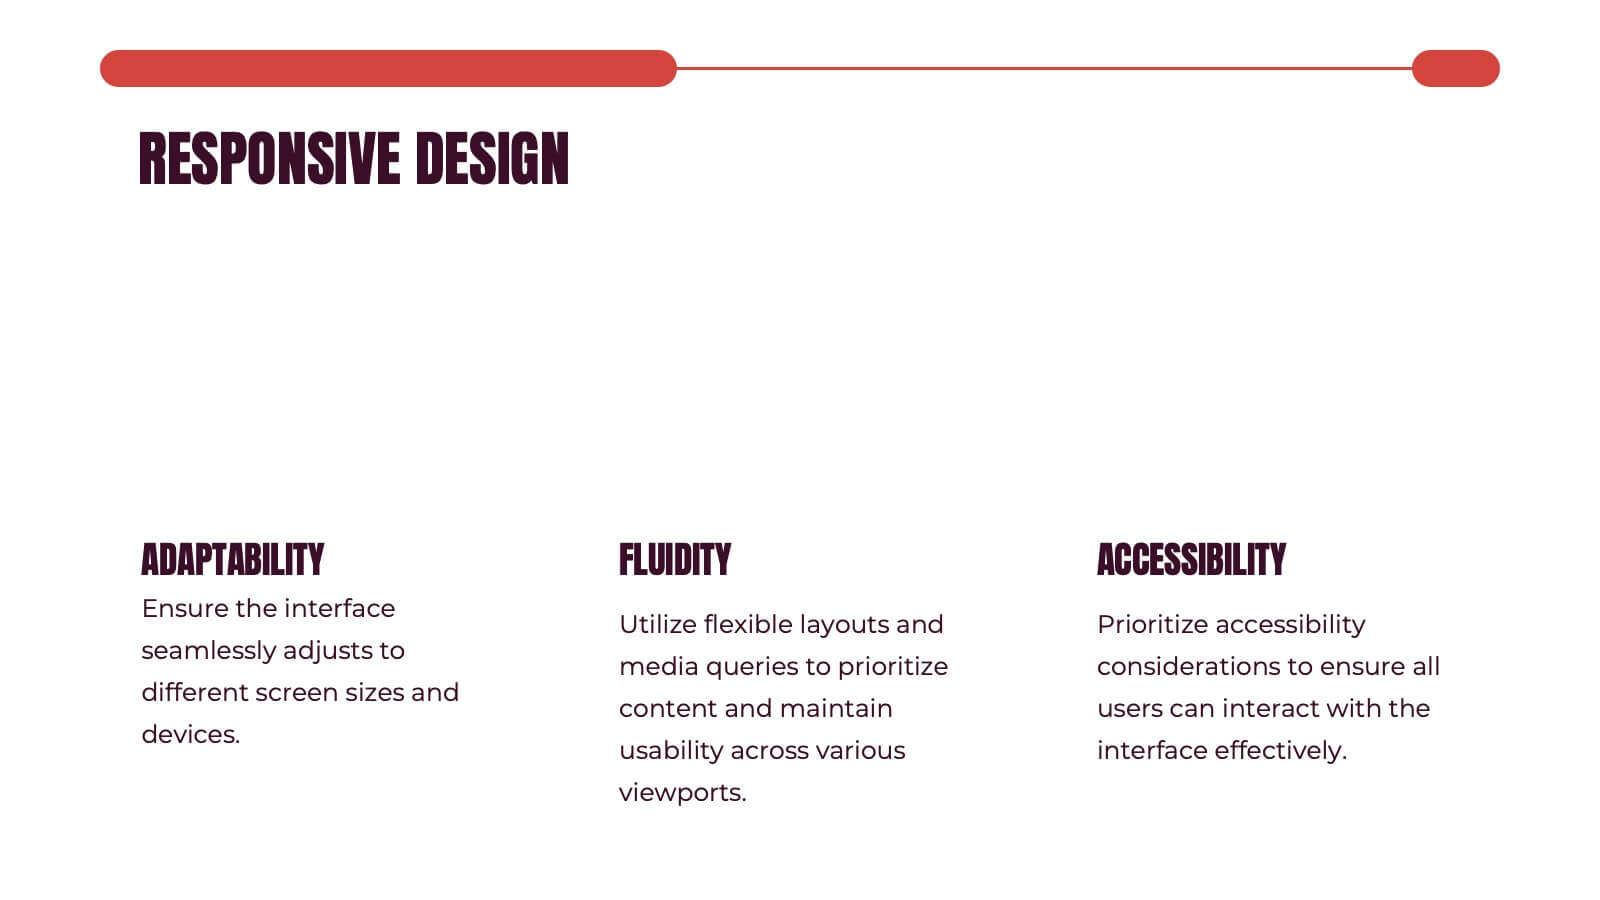
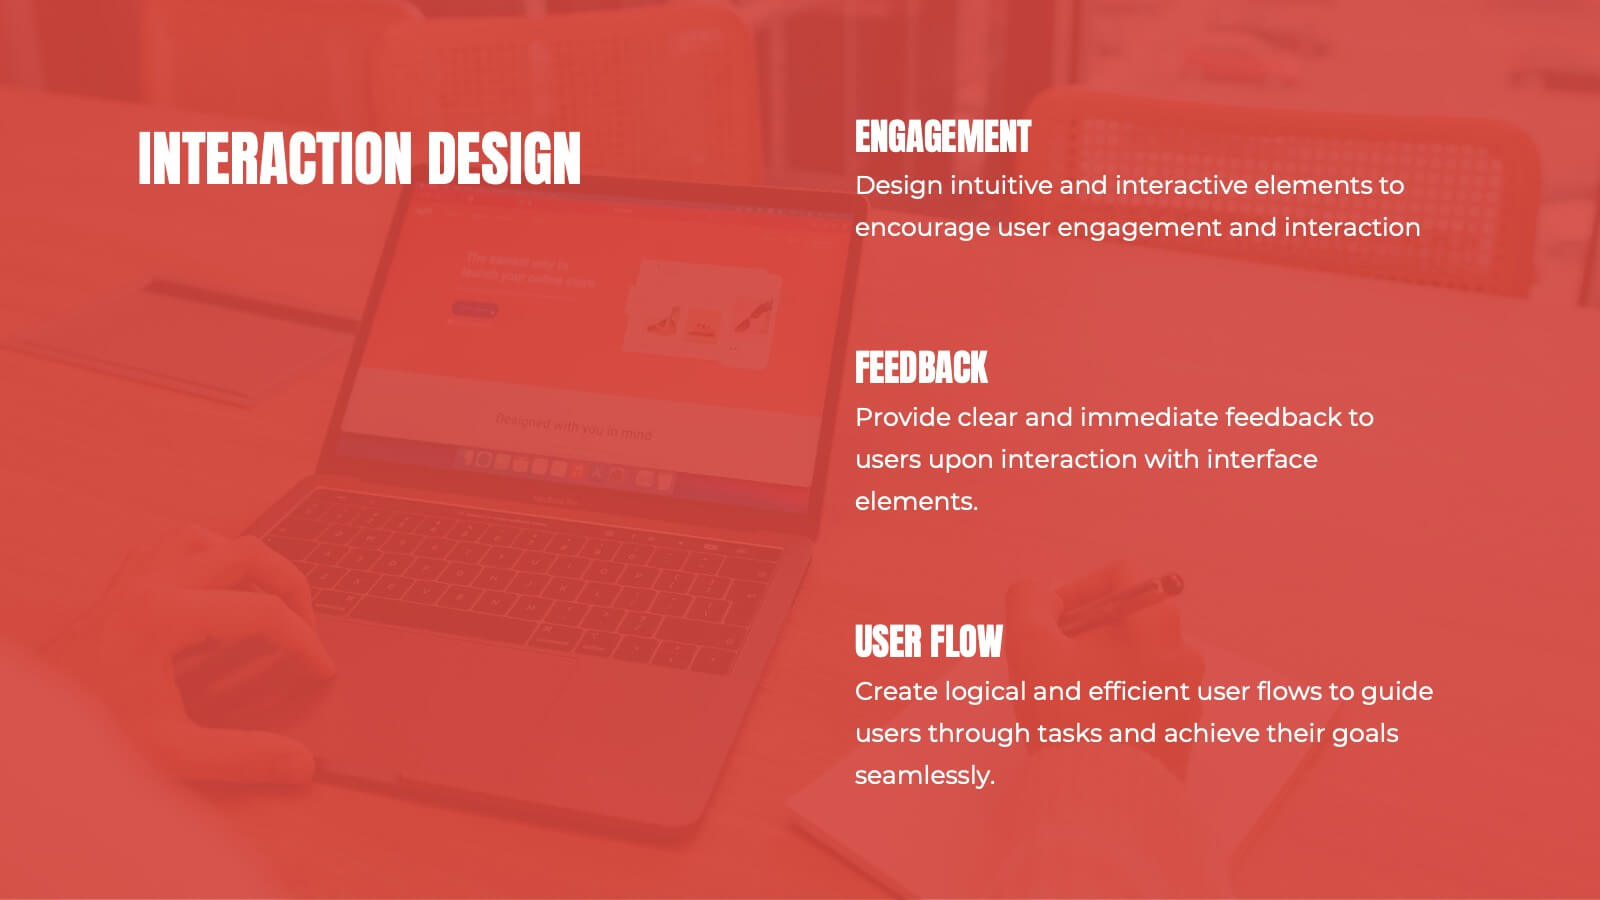
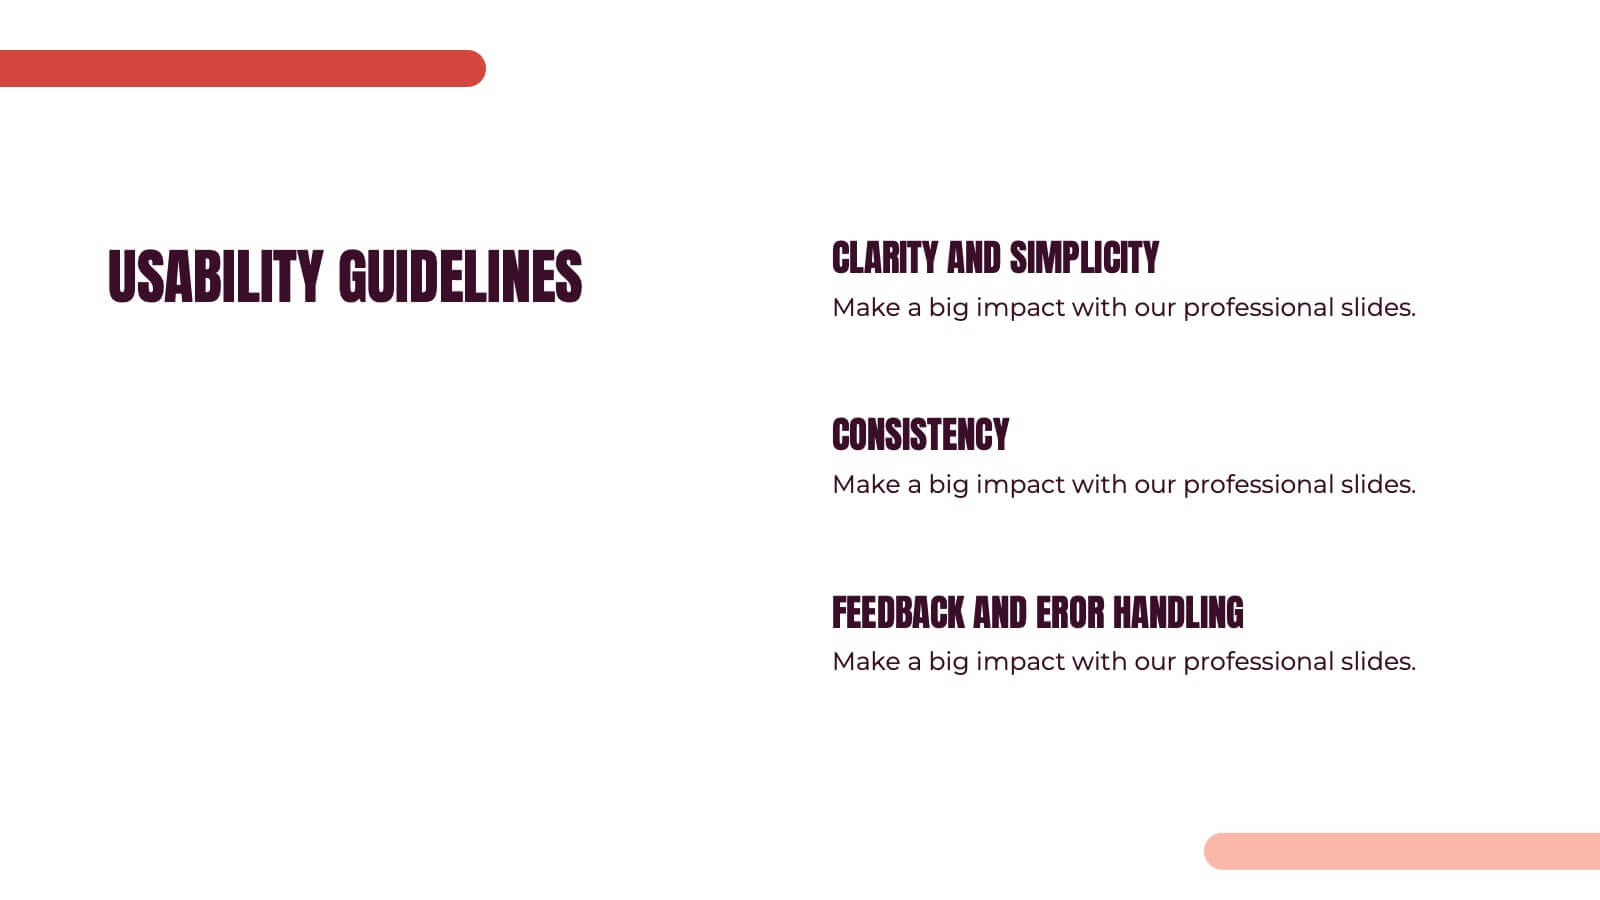
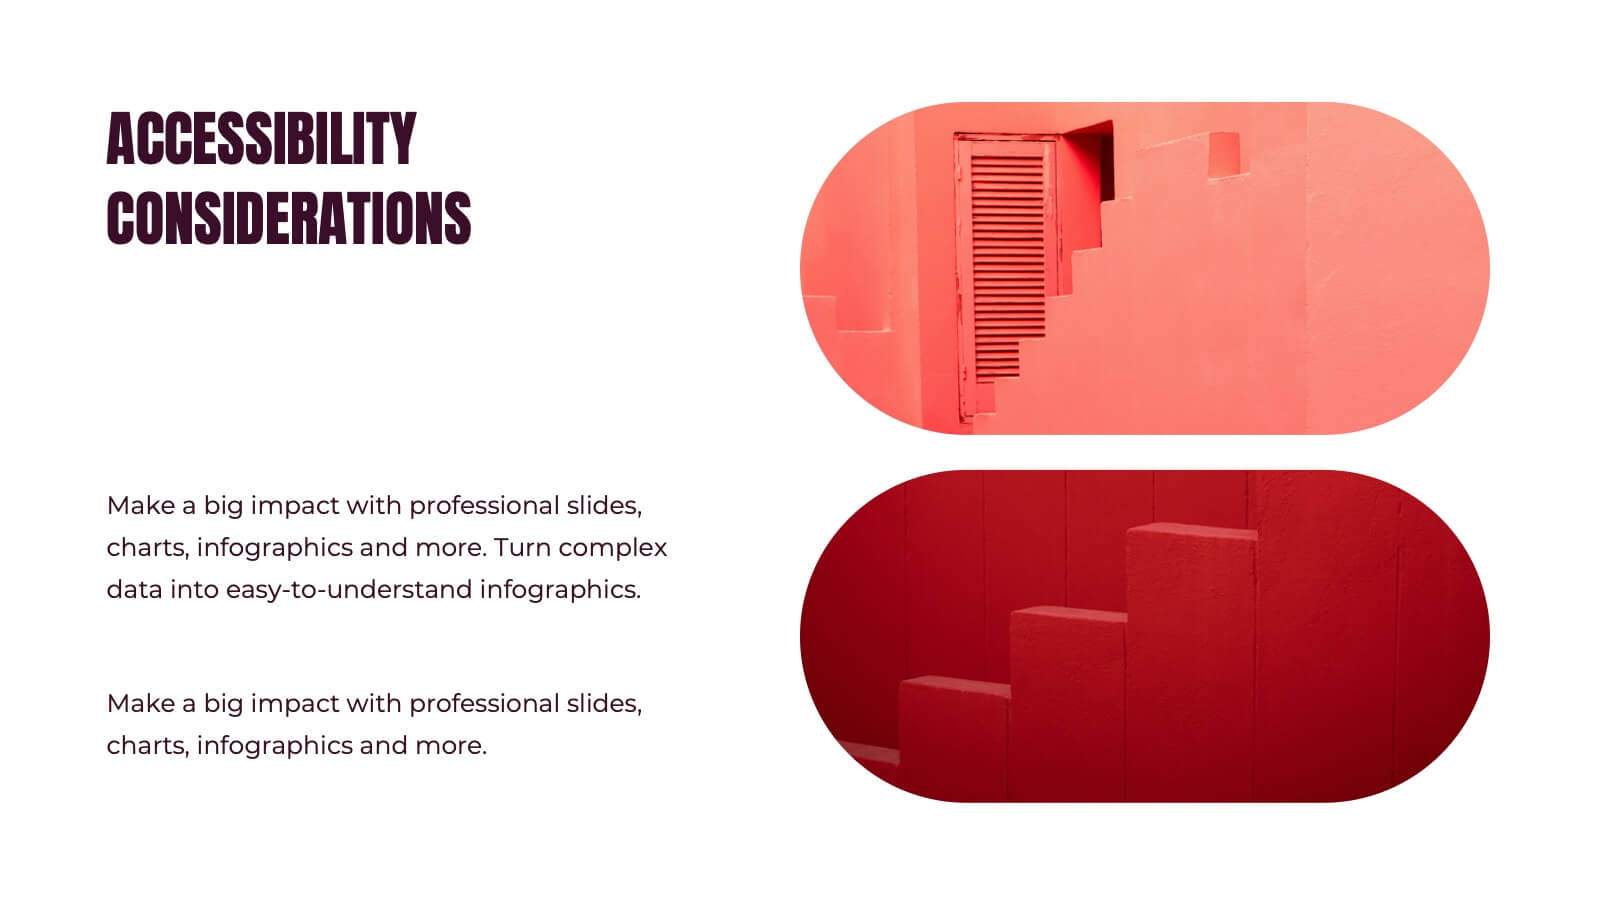
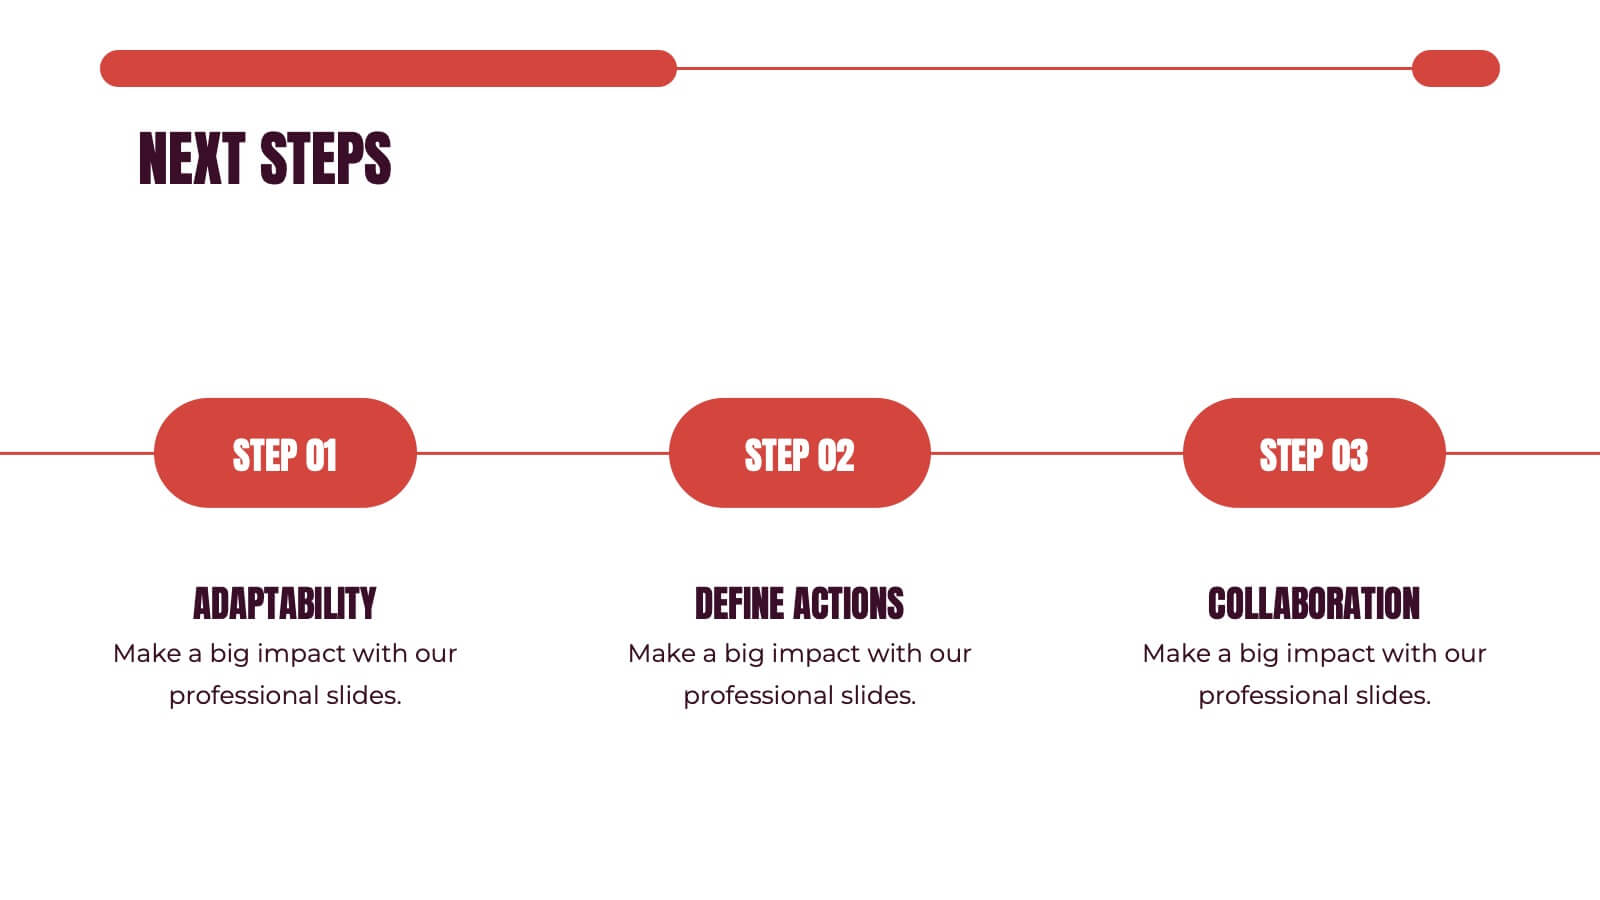
Kismet UX Design Presentation
Dive into the world of design with this stunning presentation template! Perfect for explaining user experience concepts, this template covers everything from wireframes to prototyping. It's designed to captivate your audience with visually engaging slides and clear, concise information. Compatible with PowerPoint, Keynote, and Google Slides for effortless use across platforms.


10 diapositivas
Innovation in Science Presentation
Showcase cutting-edge ideas with this Innovation in Science Presentation Template. Featuring a sleek lightbulb graphic with colorful horizontal bars, it's ideal for outlining research stages, technological breakthroughs, or futuristic concepts. Great for scientists, educators, and innovation teams. Easily customizable in PowerPoint, Keynote, and Google Slides.


8 diapositivas
Corporate Office Scenes Illustrations Presentation
Bring workplace communication to life with this slide featuring an illustrated office meeting scene and a four-point list layout. Each segment is color-coded with accompanying icons, making it ideal for presenting corporate strategies, team roles, or process workflows. Designed for clarity and visual appeal, this slide is perfect for business reports, training decks, or client briefings. Easily customizable in PowerPoint, Keynote, and Google Slides.


5 diapositivas
Diverse List Infographics
Diverse list refers to a compilation or collection of items that include a wide range of diverse elements. These infographic templates showcases a diverse range of categories and topics in a concise format. The infographic is designed to present information in a visually stimulating way, allowing viewers to easily navigate and understand the diverse list being presented. The infographics organizes the lists into categories or sections, so the viewers can identify and locate specific items of interest. The categories are represented by visually distinct sections and color-coded tabs or icons that provide a cue for each category.
4 diapositivas
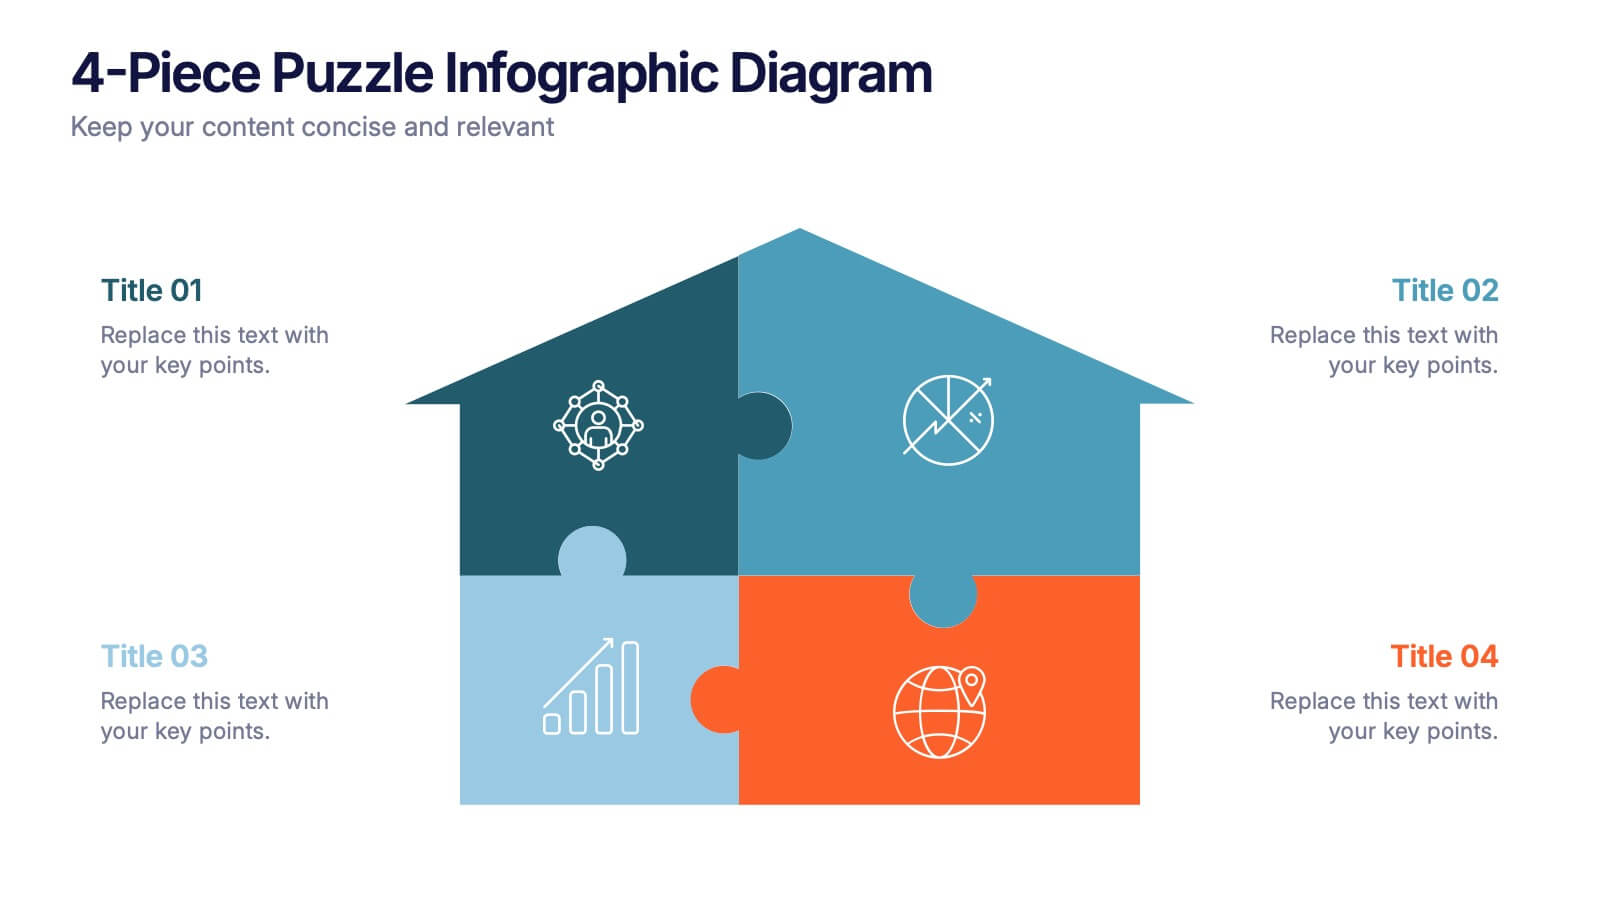
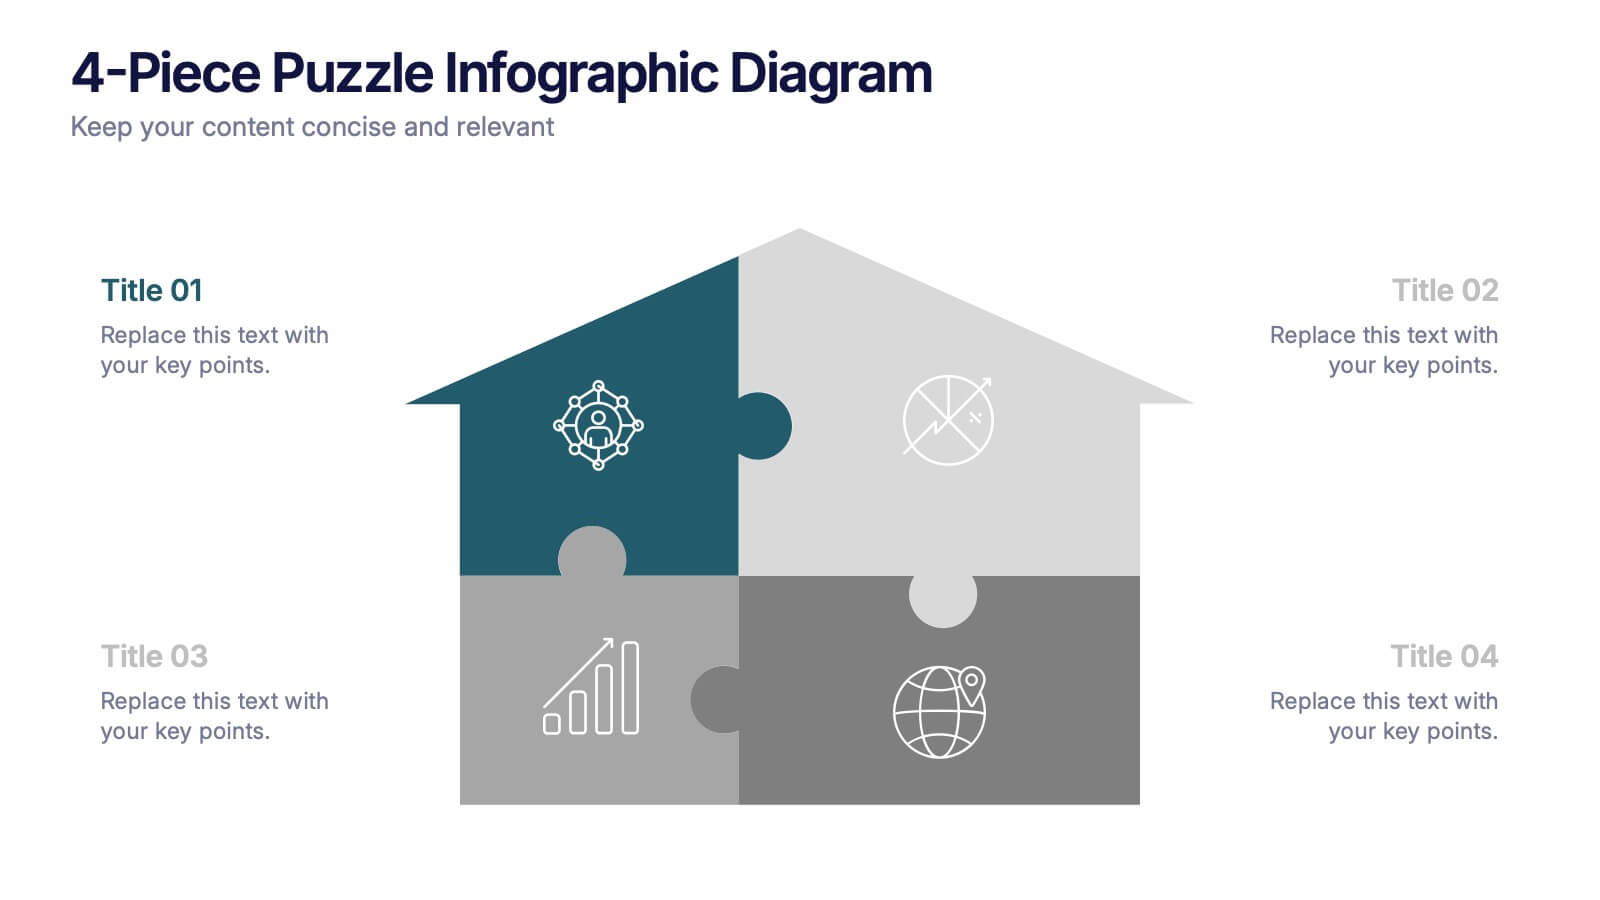
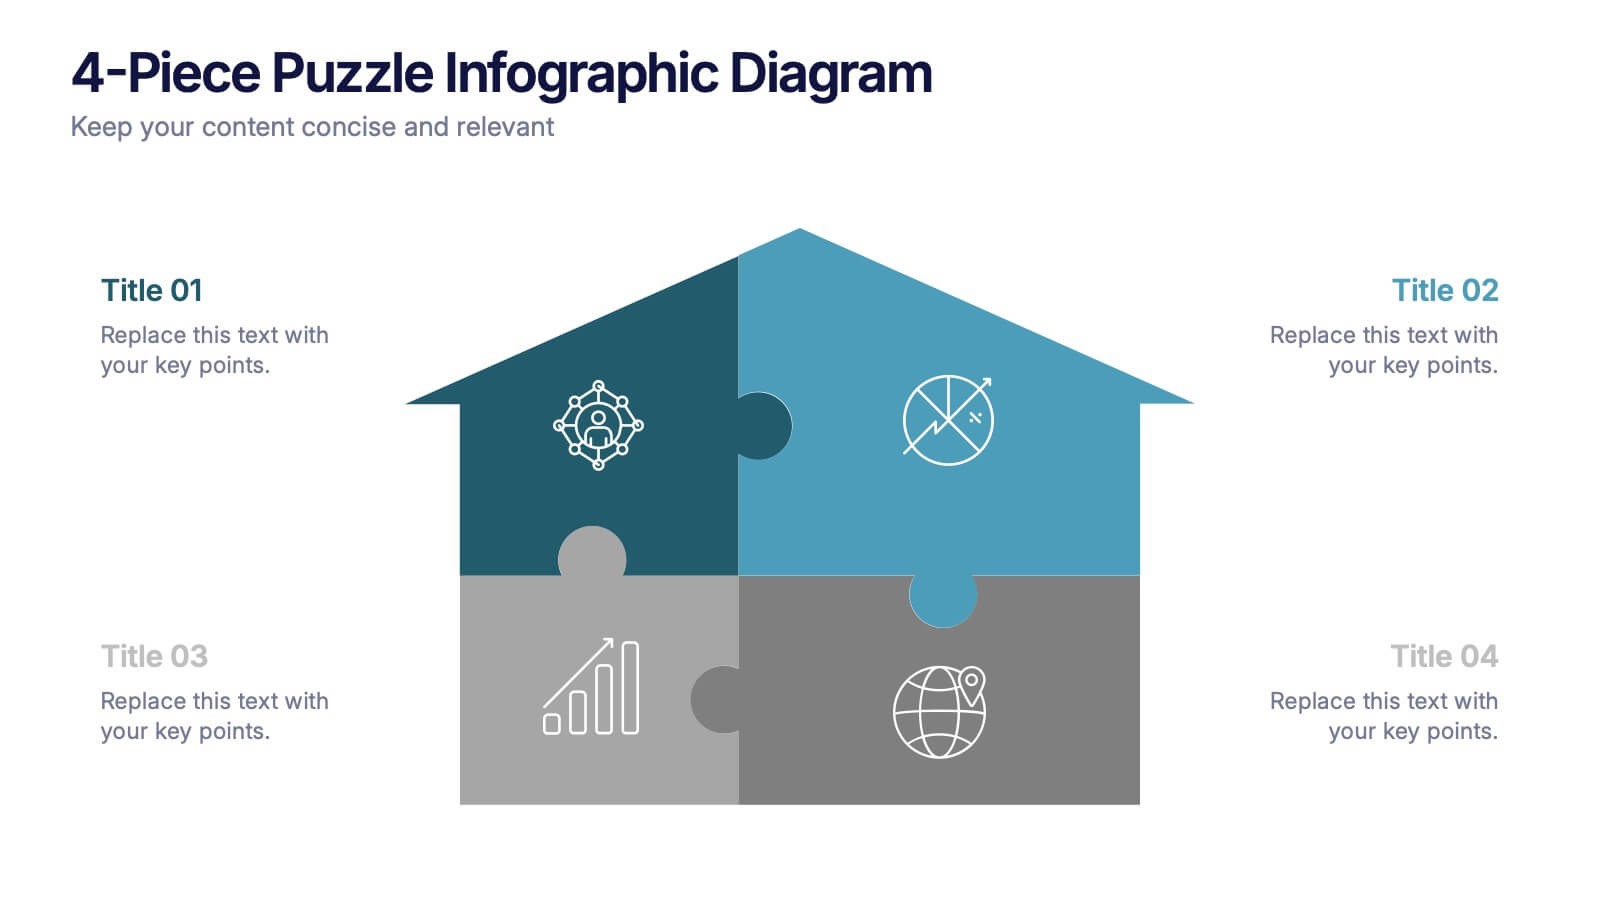
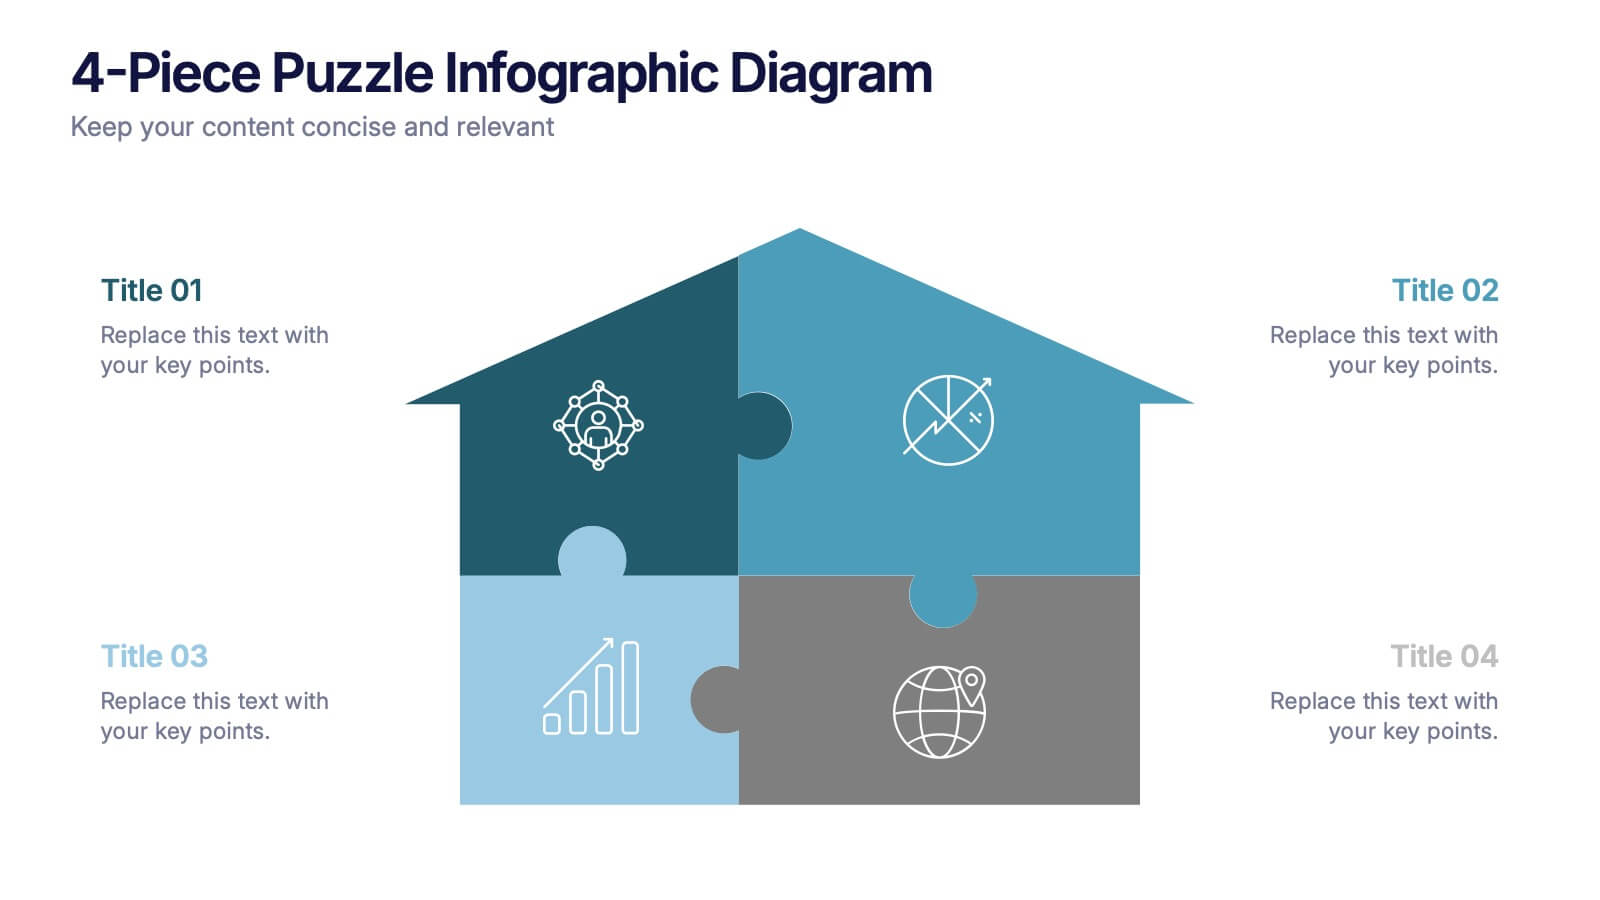
4-Piece Puzzle Infographic Diagram Presentation
Bring clarity and impact to your message with a visual layout that snaps big ideas together like a puzzle. This presentation helps you break complex concepts into four connected sections, making explanations easier and more engaging for any audience. Ideal for planning, insights, or strategy sessions. Fully compatible with PowerPoint, Keynote, and Google Slides.


4 diapositivas
Pyramid Model Template for Strategy Presentation
Bring your strategic ideas to life with a bold layered visual that makes priorities and planning feel instantly clear. This presentation helps you break down concepts, illustrate hierarchy, and communicate long-term direction with confidence and simplicity. Fully compatible with PowerPoint, Keynote, and Google Slides.


5 diapositivas
Management Framework Structure Presentation
Bring your ideas to life with a dynamic slide that maps out clear stages of leadership, planning, and execution. This layout helps you break down complex management structures into simple, visual steps that any audience can follow. Fully editable and easy to customize in PowerPoint, Keynote, and Google Slides.


5 diapositivas
Information Technology Uses Infographics
Navigate the digital era with our information technology uses infographics, a synthesis of design and functionality. Presented in the trustworthy shades of blue and the vibrant hues of green, this template captures the essence of IT applications across spectrums. Whether you're an educator or tech enthusiast, these vertical, creatively designed infographics serve as a conduit to explain the intricacies of contemporary tech use. Compatible with Powerpoint, Keynote, and Google Slides. Complete with expressive icons and customizable image placeholders, this visual aid is crafted for clarity, making complex IT concepts engaging for audiences.


6 diapositivas
App Design Mockup
Showcase your app UI in a bold, creative way with this vibrant slide layout. Featuring dynamic smartphone mockups and modern graphic accents, it's ideal for app demos, portfolio highlights, or feature walkthroughs. Fully editable in PowerPoint, Keynote, and Google Slides—customize fonts, colors, and layouts to suit your brand.


7 diapositivas
Survey Results Infographic Presentation Template
Your survey results are the most important part of the research process. Now you can present your findings to colleagues and clients in a professional and impactful way with this survey results template. This infographic design allows you to organize your results with ease. Designed to help you easily transform your survey results into an eye-catching, professional presentation. It includes everything a successful presentation needs with standard shapes and text boxes that are easy to customize. This is a great starter template for anyone looking to create an impressive report in minutes.


5 diapositivas
Sports Legends Infographics
Sport Legends play a significant role in inspiring and motivating aspiring athletes to achieve their goals. These Infographics can provide an educational and visually appealing way to showcase the accomplishments and achievements of some of the greatest athletes in history. These infographics can highlight specific individuals, teams, or eras, and can include statistics, records, awards, and other notable accomplishments. All the design elements are customizable and can include illustrations of the athletes, logos or team colors, and text boxes to highlight statistics and provide additional information.


7 diapositivas
Pyramid Analytics Infographic
Pyramid Infographics are the best way to show off your data in a visually appealing way that's easy to understand. They're fast, they're fun, and they're flexible enough to work with all sorts of data sets. This infographic template is the perfect way to bring your data to life. Designed with a hierarchical structure, the information is organized into groups of related items. This is perfect to showcase numbers, facts, and figures in an engaging way. Fully compatible with Powerpoint, Keynote, and Google Slides. This customizable template allows you to choose the color scheme, size, and orientation of the graphic, so you can pick what looks best for your presentation.


4 diapositivas
3-Step Supply Chain and Logistics Planning Presentation
Bring your workflow to life with a clean three-stage visual that makes your process feel fast, simple, and smart. This slide helps explain planning steps, logistics timelines, and supply chain actions in a way that’s easy for any audience to follow. Fully compatible with PowerPoint, Keynote, and Google Slides.


4 diapositivas
Financial Cost Management Strategies Presentation
Effectively plan and monitor financial performance with the Financial Cost Management Strategies Presentation template. This slide provides a clear roadmap for cost optimization, budget allocation, and financial efficiency improvements. Ideal for finance teams, business strategists, and executives aiming for streamlined cost control. Fully editable in PowerPoint, Keynote, and Google Slides for easy customization.