


Características


¿Tienes alguna pregunta?
Recomendar


10 diapositivas
Business Strategy Puzzle Presentation
Build a strong foundation with the Business Strategy Puzzle. This visually compelling design helps you break down key strategic components, business planning, and operational workflows into digestible segments. Perfect for corporate strategies, project management, and executive decision-making. Fully editable and compatible with PowerPoint, Keynote, and Google Slides.


8 diapositivas
Success Strategy Triangle Presentation
Craft a winning strategy with the Success Strategy Triangle template. This structured design helps visualize key business components in a step-by-step format, making it ideal for growth planning, decision-making, and performance analysis. Fully customizable and easy to use, it’s compatible with PowerPoint, Keynote, and Google Slides for seamless integration.


7 diapositivas
Big Data Analytic Infographics
Big Data are the large and complex data sets that are difficult to process and analyze using traditional data processing methods. This template will allow you to visualize key data points and insights in an appealing and easy to digest way. Your information is presented in a clear manner with a variety of graphs, to convey the fundamentals of big data analytics. Customize this infographic with your own data in the bullet points and graphics. Quickly edit text and colors for your next presentation. All the slide in this template are fully editable in Powerpoint, Keynote, and Google Slides.


6 diapositivas
Corporate Performance Annual Report
Present key business metrics with precision using this Corporate Performance Annual Report slide. Designed with progress bars and intuitive icons, this layout clearly communicates departmental or project-based performance. Ideal for year-end reviews, board meetings, and investor updates. Fully editable in PowerPoint, Keynote, and Google Slides.


22 diapositivas
Event Agenda Presentation
Organize your event with precision using this Event Agenda presentation template. Designed for clarity and impact, it includes slides for conference overviews, speaker introductions, session descriptions, and networking opportunities. Perfect for business conferences or workshops, this template is compatible with PowerPoint, Keynote, and Google Slides, ensuring your event runs smoothly and professionally.


20 diapositivas
Chordstream Professional Portfolio Showcase Presentation
The Portfolio Presentation Template offers a modern and creative design, perfect for showcasing your projects, philosophy, and services. With 20 customizable slides, it includes sections for project highlights, pricing, client testimonials, and contact information. Compatible with PowerPoint, Keynote, and Google Slides, this template ensures professional impact for creatives.


10 diapositivas
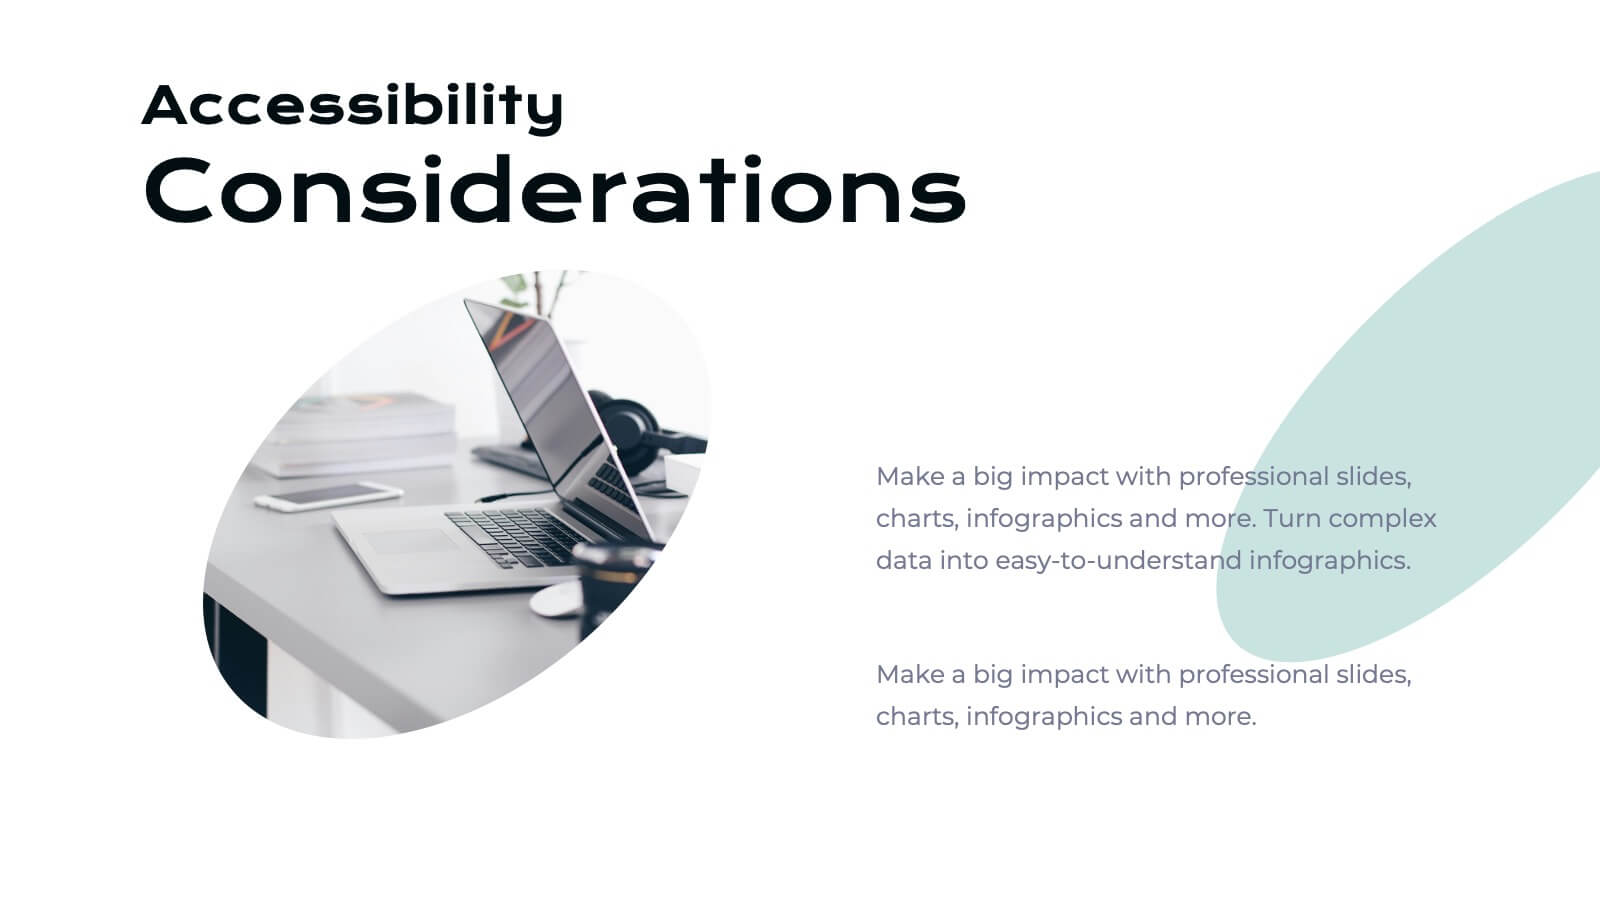
Body System Educational Overview Presentation
Dive into anatomy with a slide that makes learning the human body visual, clear, and interactive. This educational overview breaks down key body systems into simple, labeled sections—perfect for classroom teaching, medical training, or health awareness campaigns. Fully editable and compatible with PowerPoint, Keynote, and Google Slides for seamless customization.


7 diapositivas
Product Life Cycle Infographic Presentation Template
The product life cycle is a theoretical model that describes the stages a product goes through during its lifetime, from its introduction to the market until its eventual decline and removal from the market. Use this presentation template as a visual aid to help explain the characteristics and impact of each stage, including introduction, growth, maturity and decline. Our product life cycle template can be use to teach students the concepts of product design, sales and marketing as well. This is a simple and informative way to explain the four basic stages of product development in a simple way.


6 diapositivas
McKinsey 7S Framework
Visualize the interdependent elements of organizational success with this professional McKinsey 7S Framework template. Ideal for strategic planning, change management, or internal assessments, this editable slide highlights structure, systems, style, staff, skills, strategy, and shared values. Fully compatible with PowerPoint, Keynote, and Google Slides.


6 diapositivas
Isometric 3D Elements Presentation
Add depth and dimension to your ideas with this sleek 3D visual layout that transforms flat concepts into engaging graphics. Perfect for showing connected processes, stages, or data structures, it balances clarity with creativity. Fully editable and compatible with PowerPoint, Keynote, and Google Slides for effortless customization.


7 diapositivas
Milestones Credit Card Infographic Presentation
A Milestones Infographic is a visual representation of significant events, accomplishments, or achievements in a project, business, or individual's life. This template include timelines, graphs, diagrams, and other visual elements to help convey important information. You can use this infographic to cover many different topics, including project management, business growth, personal achievements, or company history. This template is useful for businesses or individuals who want to showcase their accomplishments, highlight important dates or events, or just share progress updates.


7 diapositivas
Organizational Analysis McKinsey 7S Presentation
Explore the core of organizational alignment with our McKinsey 7S Model presentation template. Perfectly crafted for analyzing and optimizing business structures, this template guides you through the seven essential elements: Strategy, Structure, Systems, Shared Values, Skills, Staff, and Style. Its intuitive design ensures effective communication and clarity in your presentations. Optimized for PowerPoint, Keynote, and Google Slides, it's an invaluable tool for consultants and business strategists aiming to enhance internal coherence and performance.


20 diapositivas
Leafsong Design Strategy Proposal Presentation
This Design Strategy Presentation Template is perfect for showcasing your creative process, key design elements, and project planning. Covering essential aspects like moodboards, prototypes, and design assets, it ensures a structured and visually appealing approach. Fully customizable and compatible with PowerPoint, Keynote, and Google Slides.


6 diapositivas
Annual Corporation Report Infographics
Our Annual Corporation Report infographic is an optimal visual enhancement for presentations in Powerpoint, Keynote, and Google Slides, tailored for corporate executives, financial analysts, and stakeholders. This infographic is meticulously designed to present annual financial and operational data in a structured and easily interpretable manner. The infographic provides a visual summary of an organization's yearly performance, including financial figures, growth metrics, and key performance indicators (KPIs). Its layout is engineered to present complex data in a digestible format, facilitating quick comprehension and analysis of the company's annual achievements and areas for improvement. Incorporating this infographic into your annual report presentations will not only streamline the communication of your corporation's yearly outcomes but also enable your audience to better grasp the strategic insights derived from this data. Whether you're reviewing revenue streams, expenditure, or performance benchmarks, this infographic will serve as a powerful tool to convey your message with clarity and precision.


22 diapositivas
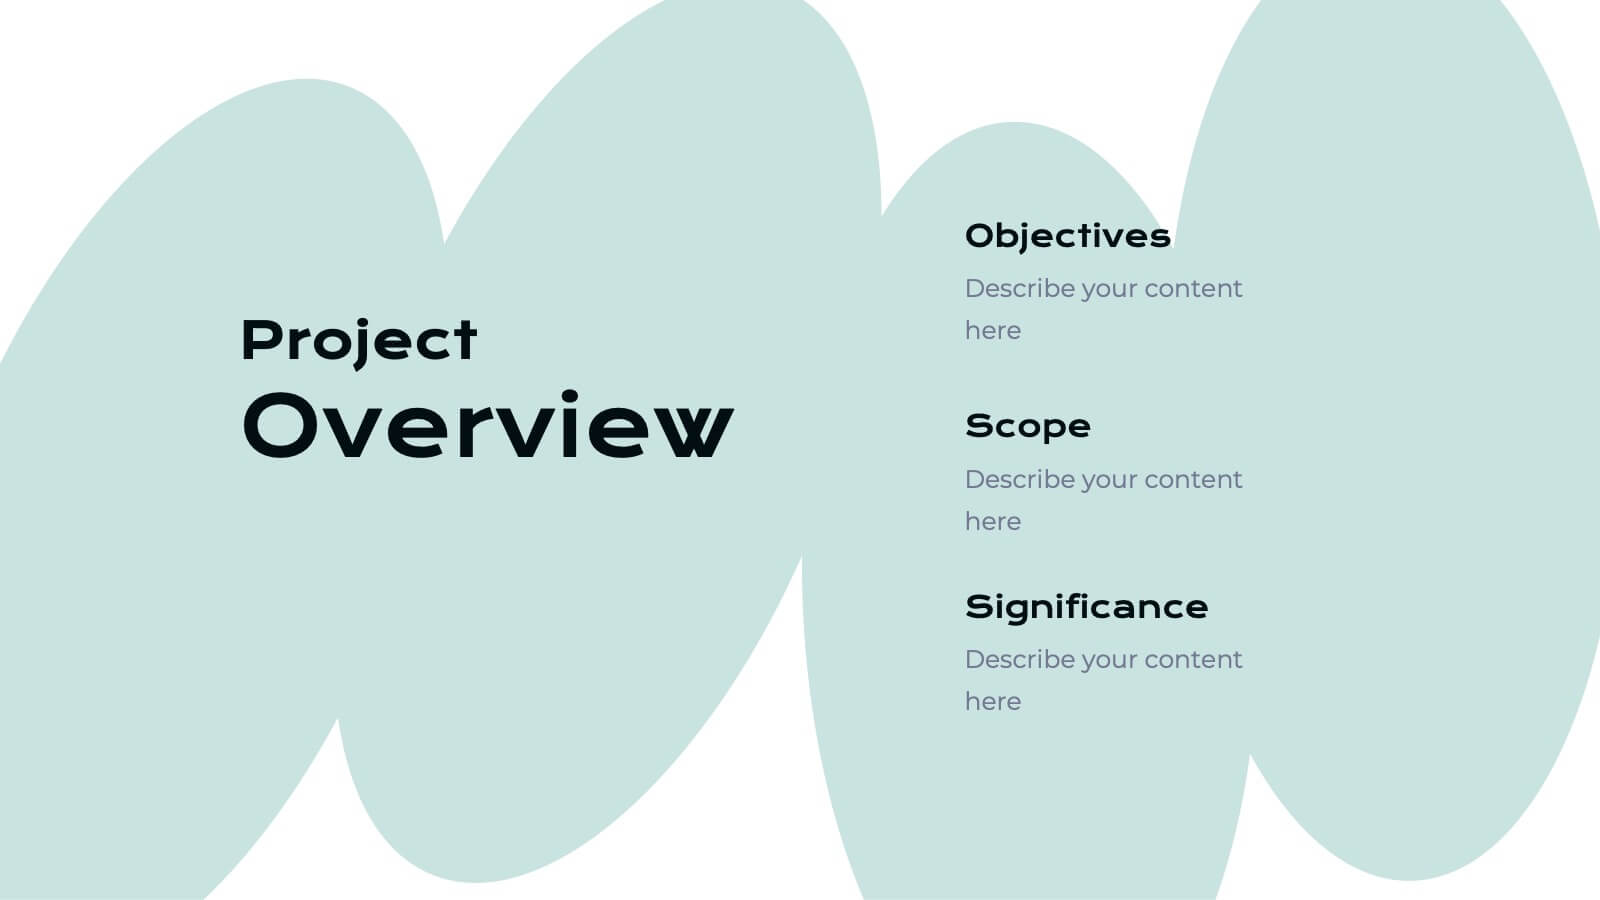
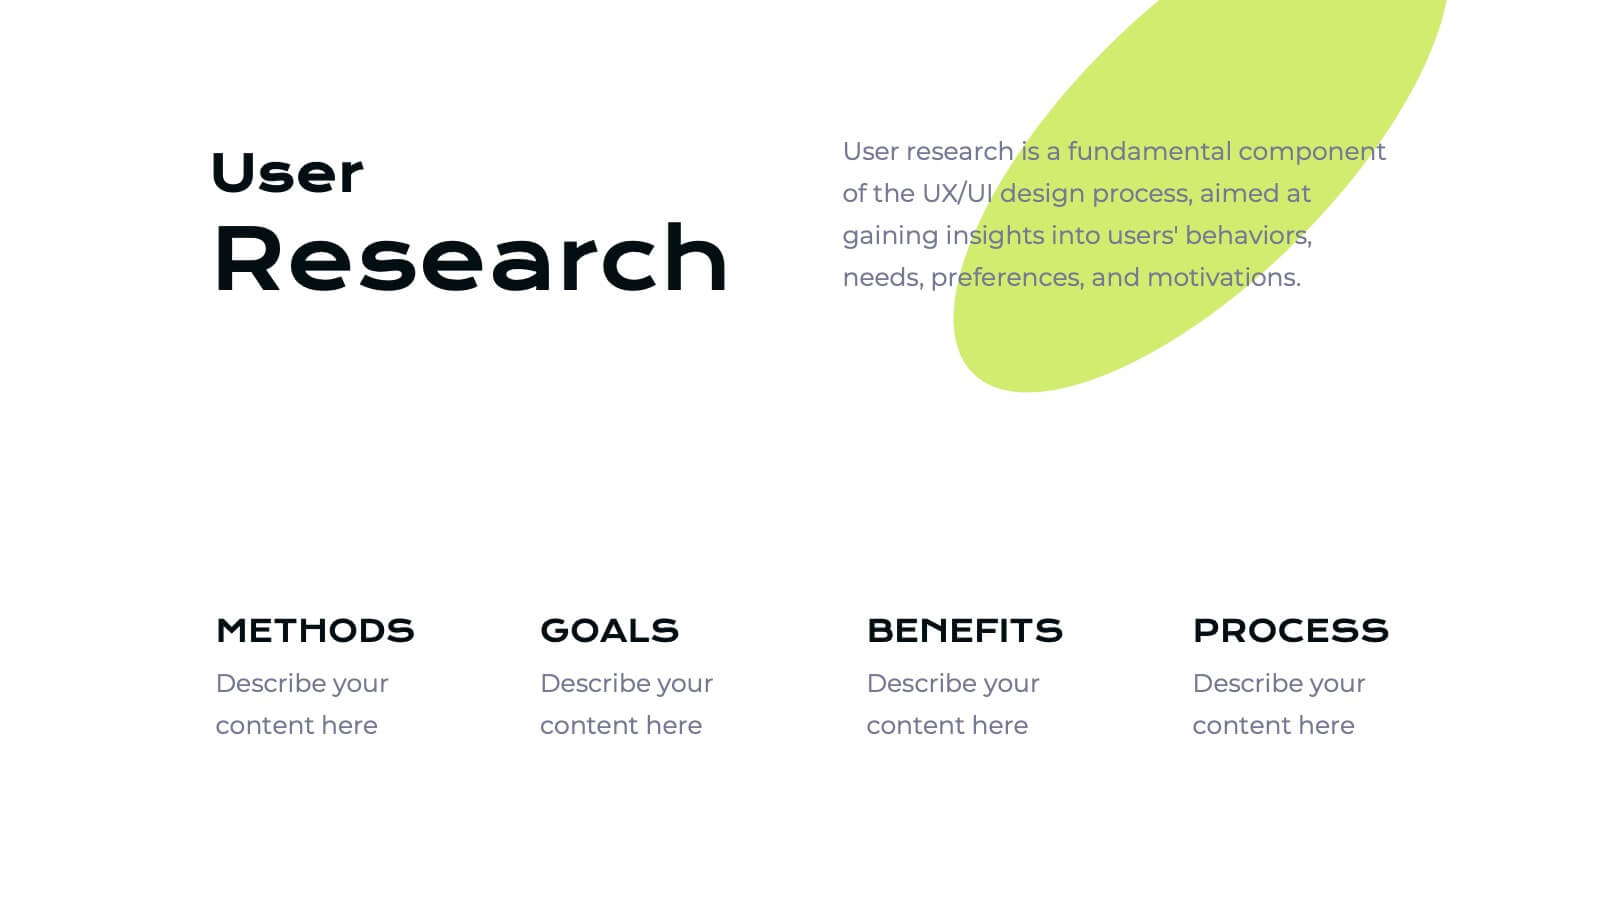
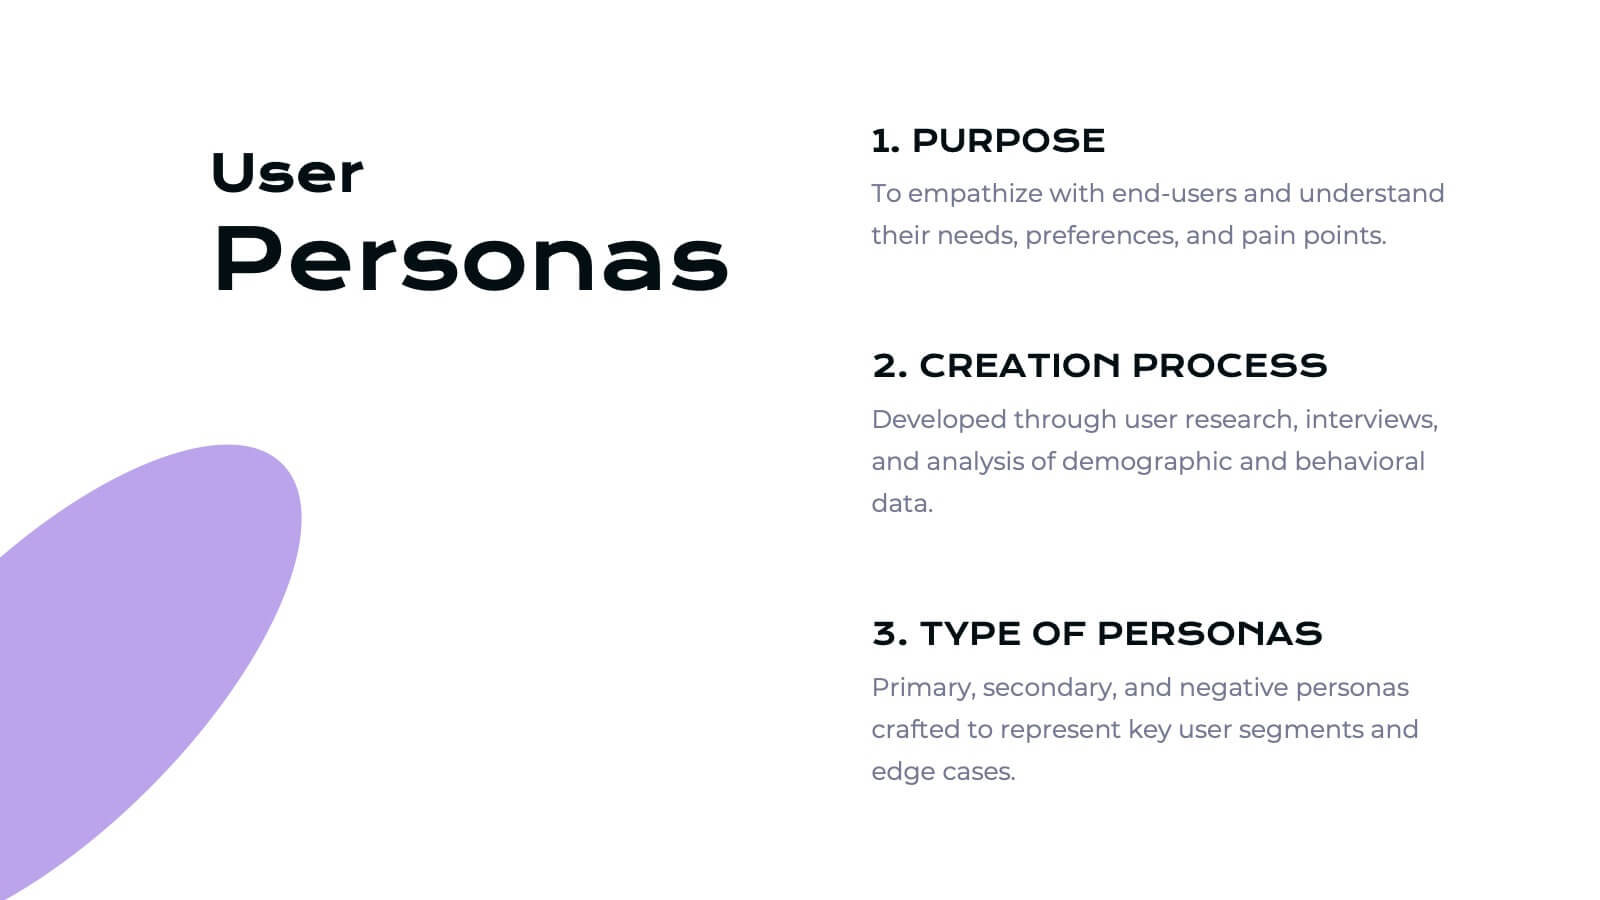
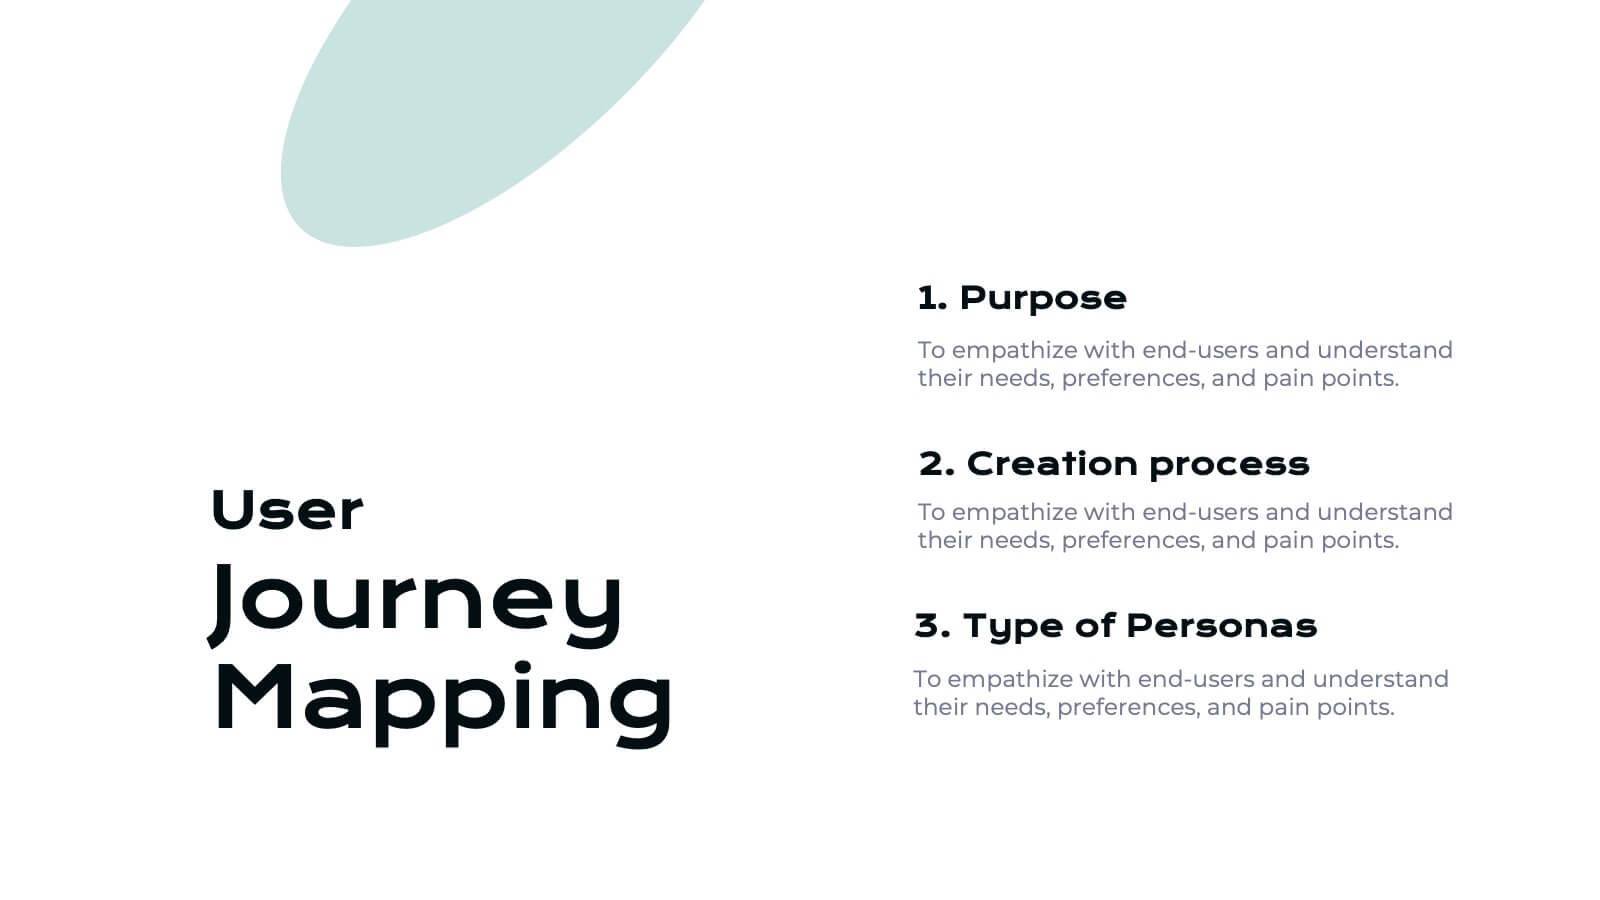
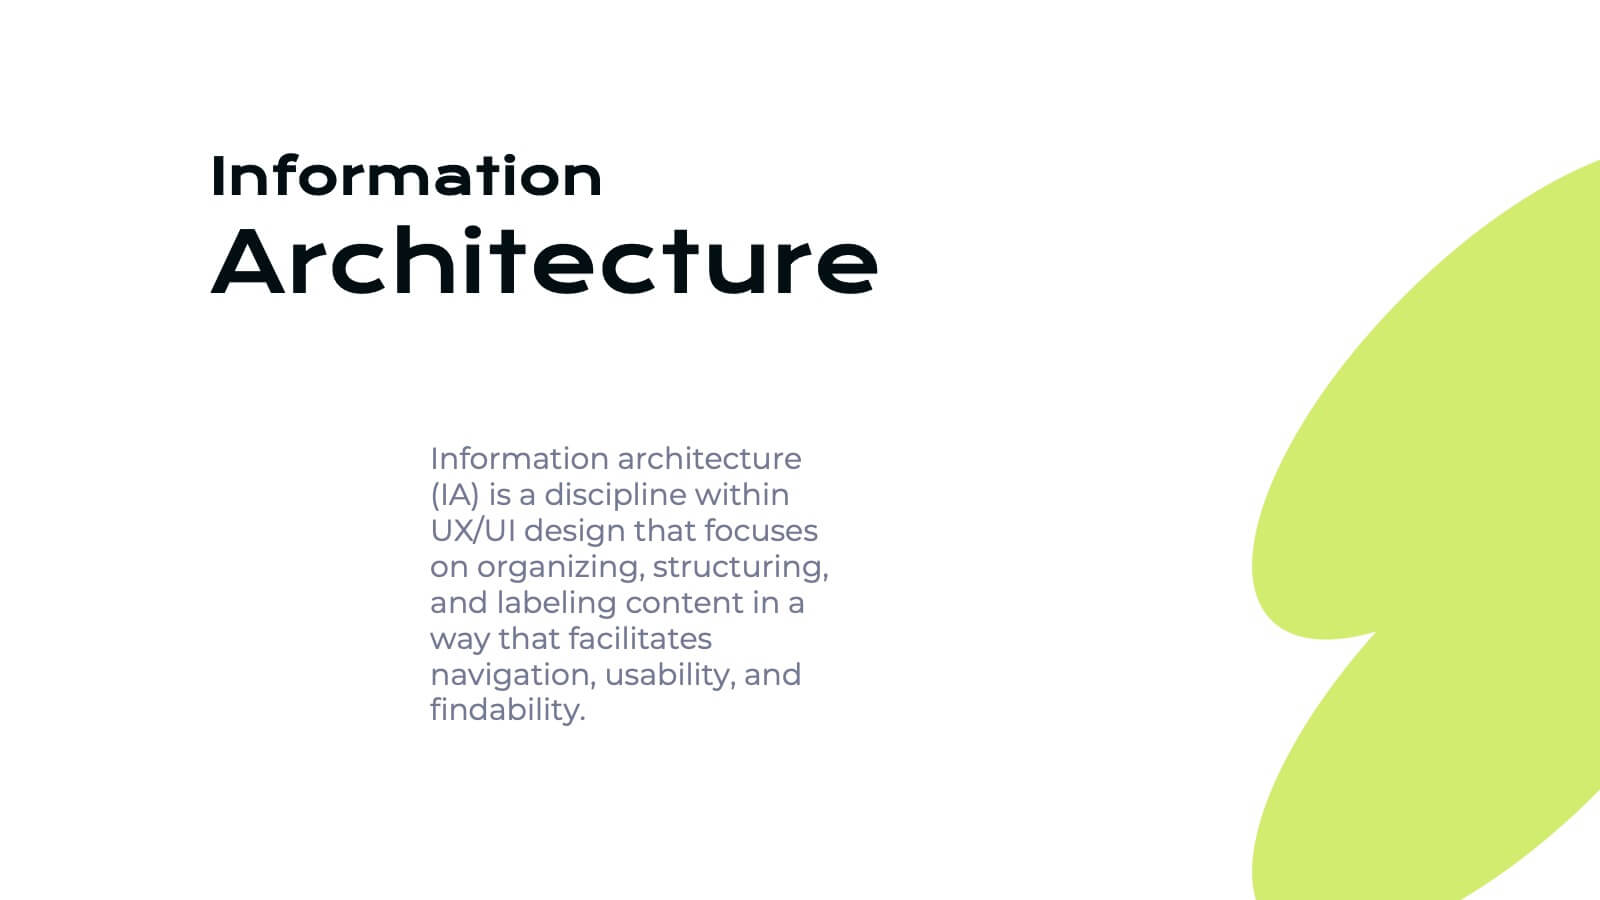
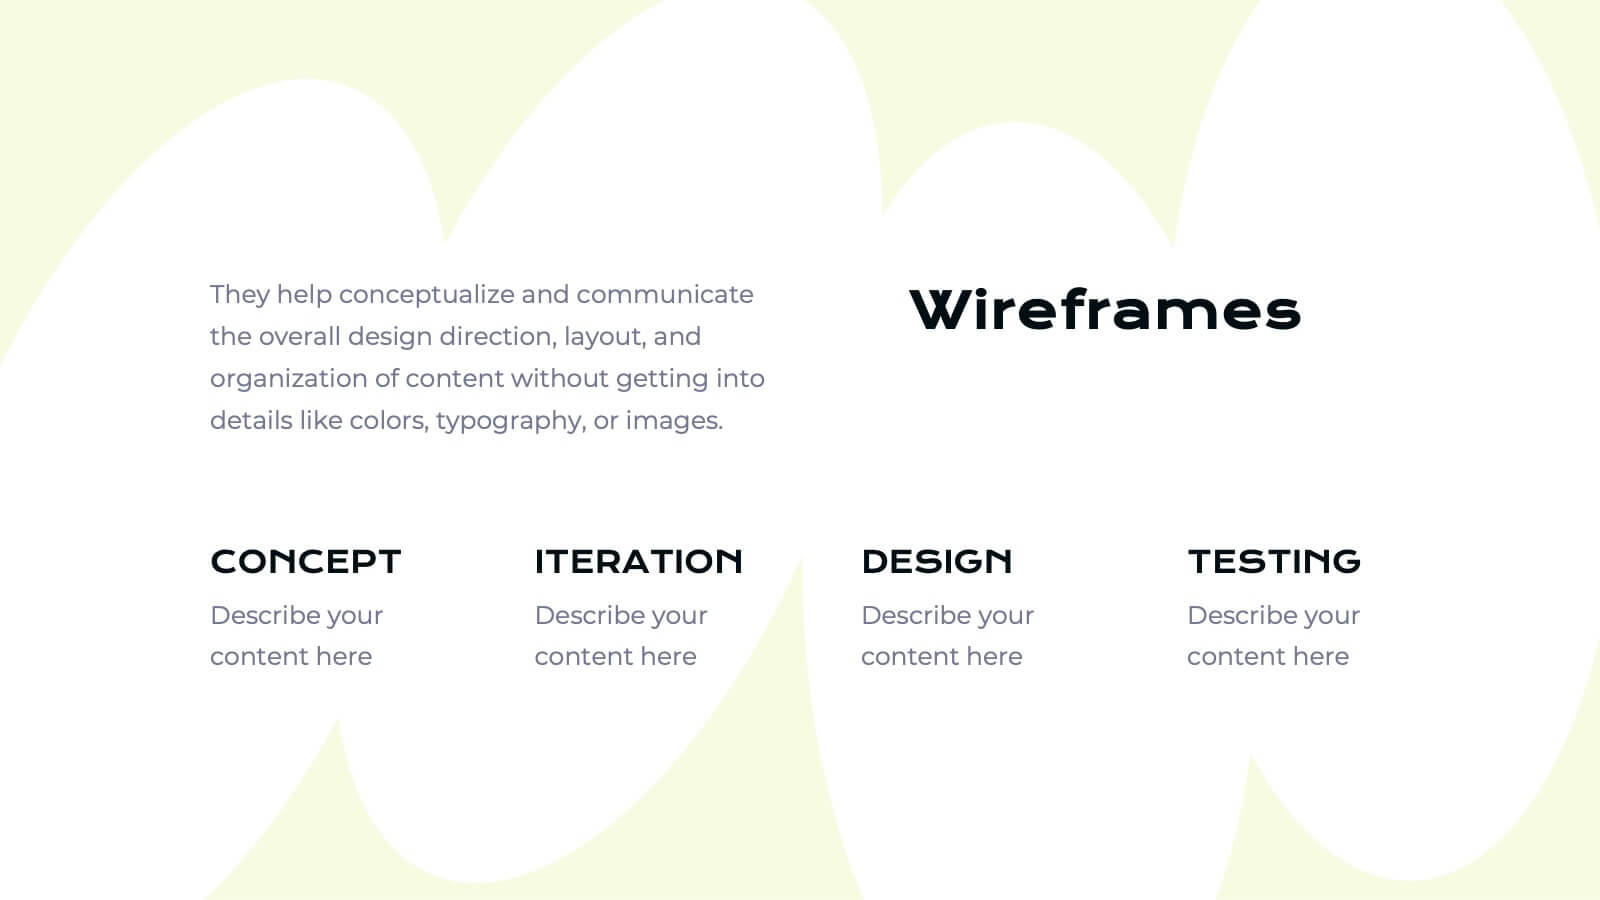
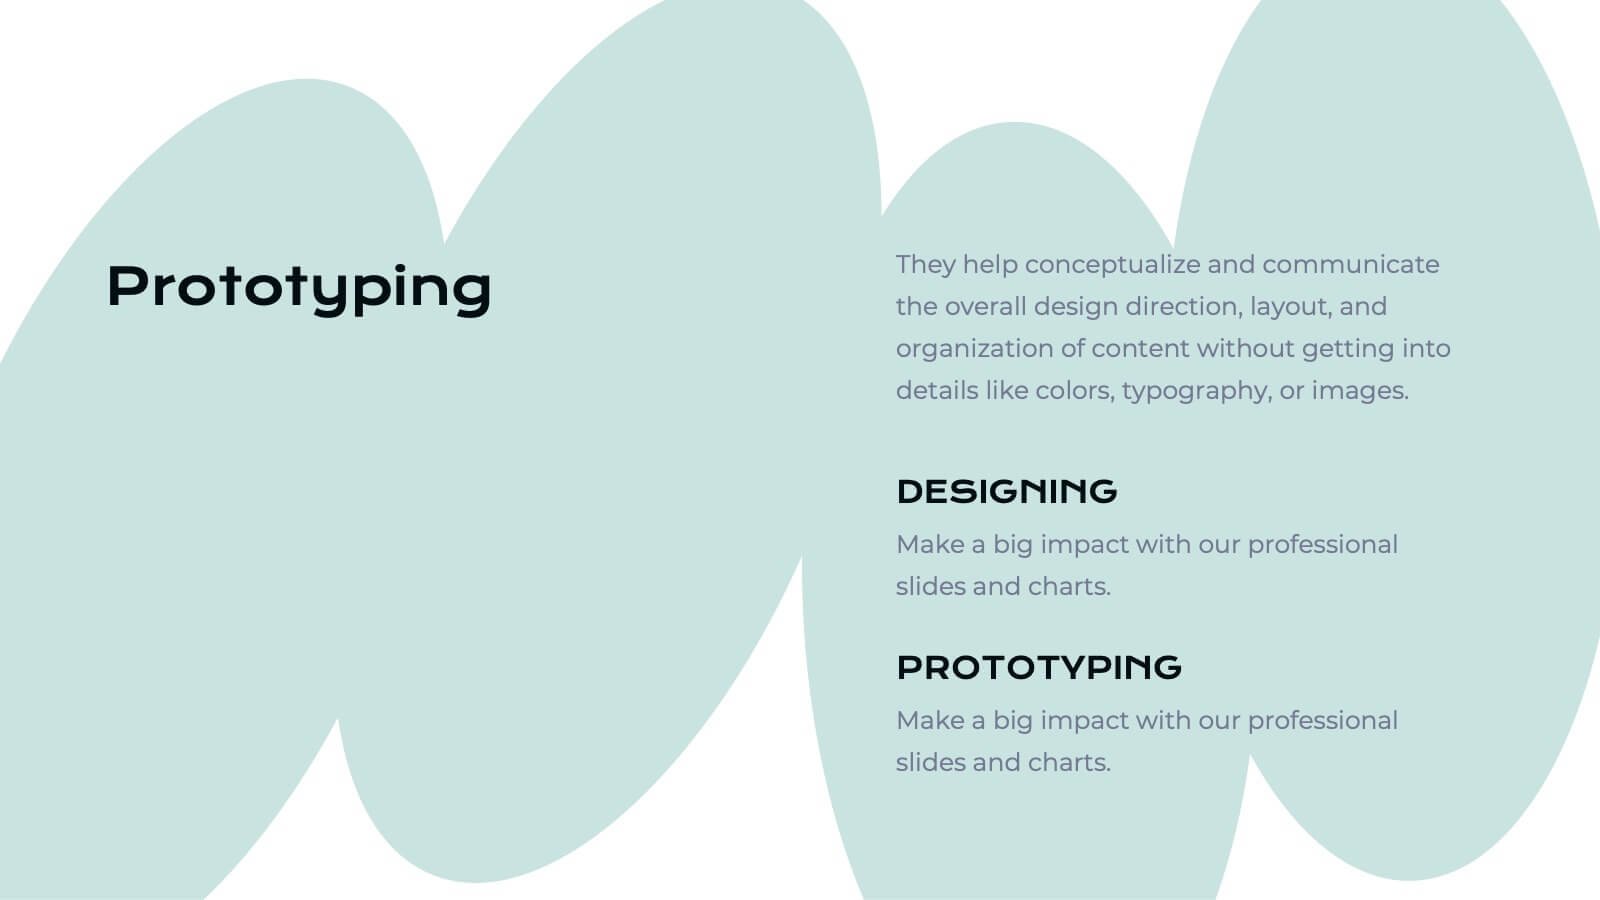
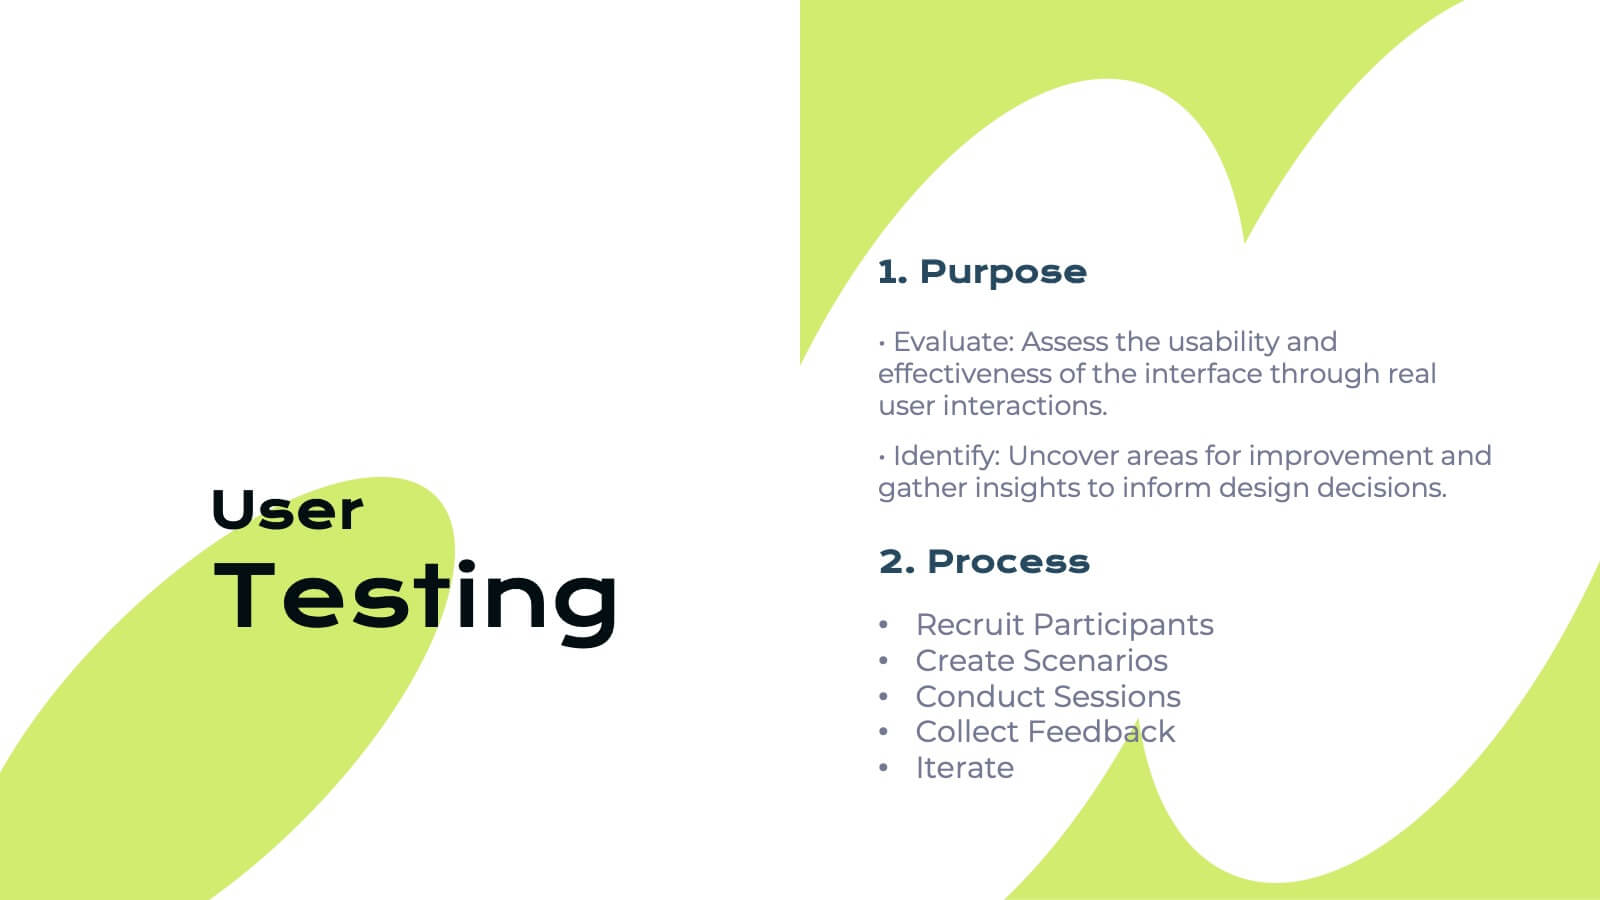
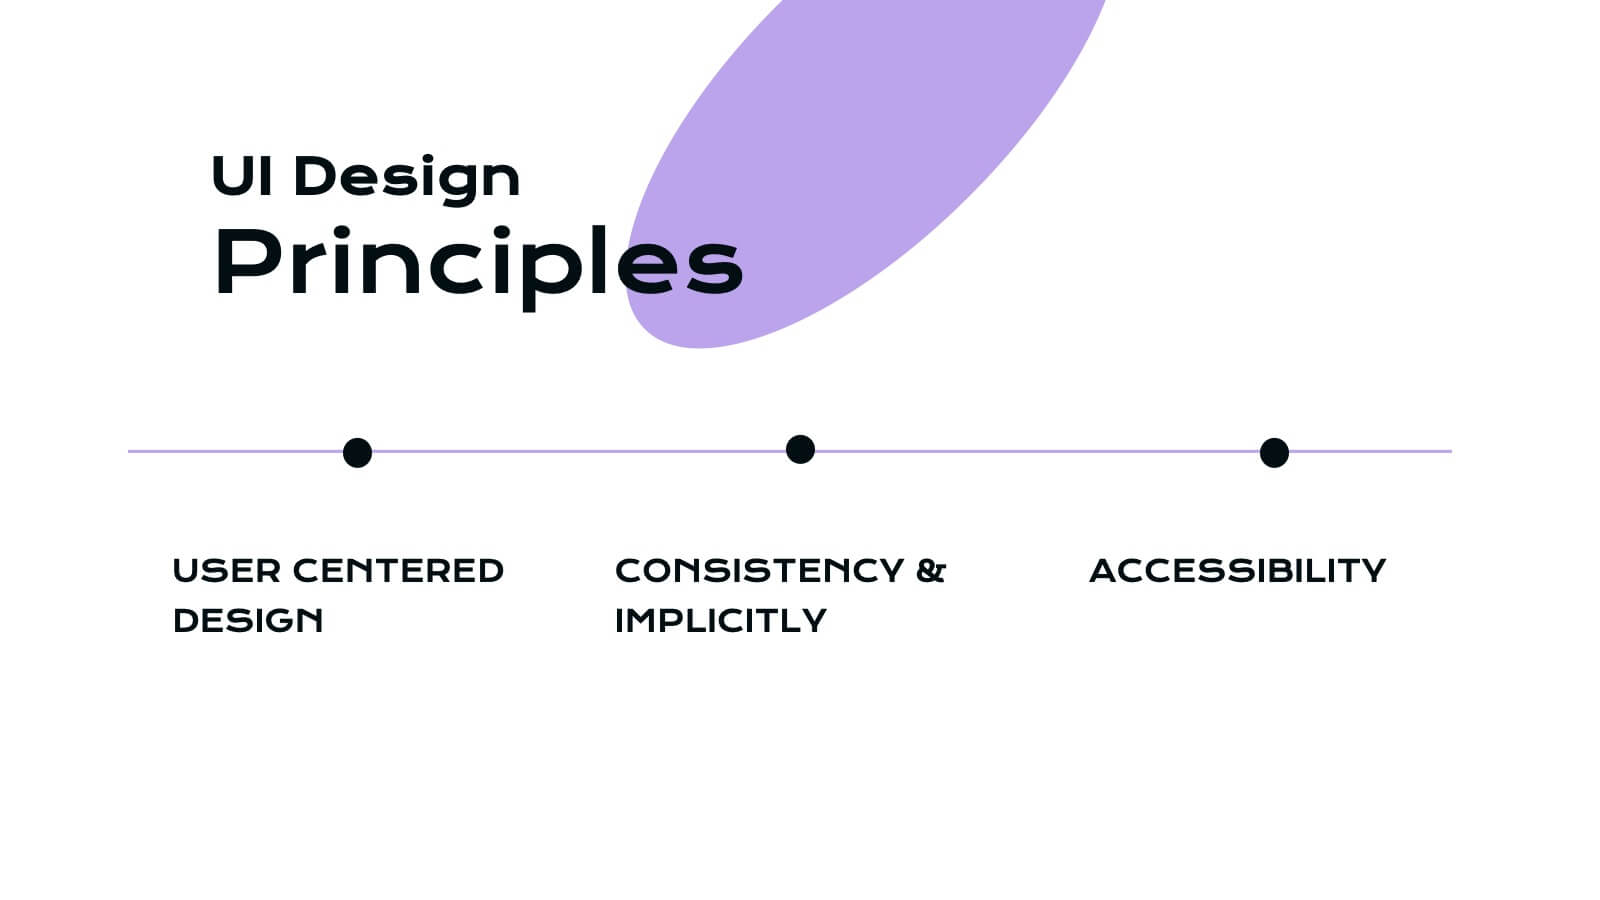
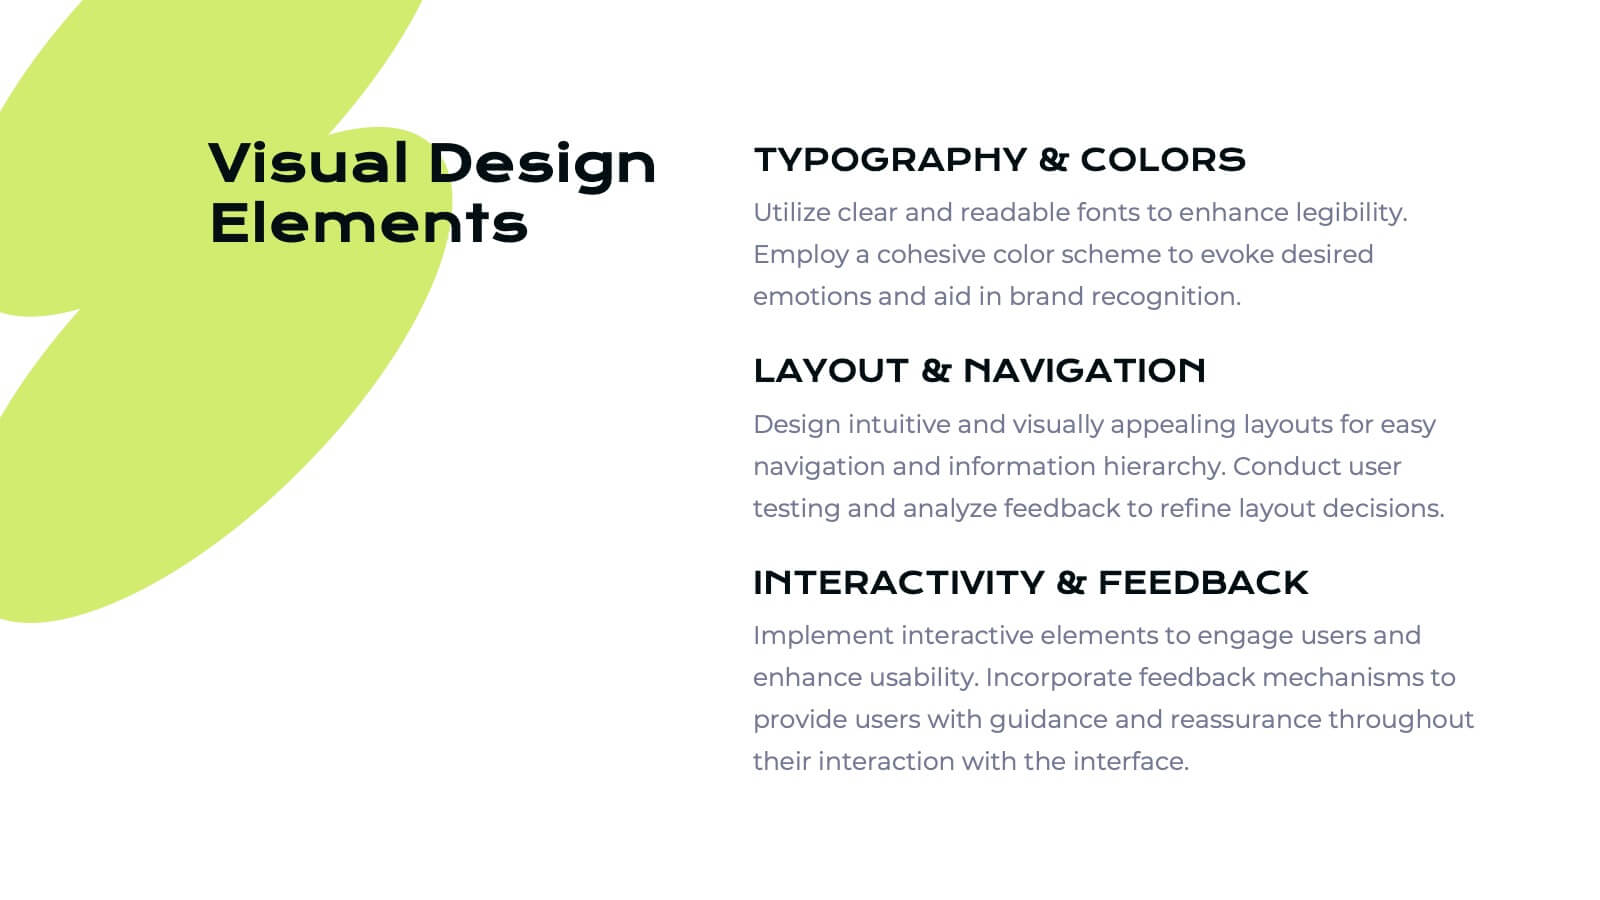
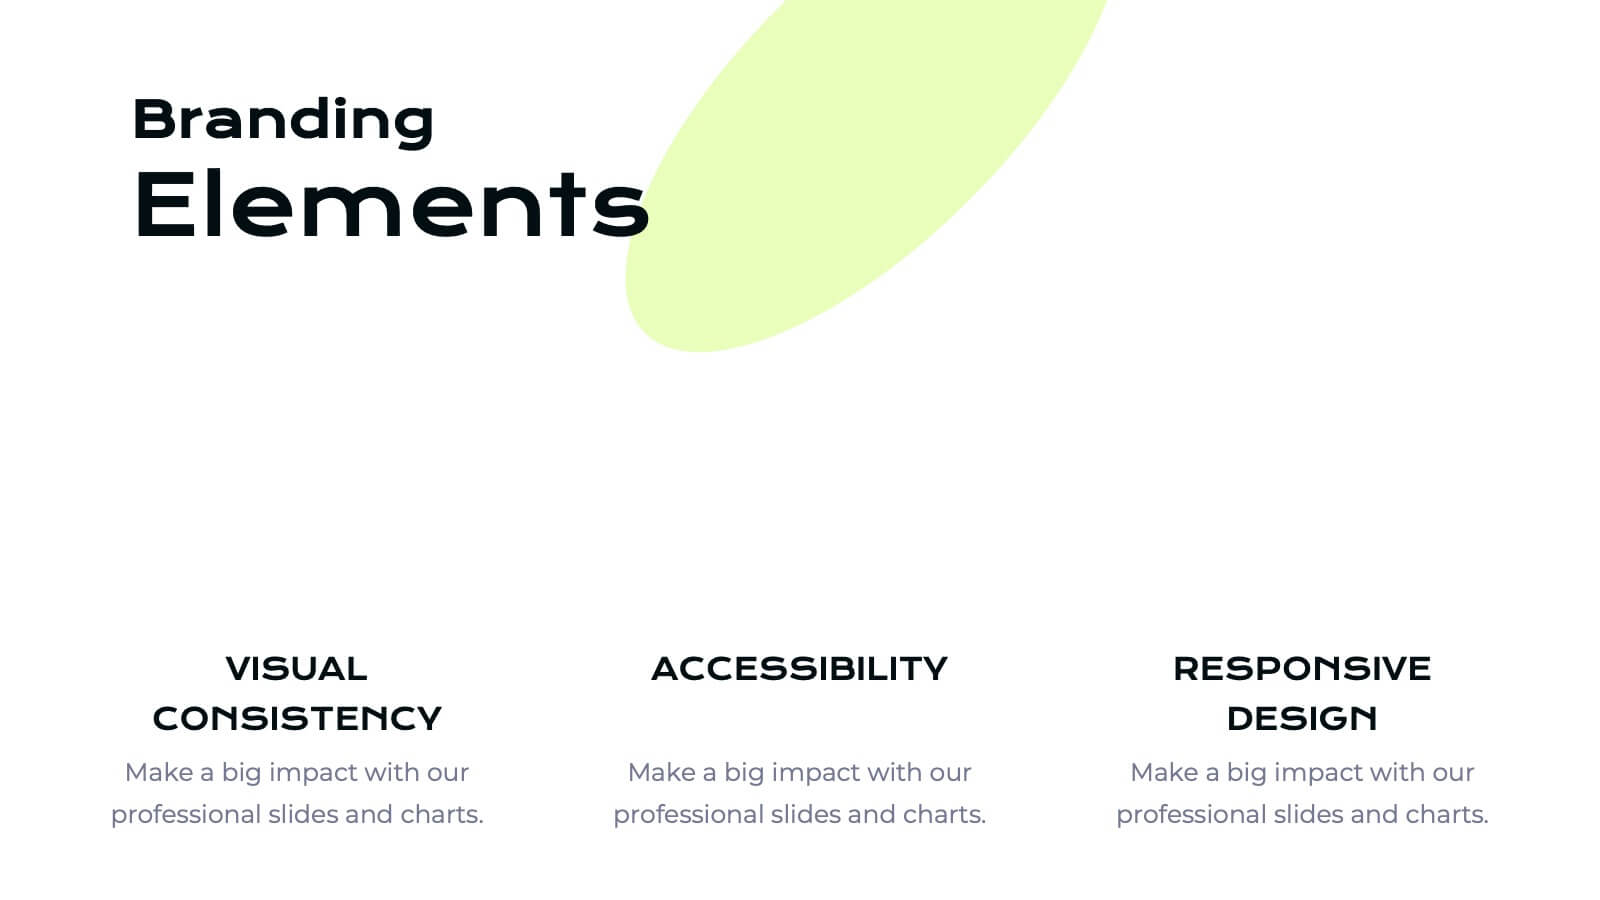
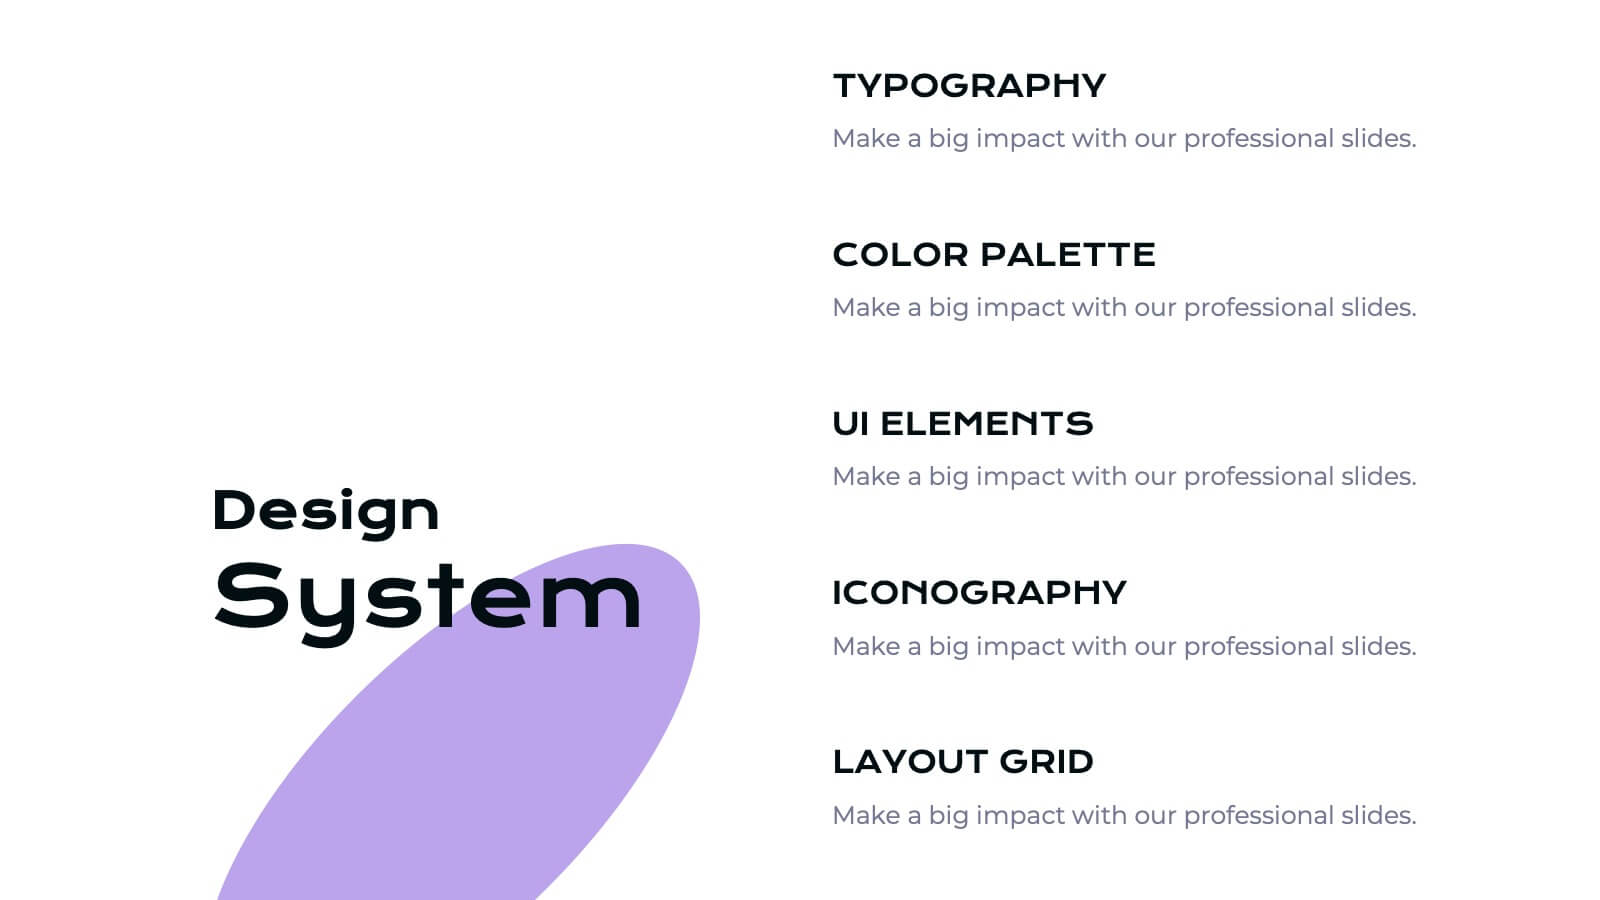
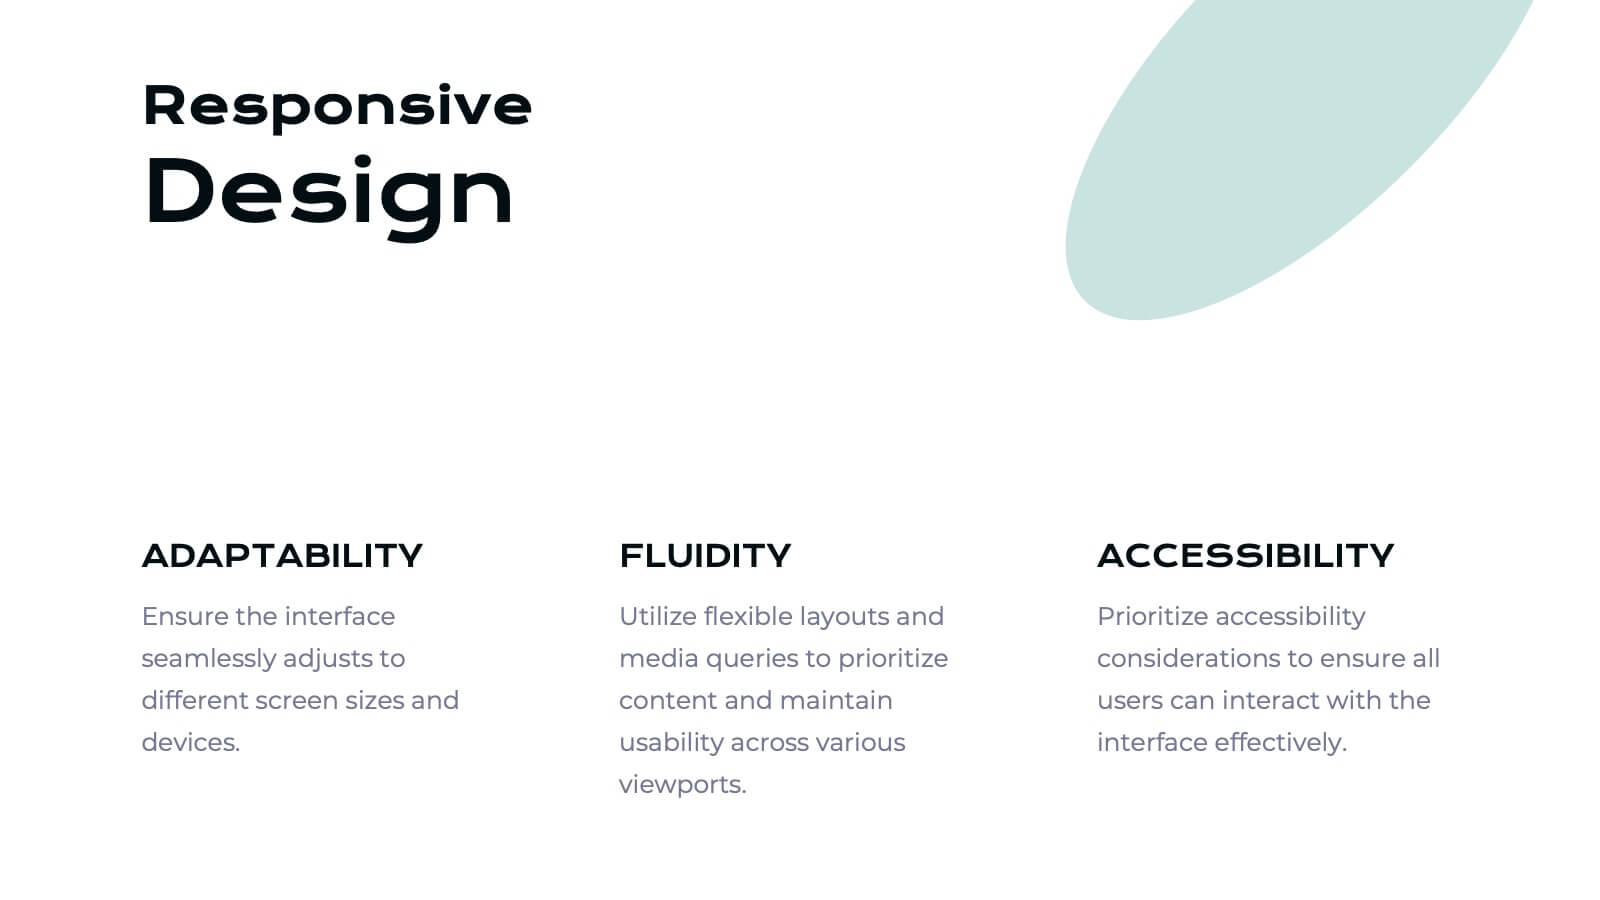
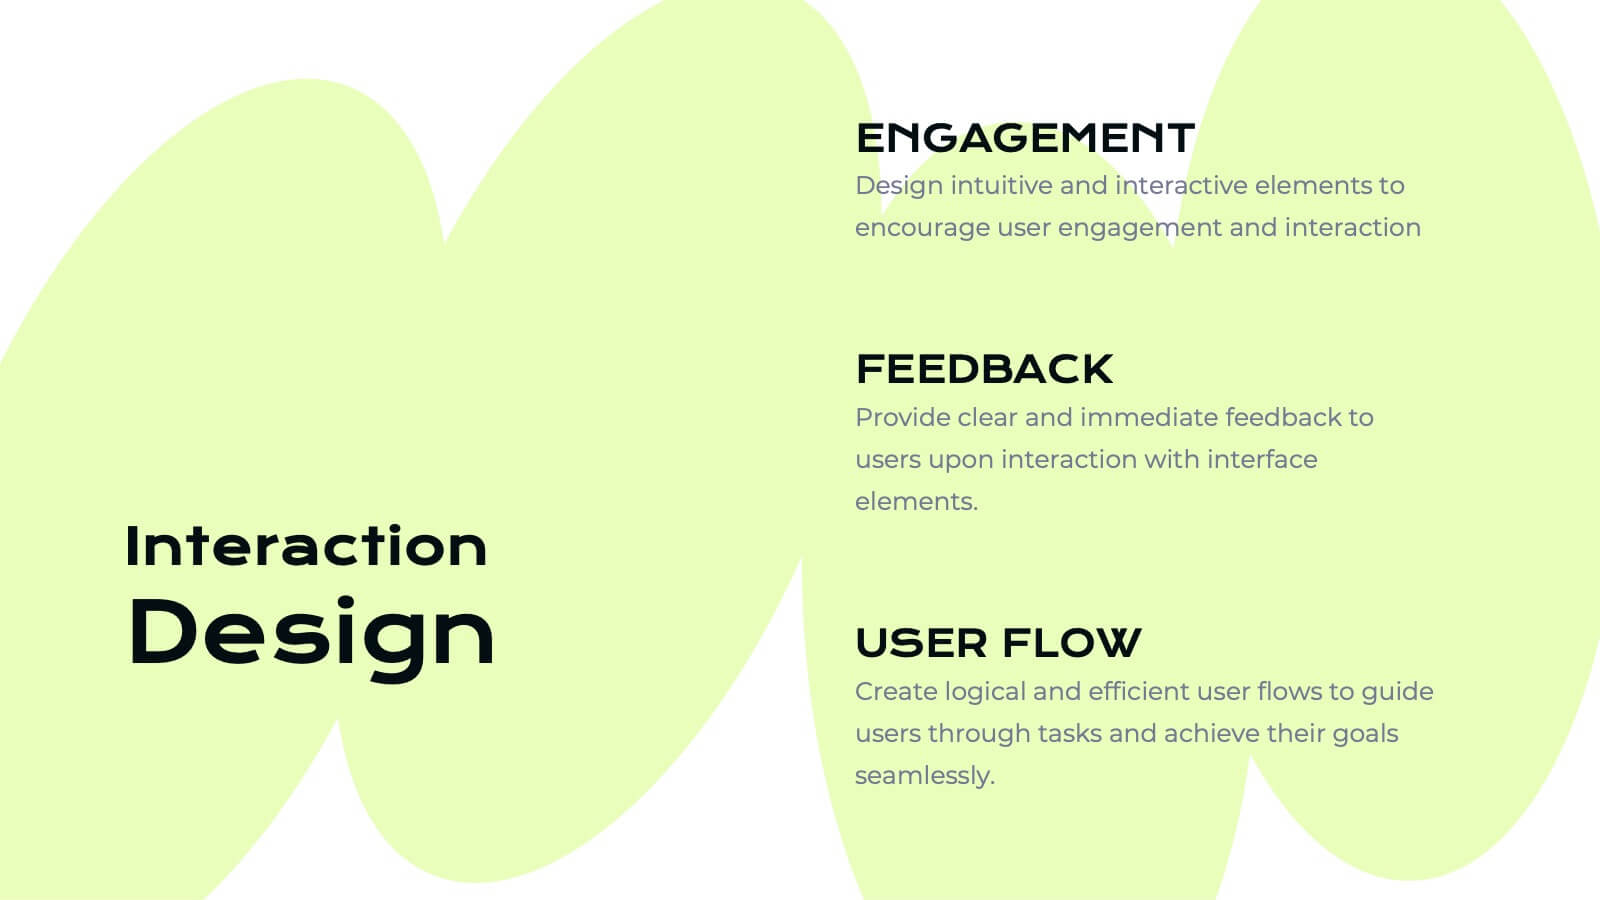
Ifrit User Experience Proposal Presentation
Unleash the power of great design with this fiery Ifrit-inspired presentation, perfect for delivering your user experience proposal! This template lets you showcase your UX strategies, research, and design process in a visually striking and well-organized format. Impress stakeholders with every slide. Compatible with PowerPoint, Keynote, and Google Slides.


5 diapositivas
Cybersecurity Protocols and Threat Response Presentation
Visualize your security framework with the Cybersecurity Protocols and Threat Response presentation slide. Featuring a central lock icon surrounded by four quadrant-based callouts and symbolic icons (e.g., fingerprint, shield, malware), it’s ideal for outlining access controls, incident response, and threat monitoring strategies. Fully editable in PowerPoint, Keynote, and Google Slides.


7 diapositivas
World Map Weather Infographic
A world weather map is a graphical representation that displays current weather conditions and forecasts across different regions of the world. Unveil the world's atmospheric tapestry with our world map weather infographic template. This visually stunning and informative infographic is your passport to understanding global weather patterns, giving you a clear view of climate diversity and trends across continents. This template is designed to provide an overview of various meteorological parameters, including temperature, precipitation, wind speed and direction, humidity, and atmospheric pressure.