


Características


¿Tienes alguna pregunta?
Recomendar


26 diapositivas
Textures Company Profile Black Presentation
A company profile is a concise document that provides an overview of a business, its history, products or services, achievements, mission, vision, values, and other relevant information. This presentation template is designed for businesses to showcase their brand identity and services in an elegant and professional manner. With a dominant black color theme, this presentation exudes a sense of modernity and class, making it perfect for businesses in various industries. Introduce your company's history, mission, and values in a concise and compelling manner. Utilize the clean and clear typography to maintain a professional and sophisticated look.


6 diapositivas
Dashboard Project Infographic
A dashboard project is a visual representation of important data and key performance indicators presented in a single, easy-to-understand display. This infographic template provides real-time insights and allows users to monitor, analyze, and make data-driven decisions efficiently. This template is perfect for project managers, team leaders, and stakeholders looking to present project progress, key performance indicators, and other important metrics. The visuals display the progress of the project over time, using charts and graphs to show completed tasks, ongoing activities, and upcoming deadlines. Compatible with Powerpoint, Keynote, and Google Slides.


6 diapositivas
Numeric Data Slide Layout Presentation
Bring your numbers to life with a clean, flowing visual that turns data into an easy-to-follow story. This presentation guides viewers through each step of your process, helping them understand key insights without overwhelm. Ideal for analytics, reporting, and planning. Fully compatible with PowerPoint, Keynote, and Google Slides.


8 diapositivas
End-to-End Supply Chain Optimization
Enhance your supply chain efficiency with this dynamic circular diagram slide. Ideal for logistics experts, supply chain strategists, and consultants, this template visually captures the continuous flow of an 8-step supply chain cycle. Each step is customizable with editable icons and text in PowerPoint, Keynote, and Google Slides.


7 diapositivas
Sustainable Agriculture Infographic Presentation
An Agriculture Infographic presents information and data related to agriculture and the farming industry. This template is designed to cover a wide range of topics, including crop production, livestock farming, food processing, distribution, and sustainable agriculture practices. Use this infographic to provide information on the economic, social, and environmental impacts of agriculture, as well as to showcase new technologies and innovations in the farming industry. This infographic includes 7 slide layouts each with unique illustrations related to agriculture, charts, and diagrams.


6 diapositivas
Anatomy of the Body Infographics
Explore the Anatomy of the Body with our customizable infographic template. This template is fully compatible with popular presentation software like PowerPoint, Keynote, and Google Slides, allowing you to easily customize it to illustrate and communicate various aspects of human anatomy. The Anatomy of the Body infographic template offers a visually engaging platform to outline the major systems, organs, and structures within the human body. Whether you're a student, healthcare professional, or simply interested in understanding the human body, this template provides a user-friendly canvas to create informative presentations and educational materials. Deepen your knowledge of human anatomy with this SEO-optimized infographic template, thoughtfully designed for clarity and ease of use. Customize it to showcase the circulatory system, respiratory system, digestive system, skeletal system, and more, ensuring that your audience gains a comprehensive understanding of the complex and fascinating world of human anatomy. Start crafting your personalized infographic today to explore the Anatomy of the Body in greater detail.


6 diapositivas
Creative Solutions for Business Challenges Presentation
Present your strategy with impact using the Creative Solutions for Business Challenges Presentation. Featuring a dynamic cloud and gear diagram, this layout helps illustrate interconnected solutions and innovative thinking. Ideal for brainstorming, strategic planning, and team problem-solving discussions. Fully editable in PowerPoint, Keynote, and Google Slides.


8 diapositivas
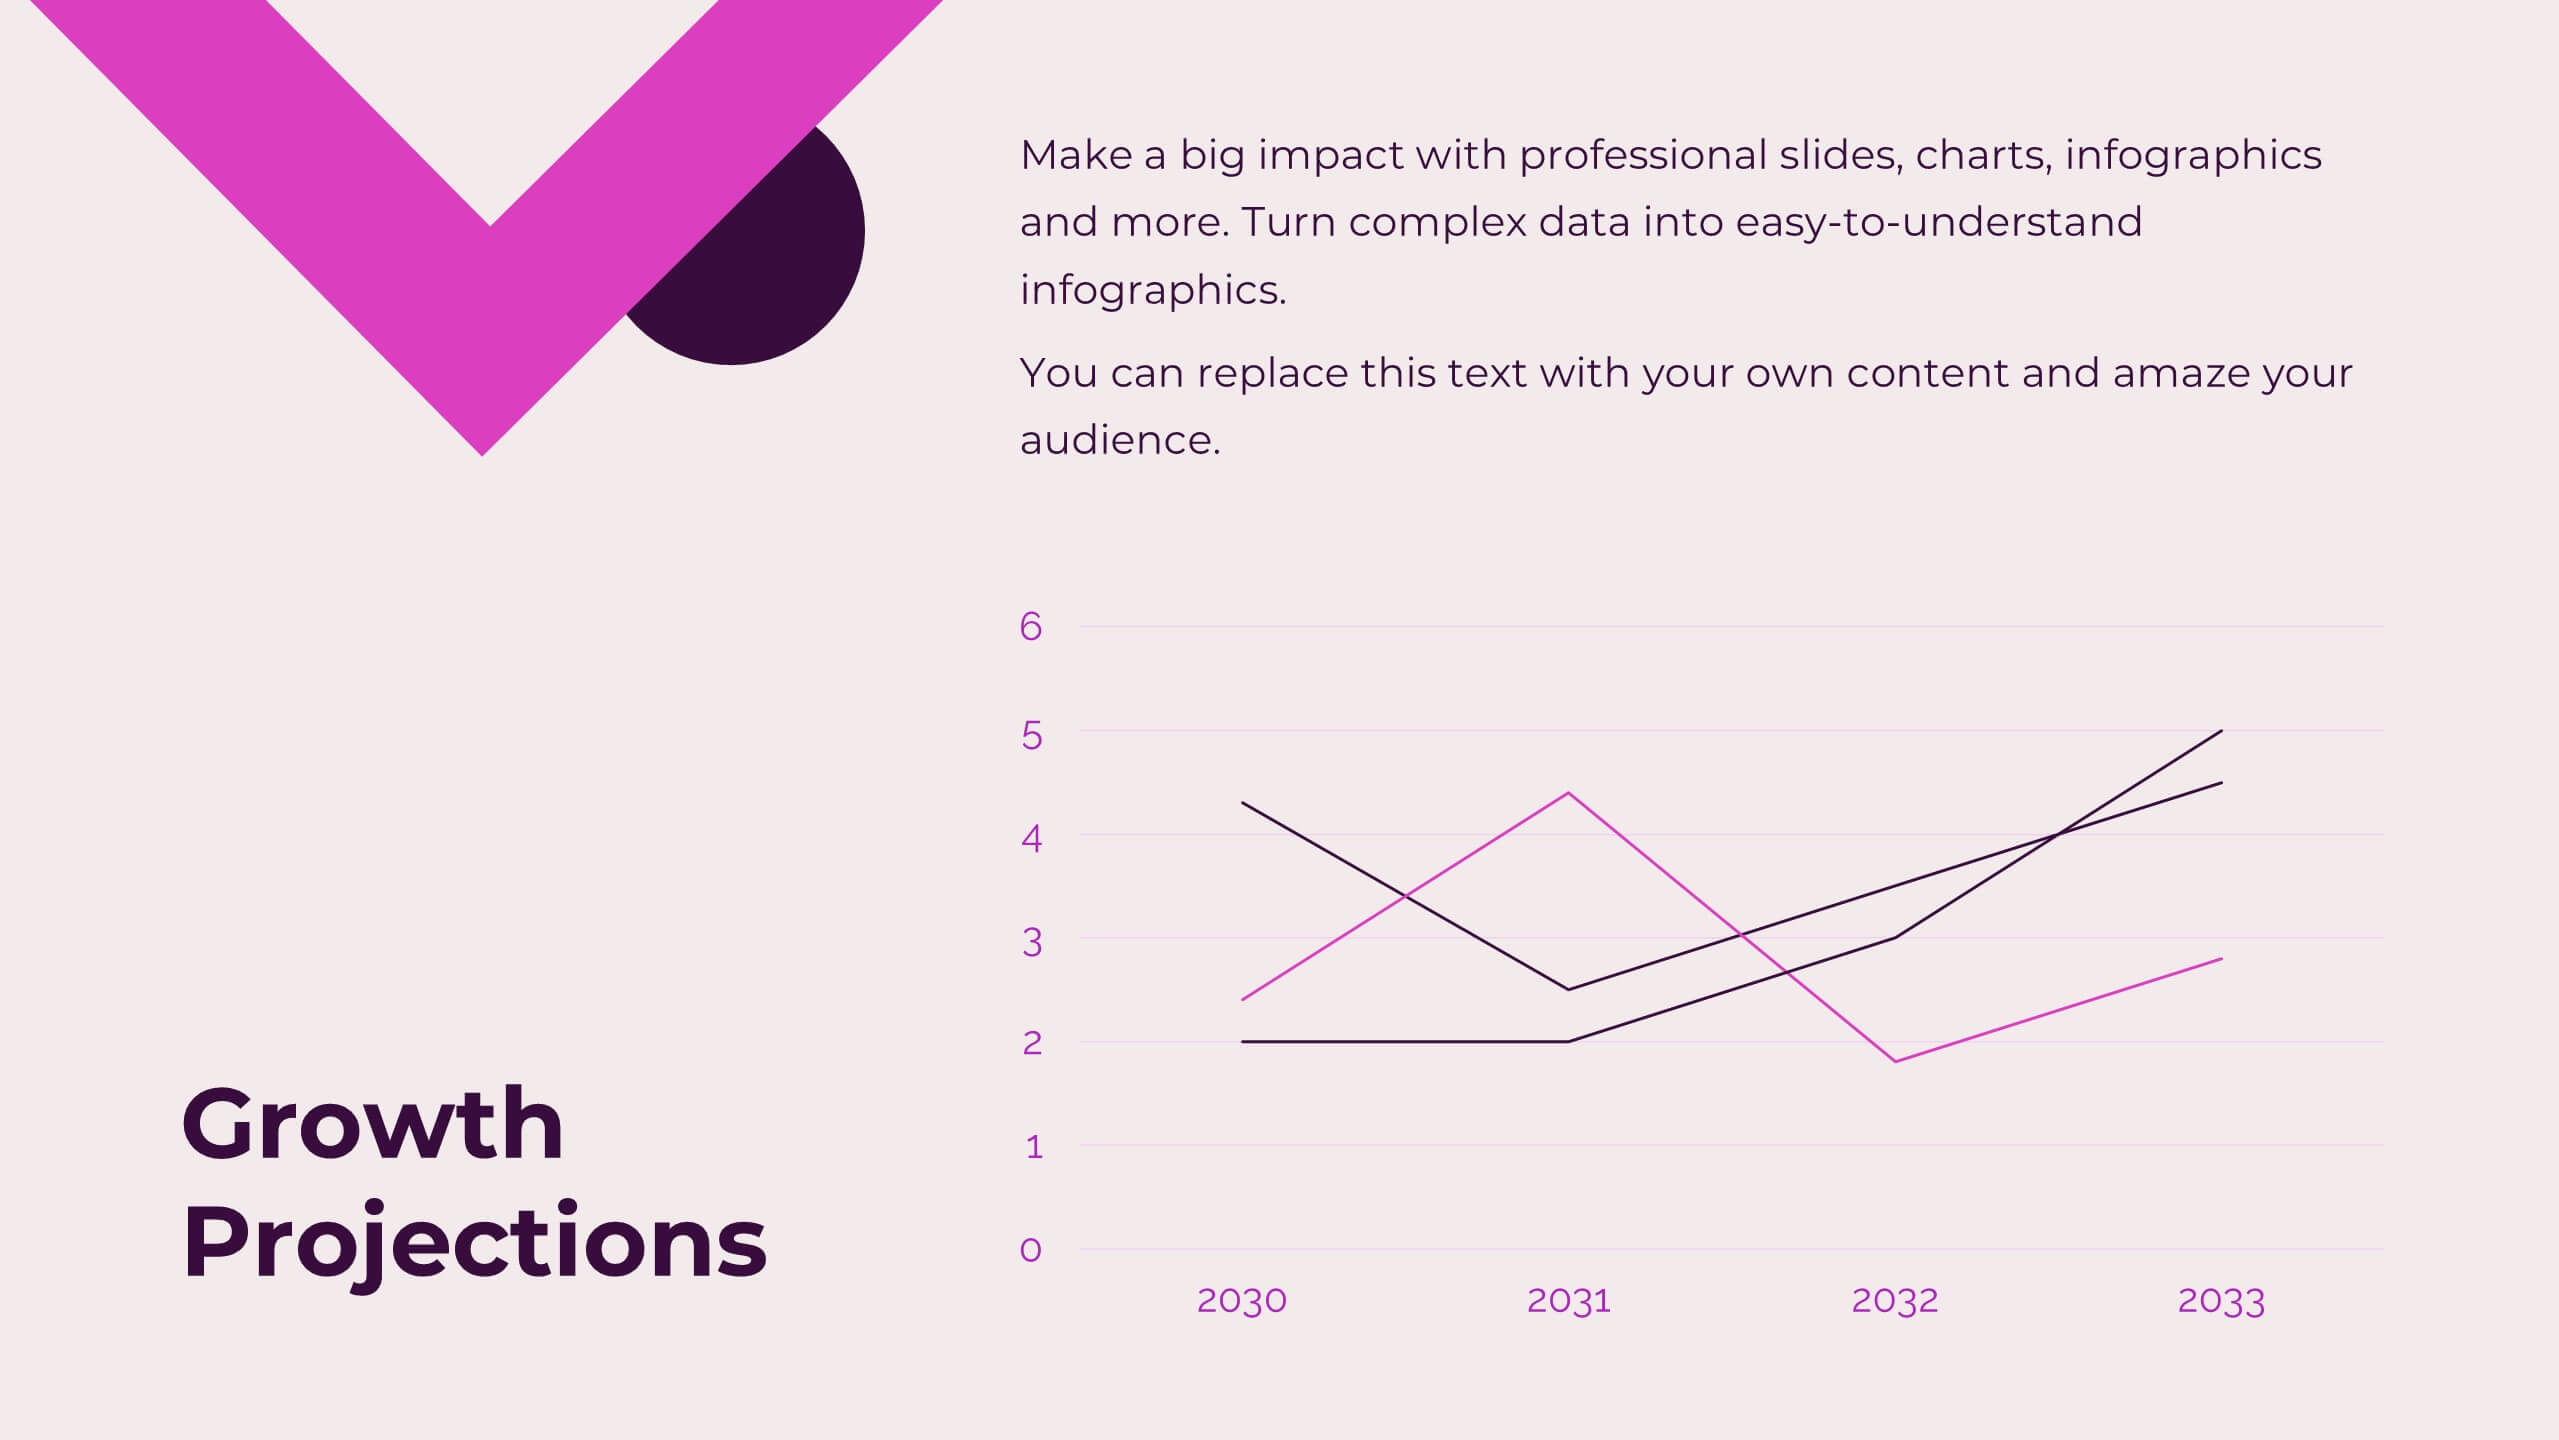
Data-Driven KPI Slide Presentation
Bring your data to life with a sharp, modern layout that turns complex metrics into clear, compelling visuals. This presentation helps you showcase performance insights, compare trends, and highlight key takeaways with ease. Fully customizable and compatible with PowerPoint, Keynote, and Google Slides.


4 diapositivas
Blue Ocean Strategic Differentiation Presentation
Visually compare red and blue ocean strategies with this side-by-side layout. Perfect for showcasing competitive advantages, innovation, and market positioning. Each column highlights key differentiators in a clean, structured format. Ideal for marketing, strategy, or executive presentations. Fully customizable in PowerPoint, Keynote, and Google Slides to match your branding.


4 diapositivas
Business Growth in Numbers Presentation
Showcase business performance with the Business Growth in Numbers Presentation template. Designed for sales reports, financial reviews, and market analysis, this template includes visualized statistics, percentage comparisons, and trend graphs to highlight key growth metrics. Fully customizable and compatible with PowerPoint, Keynote, and Google Slides, it ensures clear and compelling data storytelling.


3 diapositivas
Comprehensive Business Roadmap Strategy Presentation
Plan ahead with confidence using the Comprehensive Business Roadmap Strategy Presentation. This timeline-based slide is perfect for mapping out multi-quarter goals, initiatives, or project phases. Use the horizontal arrows to show overlapping tasks and strategic priorities by quarter. Ideal for project managers, team leads, and business strategists. Fully editable in PowerPoint, Keynote, Google Slides, and Canva.


7 diapositivas
Training Program Infographic Presentation
A Training Infographic is a visual representation of information related to a training program or course. This template is a way to present information in a fun and engaging way, and to help learners understand key concepts and skills covered in the training. This template include diagrams, charts, and many training illustrations. It also includes text that explain the main ideas and objectives of the training, and any specific learning outcomes. The purpose of this training Infographic is to help learners engage with the content of the training and to retain information more effectively.


3 diapositivas
Credit Card Comparison Chart Presentation
Make financial decisions feel clearer and more visual with this clean comparison-focused layout designed to highlight key features side by side. It helps you simplify data, explain differences, and guide smarter choices with confidence. Fully editable and compatible with PowerPoint, Keynote, and Google Slides.


23 diapositivas
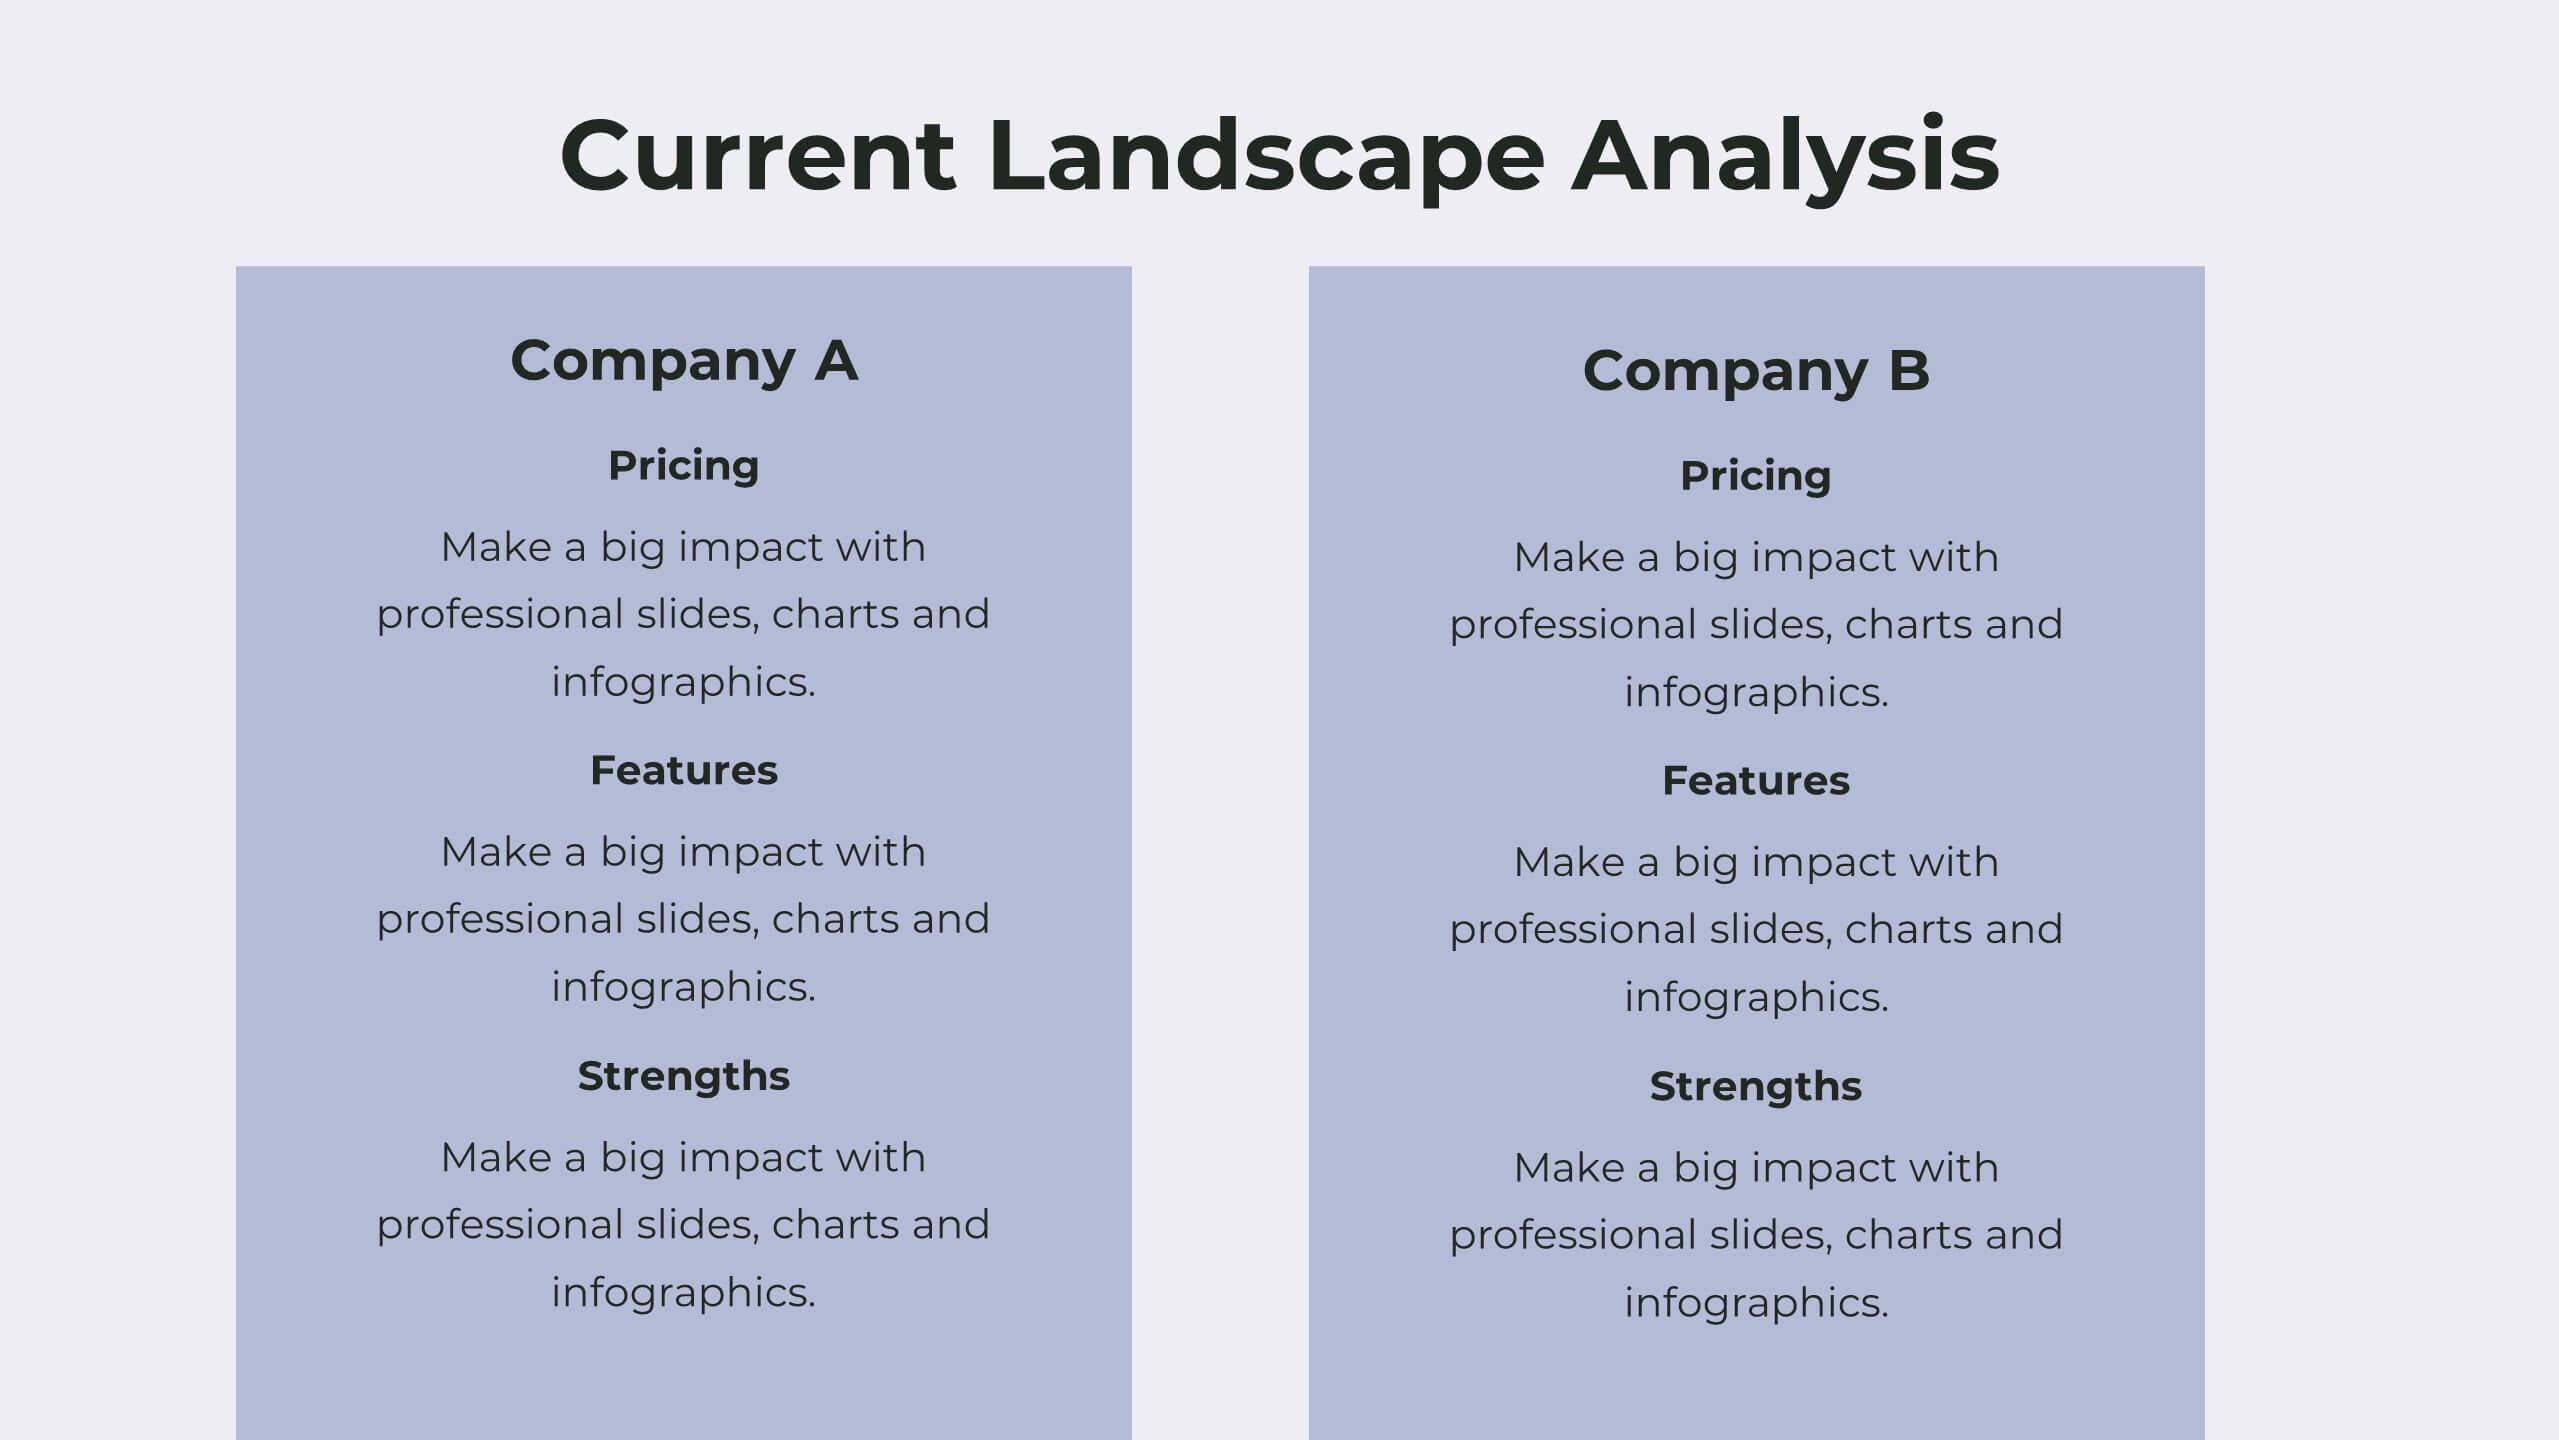
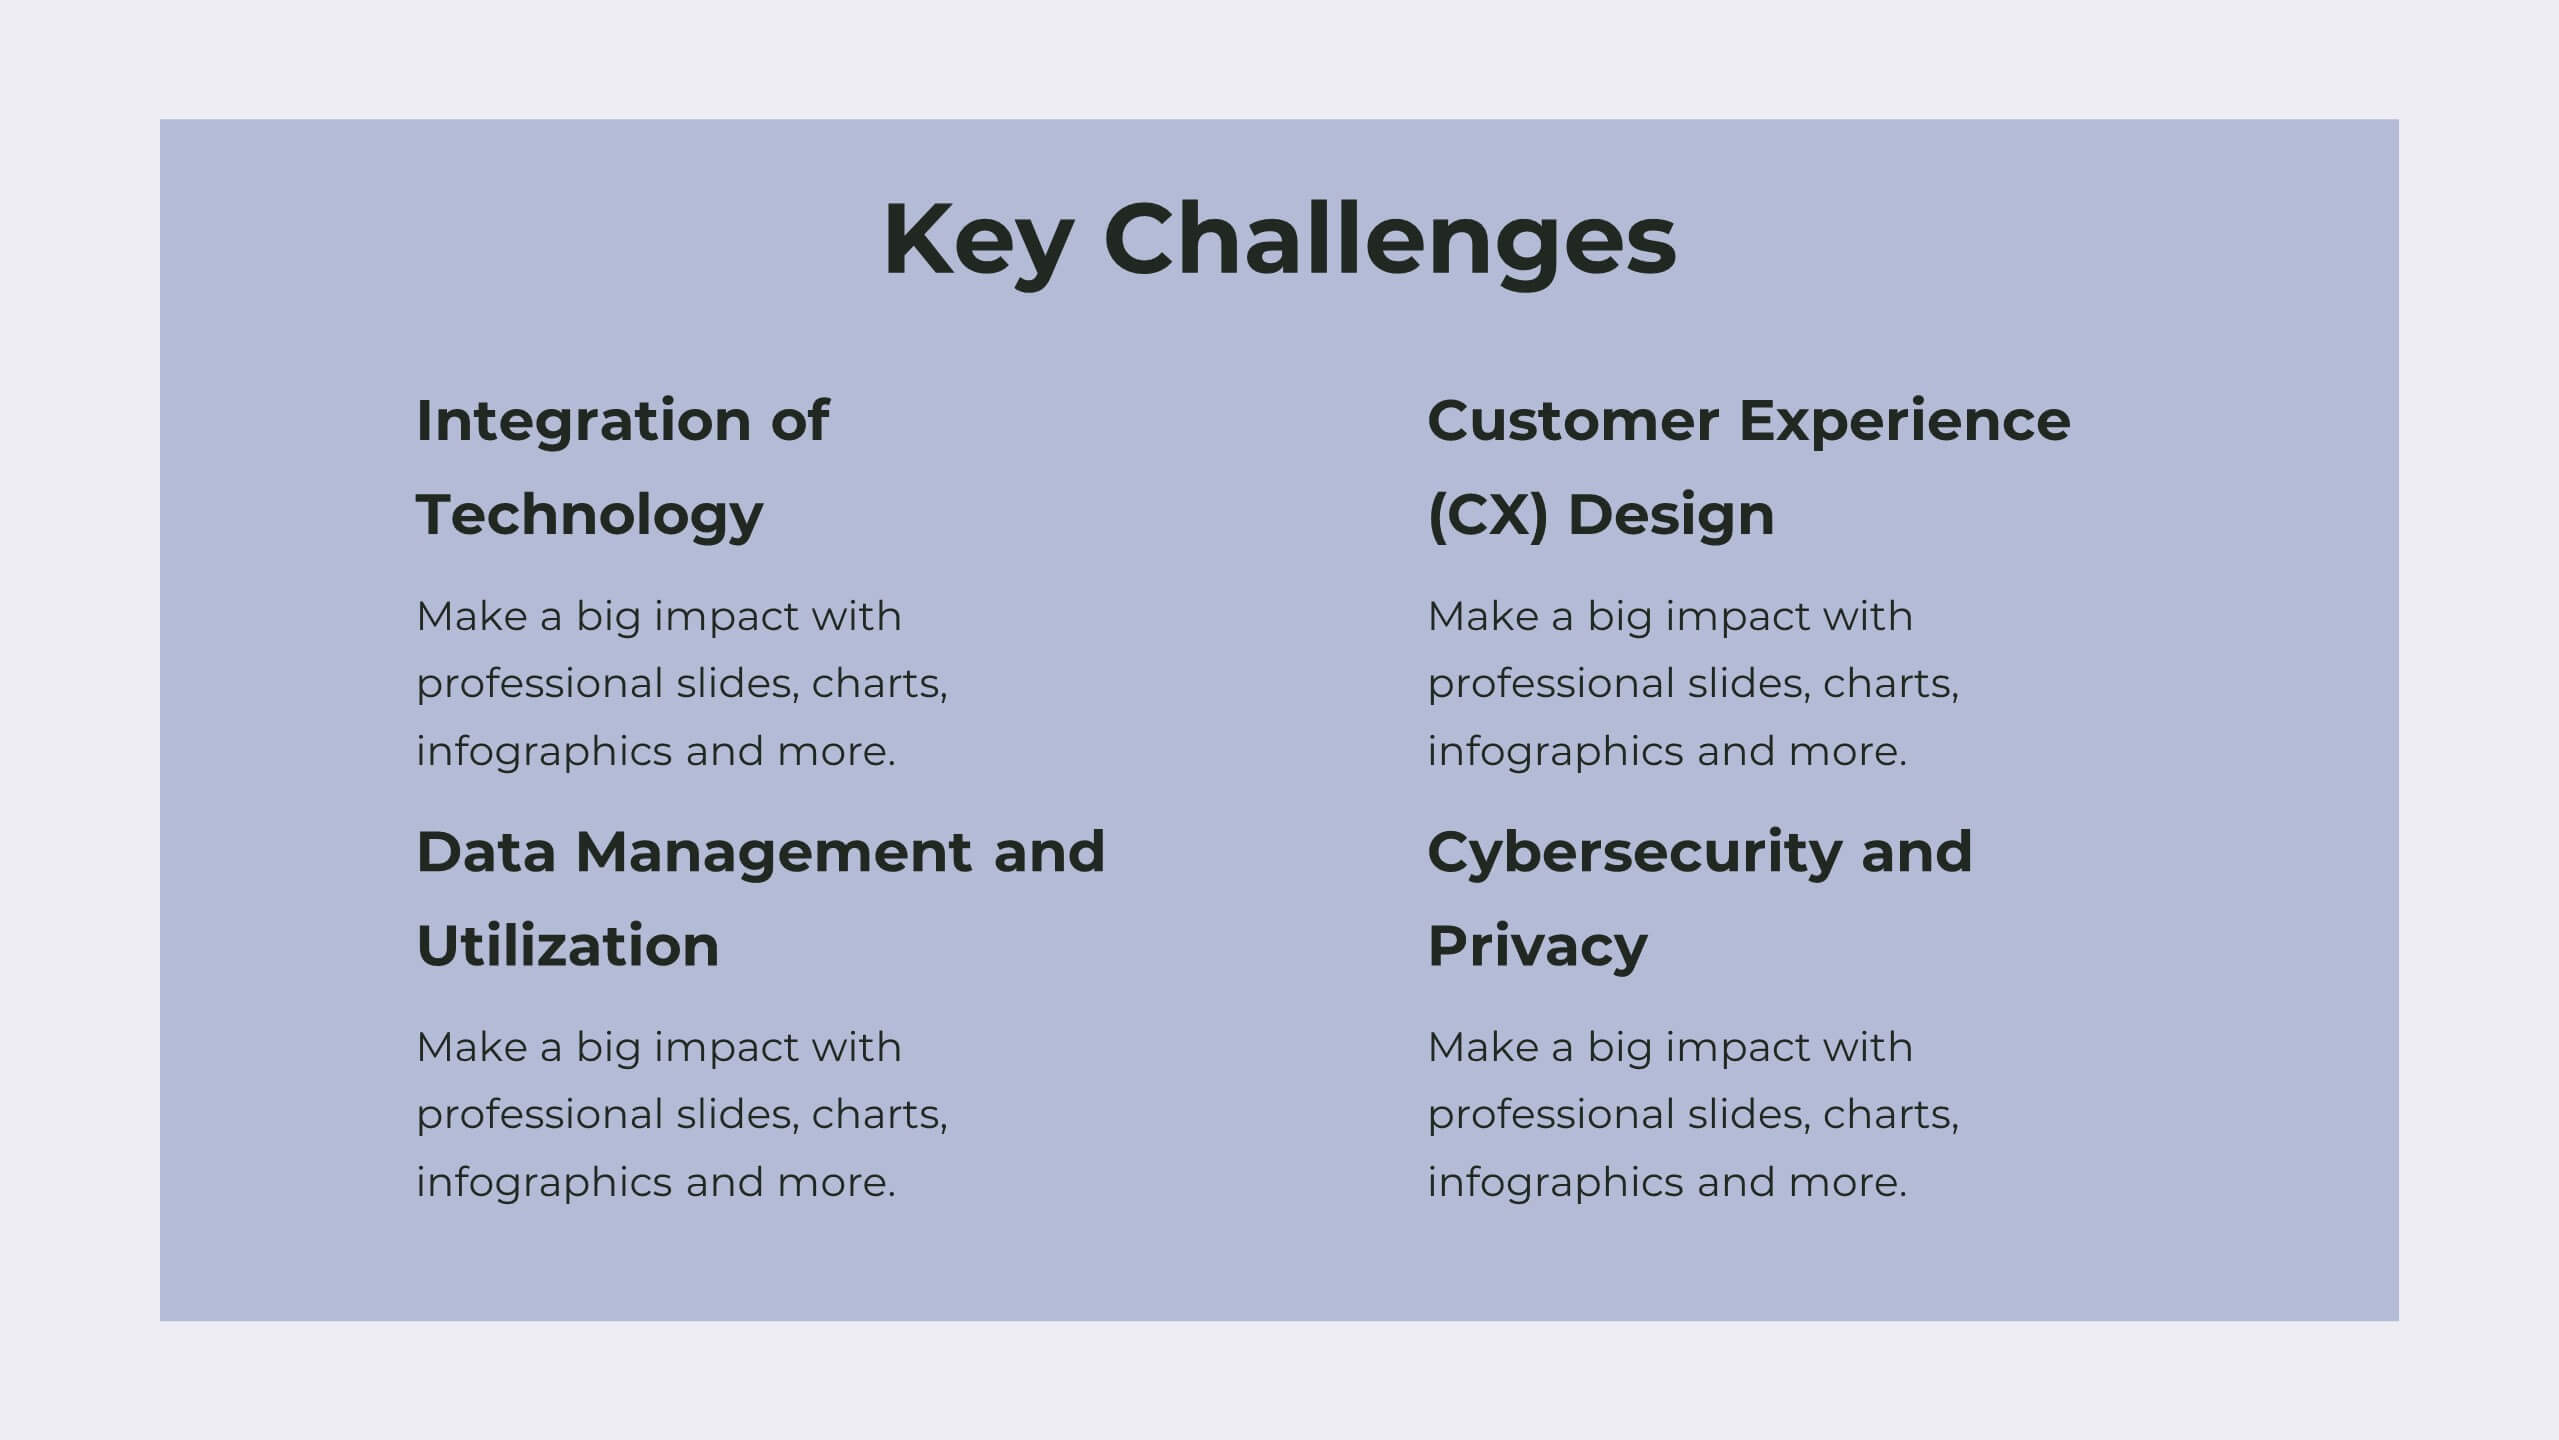
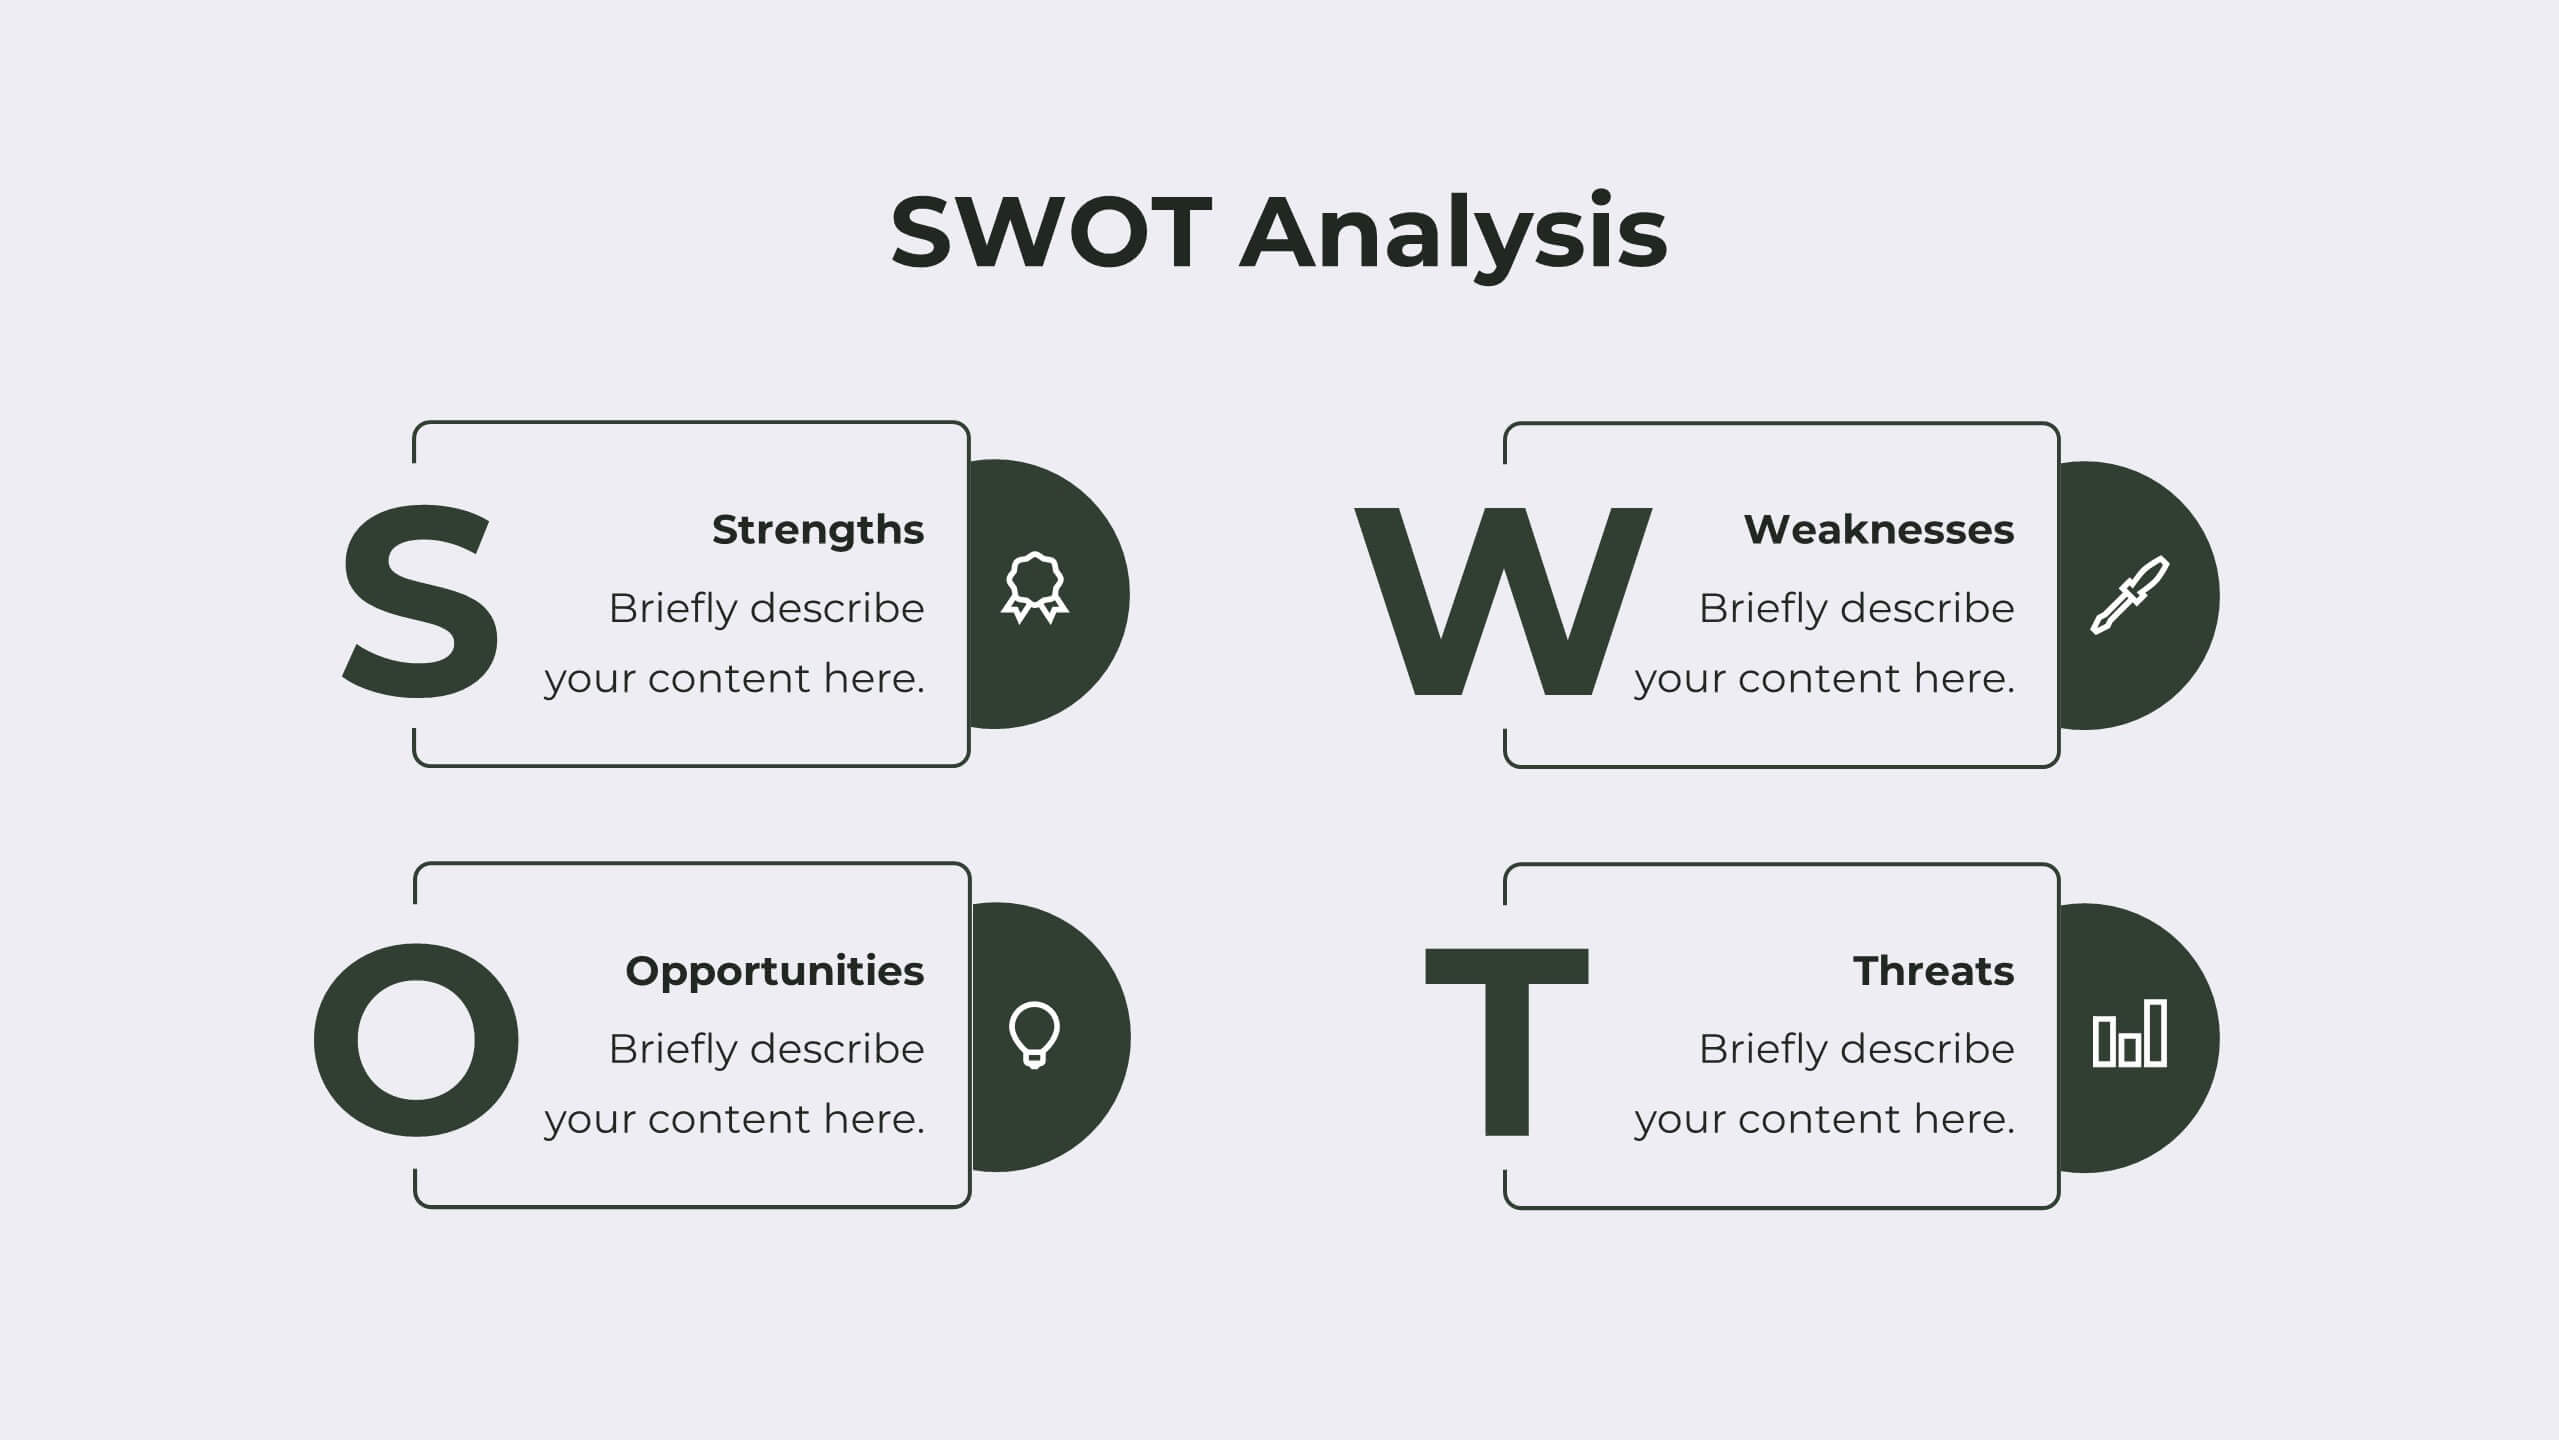
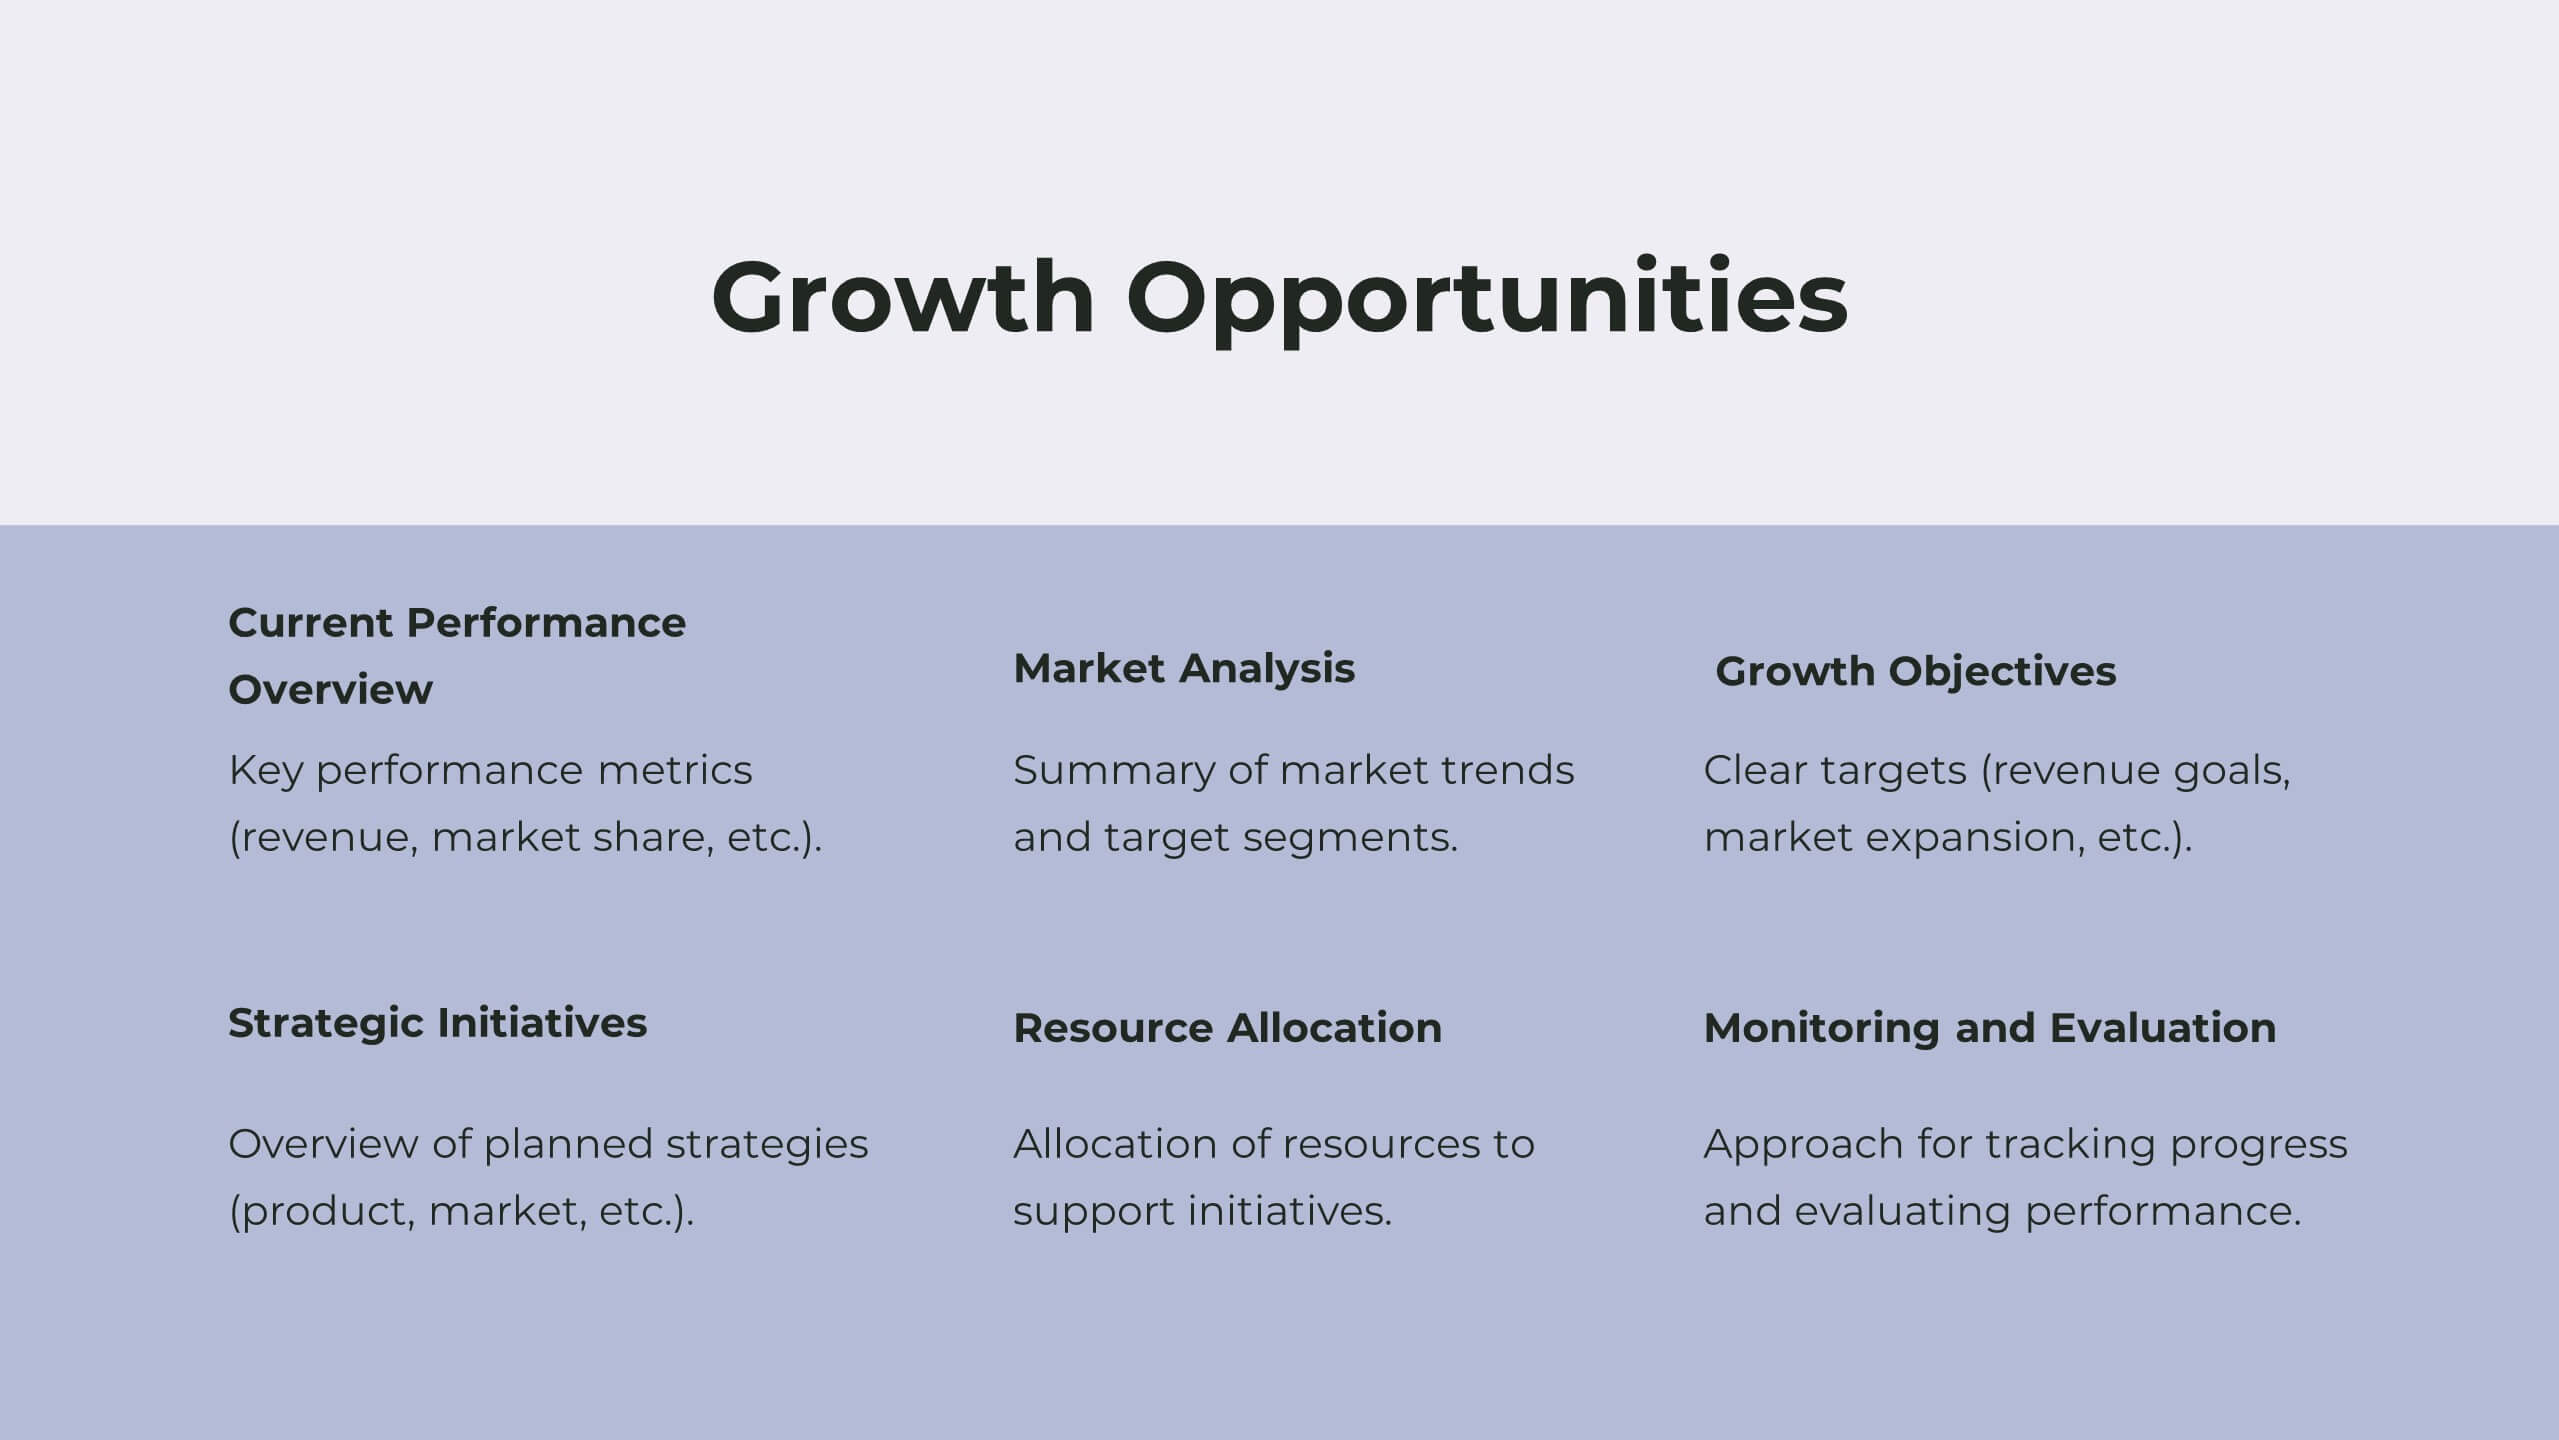
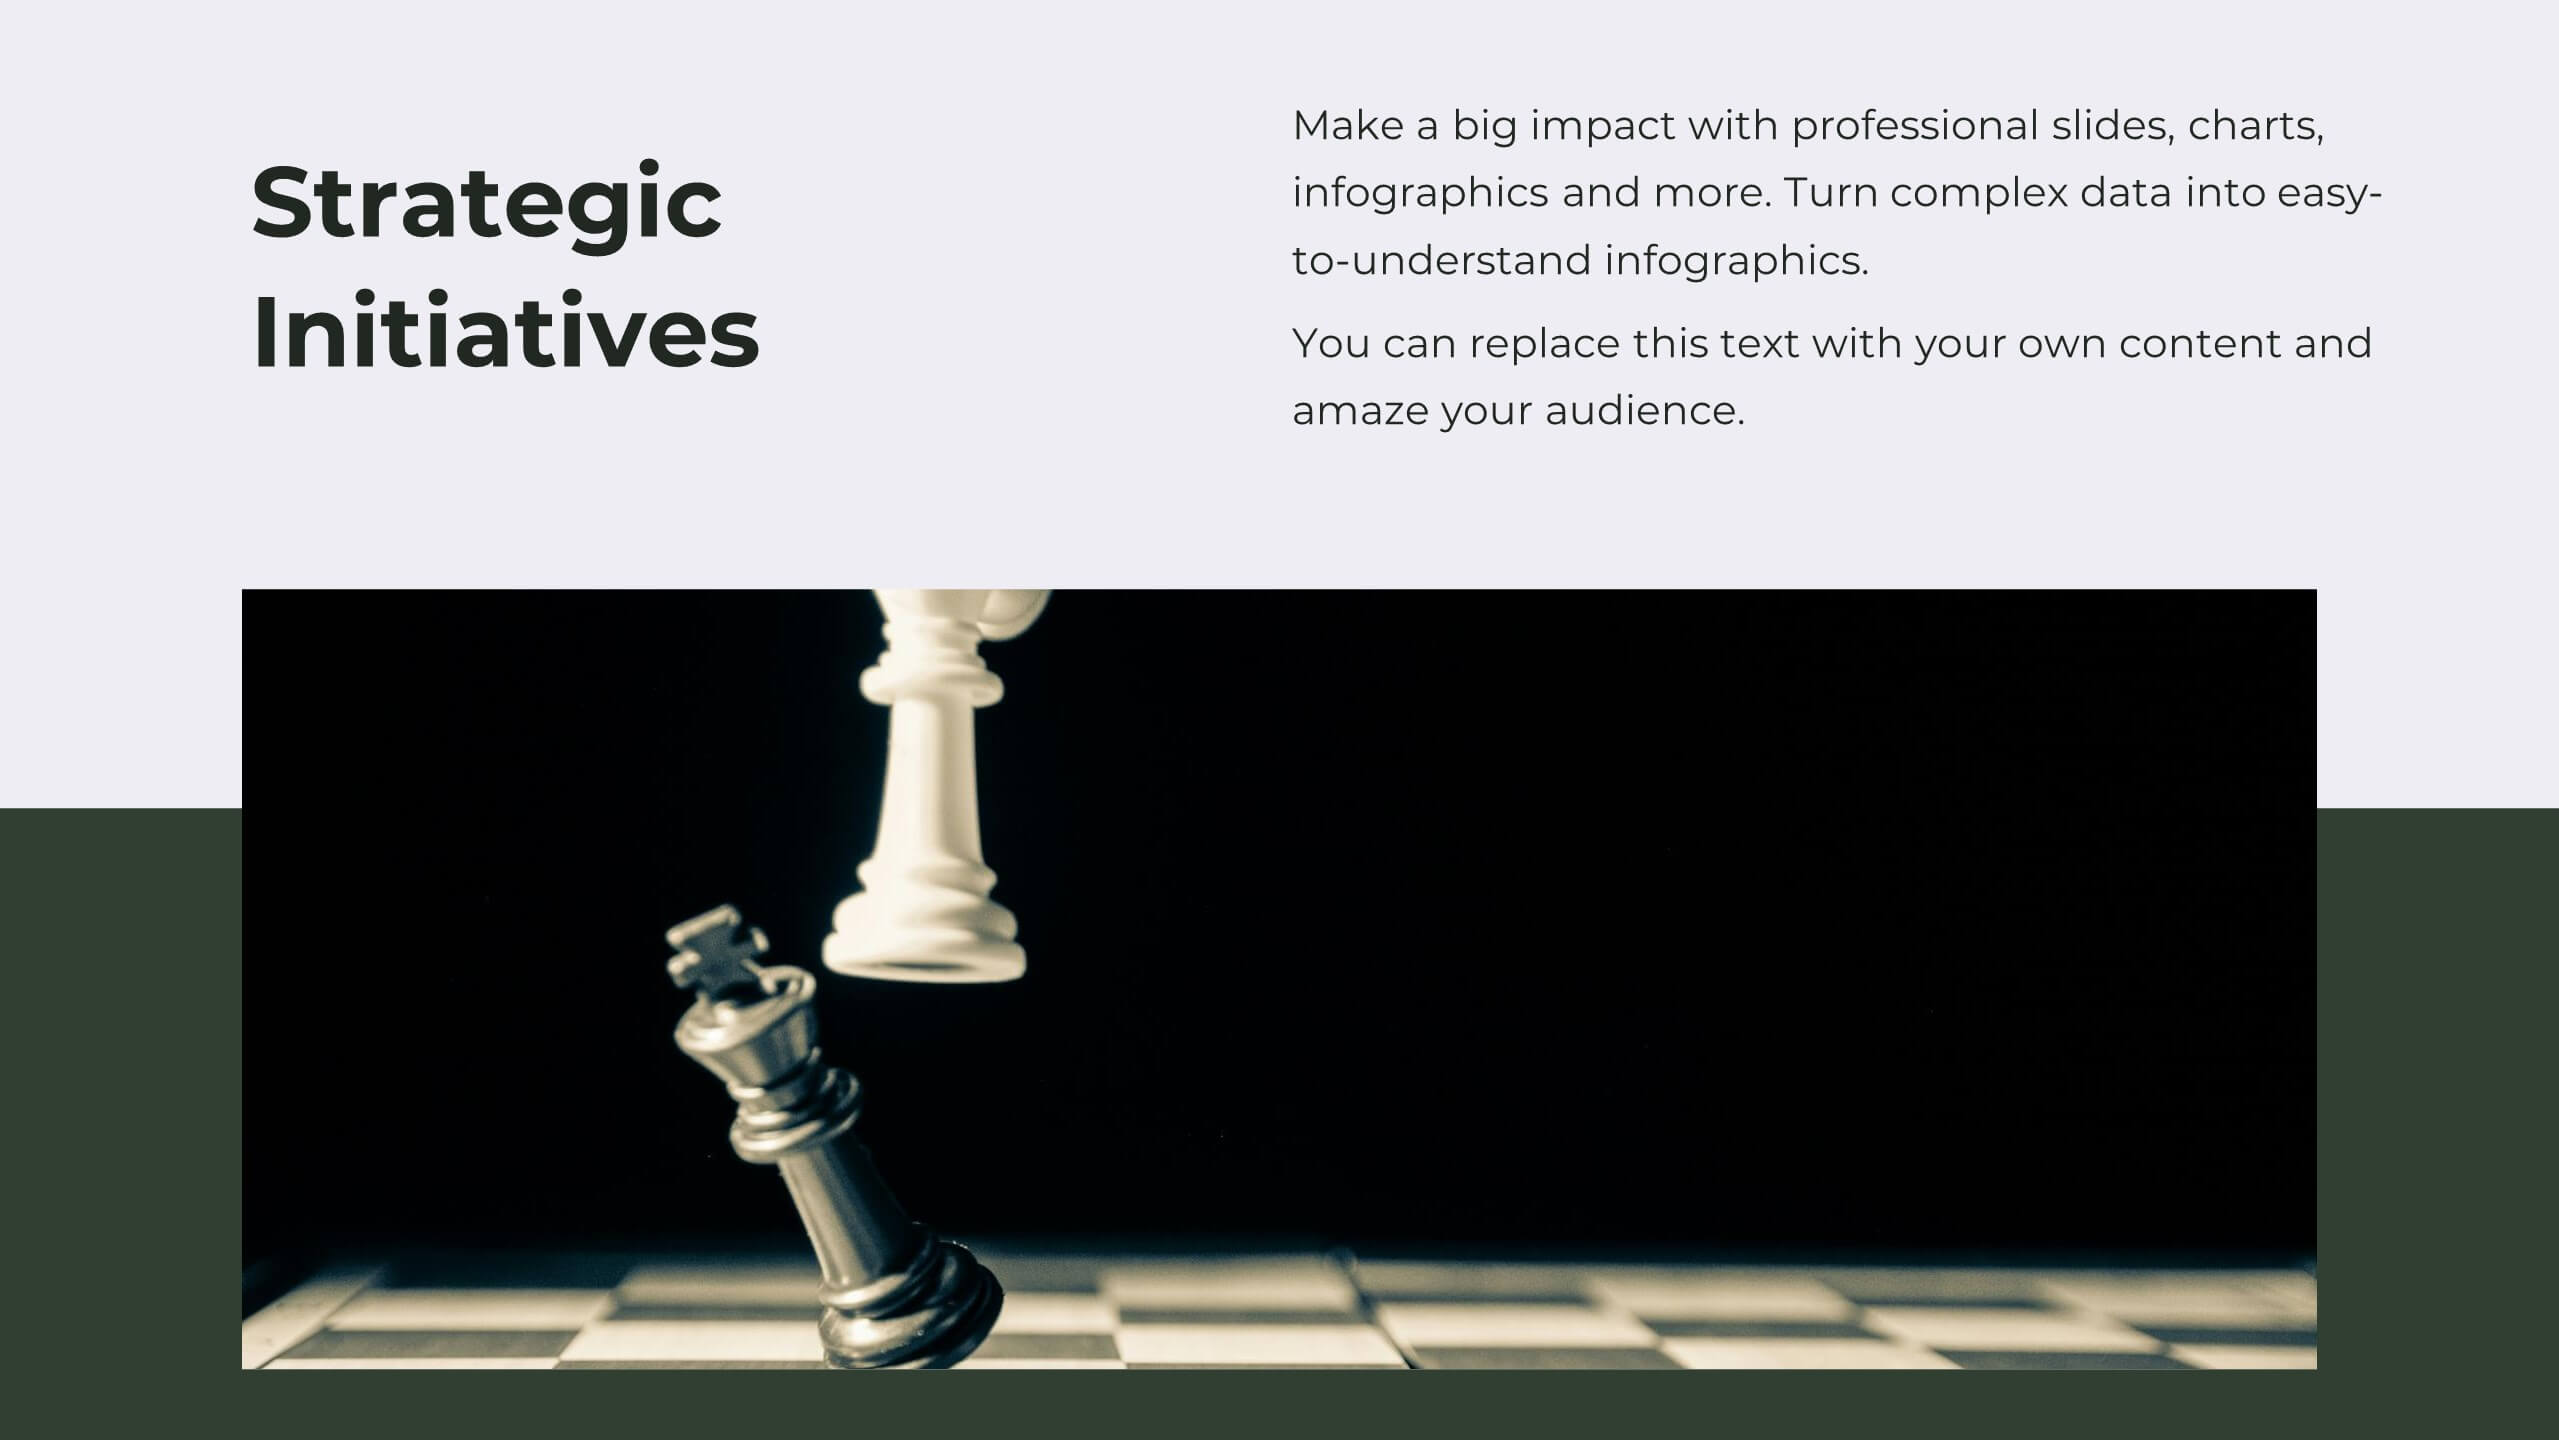
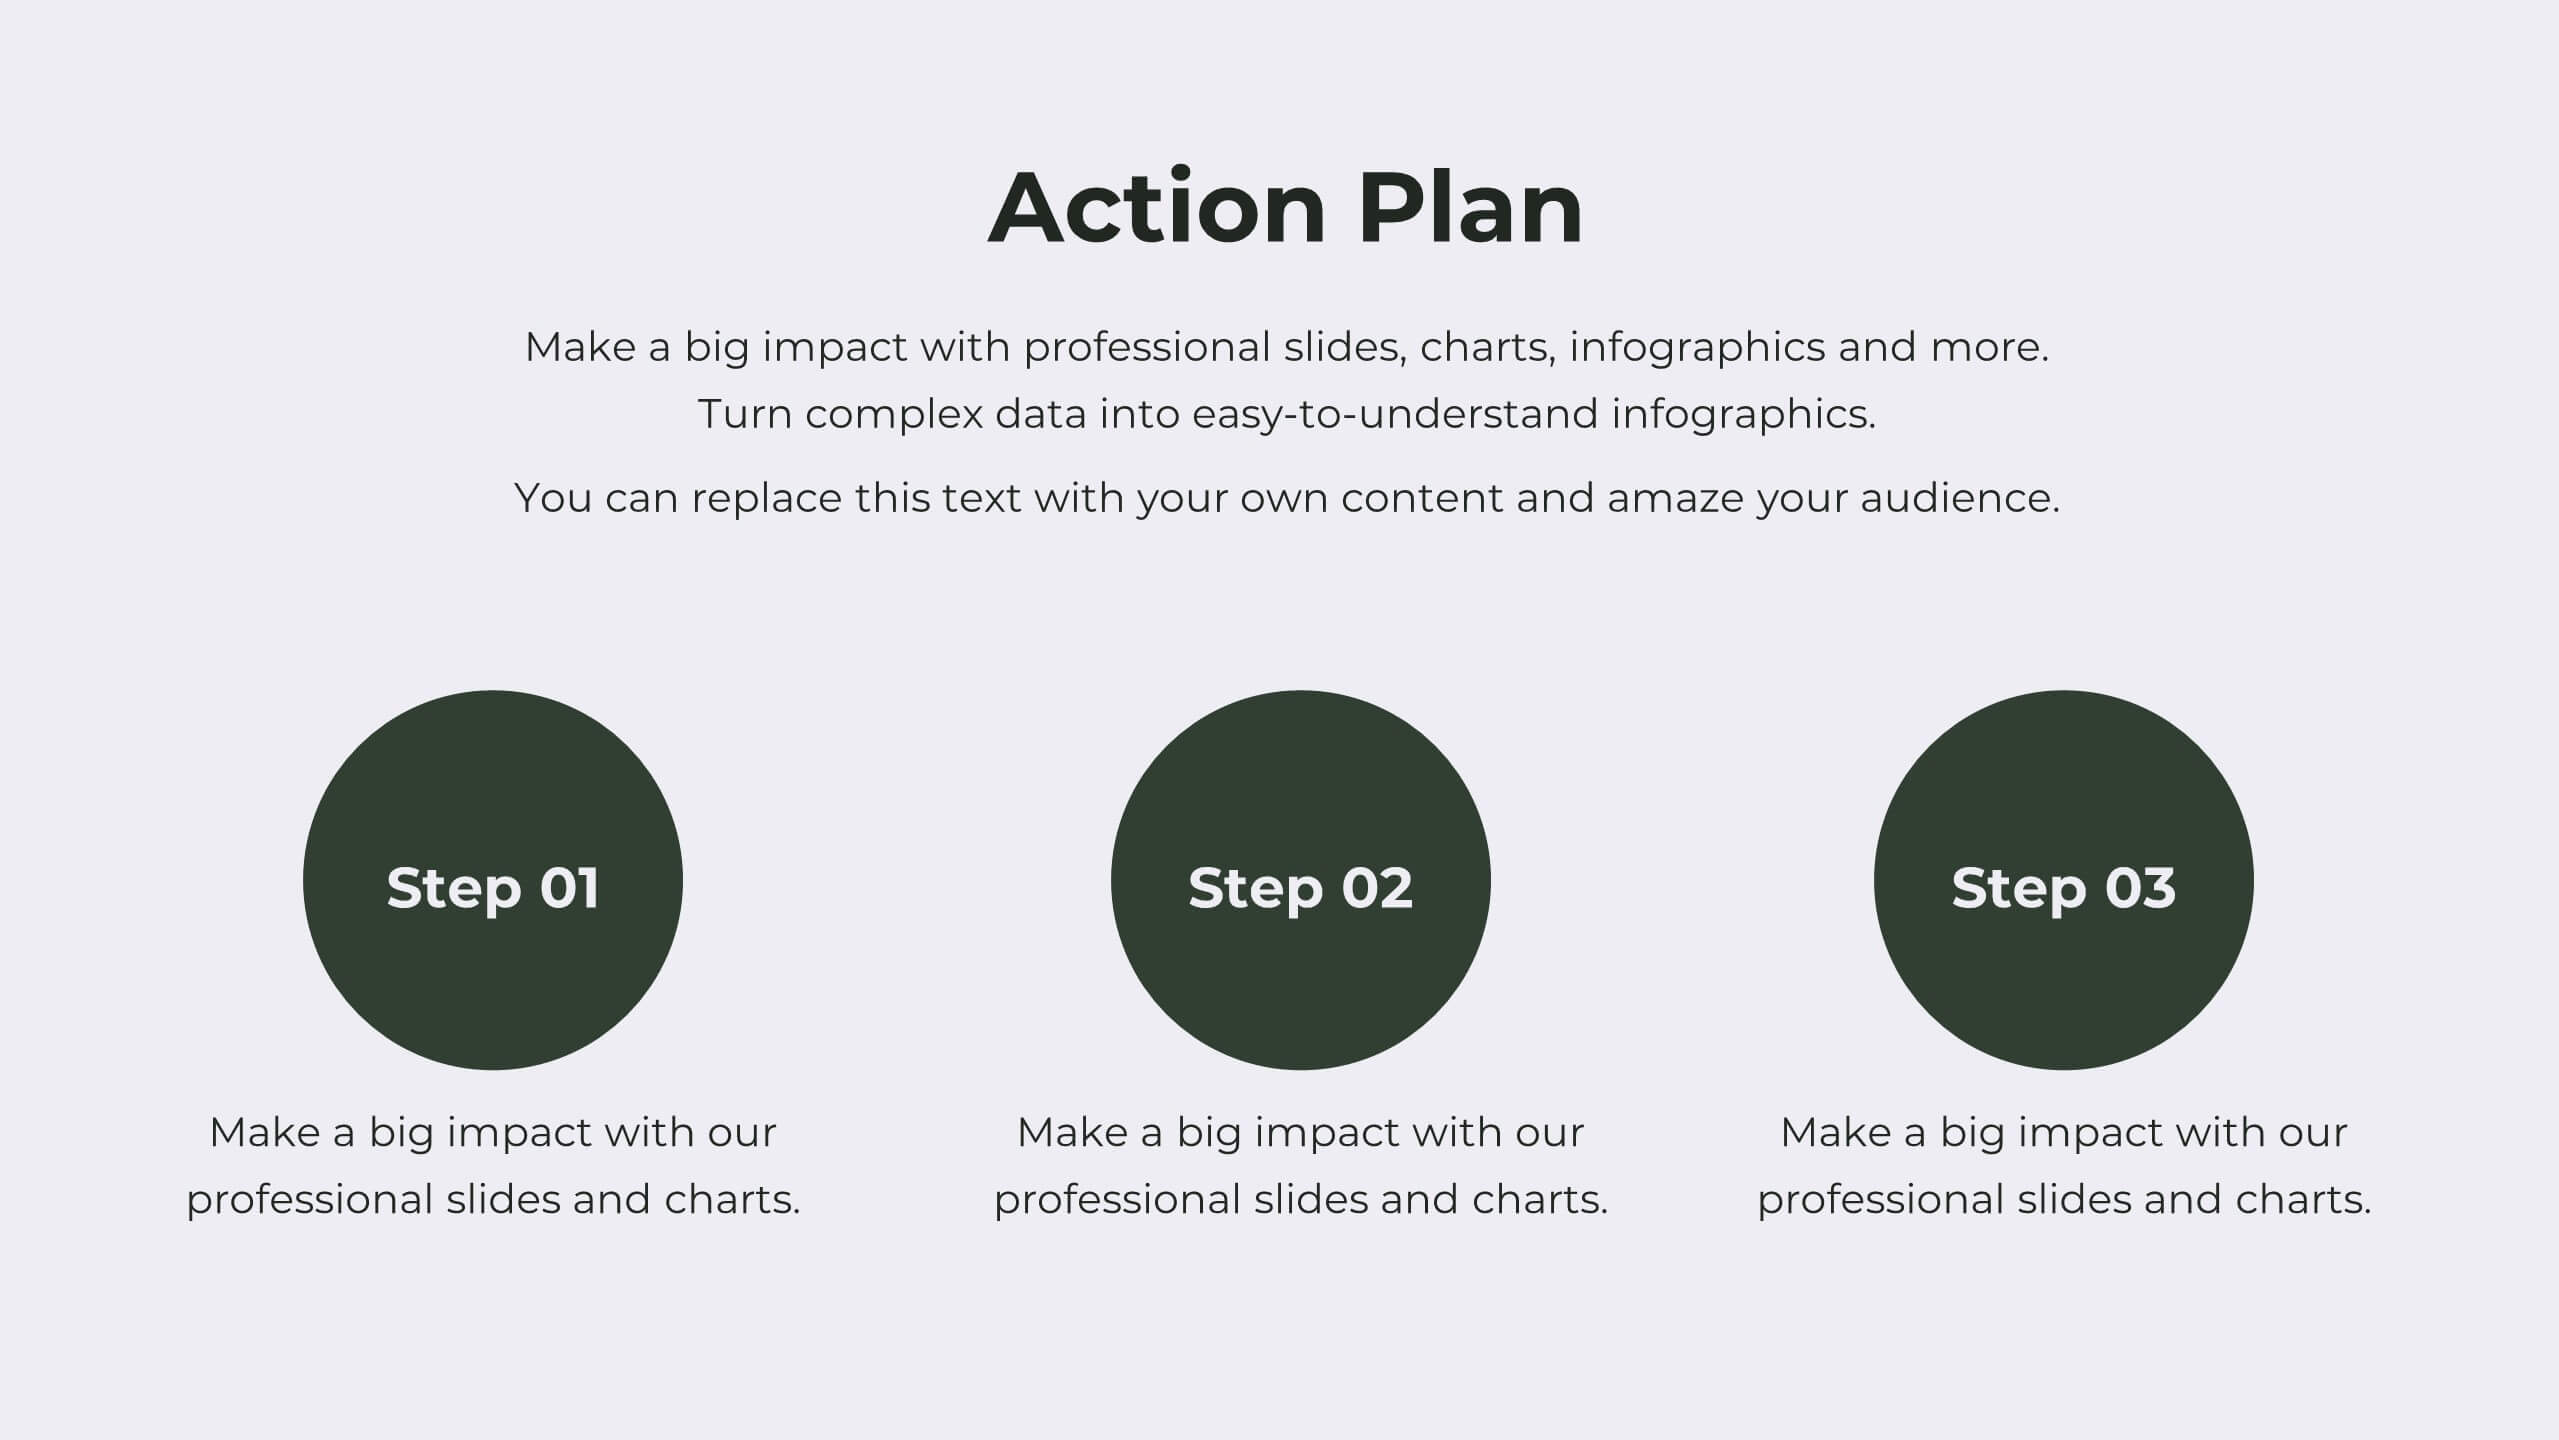
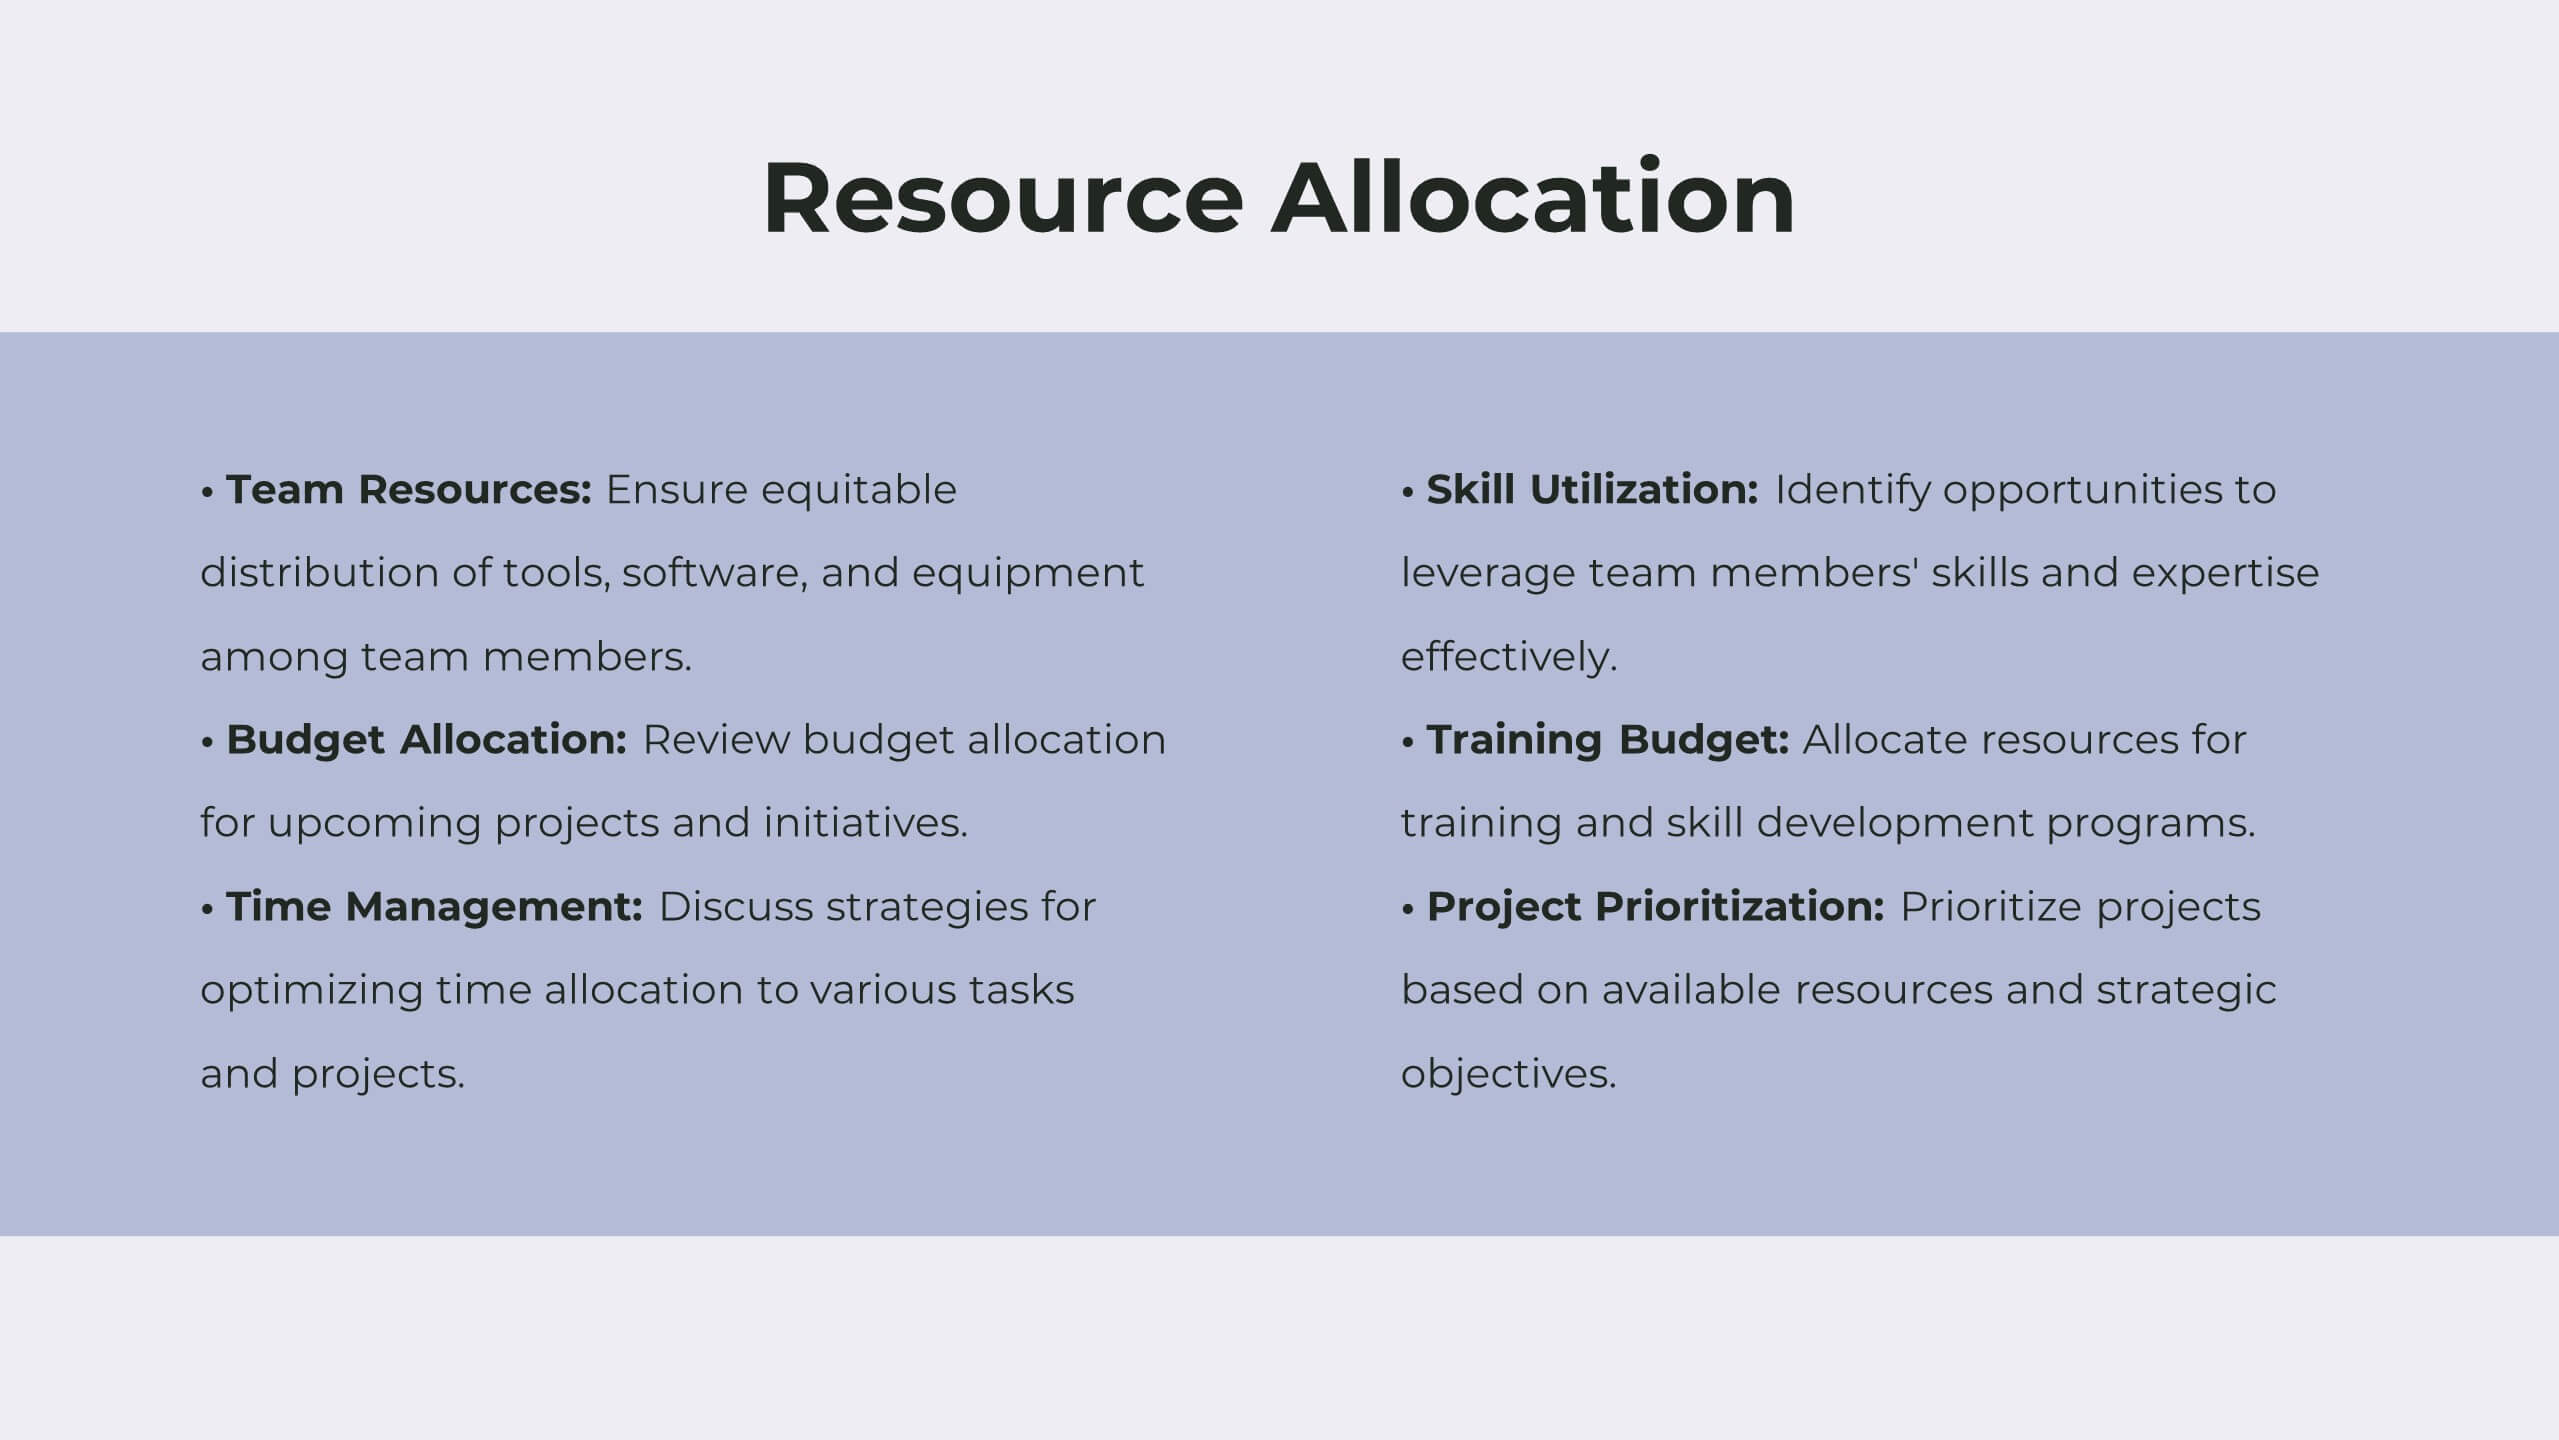
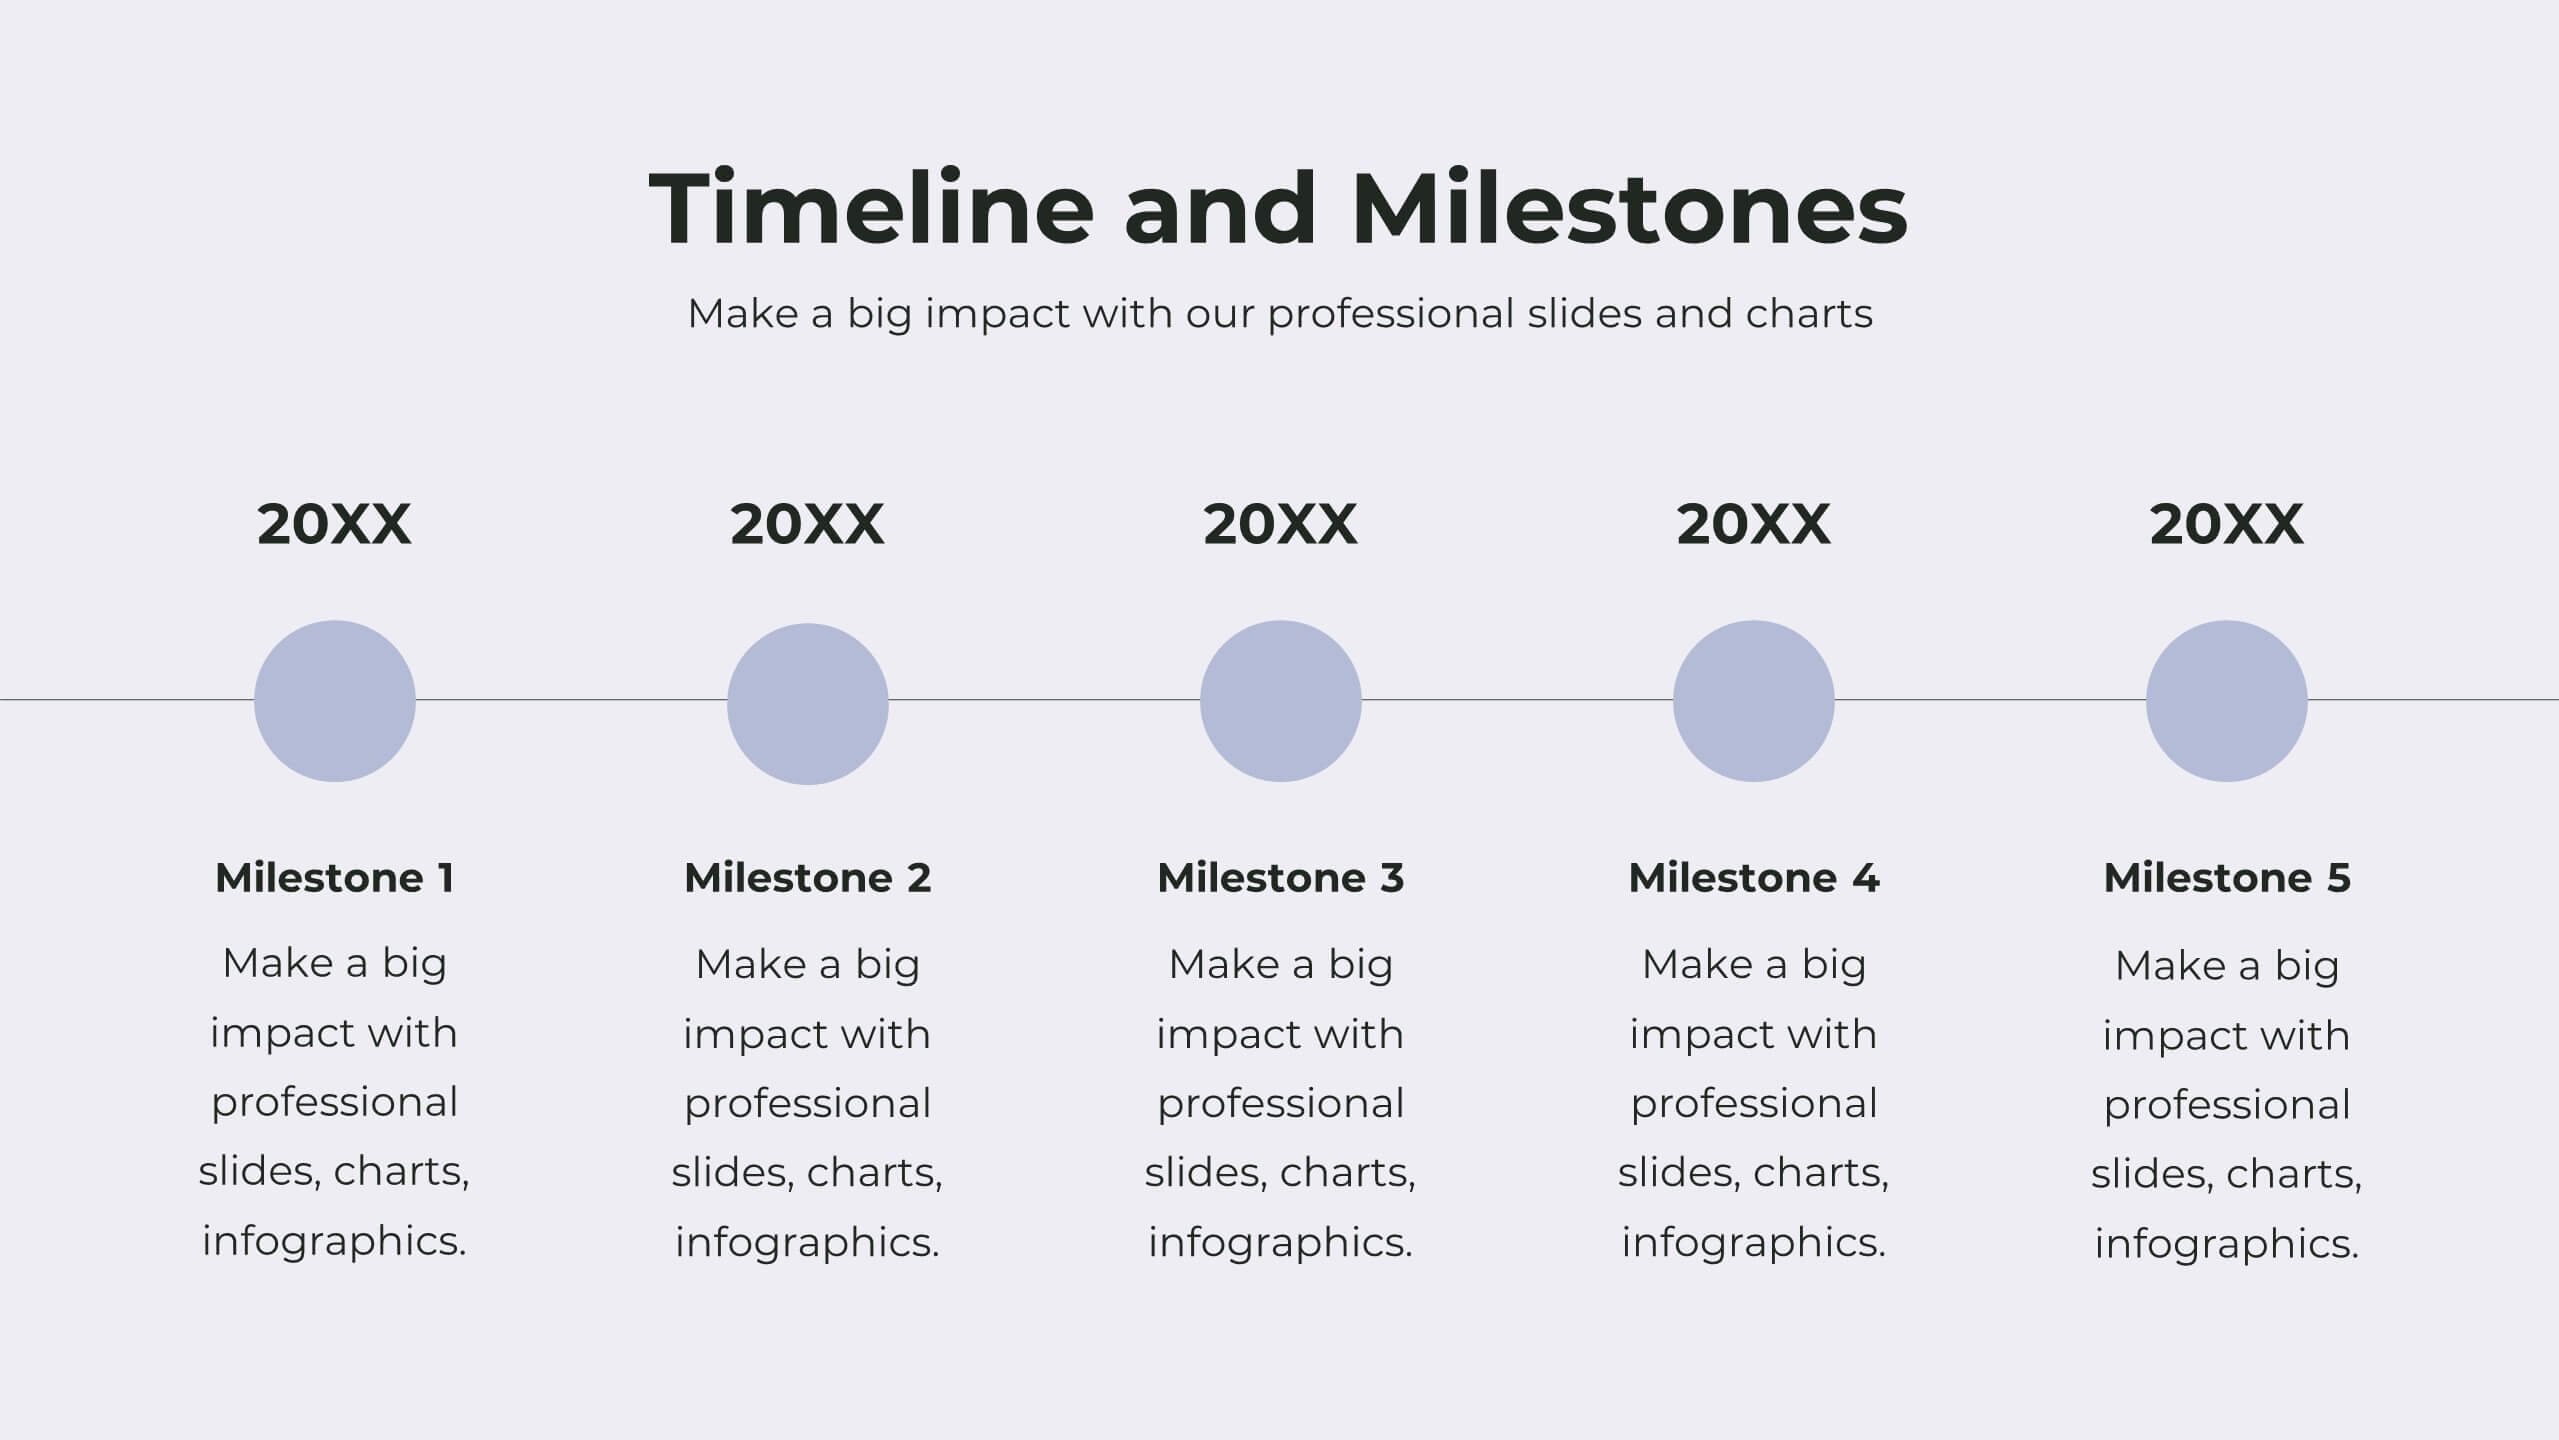
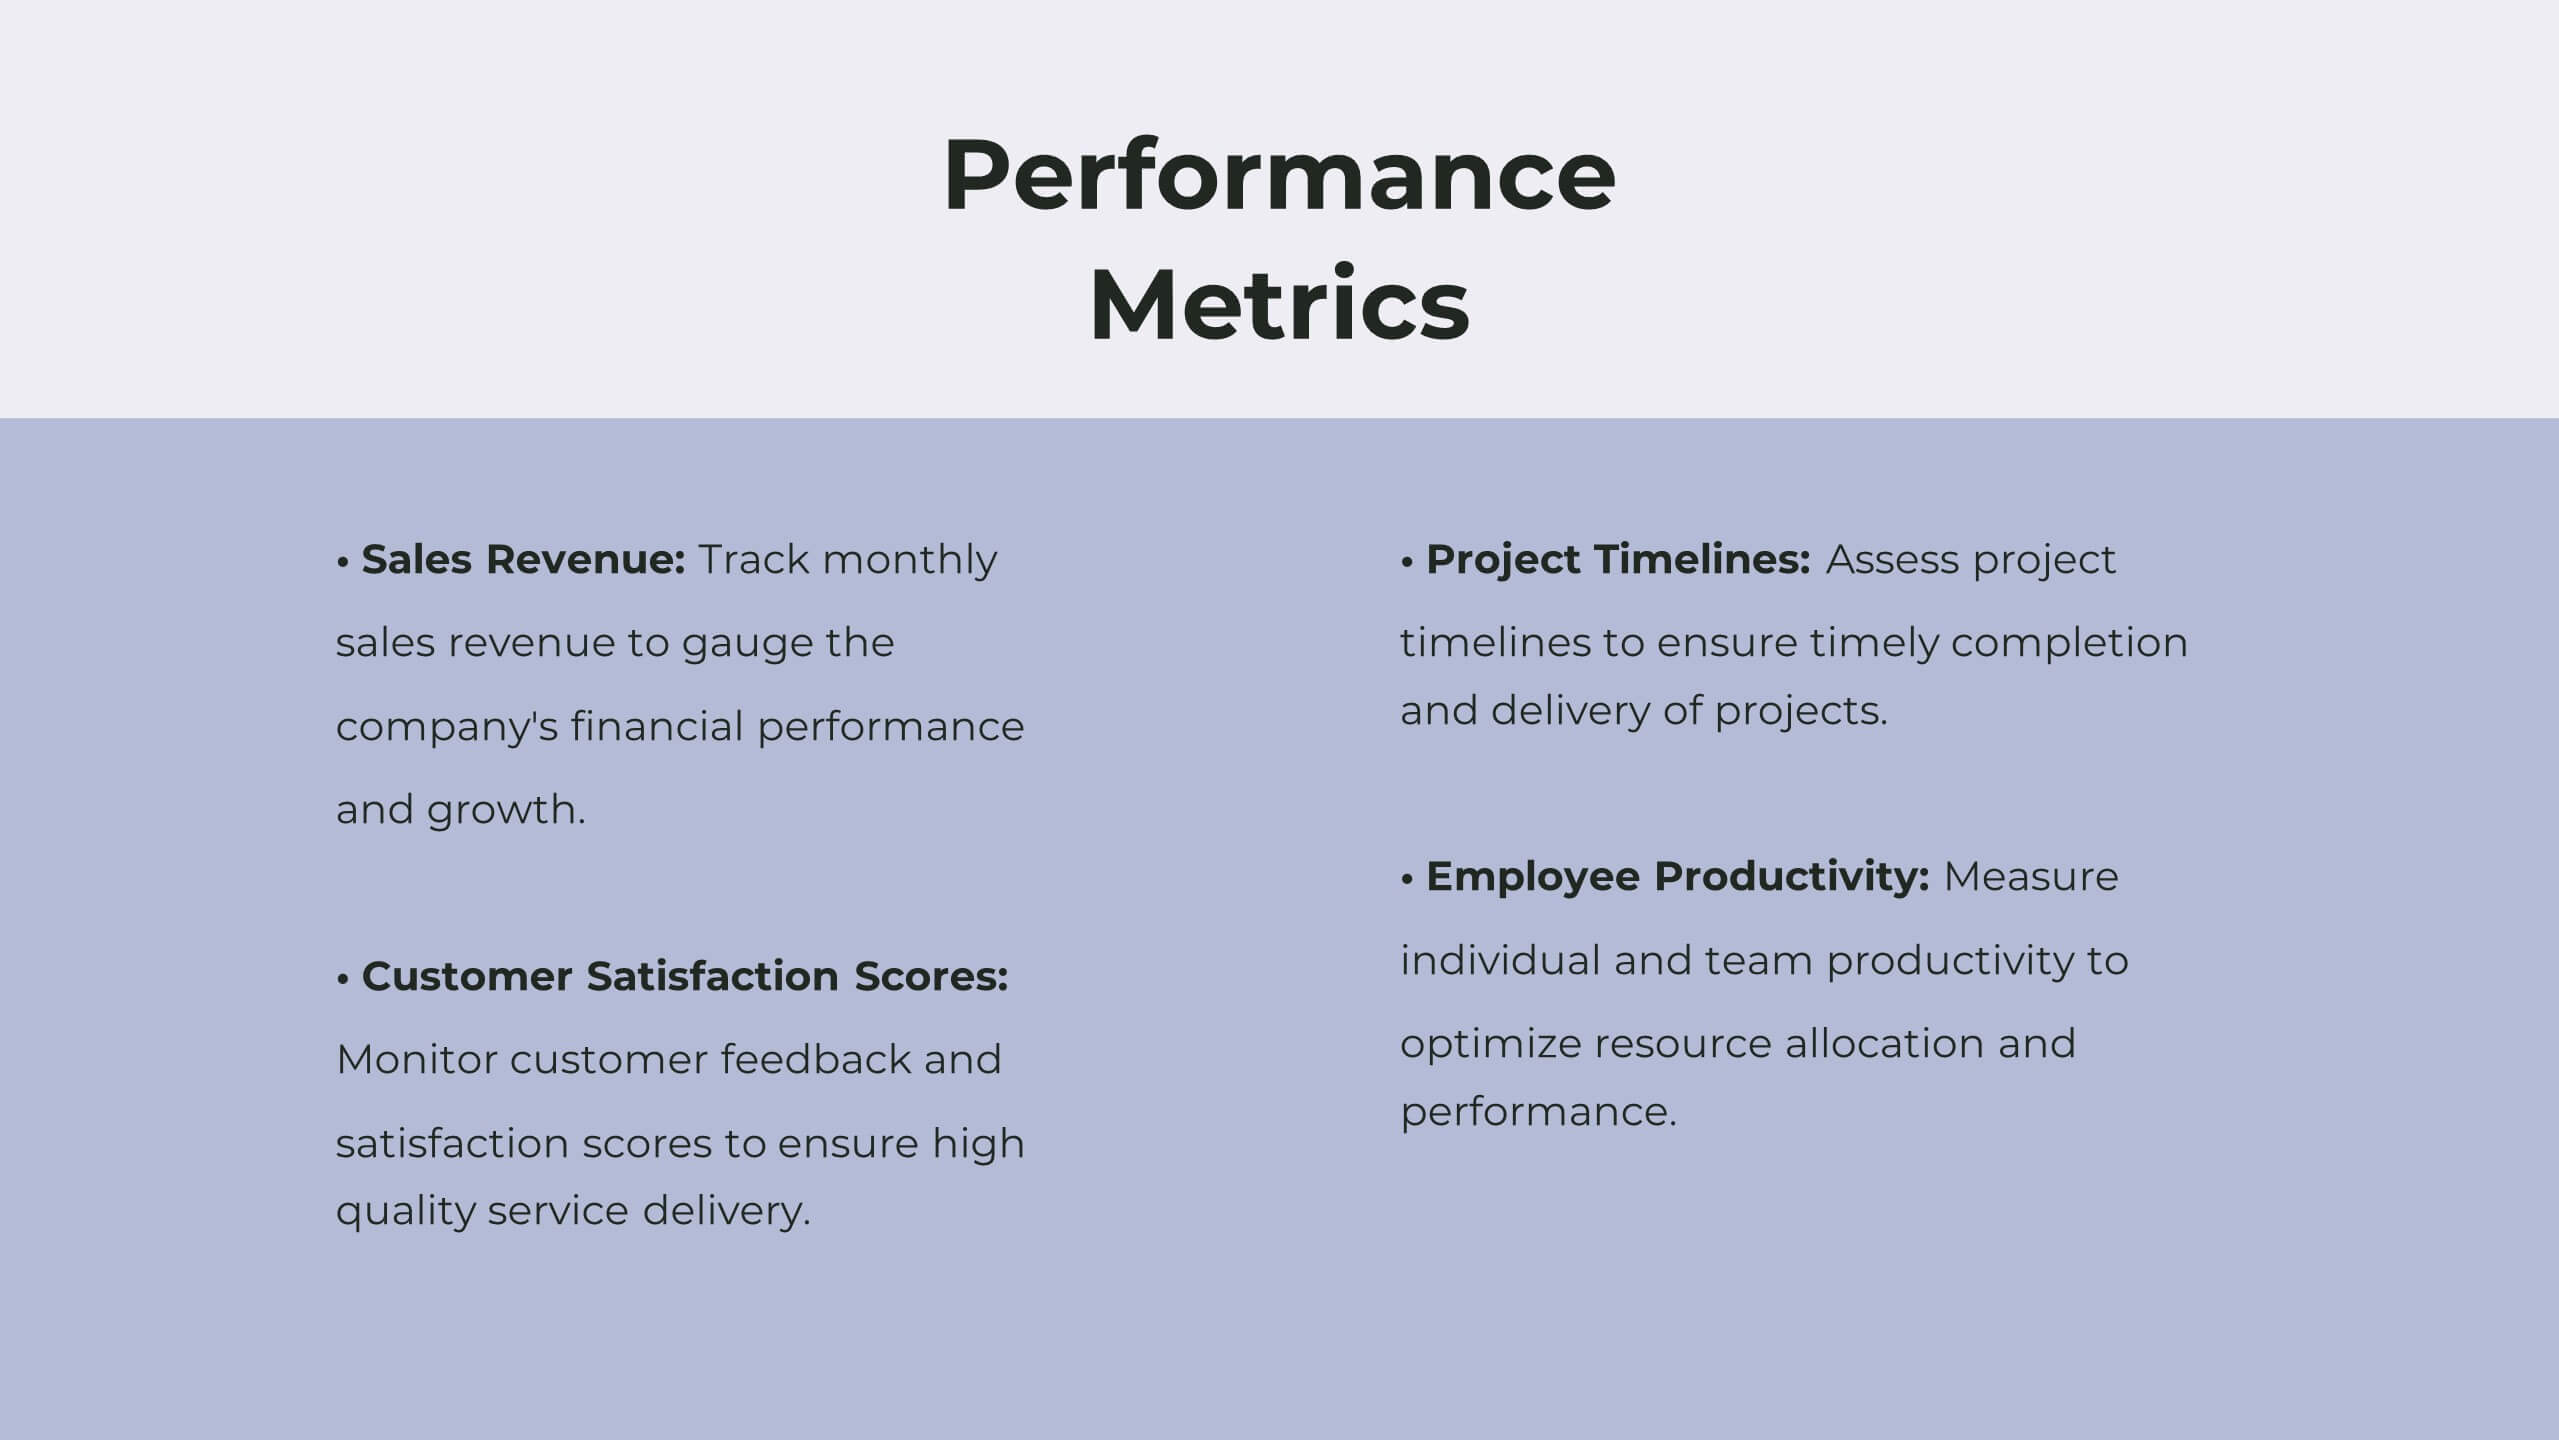
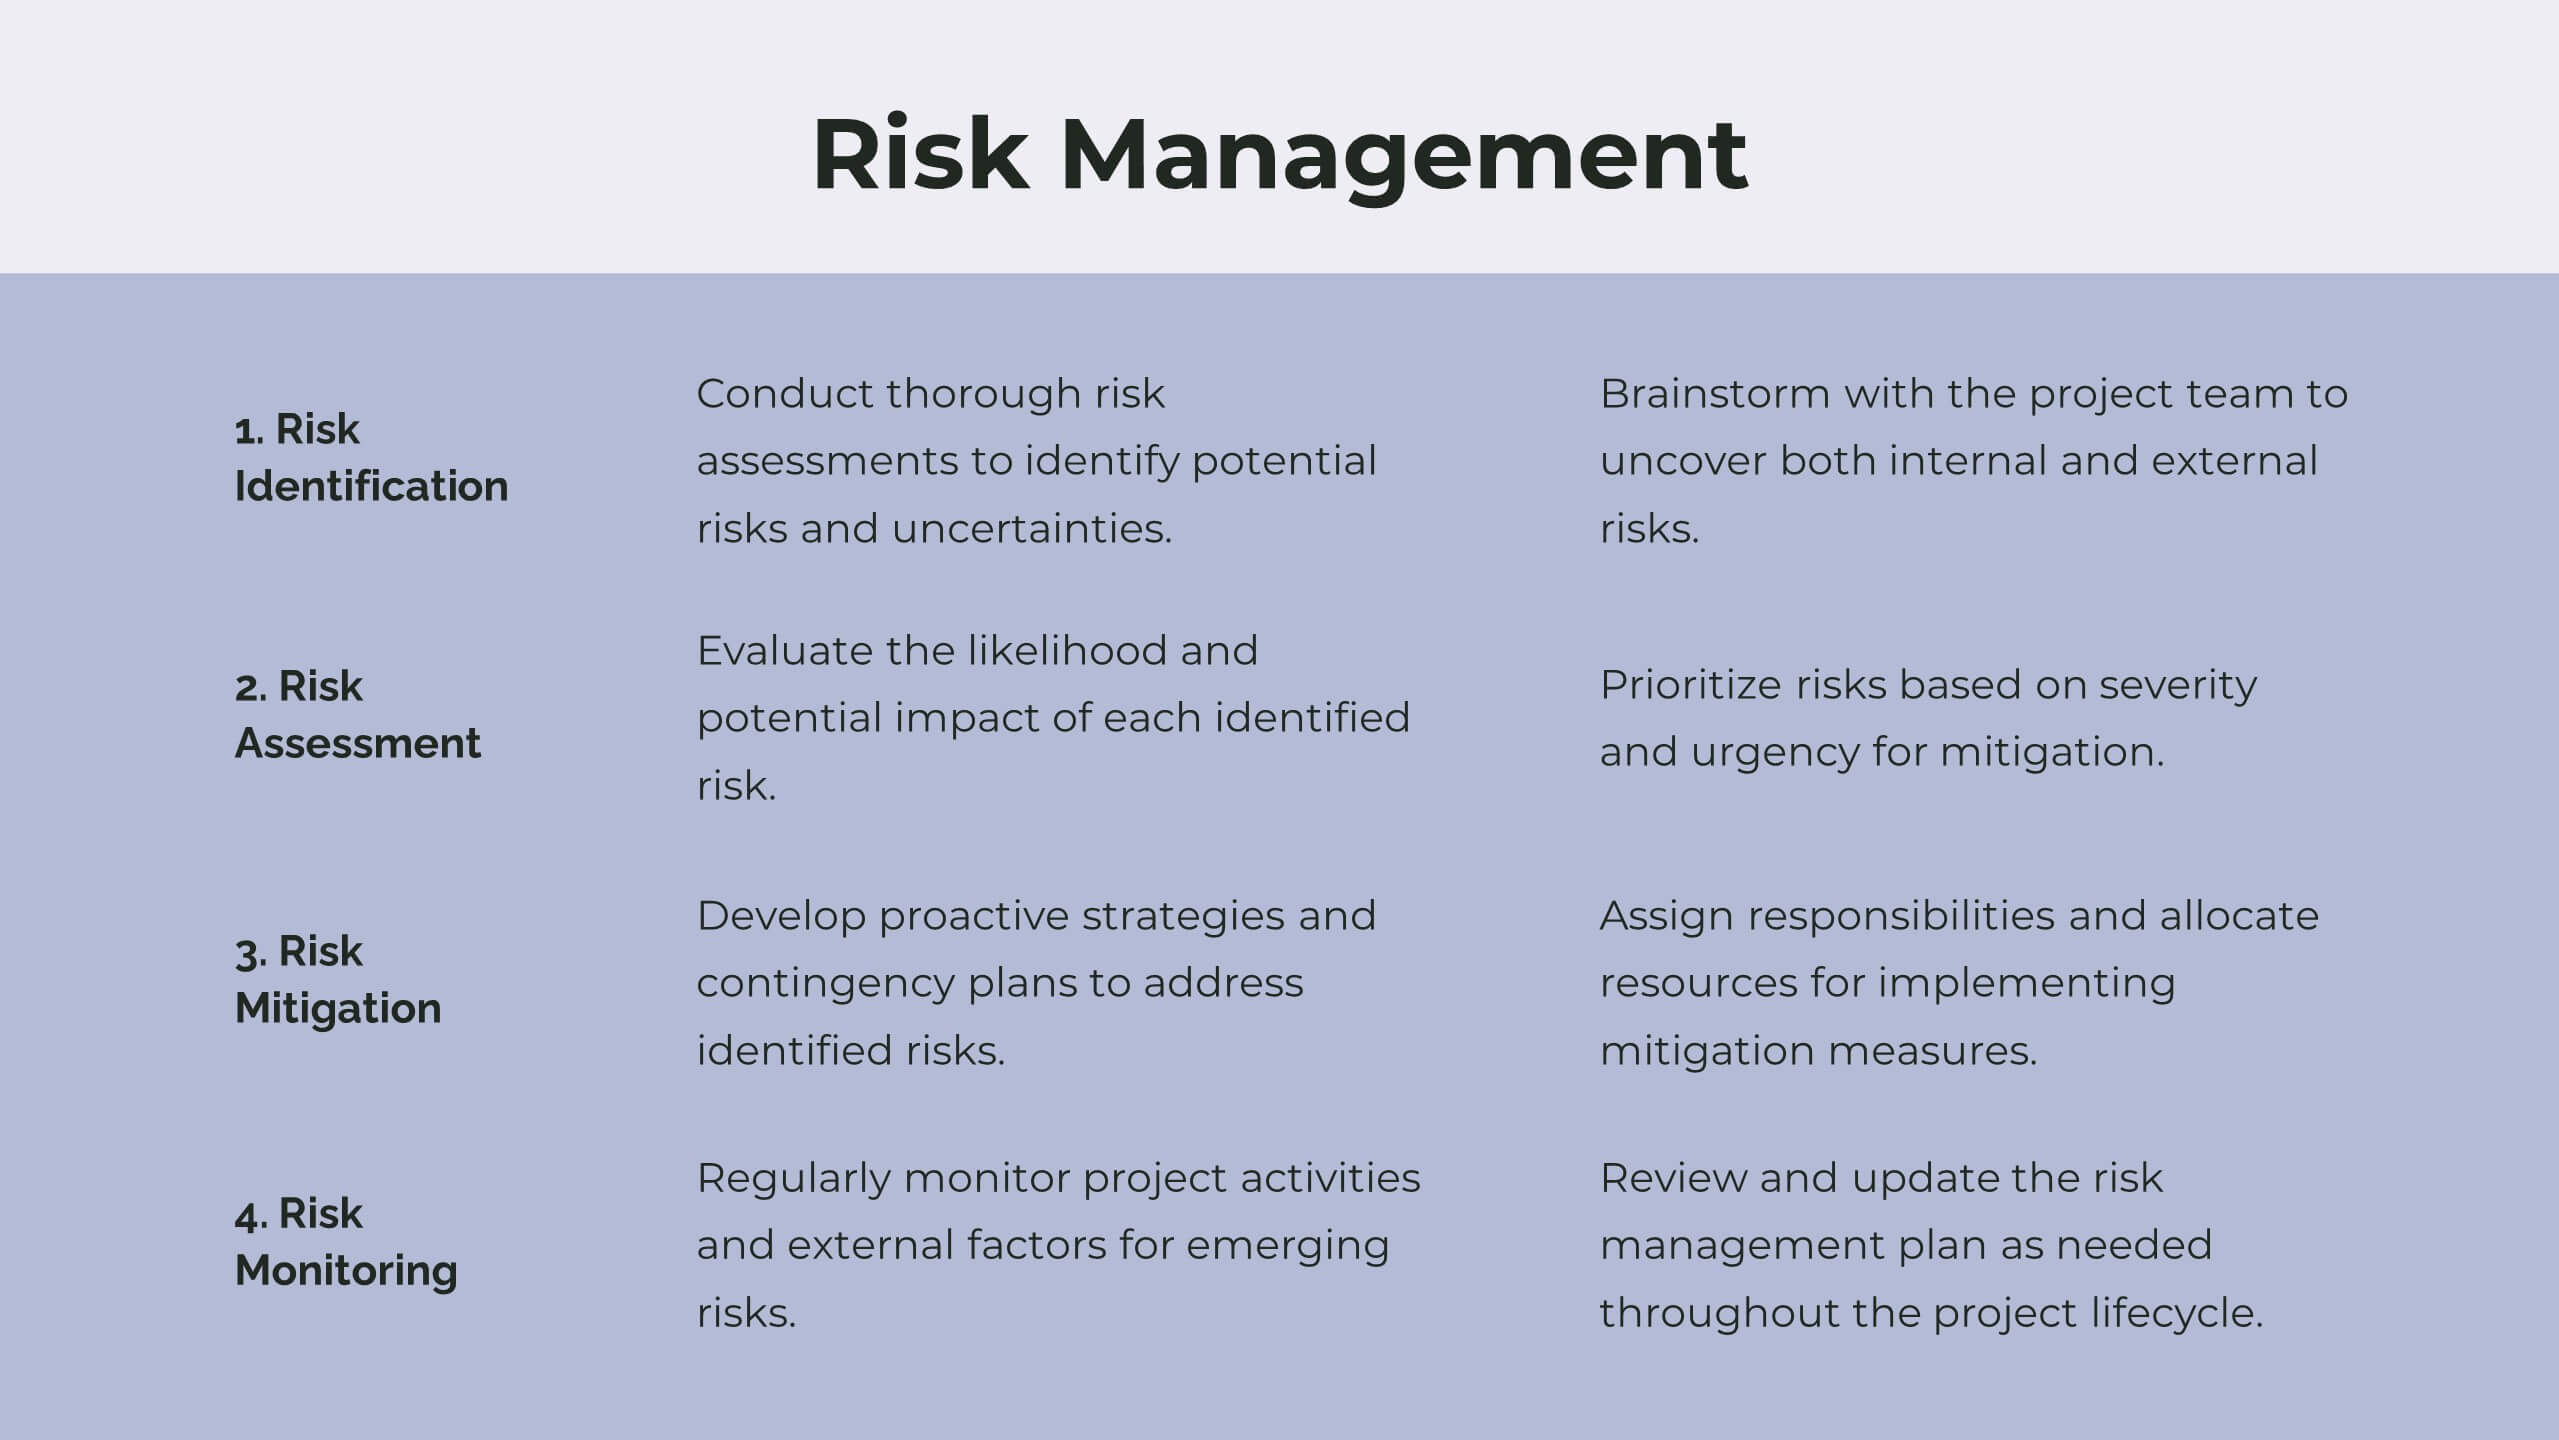
Tranquil Corporate Strategy Proposal Presentation
Drive your business forward with this elegant corporate strategy proposal template! Ideal for outlining strategic objectives, competitive analysis, and growth opportunities, it includes slides for SWOT analysis, resource allocation, and performance metrics. Impress stakeholders with clear visuals and structured content. Compatible with PowerPoint, Keynote, and Google Slides for seamless presentations on any platform.


23 diapositivas
Skycrest Business Idea Pitch Deck Presentation
Present your innovative business idea with this bold pitch deck, featuring sections for problem statement, solution, business model, and financial projections. Ideal for capturing investor attention, this template supports PowerPoint, Keynote, and Google Slides, making it perfect for impactful presentations across multiple platforms.


20 diapositivas
Lullabyne Design Portfolio Presentation
Showcase your creative work with this modern and professional design portfolio presentation. Covering essential elements like design briefs, mood boards, prototypes, and implementation plans, this template helps you present your work with clarity and style. Fully customizable and available for PowerPoint, Keynote, and Google Slides.


7 diapositivas
Real Estate Infographic Presentation Template
Real estate is a form of property that can be used for residential, commercial or industrial purposes, and typically includes any resources on the land such as water or minerals. This template is especially useful for real estate agents and brokers who can use it to better understand the real estate industry. This template comes with Infographics that are a great way to explain complex ideas and trends in a simple, easy-to-understand way, and can help your clients better understand as well. This template displays data visually, which will allow your audience to grasp complex ideas quickly.