


Características


¿Tienes alguna pregunta?
Recomendar


21 diapositivas
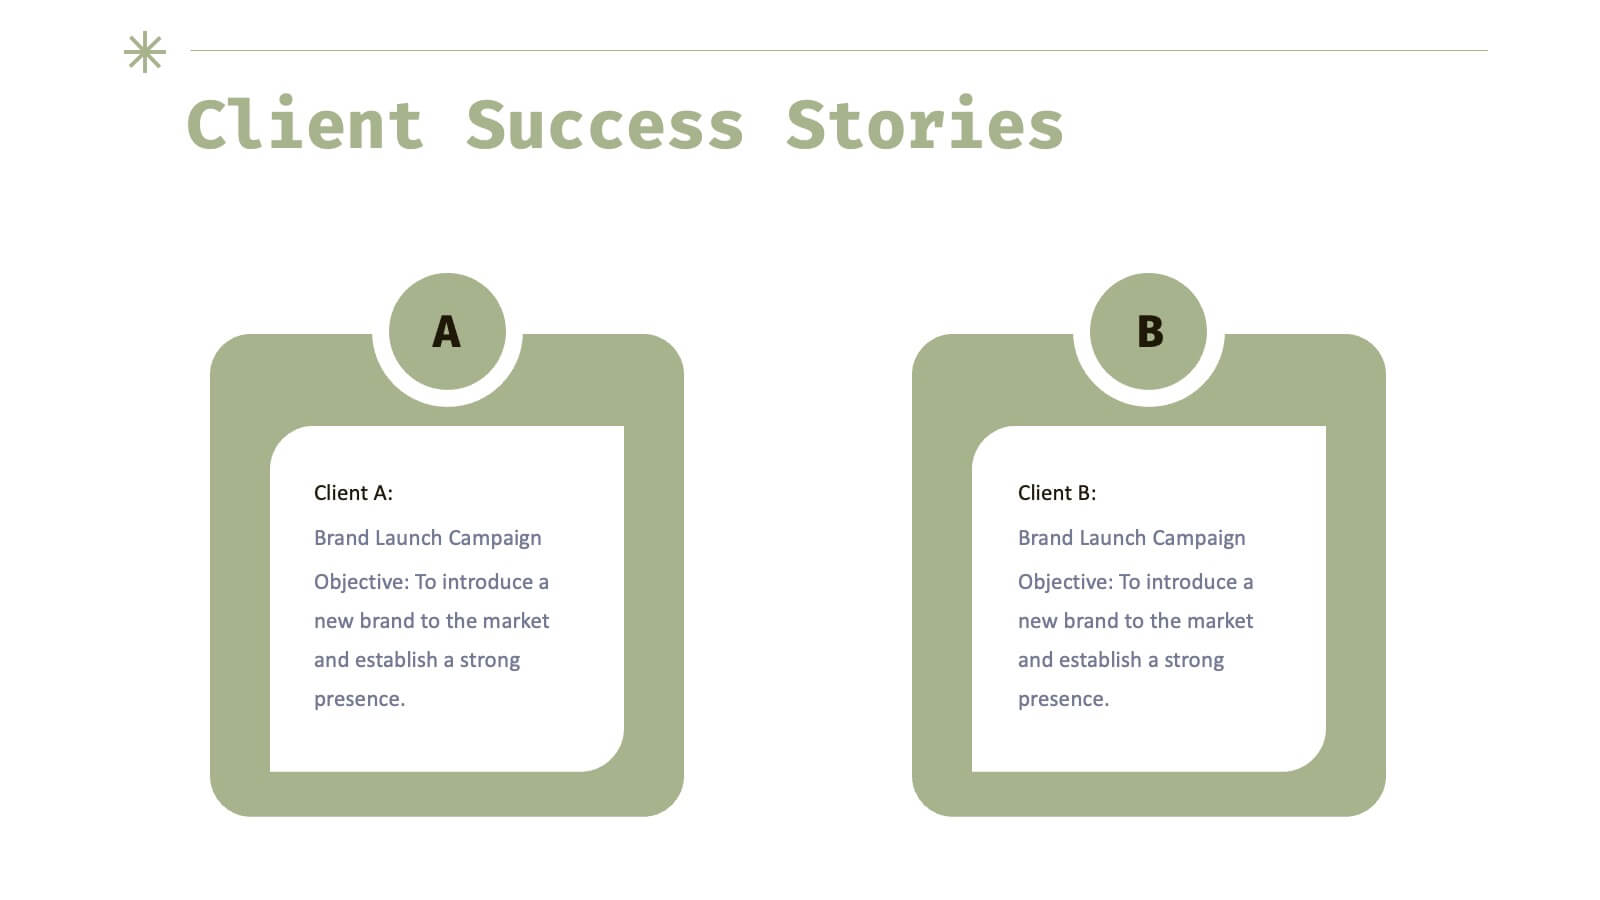
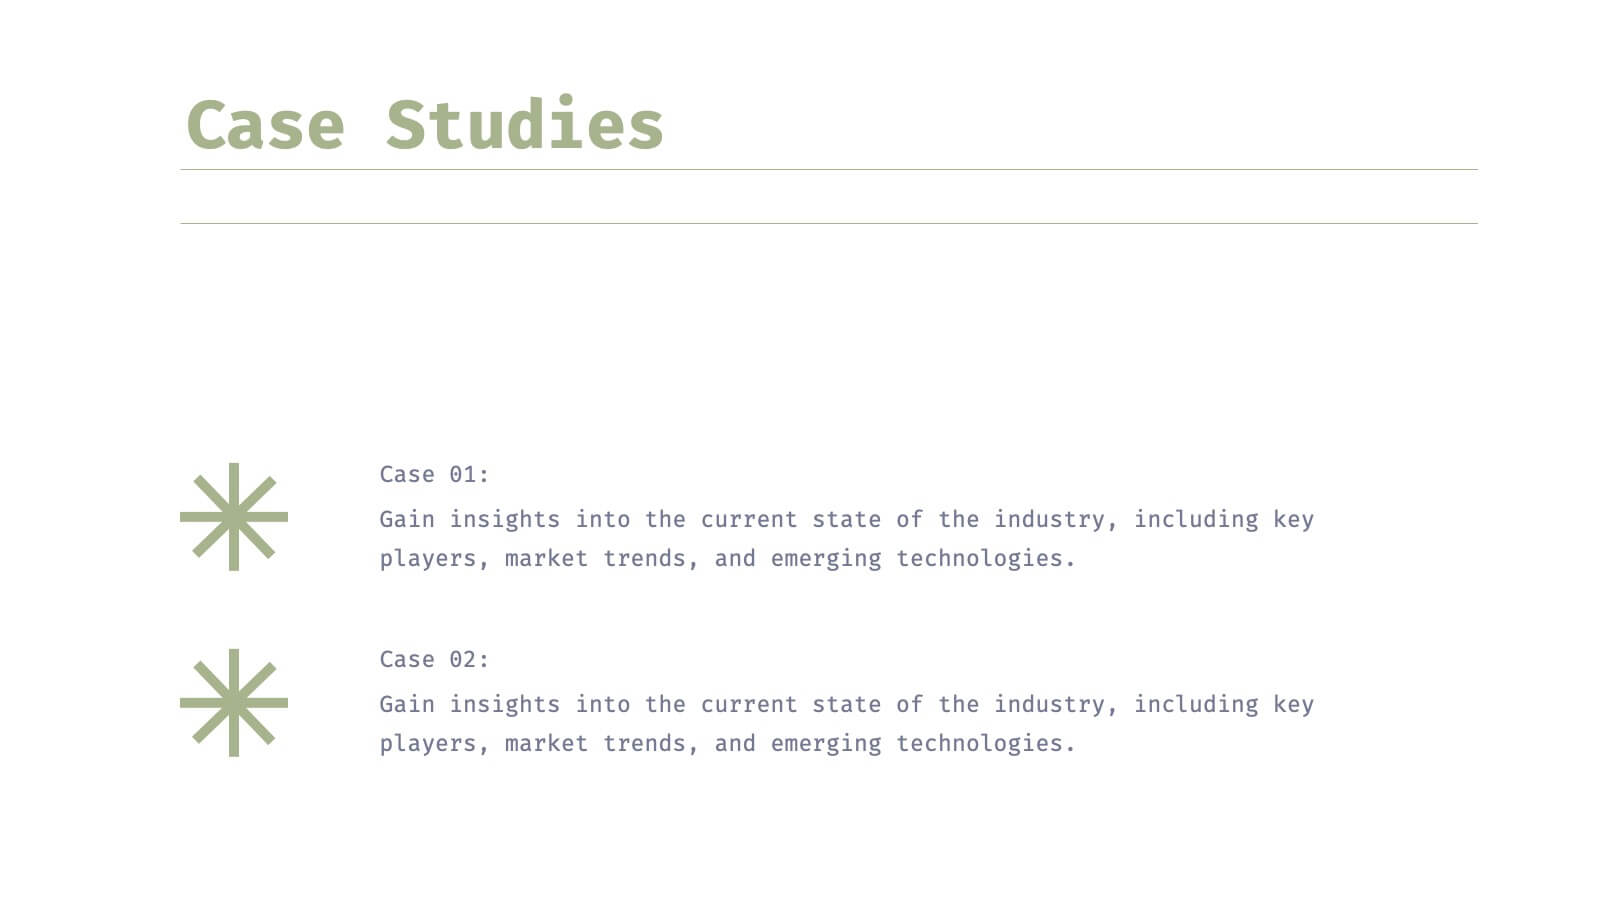
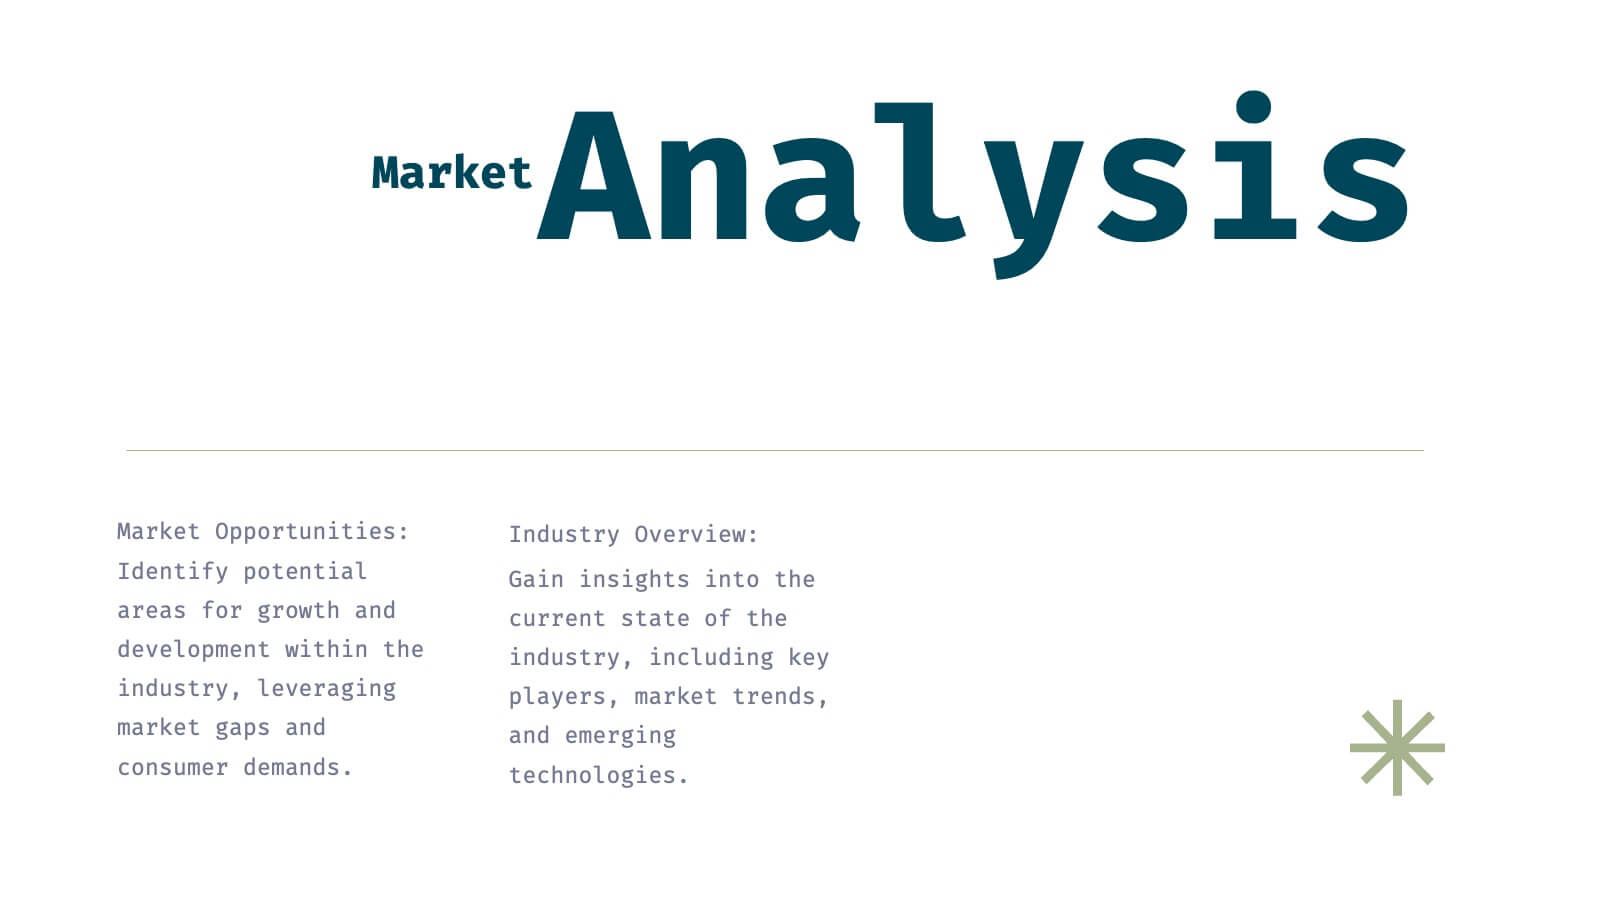
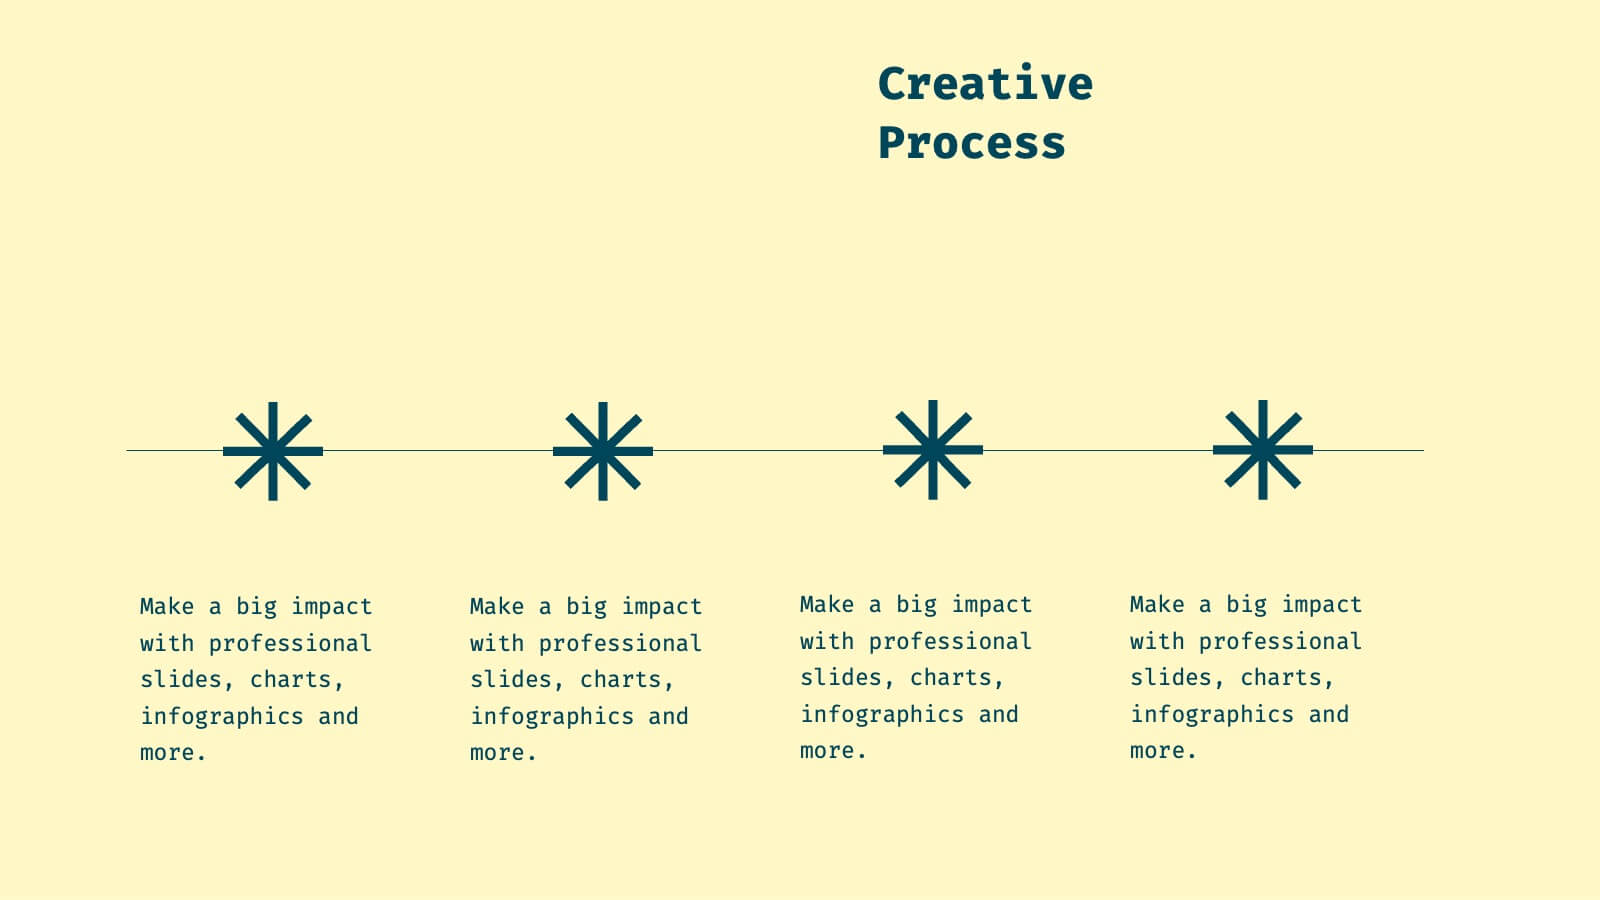
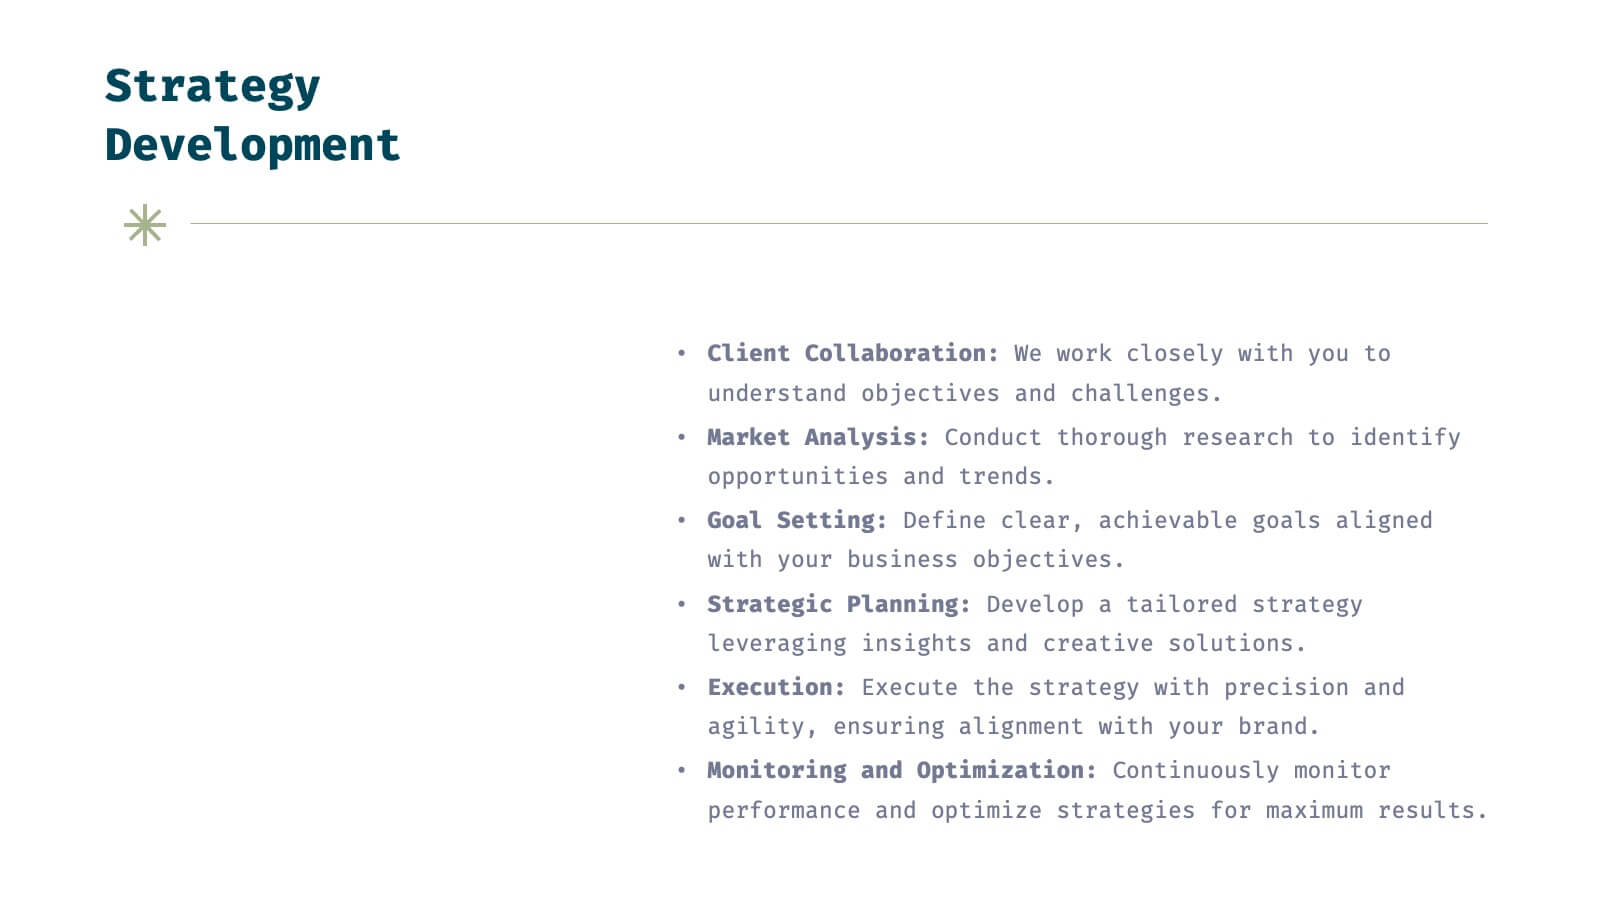
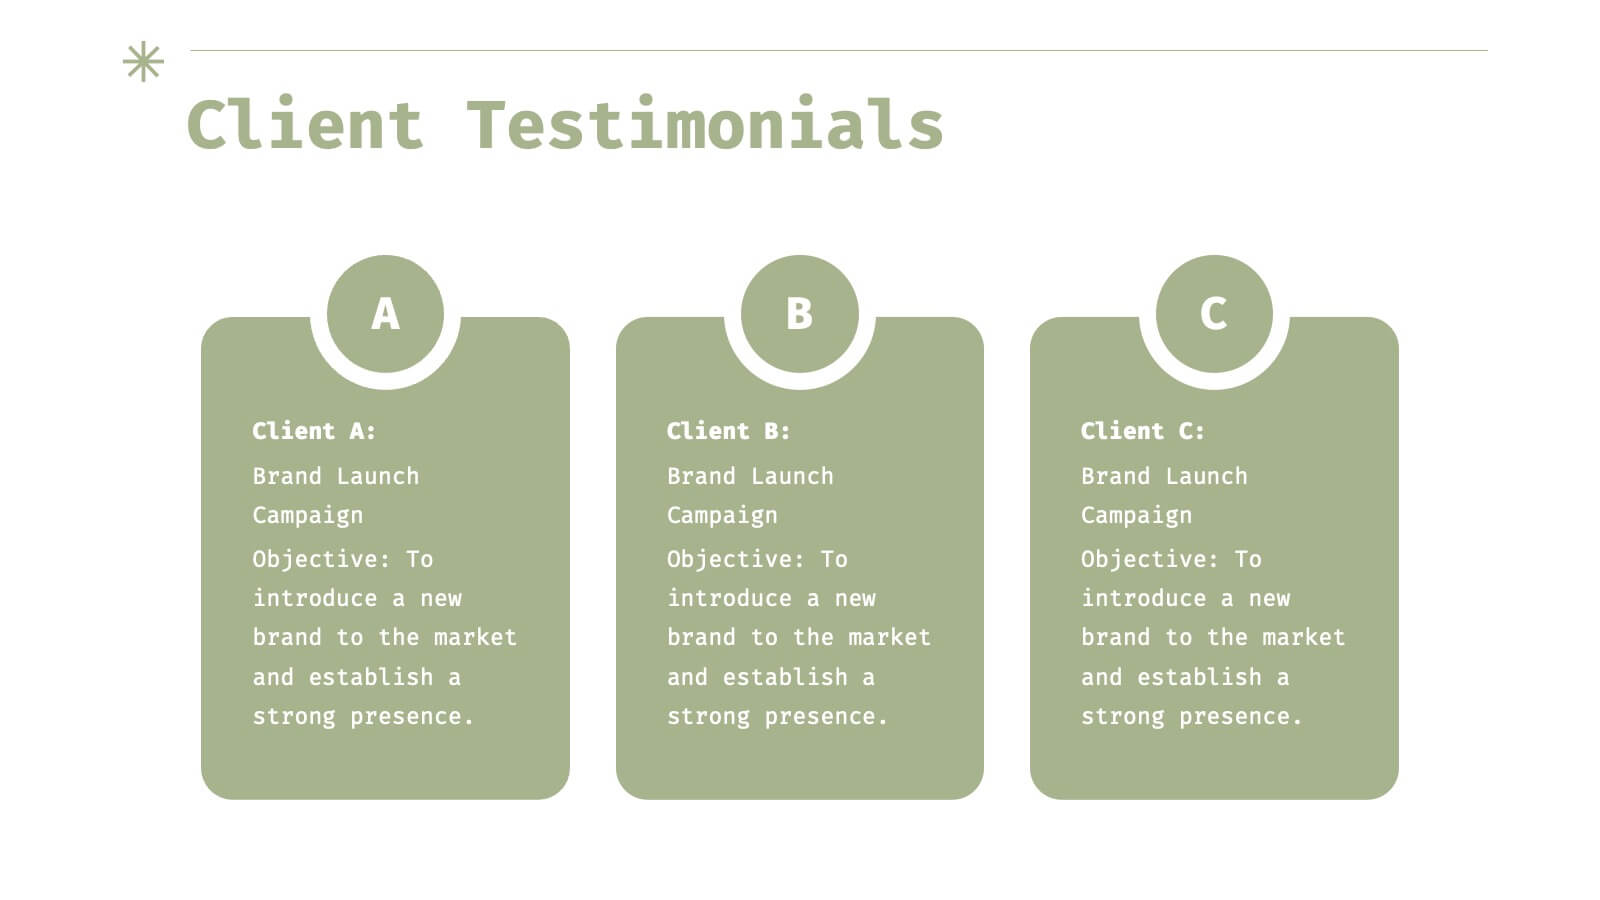
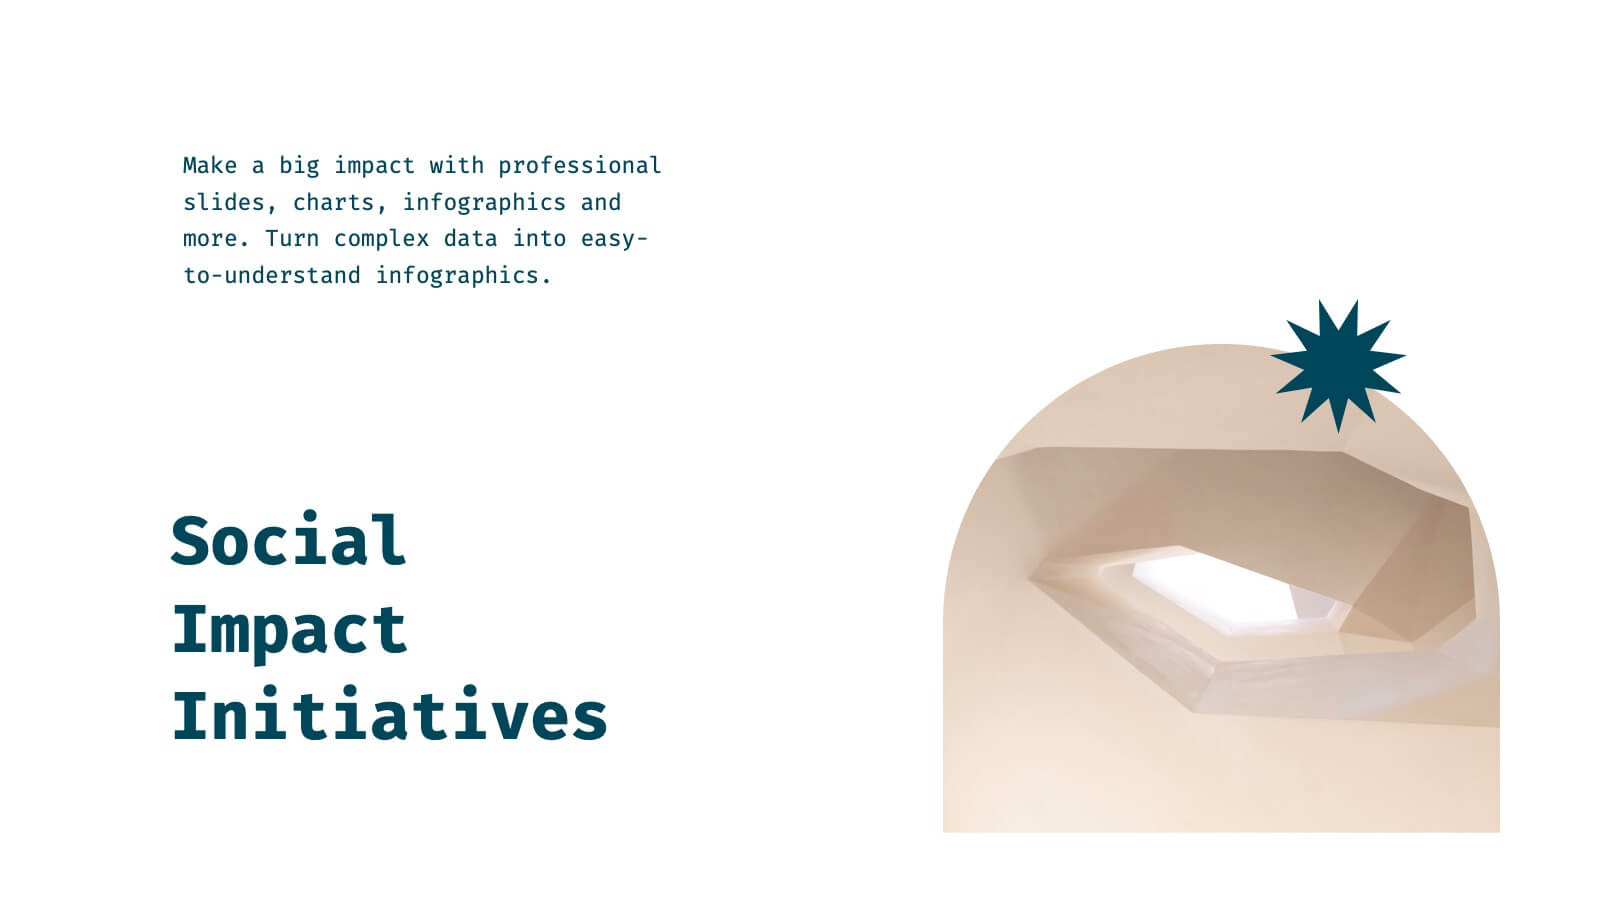
Helix Full-Service Agency Project Plan Presentation
Showcase your agency's expertise with this sophisticated, minimalistic presentation template. Designed to present comprehensive market analysis, strategy development, and client success stories, this template ensures your agency's capabilities are clearly communicated. Its clean design and professional layout make it perfect for building trust and credibility. Compatible with PowerPoint, Keynote, and Google Slides, it's versatile for any platform.


5 diapositivas
Capital Allocation Strategy Overview
Break down your financial strategy visually with the Capital Allocation Strategy Overview Presentation. This semi-circle diagram helps you present four key spending or investment categories clearly and professionally. Ideal for budget planning, operational expenses, or strategic financial decisions. Fully editable in PowerPoint, Keynote, and Google Slides.


6 diapositivas
Organizational Structure Infographic
Organizational structure refers to the way in which an organization is structured and how its roles, responsibilities, and functions are defined and coordinated. This infographic template provides a framework for how individuals and teams work together to achieve the organization's goals. This infographic visually represents the hierarchy, roles, and relationships within an organization. This template allows you to provides a clear overview of how different departments, teams, and individuals are organized and how they interact with each other. Fully customizable and compatible with Powerpoint, Keynote, and Google Slides.


5 diapositivas
Role Assignment Matrix Framework Presentation
Simplify task delegation with the Role Assignment Matrix Framework Presentation. Ideal for defining roles and responsibilities in a clear, table-based layout, this matrix helps organize who does what across departments or project phases. Perfect for RACI charts or team alignment. Fully editable in PowerPoint, Google Slides, Keynote, and Canva.


6 diapositivas
Business Plan Next Steps Presentation
Map out your strategy with the Business Plan Next Steps Presentation template. This visually structured layout helps outline key actions, milestones, and priorities for business growth and execution. Ideal for entrepreneurs, executives, and project managers, this slide ensures clarity and alignment on upcoming initiatives. Fully customizable in PowerPoint, Keynote, and Google Slides for easy integration into your planning process.


7 diapositivas
RAPID Accuracy Infographic Presentation
A RAPID Matrix Infographic is a visual tool used in project management and decision-making processes to clarify and assign roles and responsibilities to individuals or groups involved in a project. This template is designed to provide clarity and structure to the decision-making and project management processes. This template includes grids and tables that list the different activities, tasks, or decisions related to the project, and assigns roles and responsibilities to each activity. Easily customize and modify this template to fit specific team or organization's decision-making process.


4 diapositivas
Consumer Psychology in Marketing
Ever wonder what’s really going on inside a shopper’s mind? This infographic presentation explores the psychology behind consumer decisions, helping you visualize key buying patterns, emotional triggers, and marketing insights with clear, modern visuals. Fully customizable and easy to edit in PowerPoint, Keynote, and Google Slides.


4 diapositivas
Segmented Metrics Pie Chart Overview Presentation
Present your performance data with precision using the Segmented Metrics Pie Chart Overview Presentation. This clean and modern slide design features a donut-style pie chart divided into clearly marked percentage segments, ideal for showcasing metric distribution, KPI breakdowns, or analytical summaries. Each slice is color-coded and paired with editable labels and icons, making complex data easy to digest at a glance. Perfect for business reviews, dashboards, or investor updates. Fully compatible with PowerPoint, Keynote, and Google Slides for effortless customization.


28 diapositivas
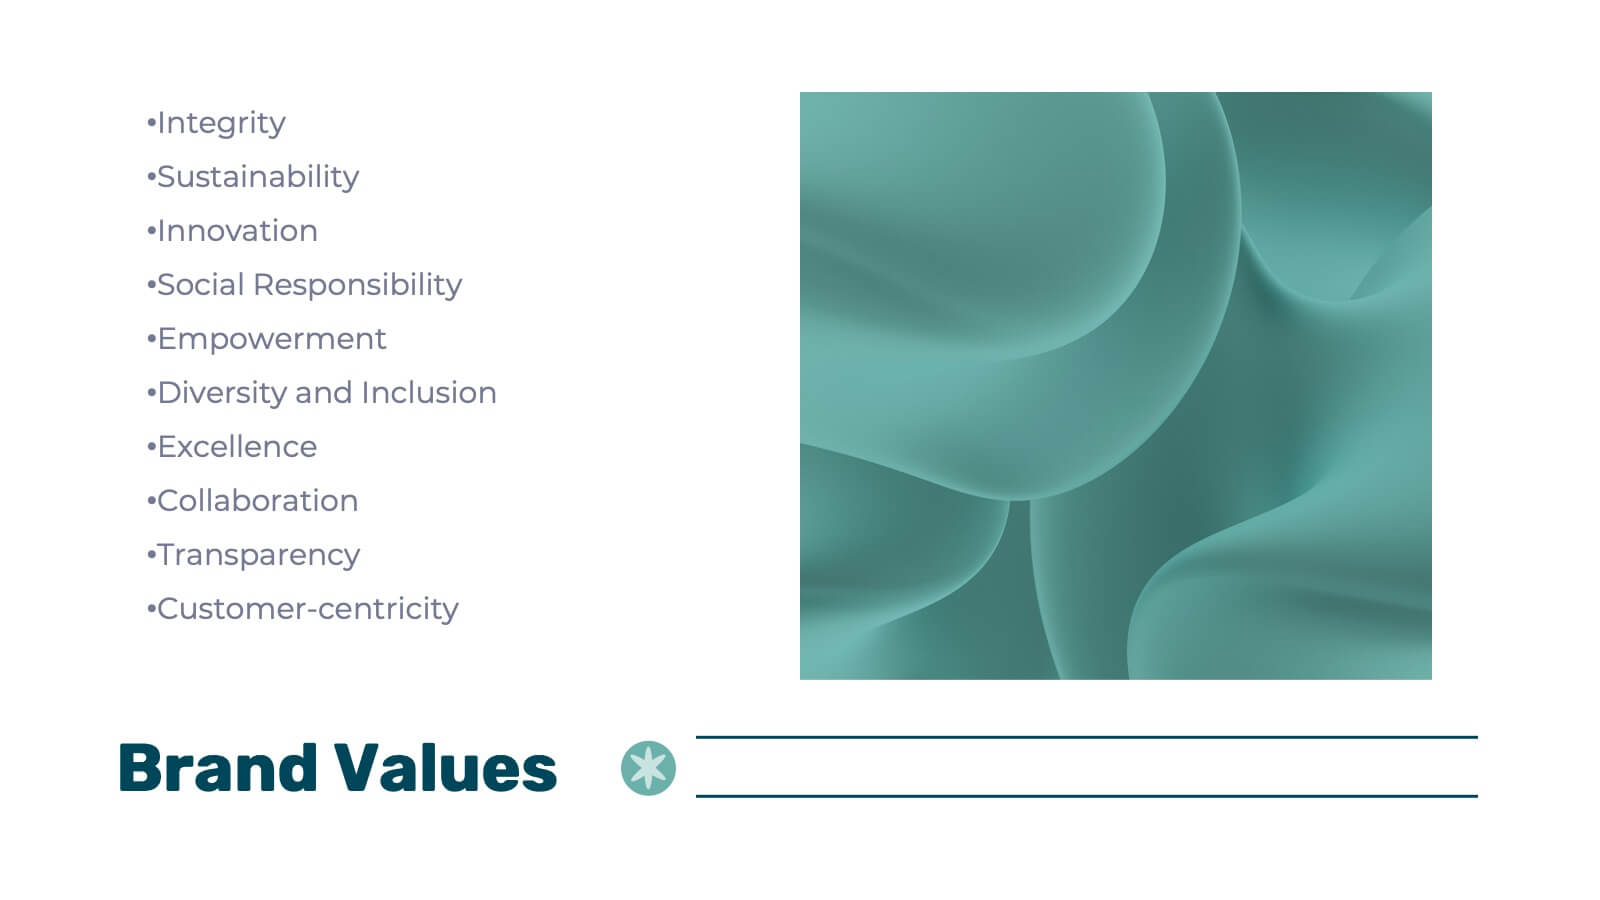
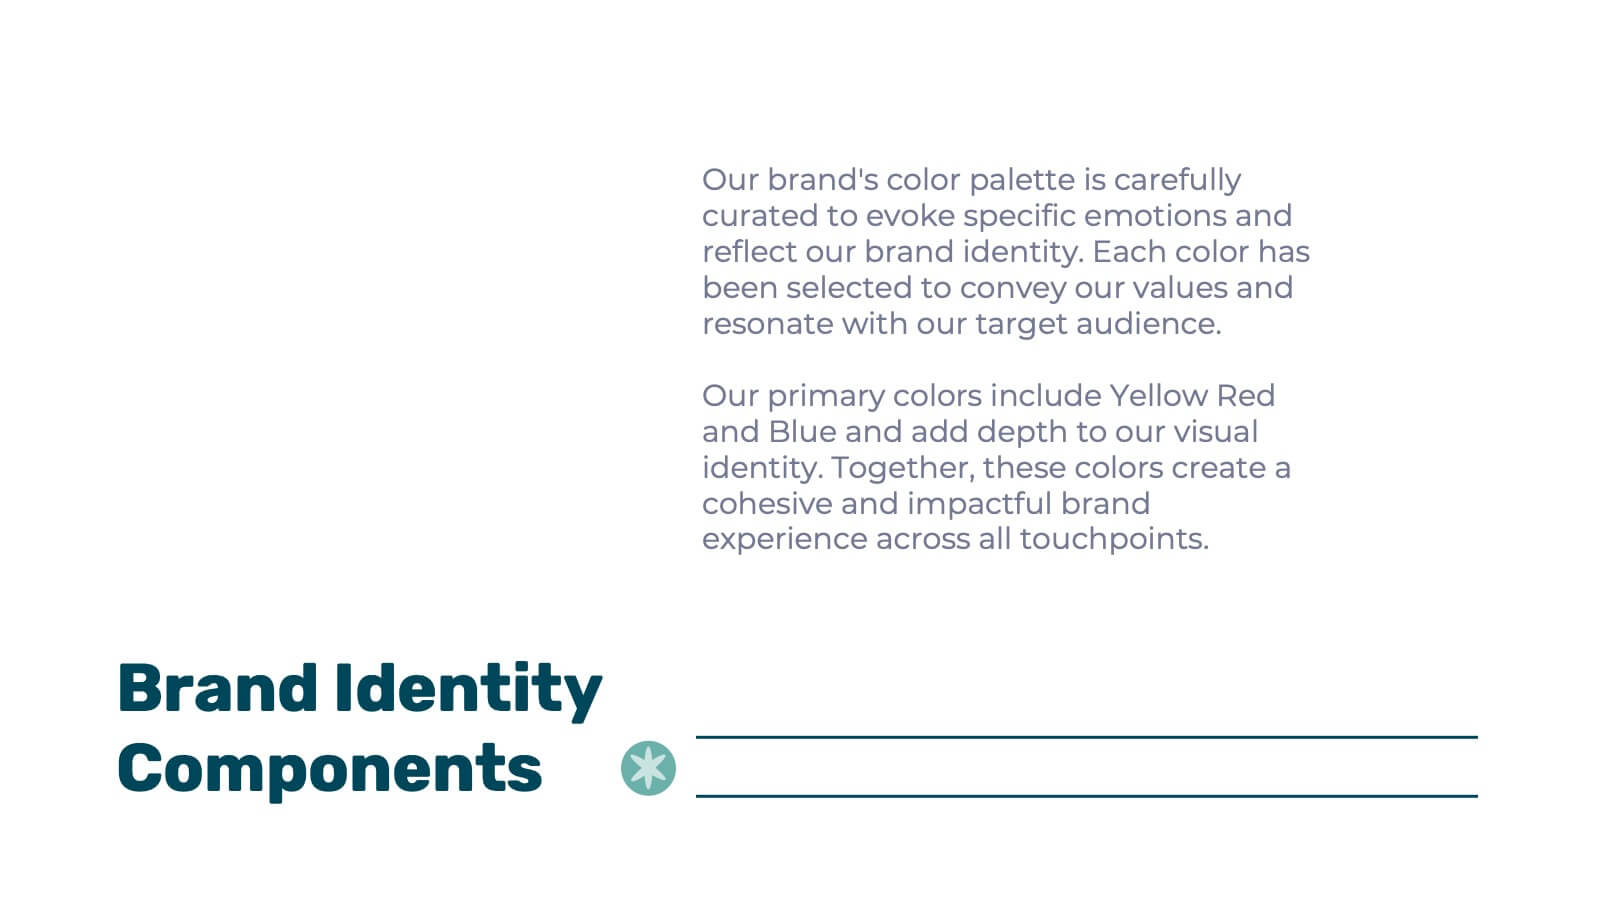
Hawking Brand Strategy Report Presentation
Introduce your brand's vision with this polished and professional strategy report presentation template. Designed for businesses, marketers, and branding agencies, it features comprehensive sections for communicating your brand identity, goals, and market positioning. This template highlights areas such as brand philosophy, target audience insights, competitive analysis, and visual identity systems. Showcase your brand’s unique selling proposition with engaging slides dedicated to colors, typography, logos, and packaging. With layouts tailored for presenting data, strategies, and case studies, you’ll ensure every aspect of your brand resonates clearly. Compatible with PowerPoint, Google Slides, and Keynote, this template is fully customizable to match your style and branding needs. Its clean, modern design and easy-to-edit structure make it a versatile choice for strategy reports, pitches, or team presentations. Elevate your branding efforts and communicate your story with confidence and clarity.


20 diapositivas
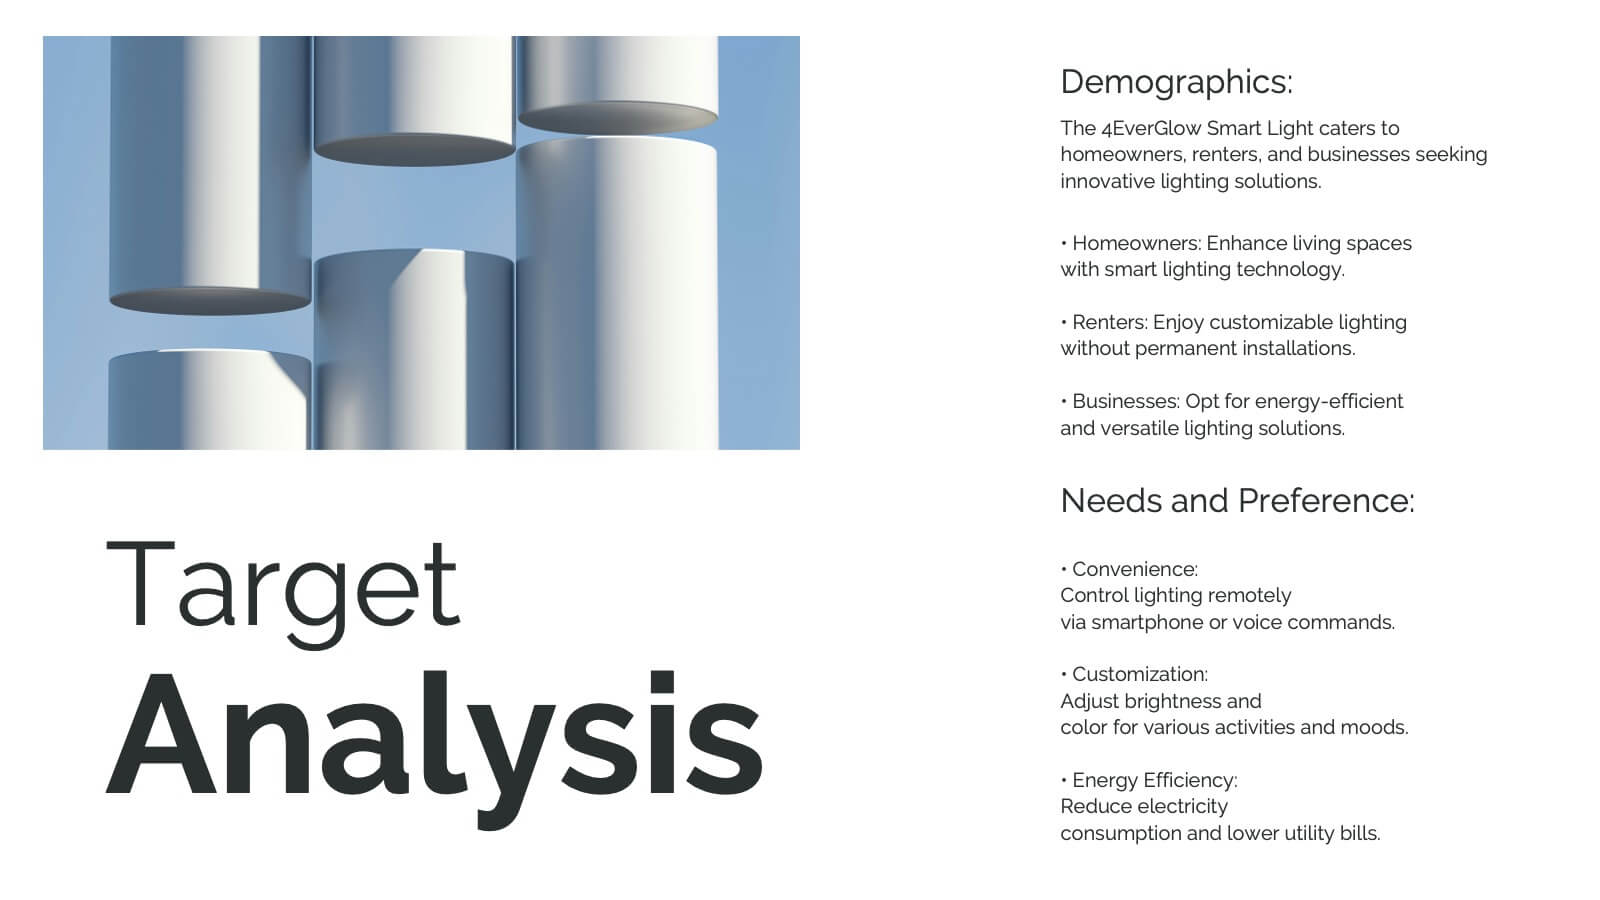
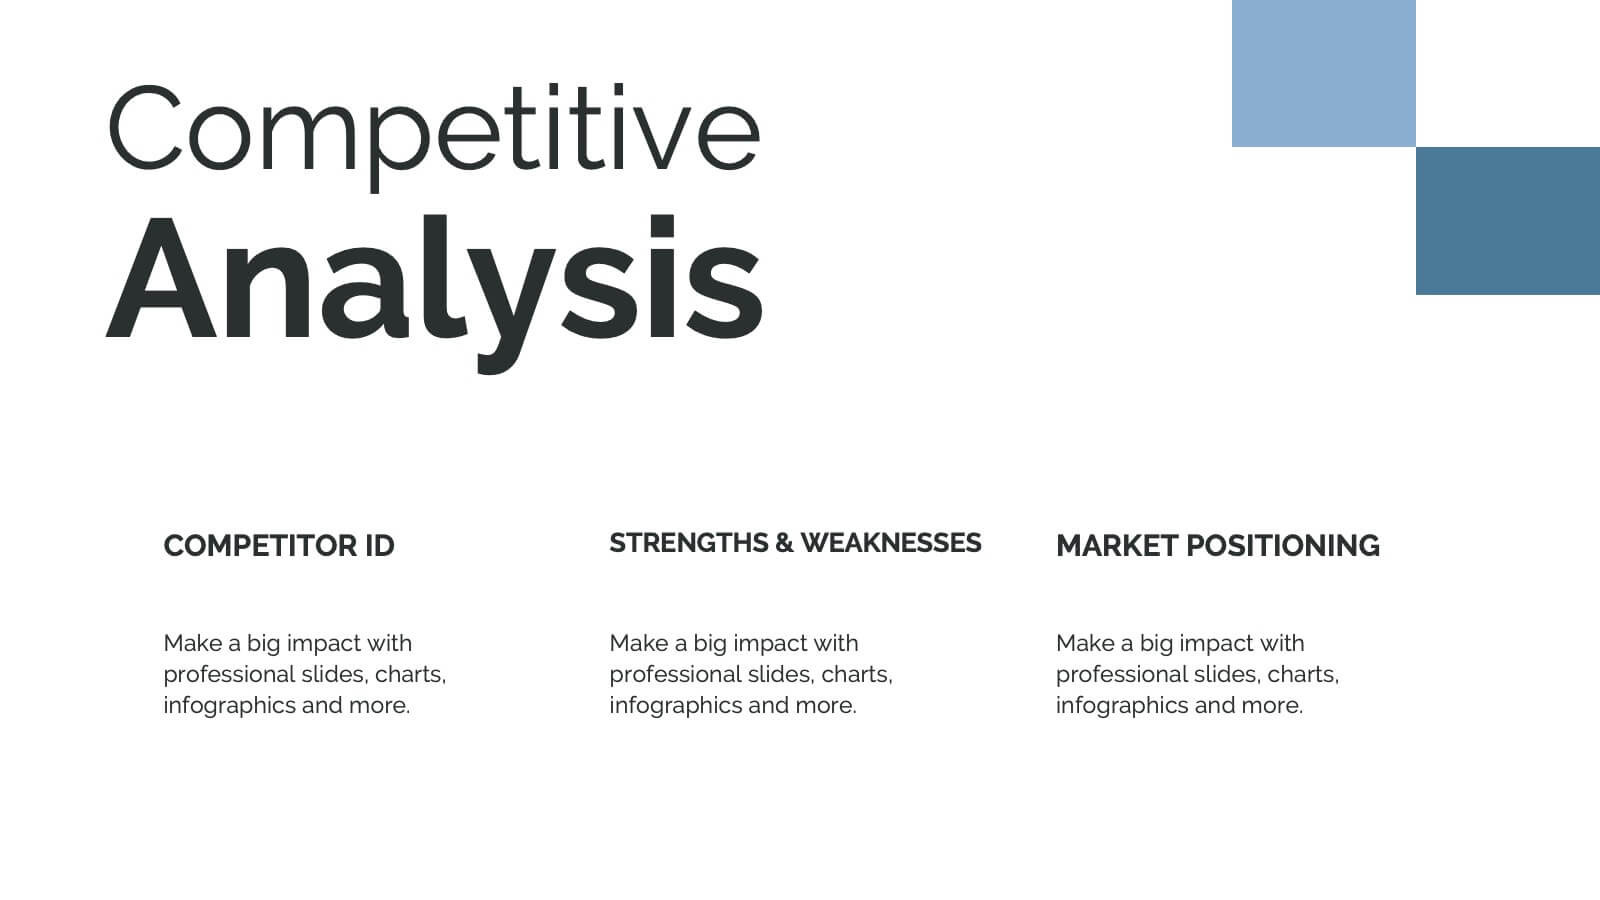
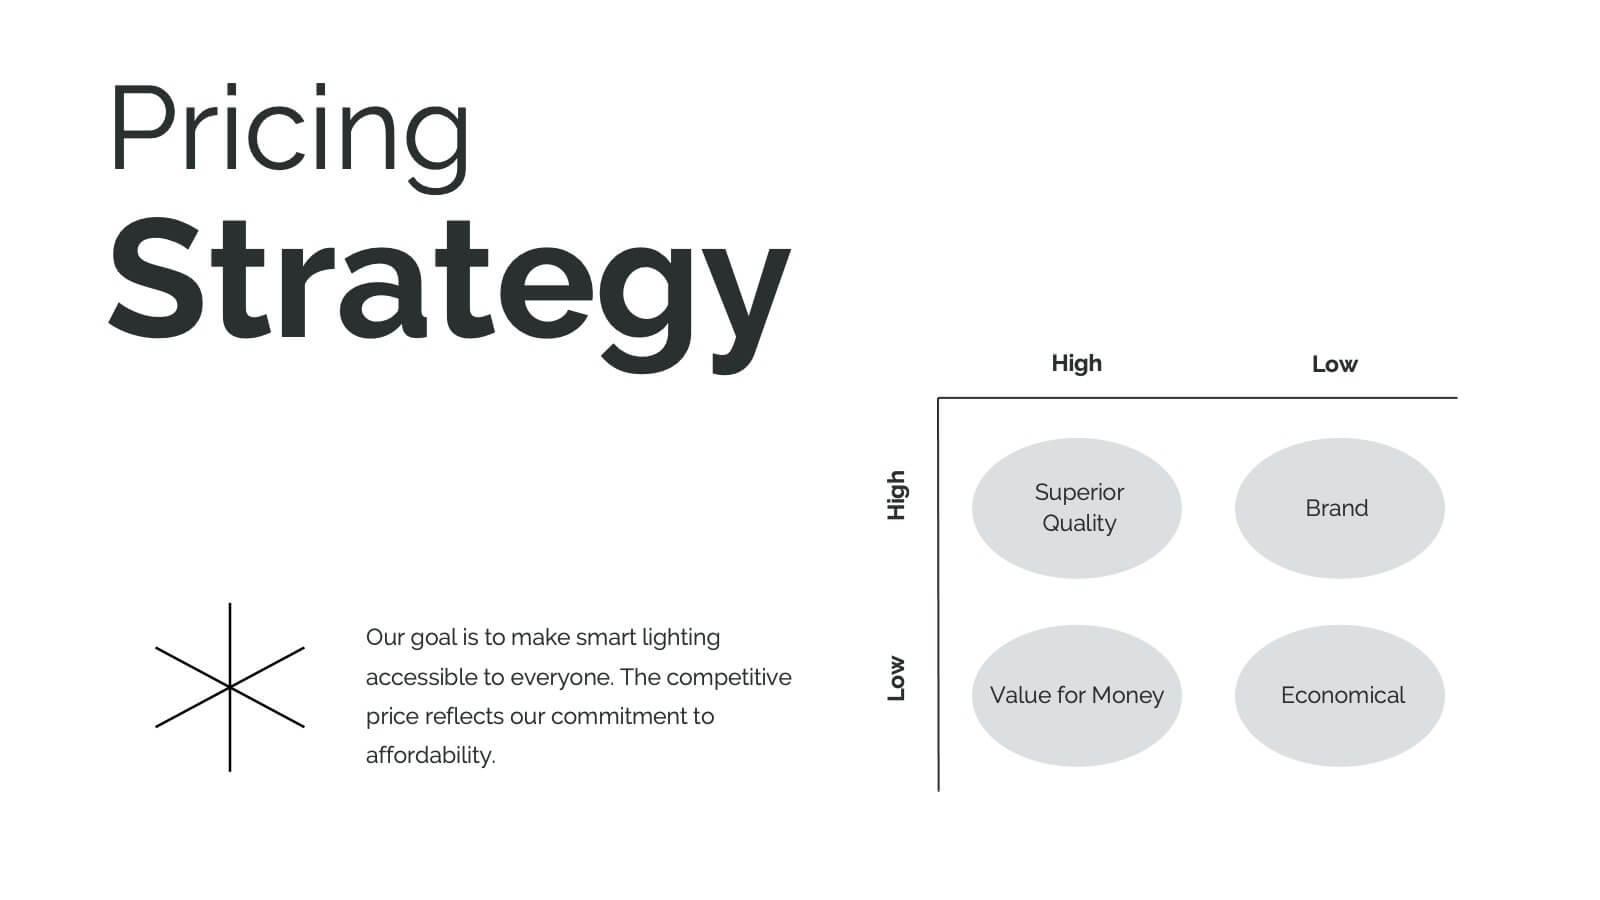
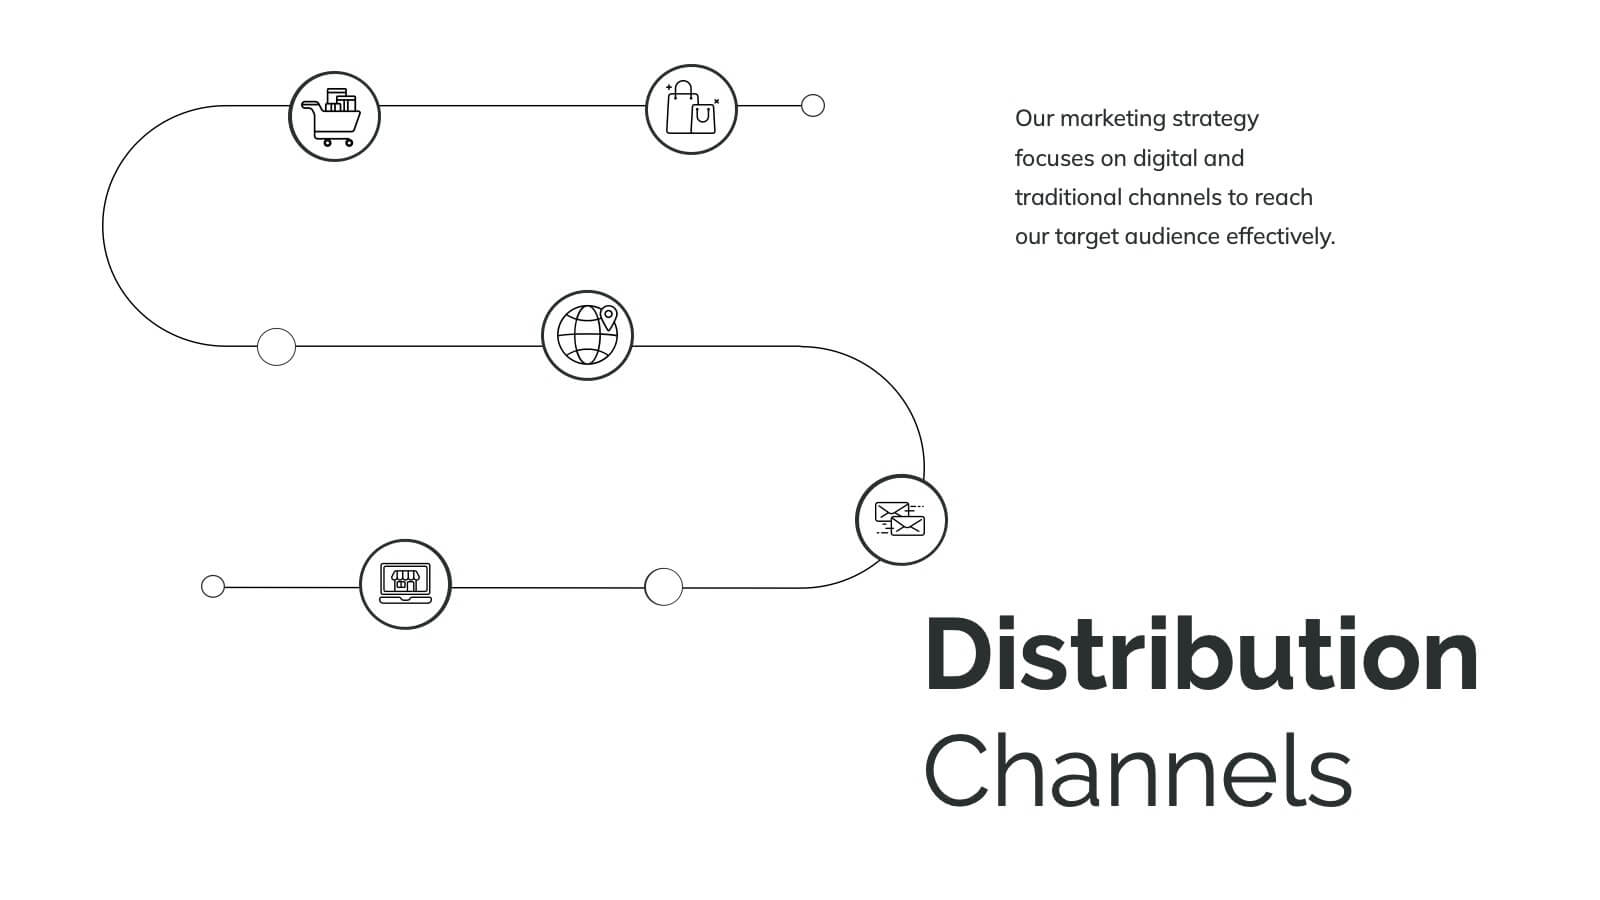
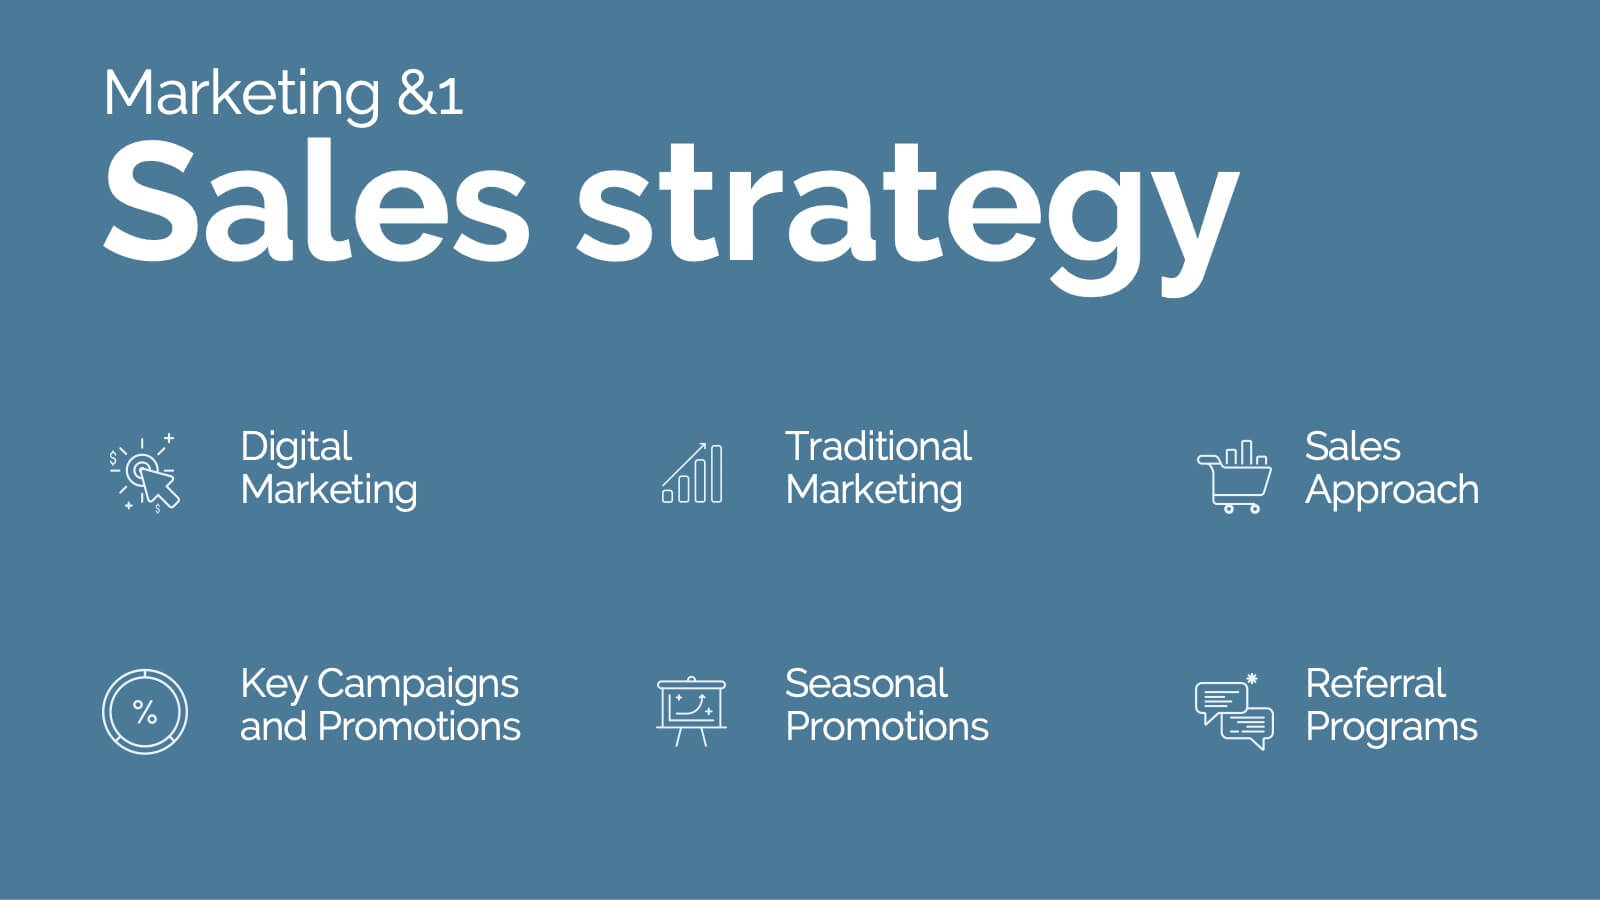
Hydra Product Launch Presentation
Unveiling your latest product has never been easier or more captivating! This comprehensive presentation template covers every aspect of your product's journey—from launch to competitive analysis. Engage your audience with detailed slides on features, target analysis, and pricing strategy. Seamlessly compatible with PowerPoint, Keynote, and Google Slides for maximum flexibility and impact.


4 diapositivas
Operational KPI Monitoring Dashboard
Stay on top of business performance with the Operational KPI Monitoring Dashboard Presentation. This slide is designed to visually communicate key operational metrics using gradient-filled progress bars, percentage indicators, and area charts. Perfect for status updates, executive reporting, or performance reviews, it enables quick analysis of KPIs at a glance. Fully customizable in PowerPoint, Keynote, and Google Slides.


20 diapositivas
Firelight Design Portfolio Presentation
This Design Portfolio Presentation Template offers a bold and modern layout to showcase your creative projects, services, and achievements. It features sections for project highlights, awards, client testimonials, and pricing, making it perfect for freelancers and agencies. Fully customizable in PowerPoint, Keynote, and Google Slides.


10 diapositivas
Healthcare Innovations in Medicine Presentation
Showcase groundbreaking advancements with the Healthcare Innovations in Medicine Presentation template. Designed to highlight medical breakthroughs, research developments, and technological advancements, this visually appealing layout is ideal for healthcare professionals, researchers, and medical institutions. Fully customizable and compatible with PowerPoint, Keynote, and Google Slides, this template ensures your presentation is clear, engaging, and impactful.


6 diapositivas
Pathway and Options Framework Analysis Presentation
Navigate your business strategy with clarity using the Pathway and Options Framework Analysis Presentation. This slide features a horizontal hexagon progression that visually maps out five distinct stages or decision points. Ideal for illustrating phased development, strategic alternatives, or milestone-based planning. Each segment includes an icon and customizable title area for key data points. Use this clean, modern layout to engage stakeholders or clarify complex processes. Fully editable in PowerPoint, Keynote, and Google Slides.


20 diapositivas
Crescendo Creative Design Report Presentation
Transform your creative design report into a captivating presentation with a dynamic and professional template. This versatile format is tailored for designers, agencies, and creatives who want to showcase their design process, strategic approach, and project outcomes effectively. From design briefs and target audience insights to mood boards and prototypes, every slide is crafted to enhance clarity and visual appeal. Highlight unique elements, design systems, and implementation strategies with organized layouts that leave a lasting impression. Use the project timeline and feedback sections to narrate your journey and collaboration efforts seamlessly. Compatible with PowerPoint, Google Slides, and Keynote, this fully editable template adapts to your brand's needs. Engage stakeholders and clients with a polished, modern design that reflects your creative excellence.


7 diapositivas
SWOT Analysis Infographic Presentation Template
SWOT analysis is a strategic tool that's usually done to help you determine your company's strengths and weaknesses, as well as opportunities and threats that could affect your company's future. With this template you can visually present the results of a SWOT analysis. They are used too quickly and easily communicate the key findings of the analysis to stakeholders, such as investors and employees. This templates infographics typically include four quadrants, each representing one of the SWOT elements. Use this template to make an easy-to-read infographic of your company's success factors.


4 diapositivas
Empathy Mapping for Product Development Presentation
Strengthen user understanding with the Empathy Mapping for Product Development Presentation. This template helps teams visualize what users think, feel, say, and do—essential for creating intuitive products and experiences. Ideal for design sprints, UX workshops, and product planning sessions. Fully editable in PowerPoint, Keynote, Canva, and Google Slides.