


Características


¿Tienes alguna pregunta?
Recomendar


7 diapositivas
Inversion Table Infographic
A table infographic is a visual representation of data or information presented in a tabular format, using a combination of text, numbers, and visual elements to make the information more engaging and easily understandable. This infographic template is great for comparing two or more variables and is a powerful way to convey your data. This infographic is designed to show your audience the key points of your data in a visually appealing way. This template is a good option if you want to present your information as an easy-to-read table with labels and numbers. The bright colors and fun design make it easy to see at a glance.


3 diapositivas
Profitability and Cost Analysis Presentation
Evaluate financial efficiency with this profitability and cost analysis template. Designed for business strategists and financial planners, it helps compare costs against revenue to determine profit potential. The visual balance scale enhances clarity, making complex data easier to digest. Fully customizable and compatible with PowerPoint, Keynote, and Google Slides for seamless editing.


5 diapositivas
Leadership Decision-Making Process Presentation
Guide your audience through leadership challenges with this step-by-step visual. Featuring four clearly defined stages, this layout is perfect for illustrating strategy development, executive planning, or coaching frameworks. The rising path graphic and human figure emphasize progress and achievement. Fully editable and compatible with PowerPoint, Keynote, and Google Slides.


10 diapositivas
Startup Executive Overview Template Presentation
Bring your startup’s big picture to life in one smart, visual swoop! This infographic presentation template helps you map out key insights and milestones in a clean, modern layout. Ideal for pitching ideas, aligning teams, or showcasing growth strategies. Fully compatible with PowerPoint, Keynote, and Google Slides for easy editing.


5 diapositivas
Healthcare Solutions in Modern Medicine Presentation
Present pharmaceutical and medical data with clarity using these modern healthcare infographics. Designed with pill packs, bandages, and capsules, this editable template is ideal for illustrating treatment comparisons, solution options, or patient care data. Perfect for medical professionals, health startups, and researchers using PowerPoint, Keynote, or Google Slides.


10 diapositivas
Financial Money Management Strategies Presentation
Break down your key financial strategies with this clear, wheel-style diagram. Perfect for outlining budgeting principles, savings goals, or investment methods, each segment includes space for titles and concise text. Ideal for financial advisors, consultants, or internal team planning. Fully customizable in PowerPoint, Keynote, and Google Slides.


2 diapositivas
Startup Company Profile Introduction Presentation
Make a bold first impression with the Startup Company Profile Introduction Presentation. This modern, vibrant layout is perfect for introducing your startup’s mission, values, and services. With eye-catching visuals and clean structure, it’s fully customizable in Canva, PowerPoint, or Google Slides—making it easy to tailor for pitches or internal use.


5 diapositivas
Defining Project Scope Presentation
Clearly outline project goals with the Defining Project Scope Presentation template. This step-by-step visual guide helps teams map out project objectives, key milestones, and deliverables in an organized manner. Perfect for project managers, business analysts, and consultants looking to present scope definitions effectively. Fully editable in PowerPoint, Keynote, and Google Slides for easy customization.


12 diapositivas
Business Networking Strategy
Showcase your connection-building roadmap with this hexagonal Business Networking Strategy template. Ideal for illustrating partnerships, key contacts, or collaboration phases, this layout helps structure complex relationships with clarity. Fully customizable in PowerPoint, Keynote, and Google Slides to match your branding and networking objectives.


7 diapositivas
McKinsey 7S Framework Presentation
Dive into organizational alignment with our McKinsey 7S Framework infographic presentation template, perfect for consultants and business managers. This visually appealing template organizes your discussion around Structure, Strategy, Systems, Skills, Staff, Style, and Shared Values, ensuring a comprehensive overview. Crafted for clarity and effectiveness, it's ready to use in PowerPoint, Keynote, and Google Slides, helping you present complex interdependencies with ease and style.


4 diapositivas
Key Business Insights Executive Summary
Present your insights like a pro with this dynamic, timeline-inspired slide that makes key data points easy to follow. Designed to highlight four major takeaways or milestones, this visual format is ideal for summarizing business progress, strategy updates, or operational highlights. Fully editable in PowerPoint, Keynote, and Google Slides.
6 diapositivas
Key Project Milestone Tracker Presentation
Stay on top of project timelines with this clean and colorful milestone tracker. Ideal for Gantt-style overviews, this slide helps teams visualize progress across months for multiple tasks. Compatible with PowerPoint, Keynote, and Google Slides for seamless editing.


6 diapositivas
Building High-Performing Teams Presentation
Unlock your team's full potential with this dynamic Building High-Performing Teams template. Featuring a sleek 3-part circular layout, it's perfect for showcasing leadership roles, collaboration pillars, or performance drivers. Use it for HR meetings, training sessions, or team development plans. Fully editable in PowerPoint, Keynote, and Google Slides.


6 diapositivas
Connection and Relationship Strategy Presentation
Present your workflow or relationship journey with clarity using the Connection and Relationship Strategy Presentation. This linear hexagon path is ideal for visualizing sequences, strategies, or stages in professional relationships. Fully customizable for PowerPoint, Keynote, and Google Slides—perfect for consultants, marketers, or project managers.


3 diapositivas
Break Even Financial Model Presentation
Bring your financial story to life with this sleek and professional presentation design. Ideal for illustrating profit margins, cost recovery, or growth potential, it helps visualize when investments start to pay off. Fully customizable and compatible with PowerPoint, Keynote, and Google Slides for effortless editing and impactful presentations.


23 diapositivas
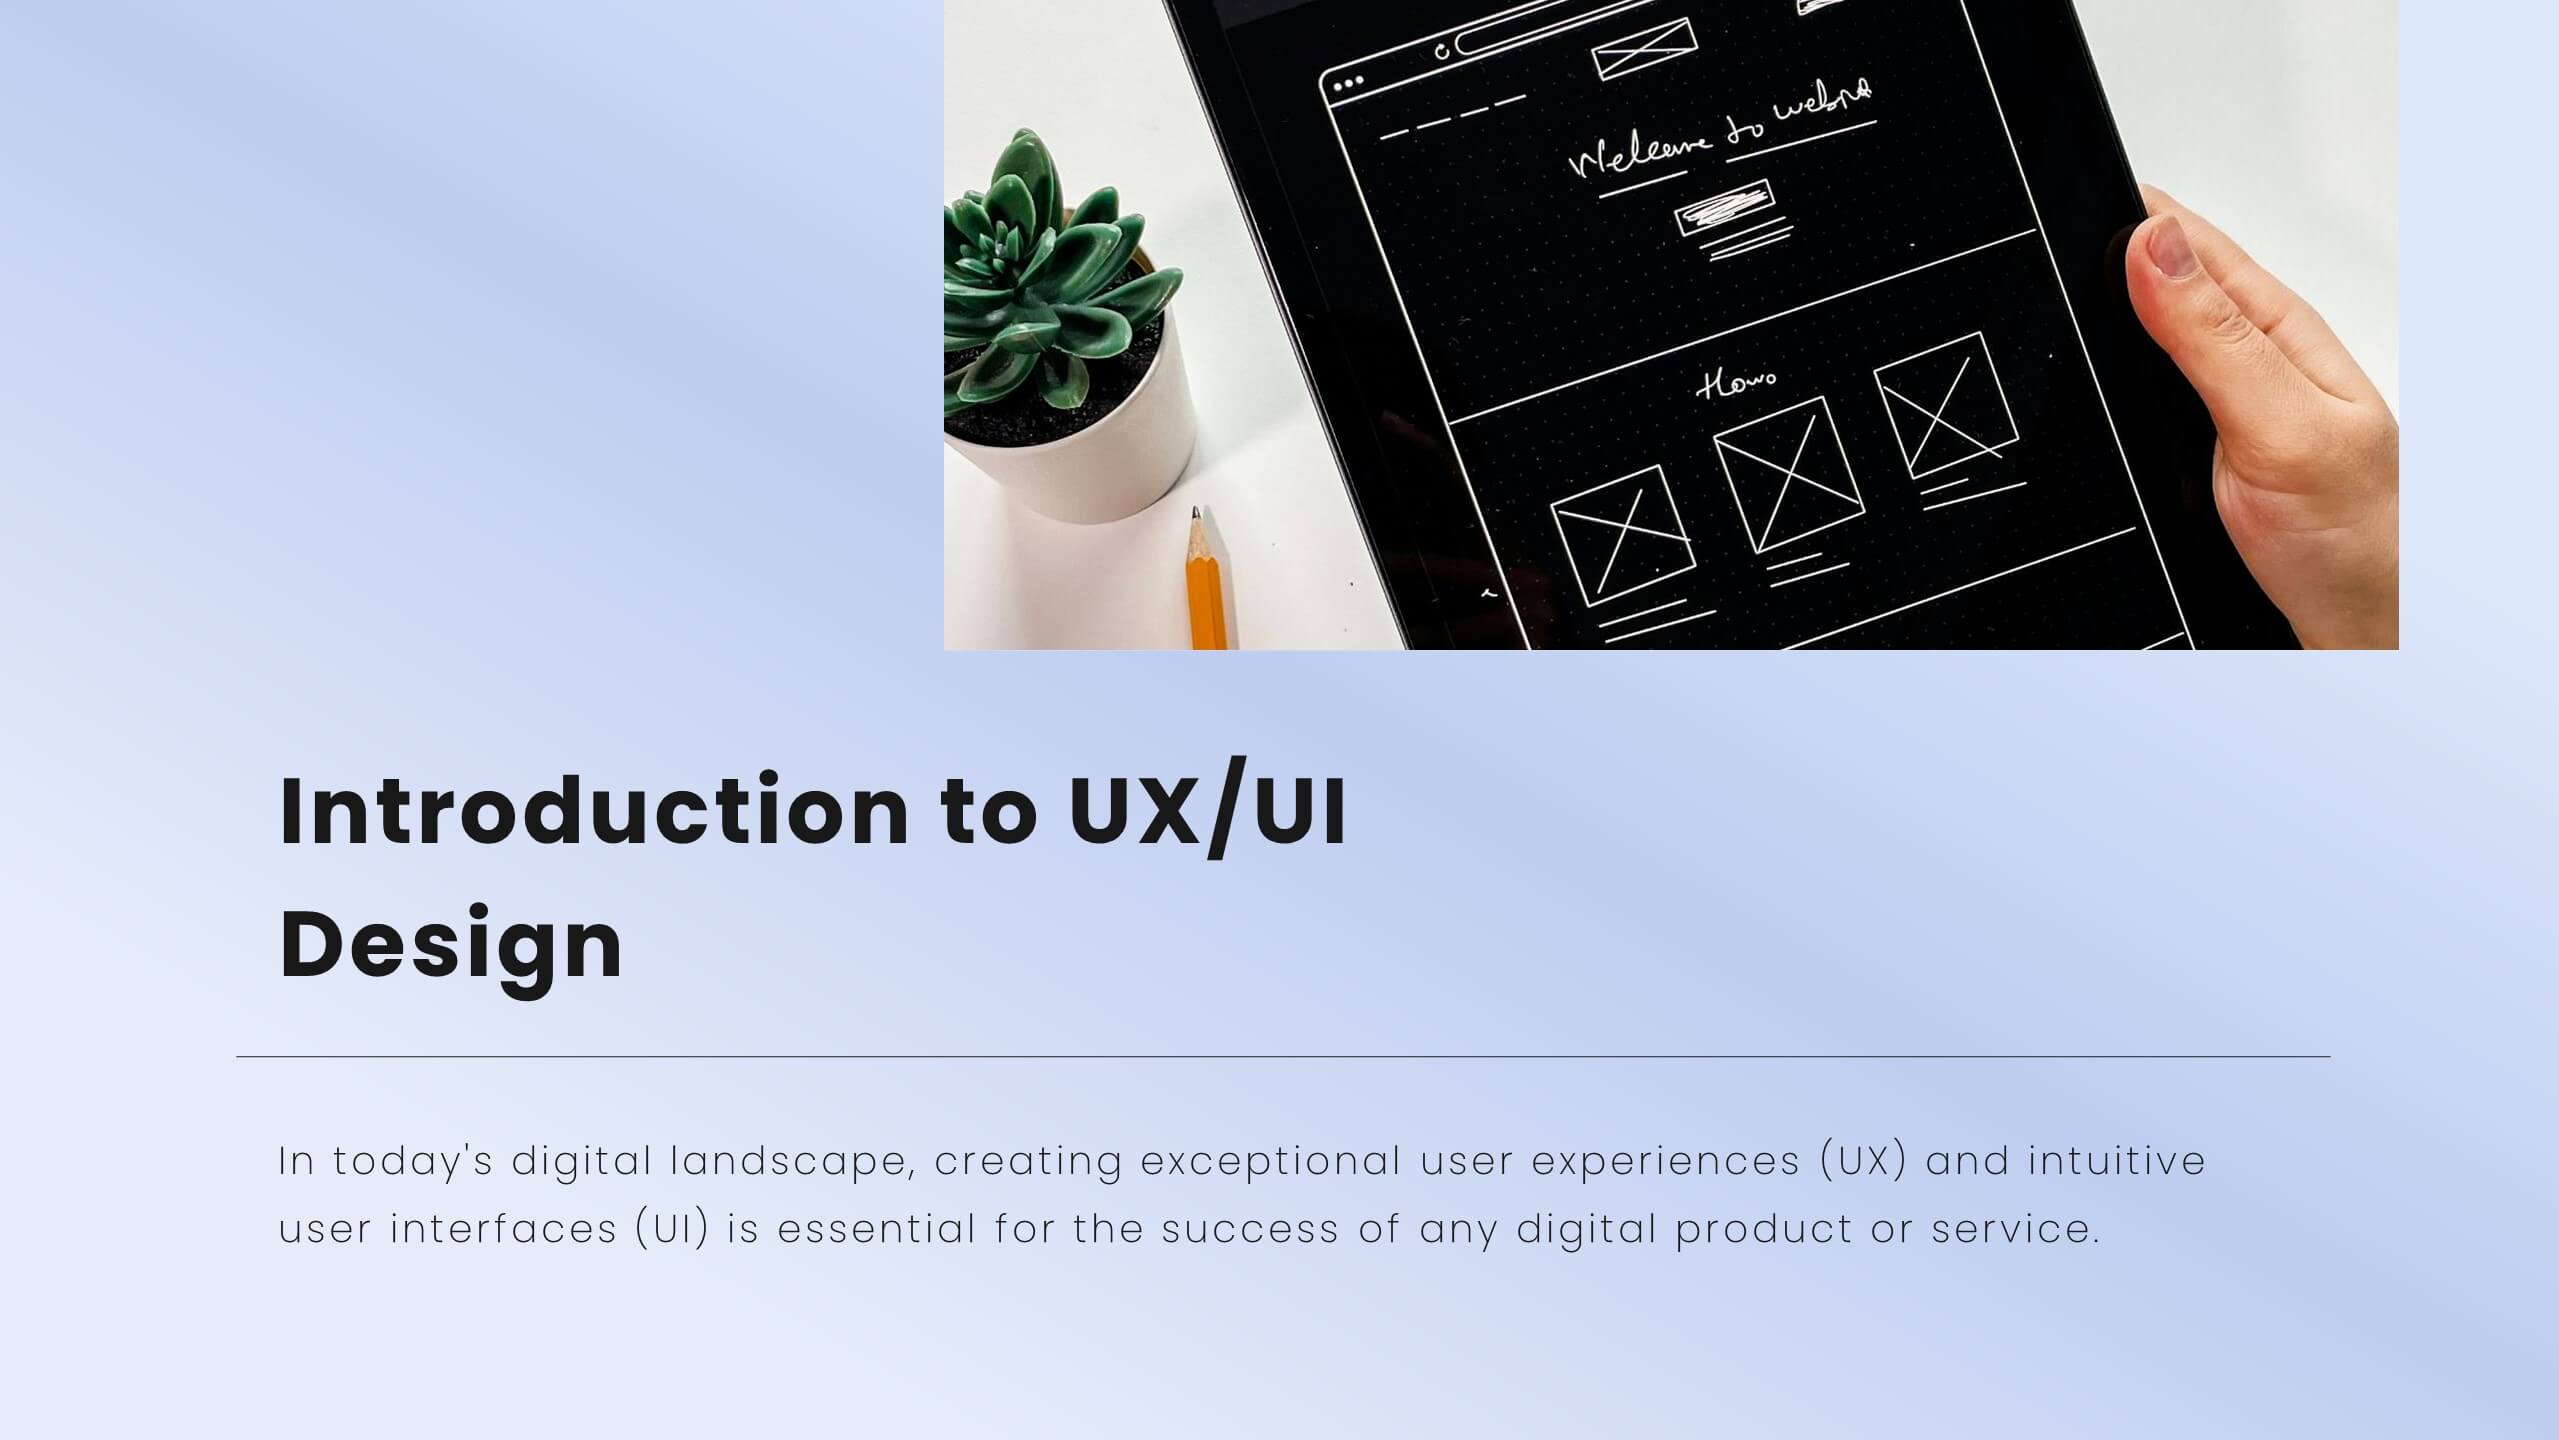
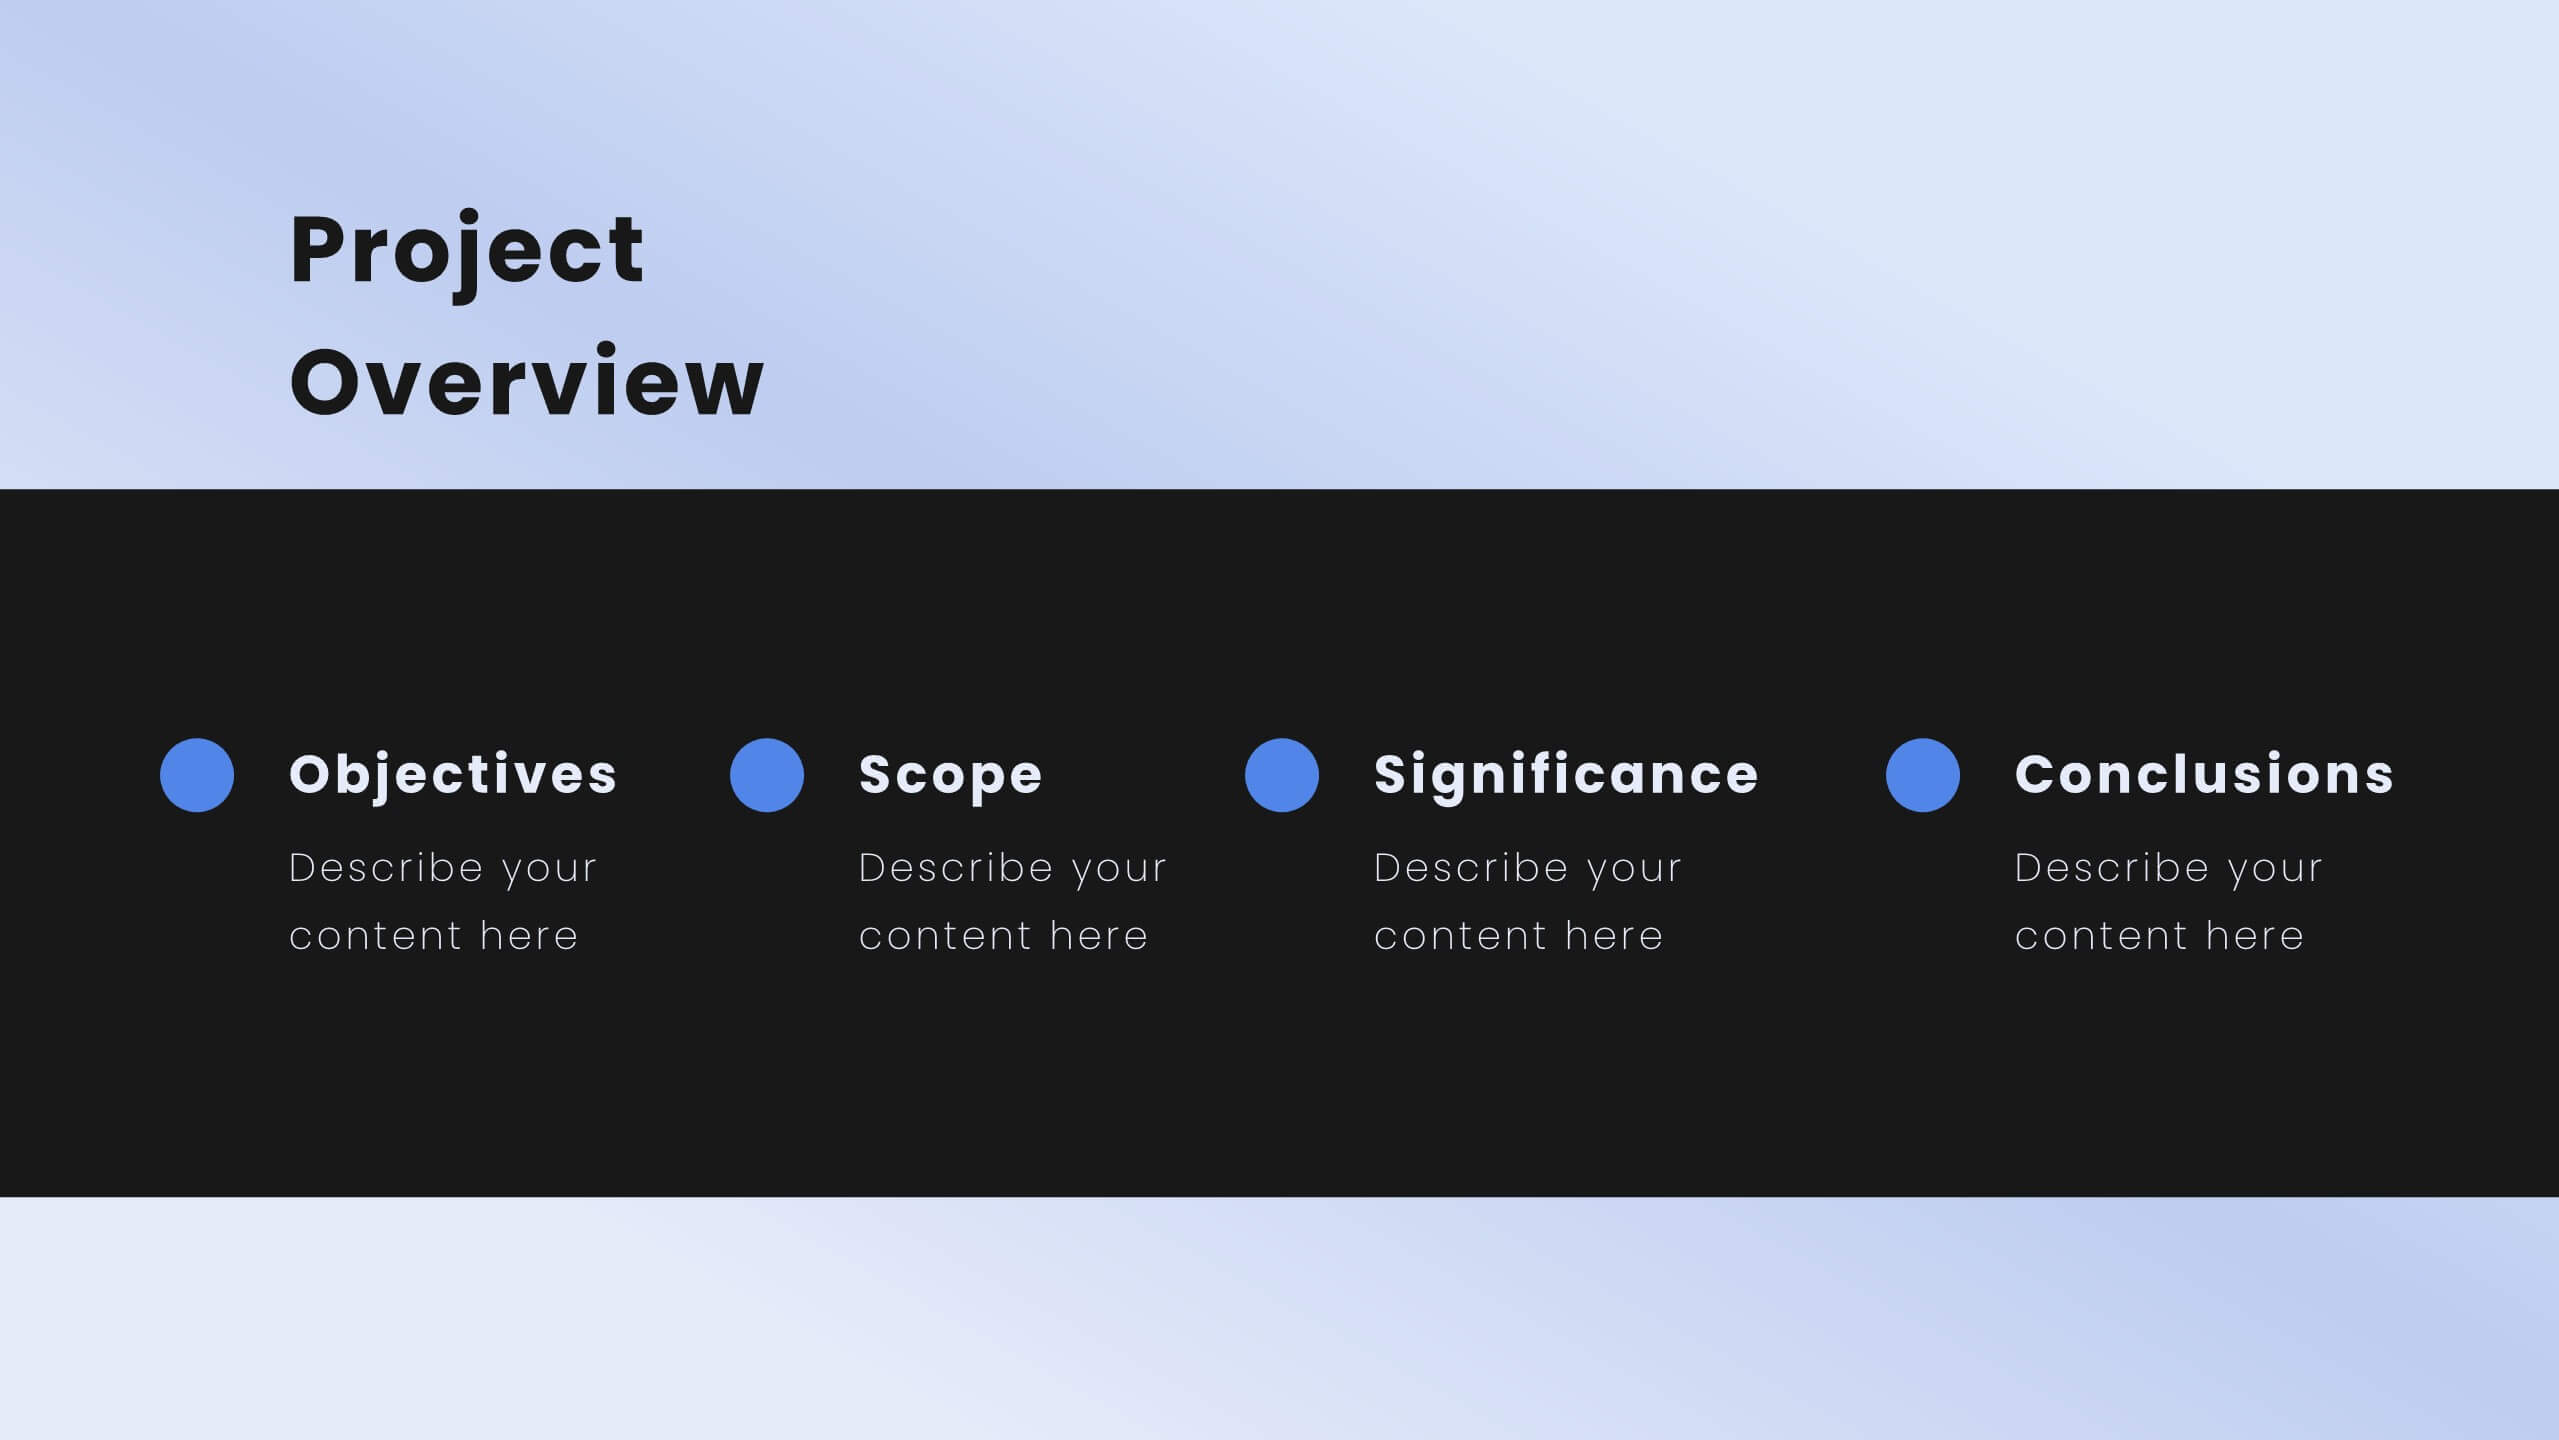
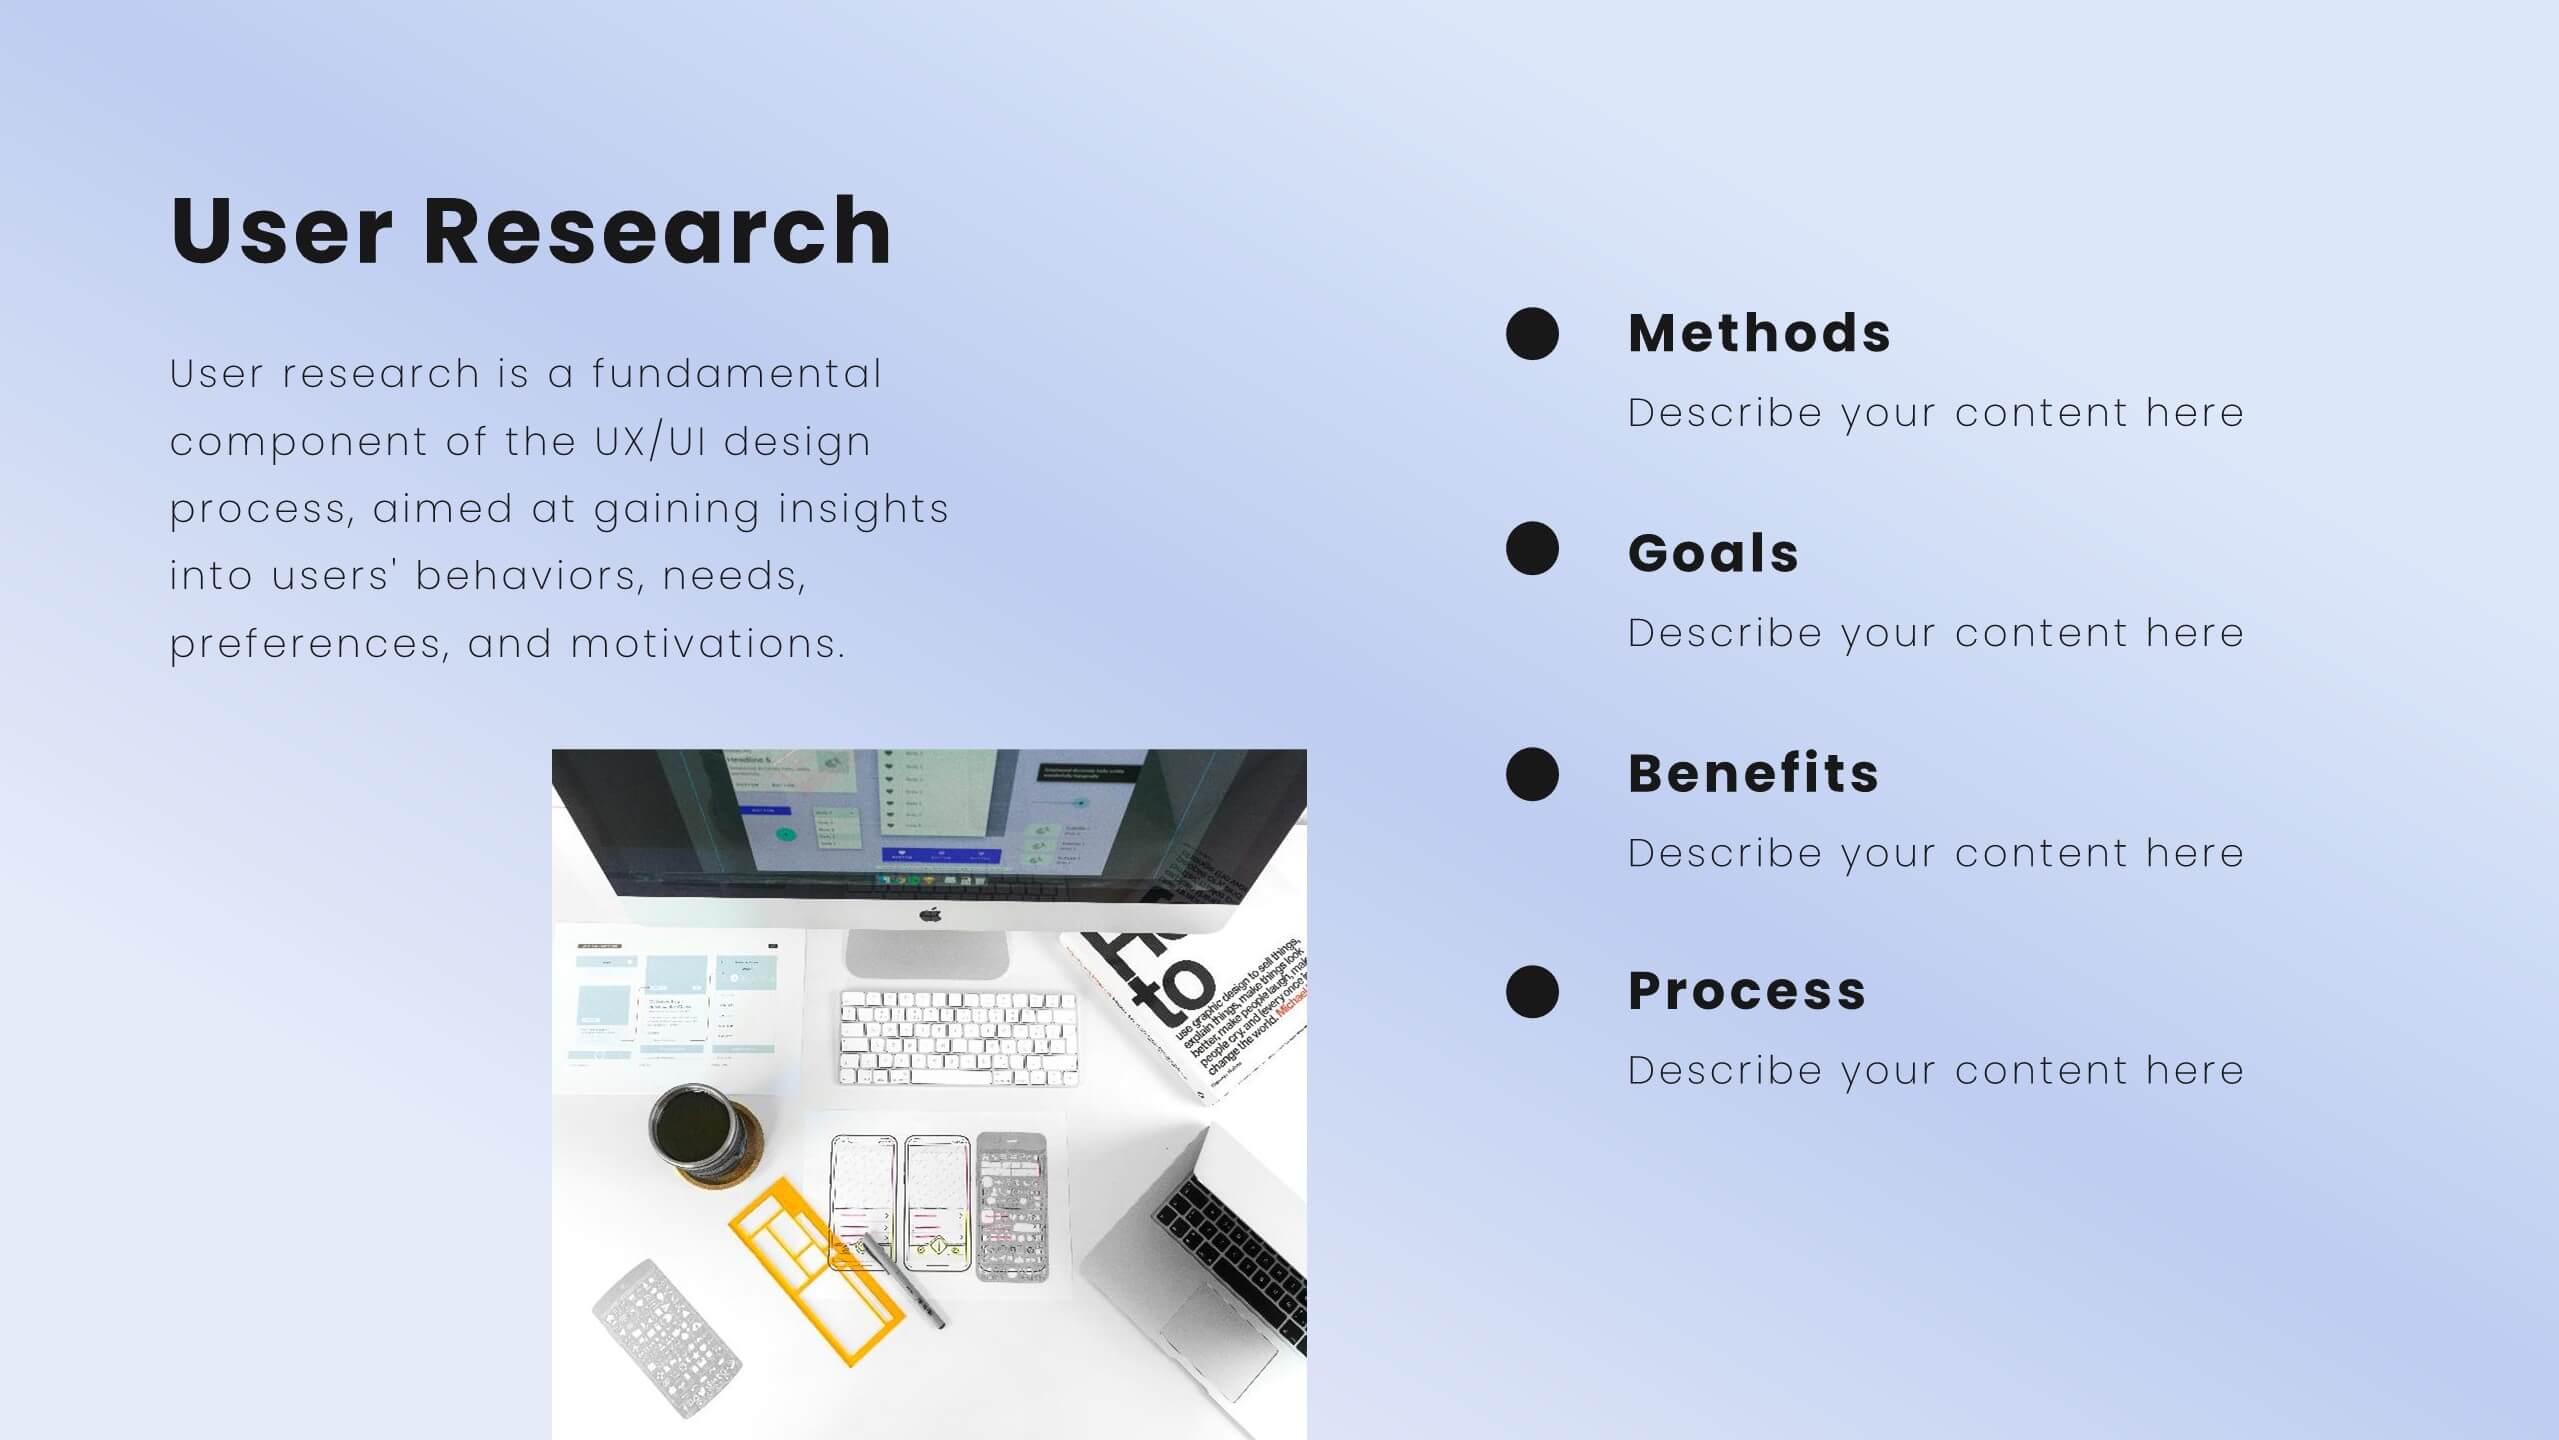
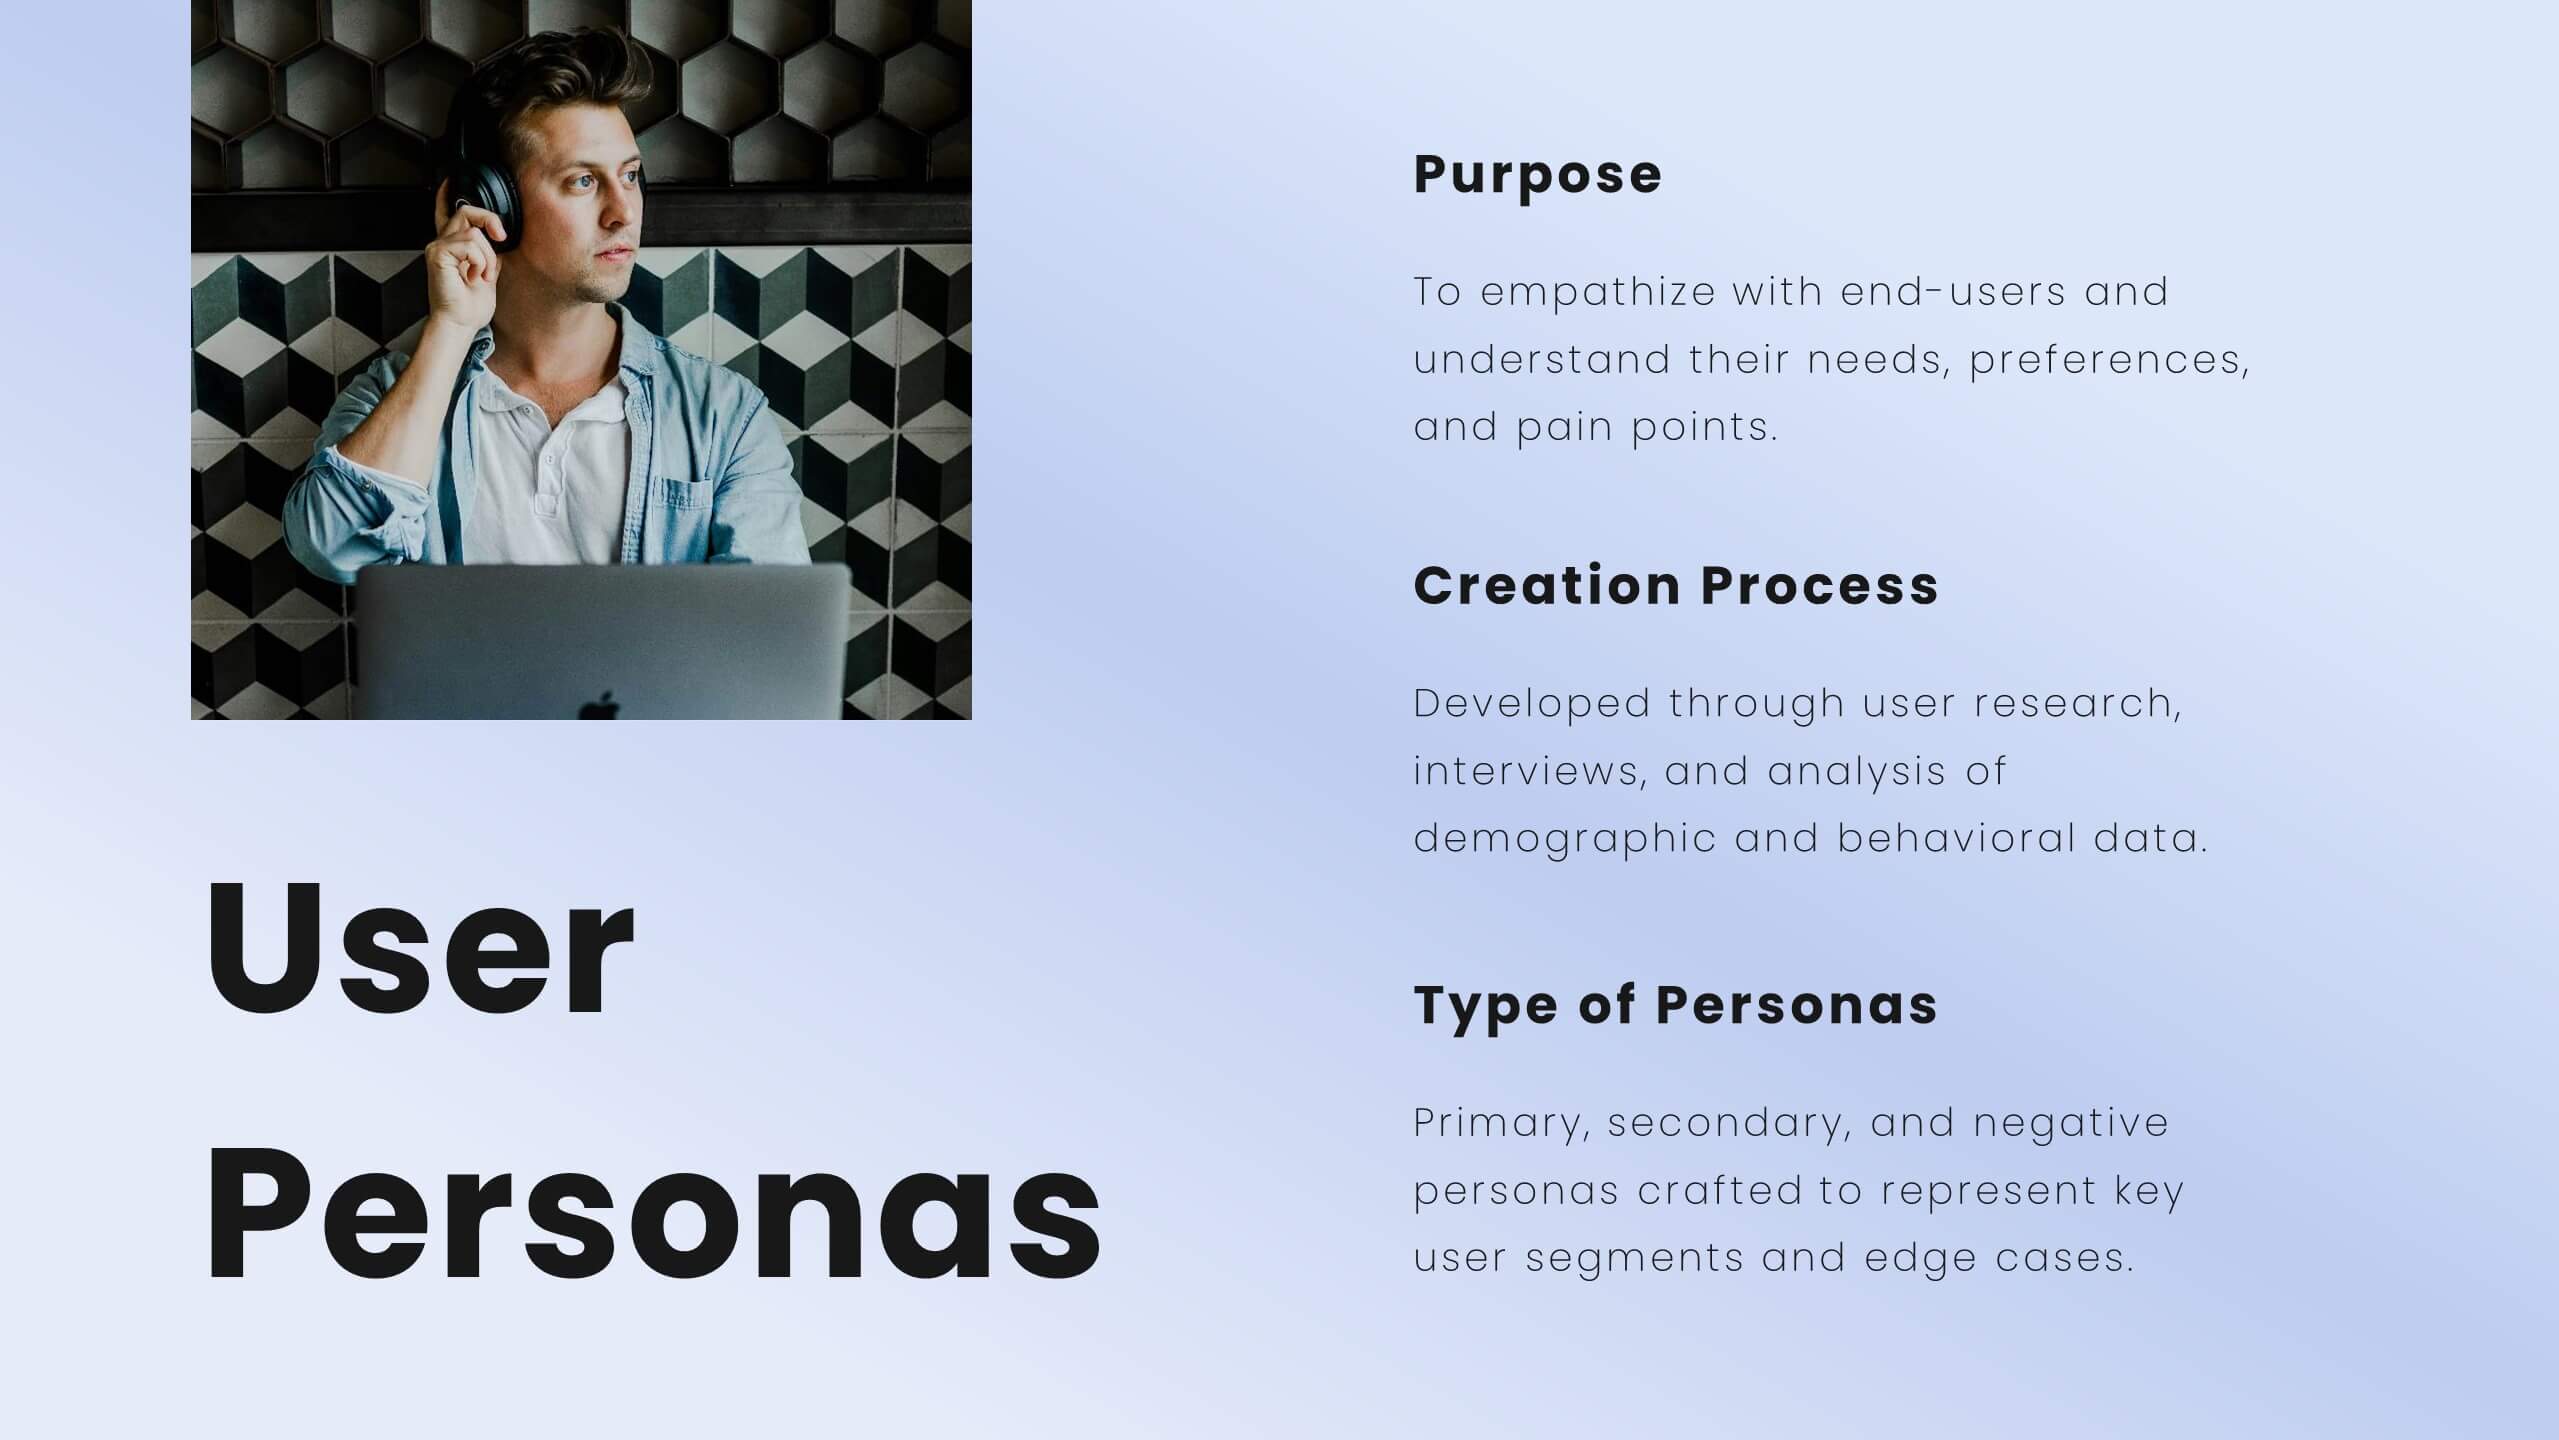
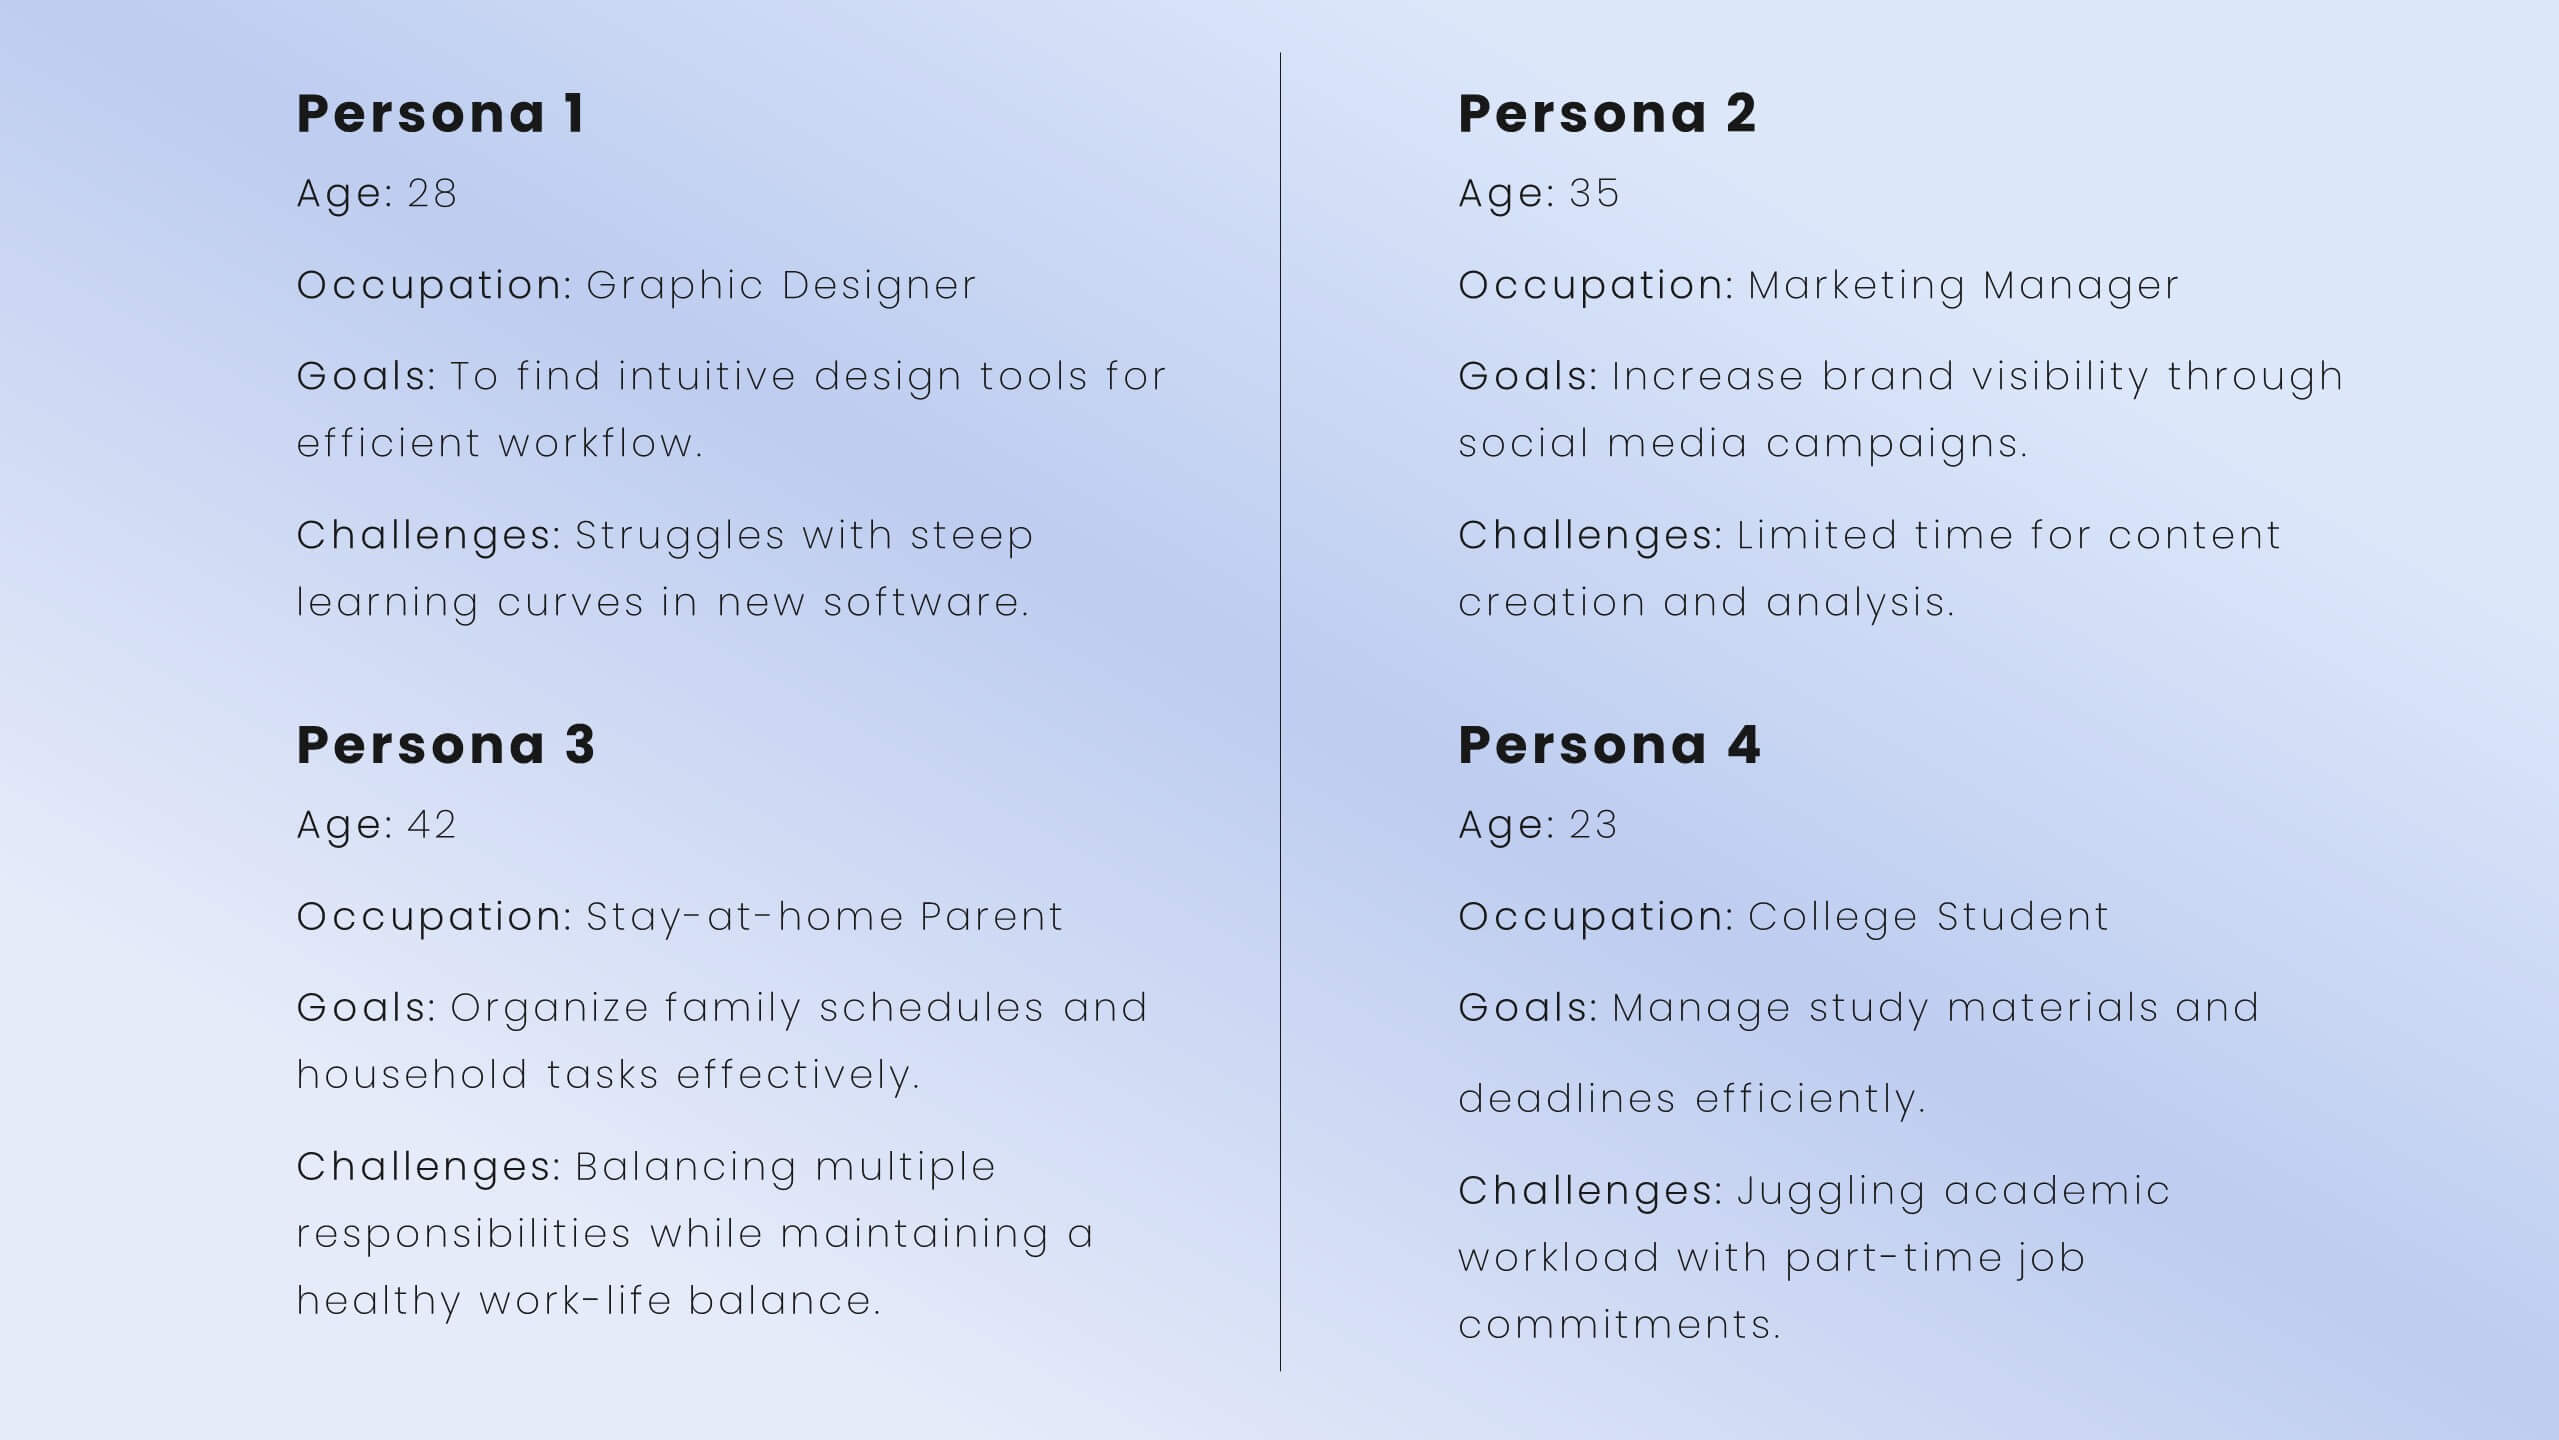
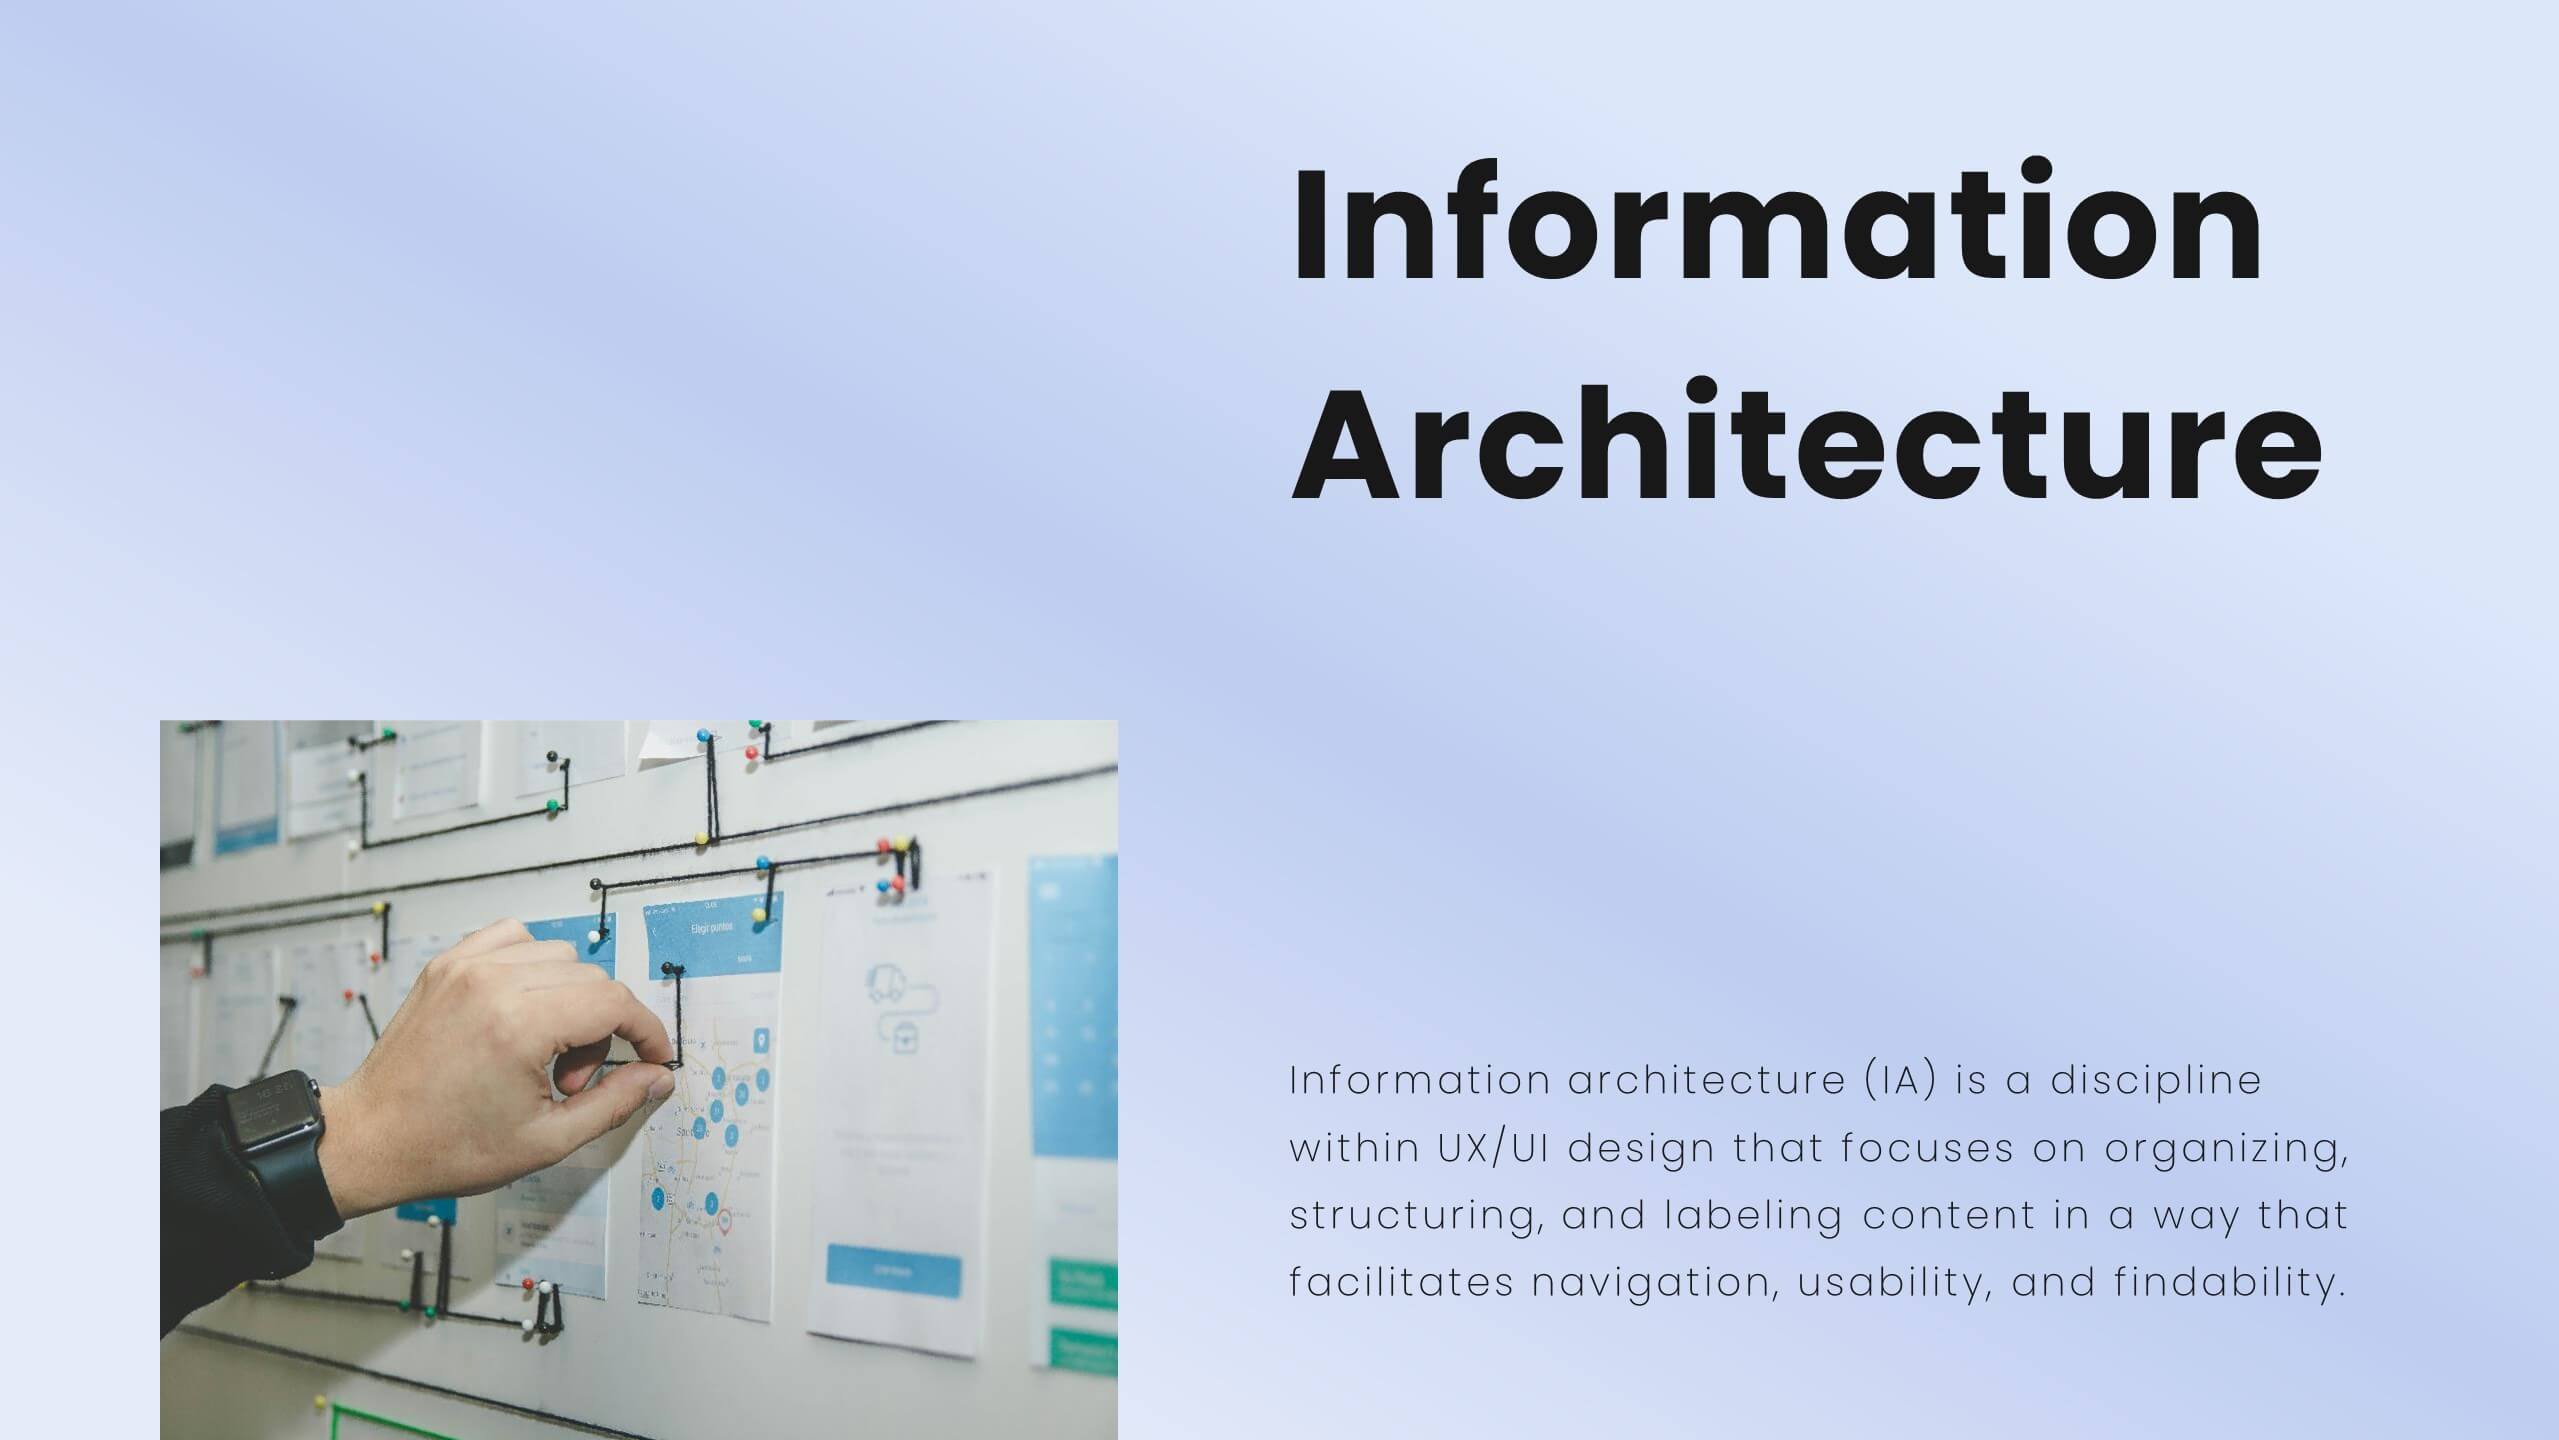
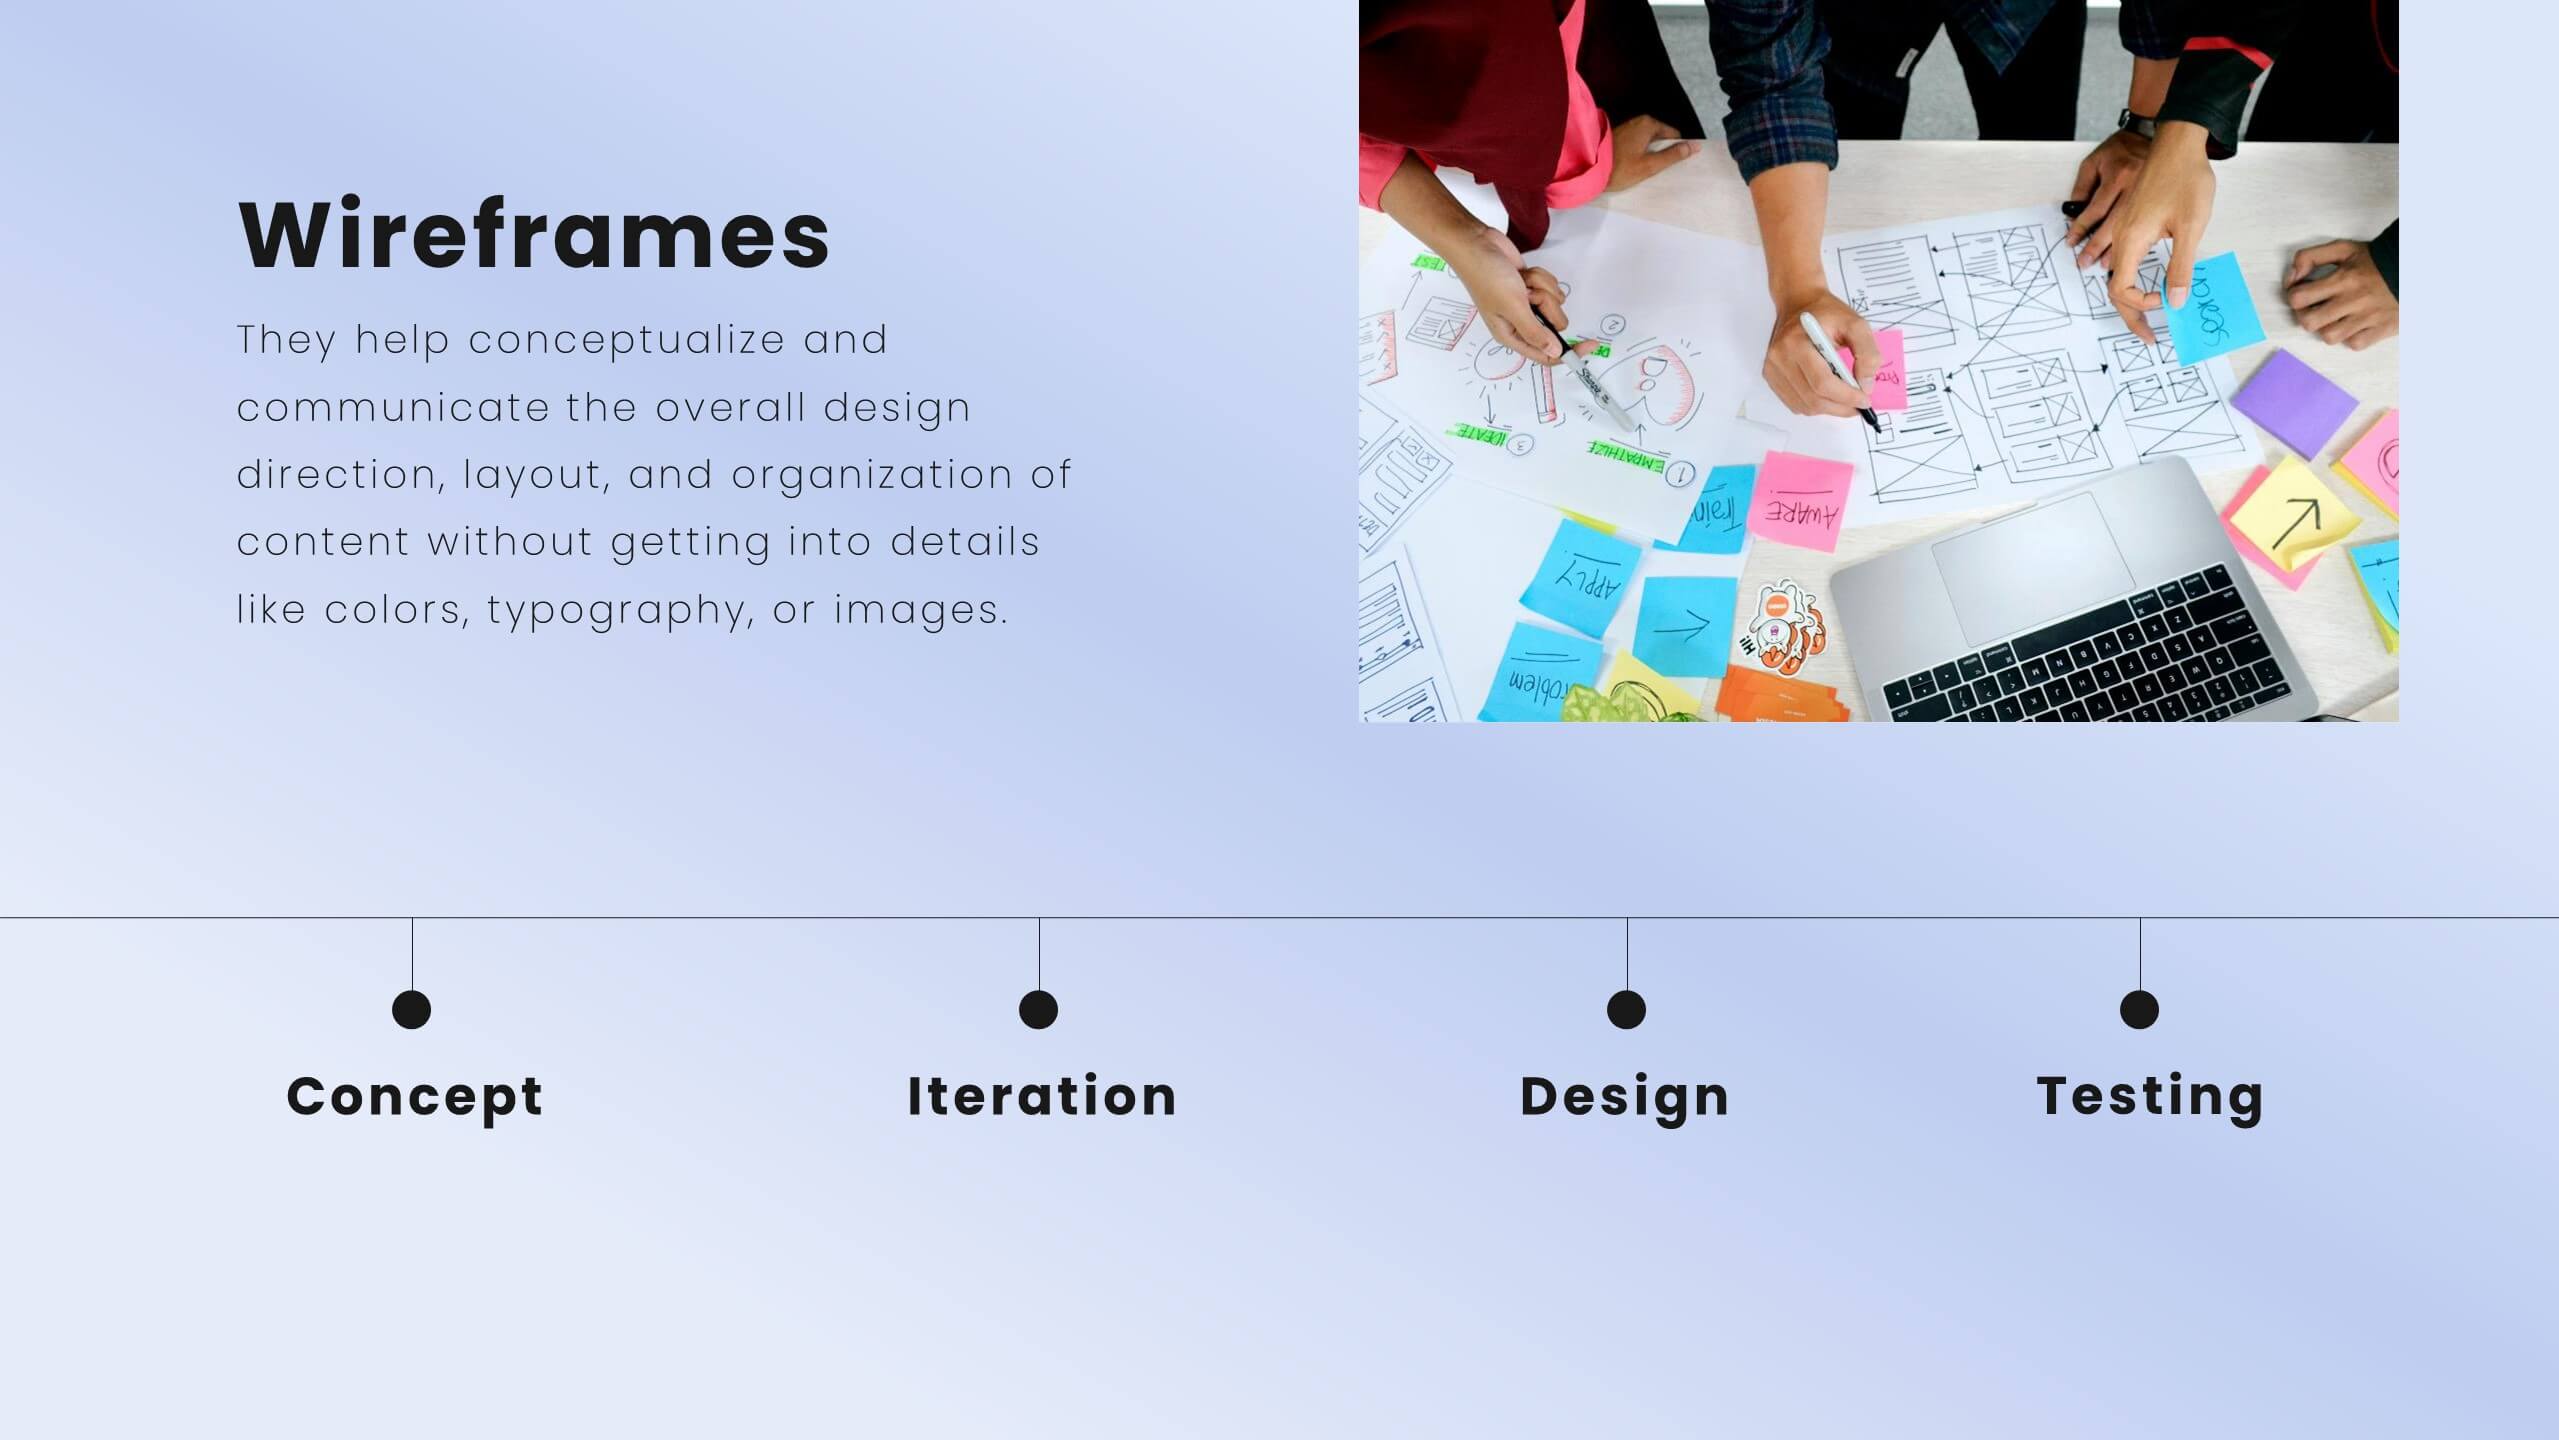
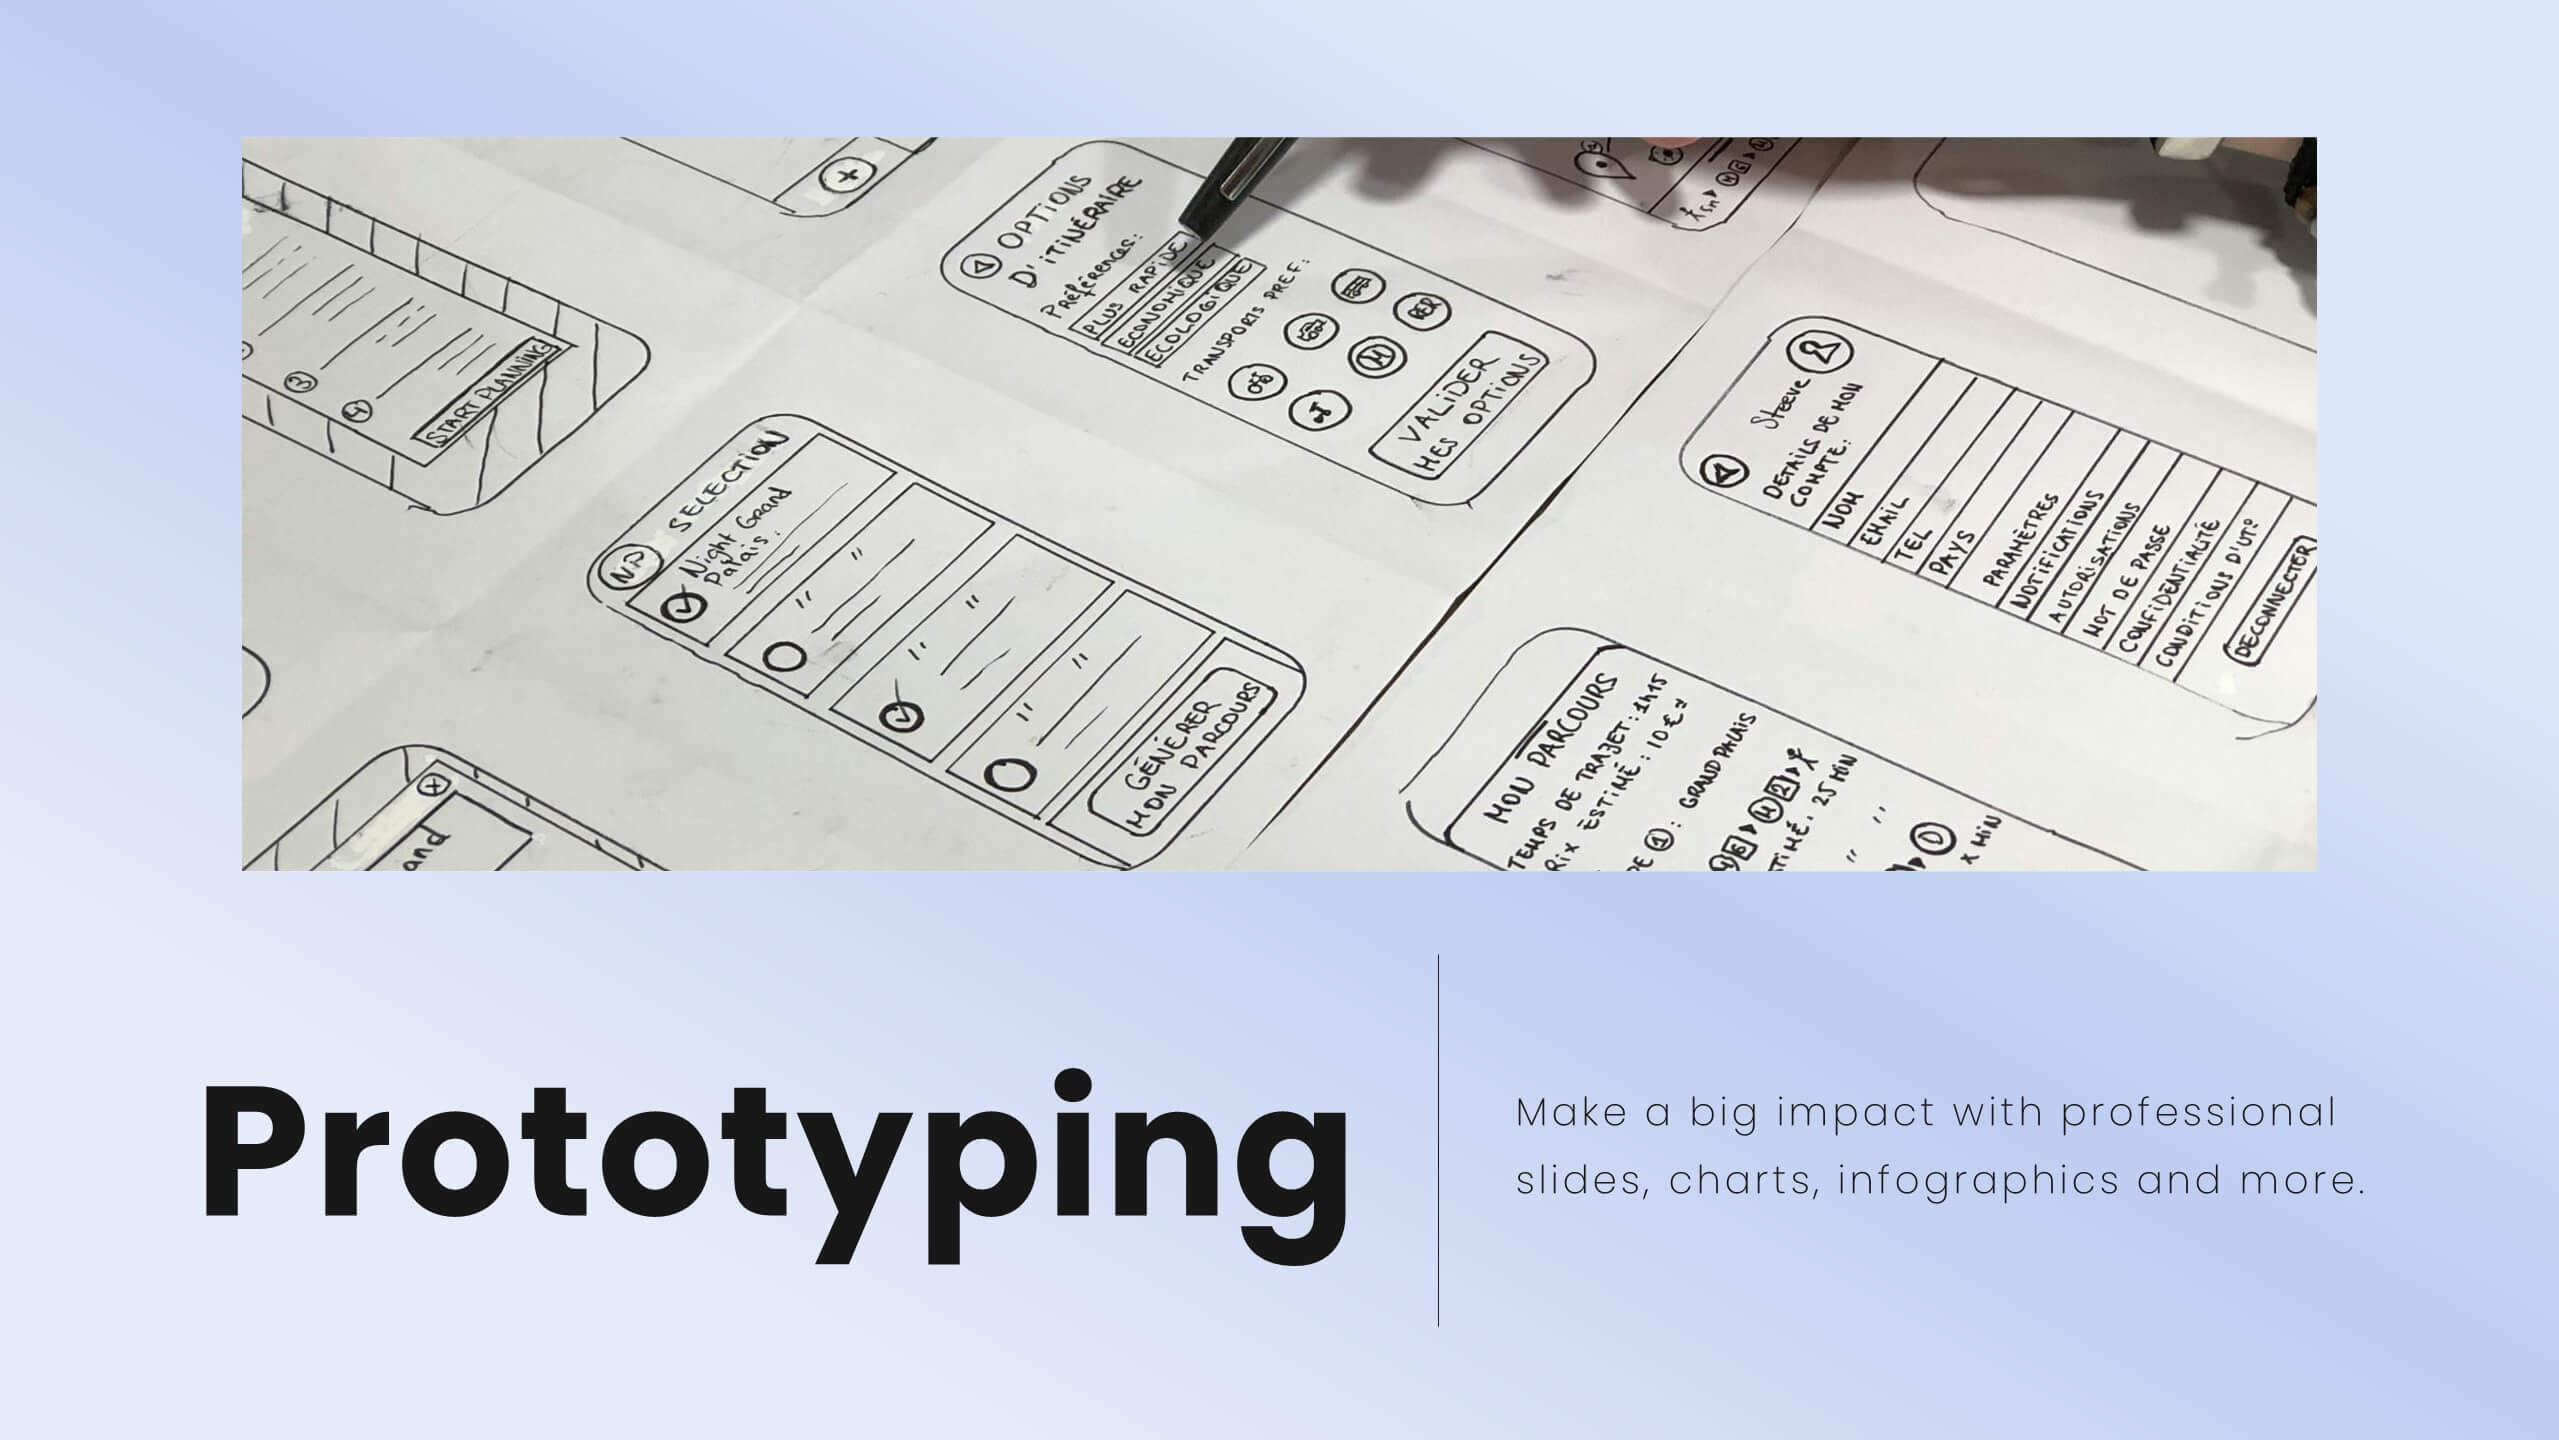
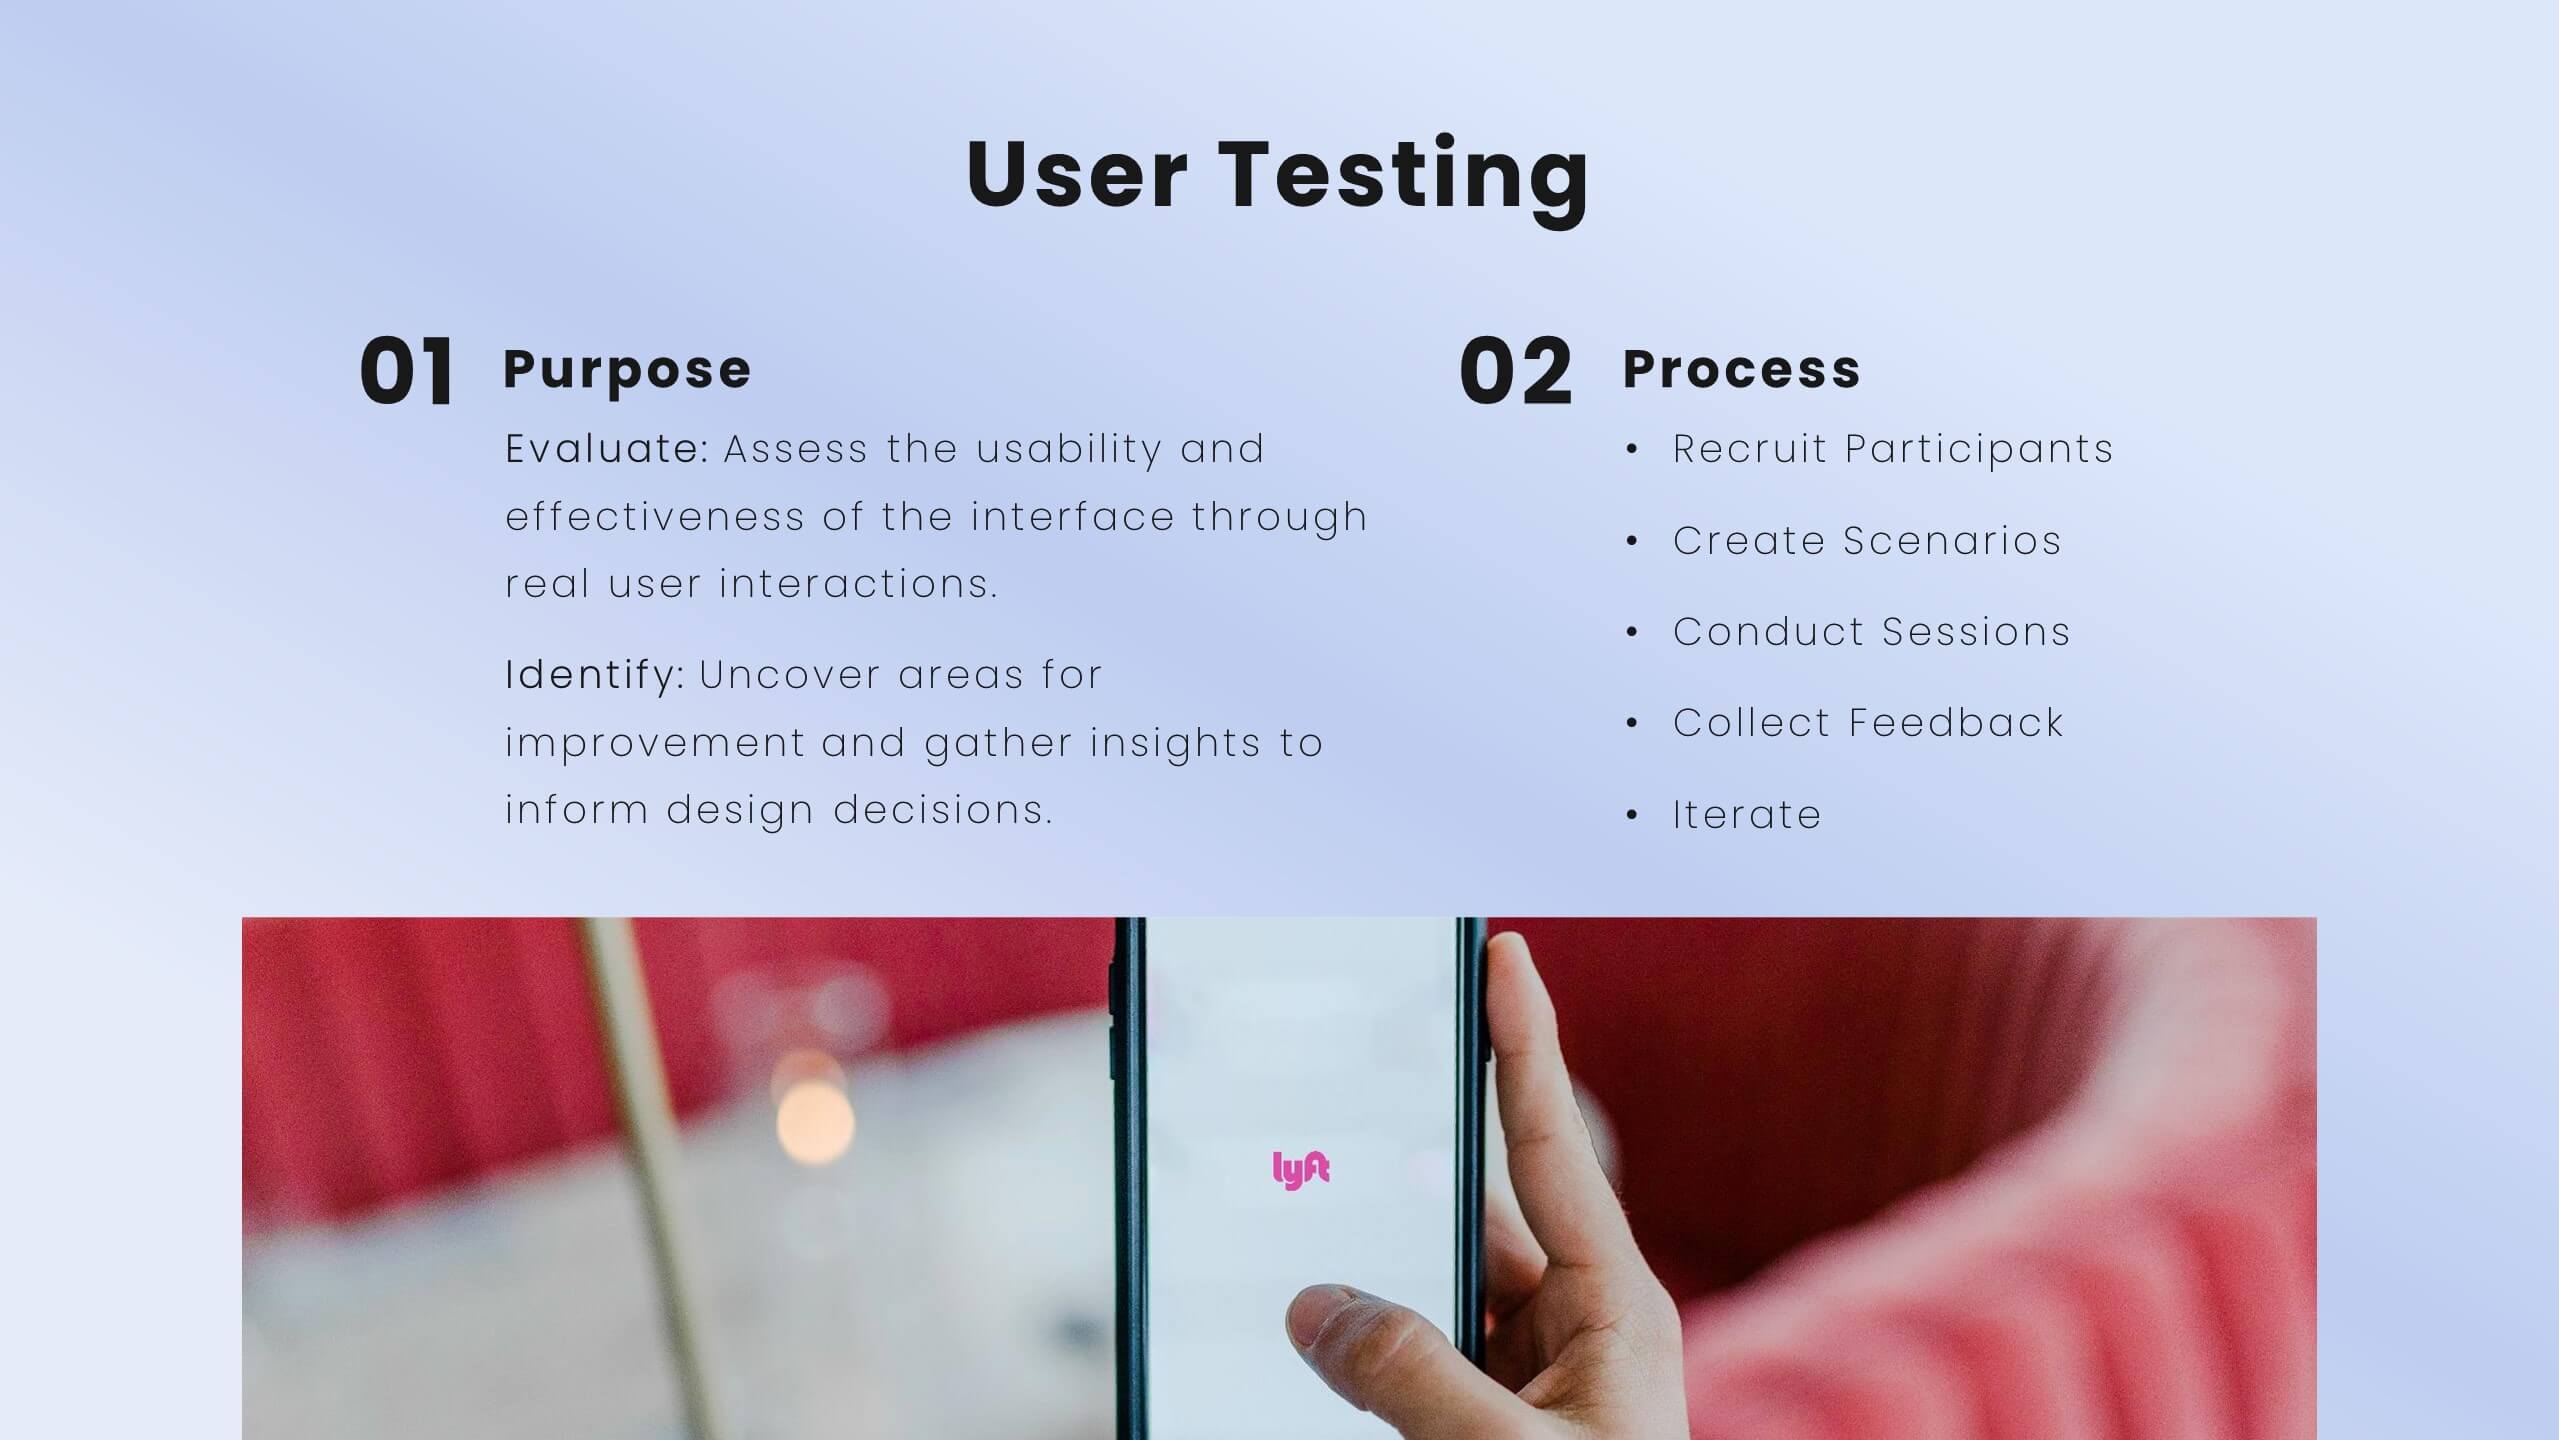
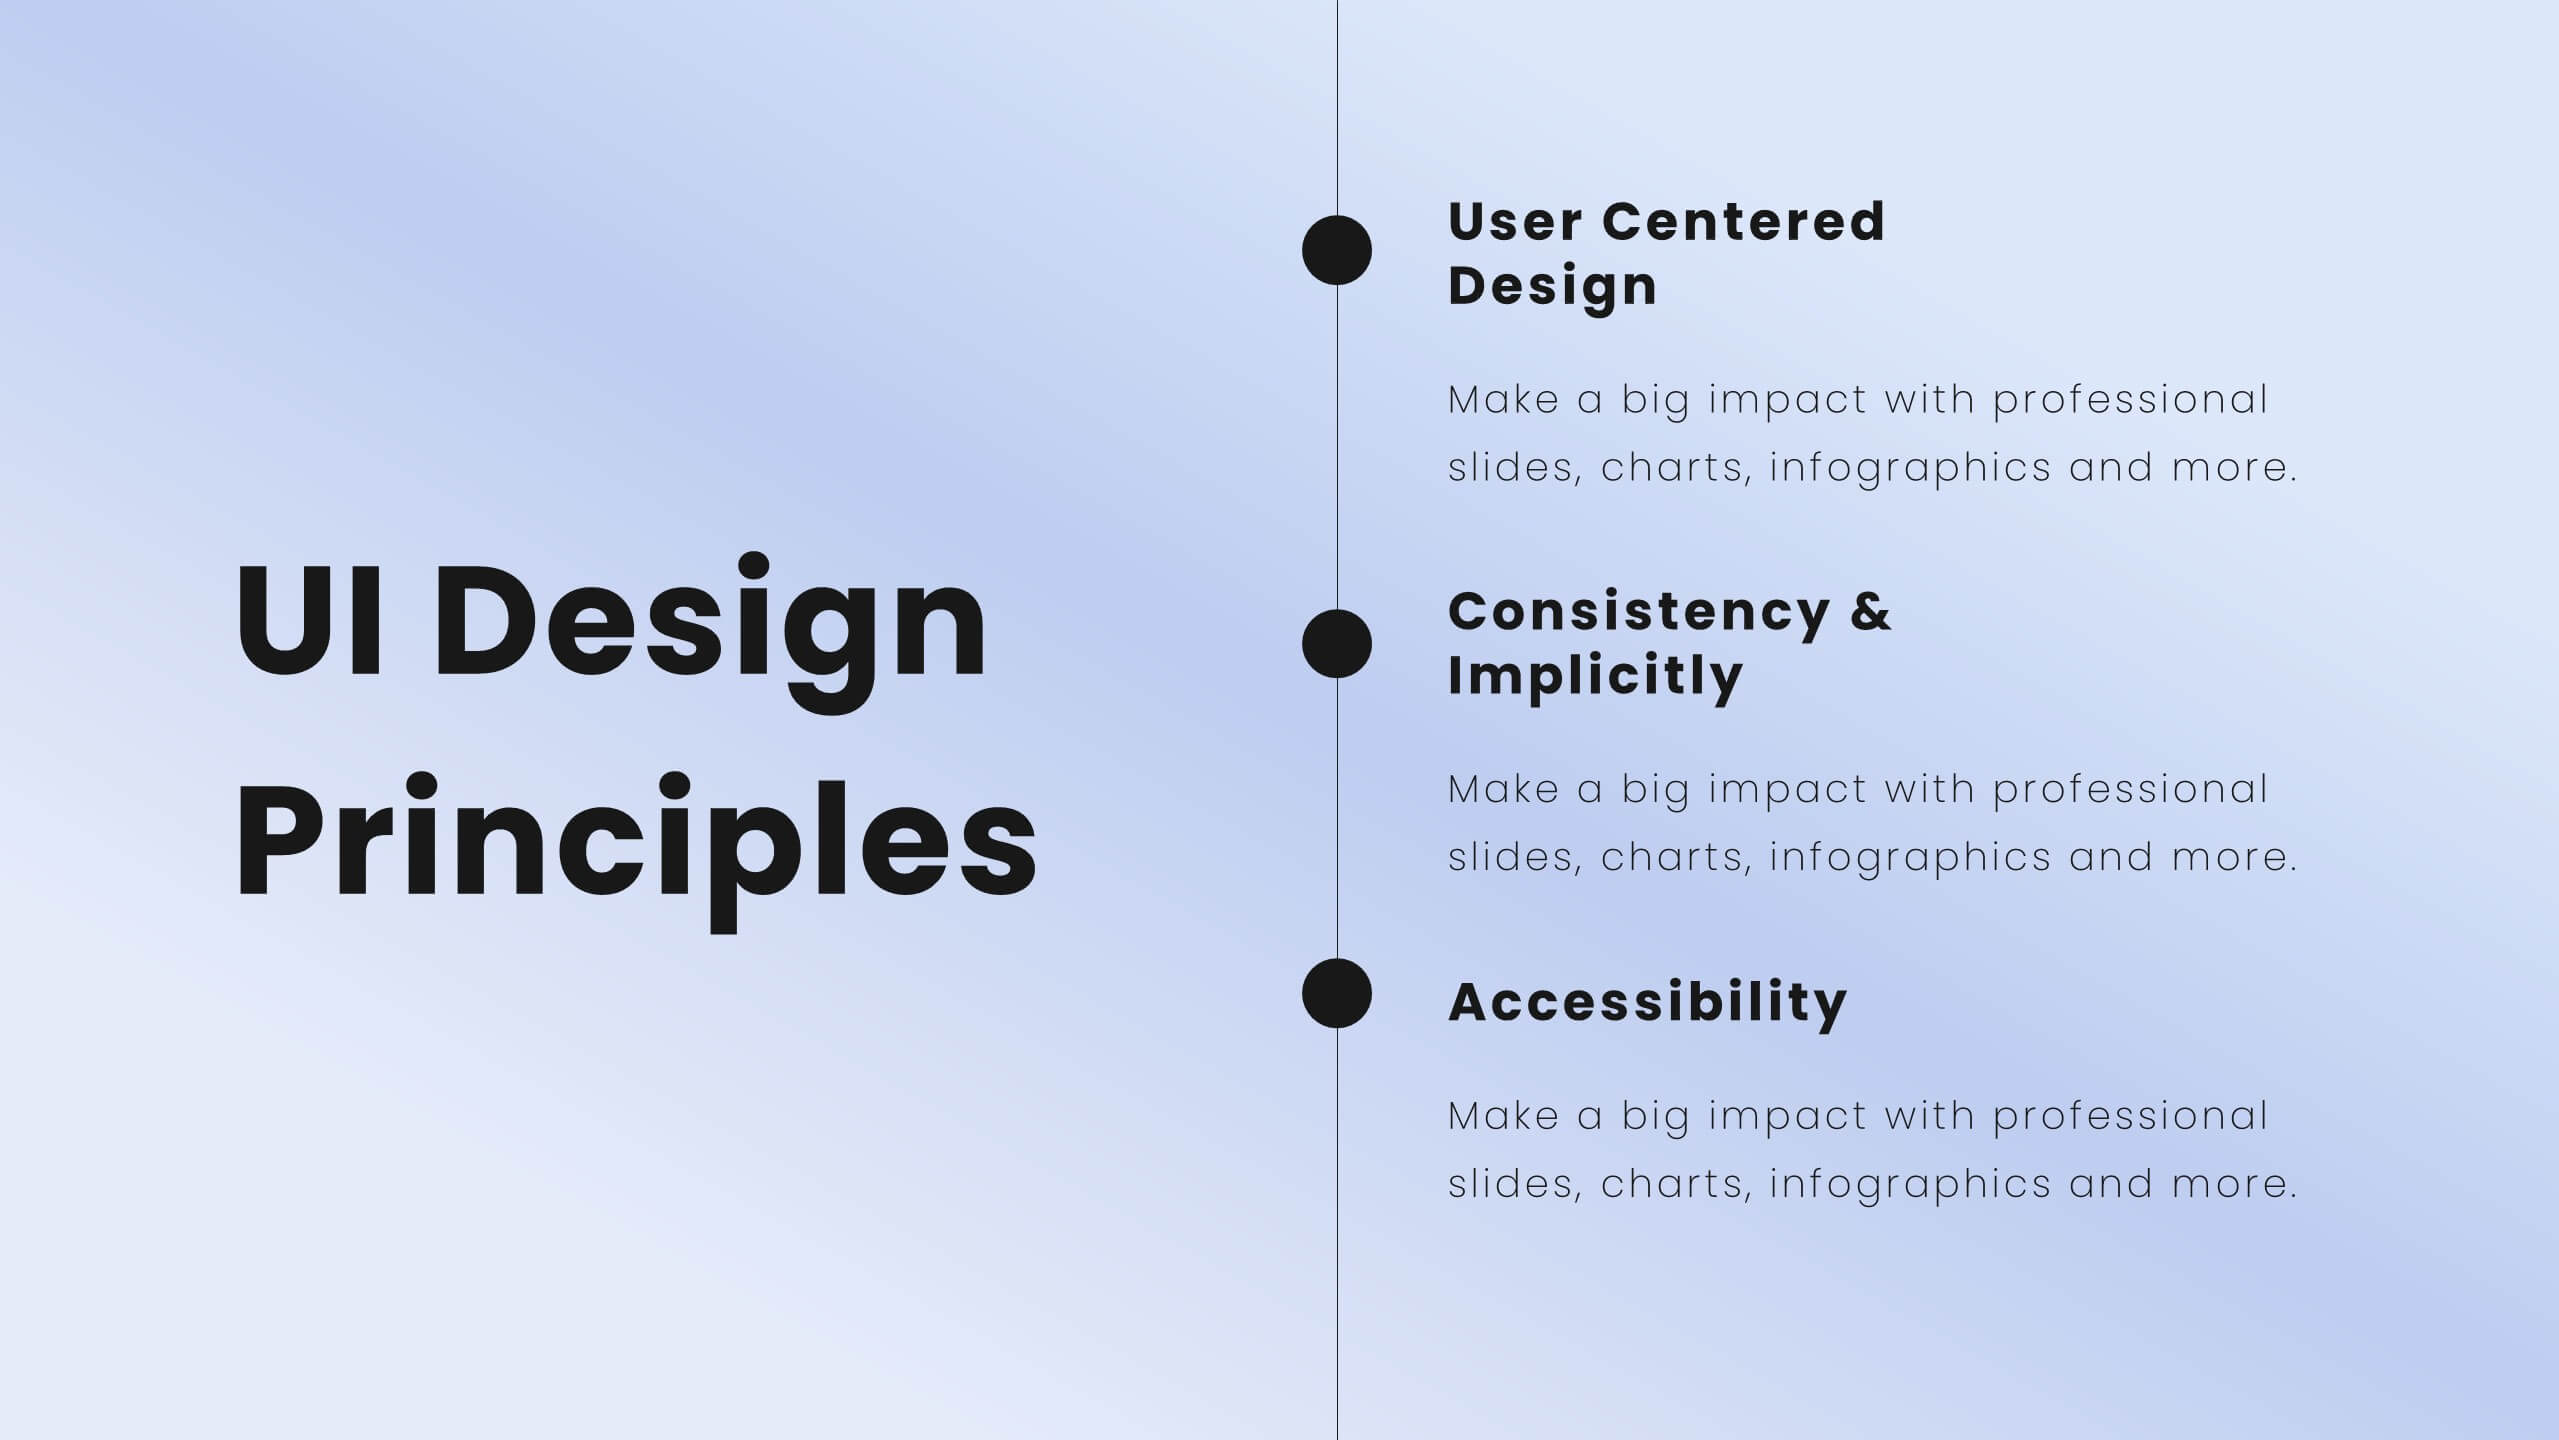
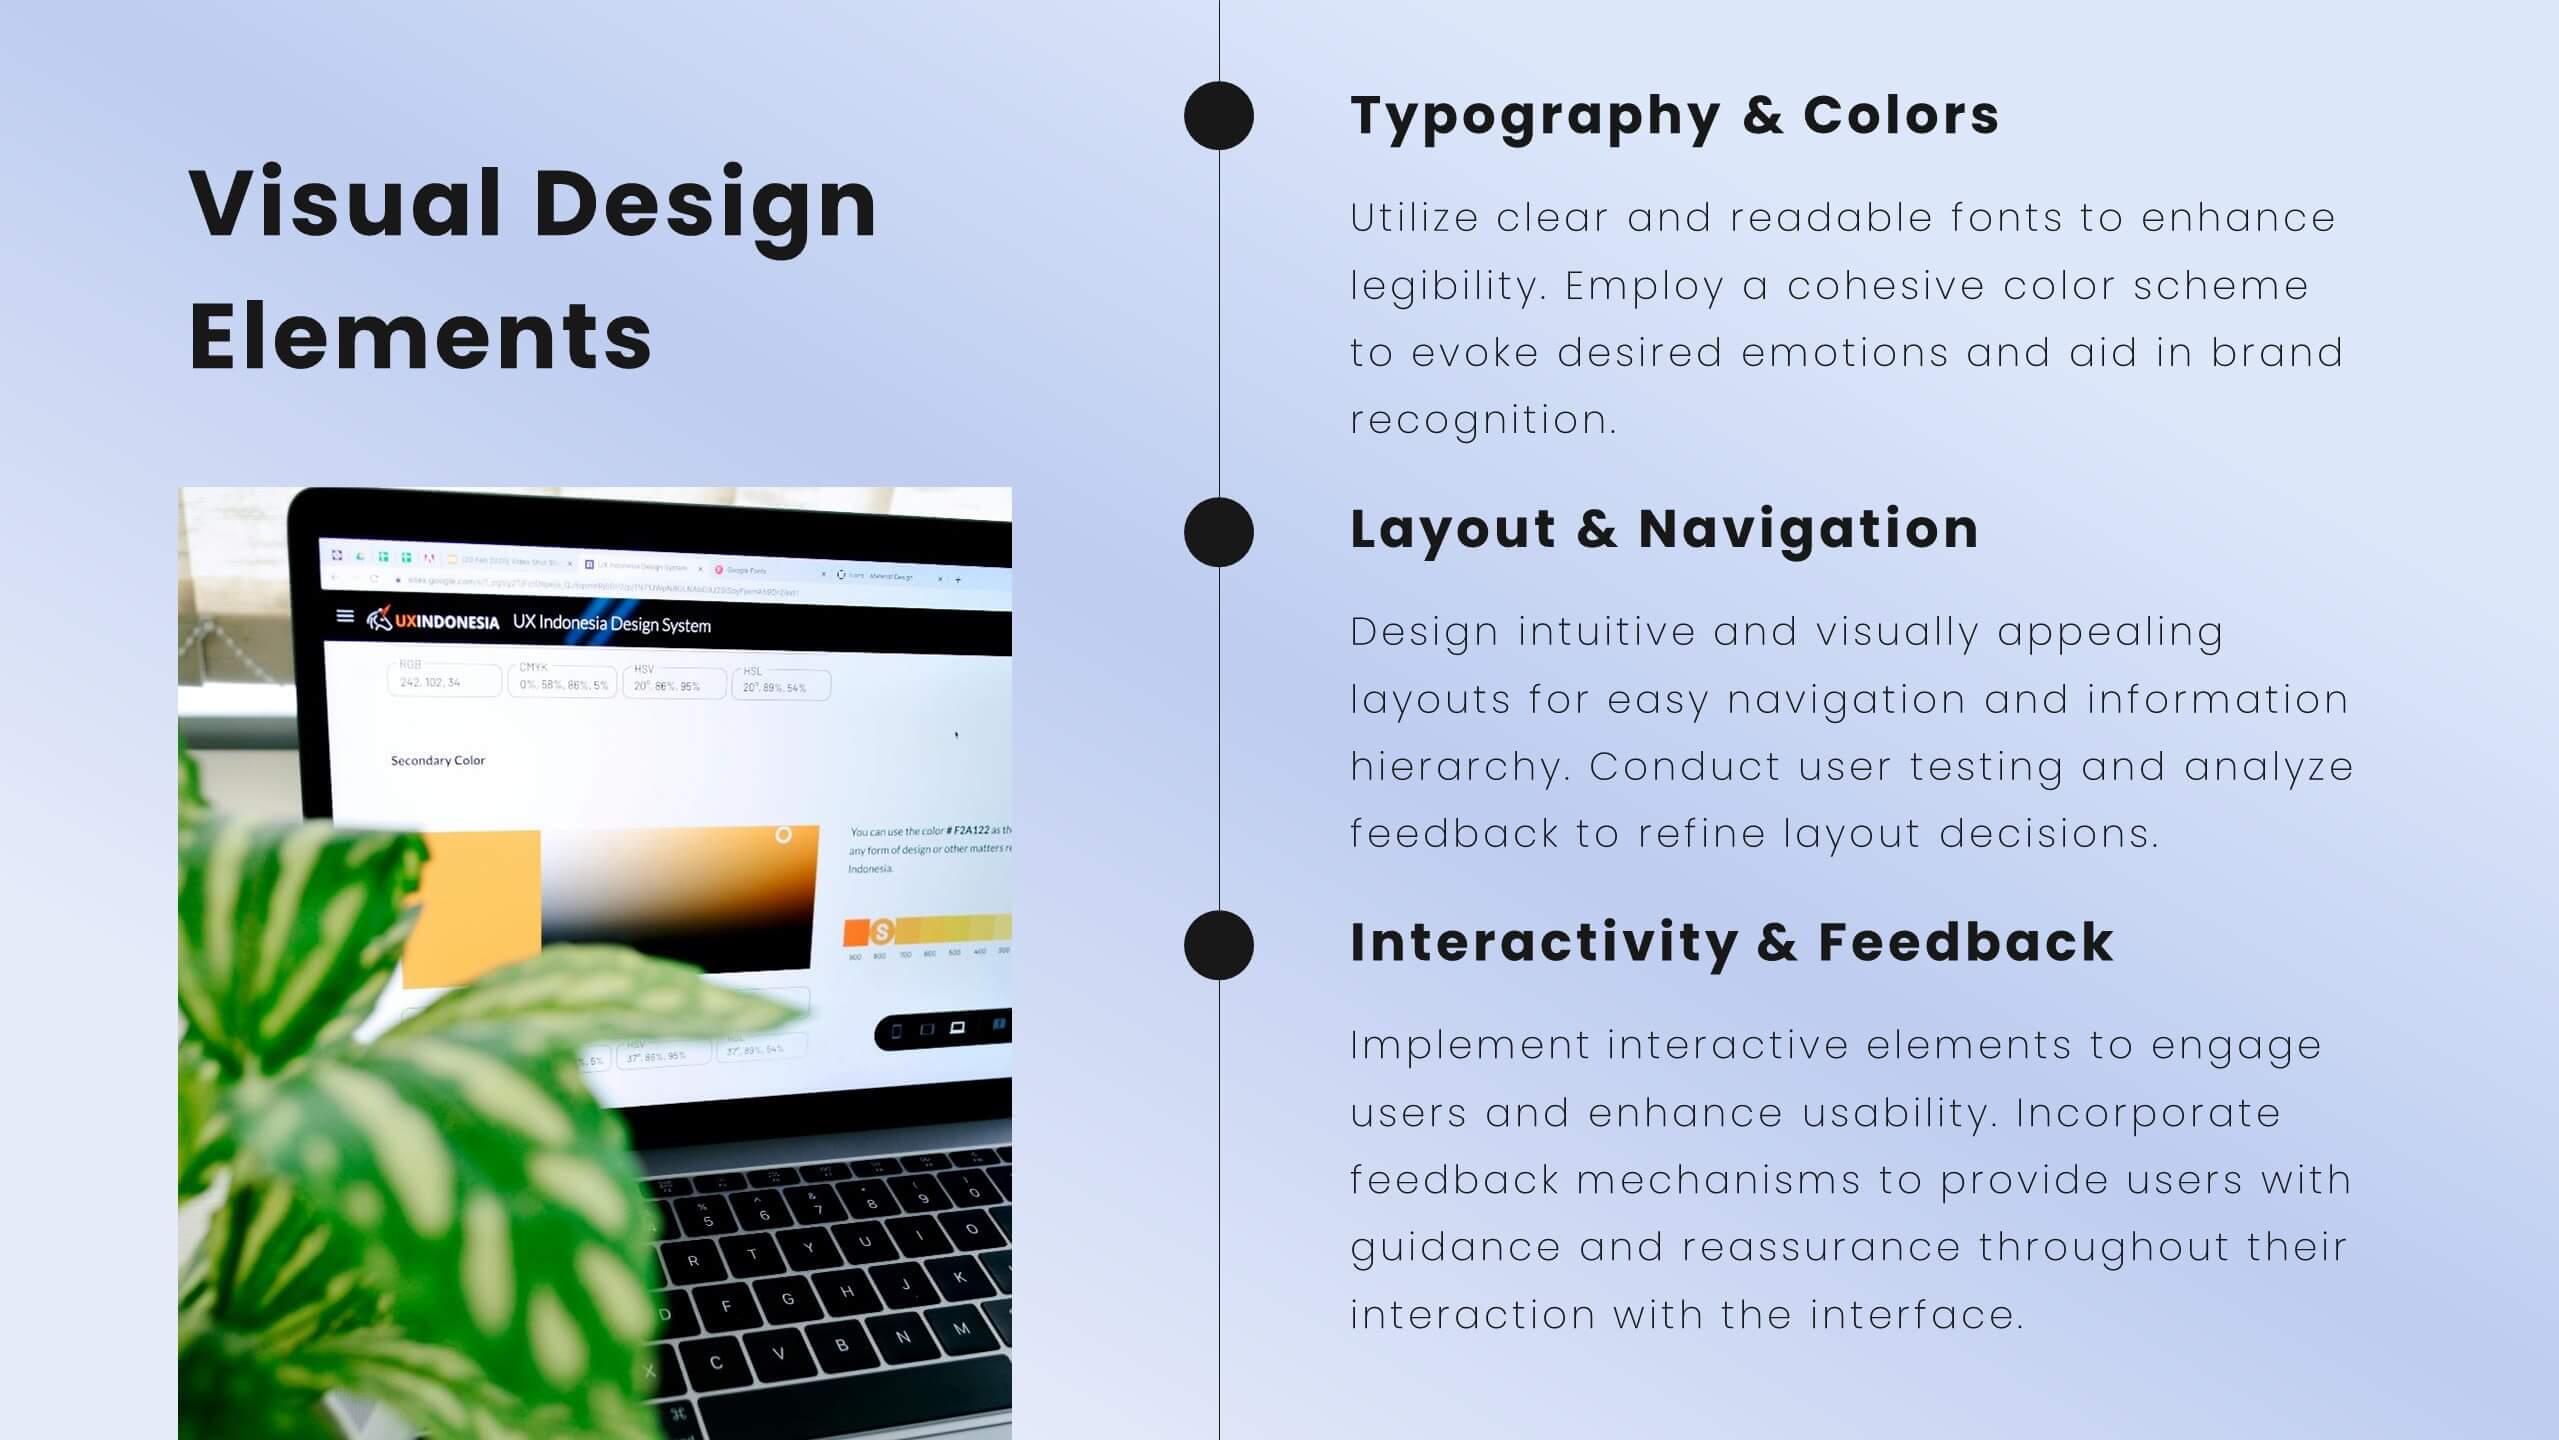
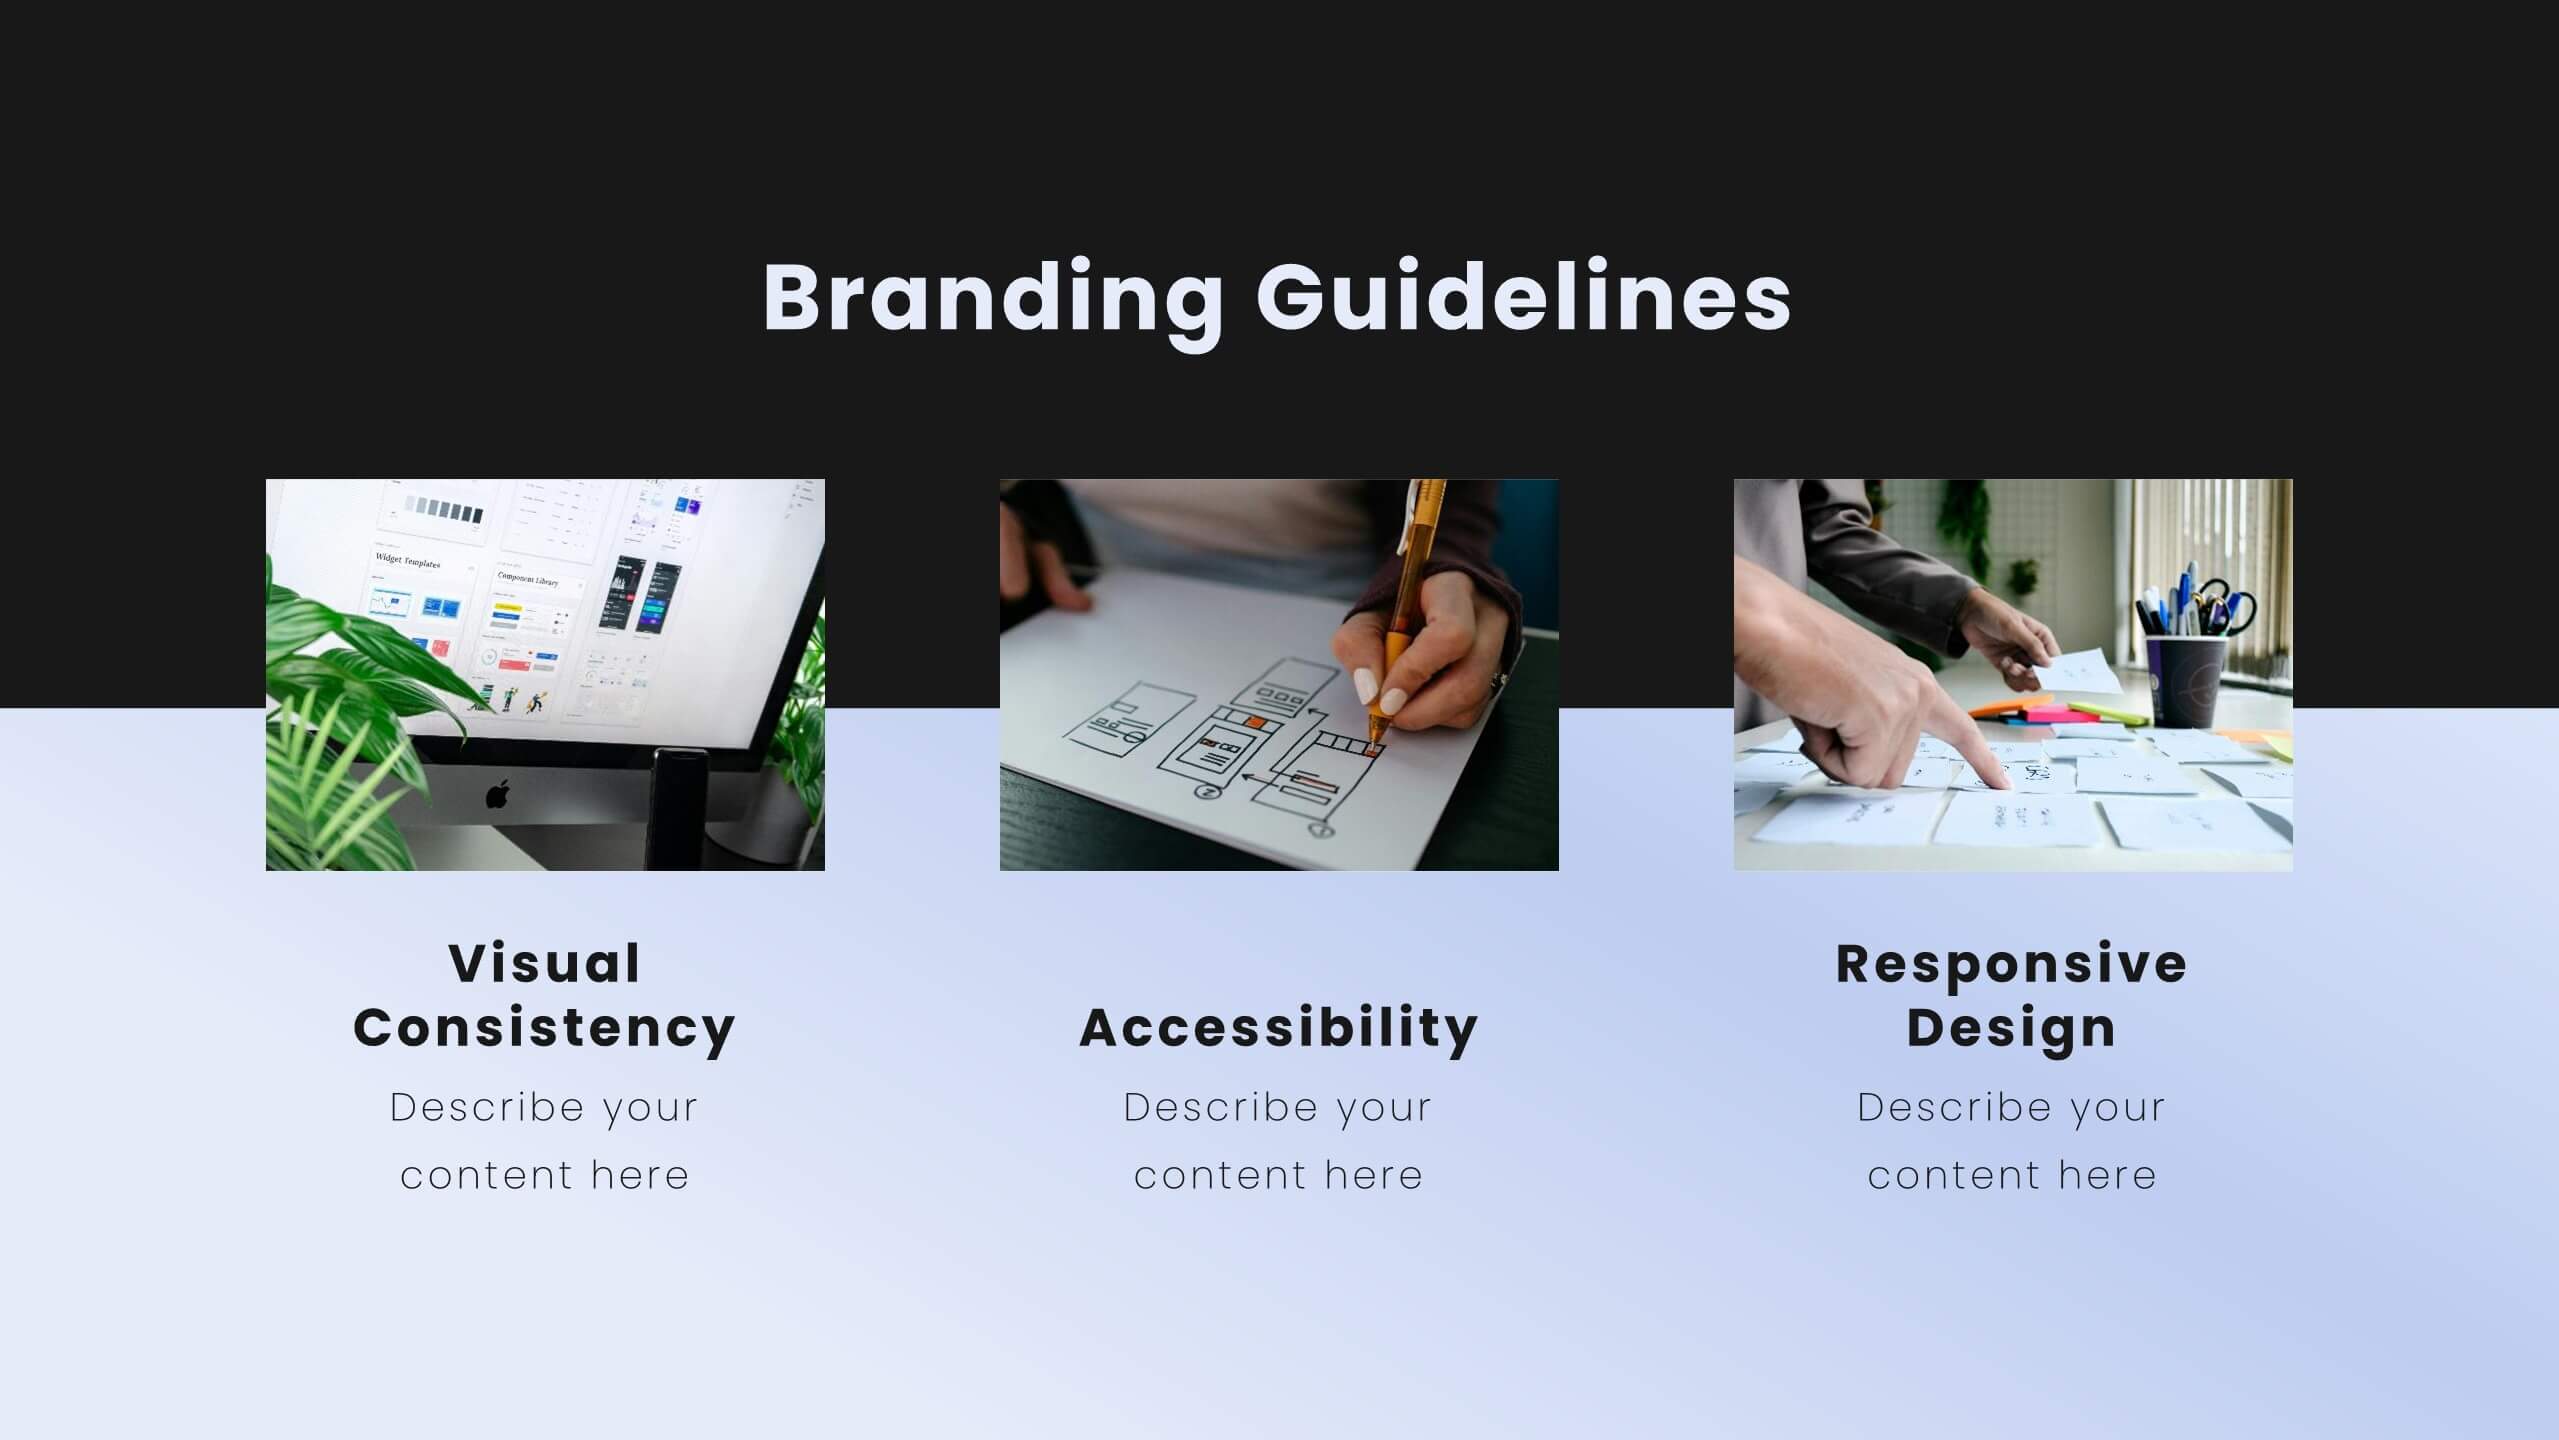
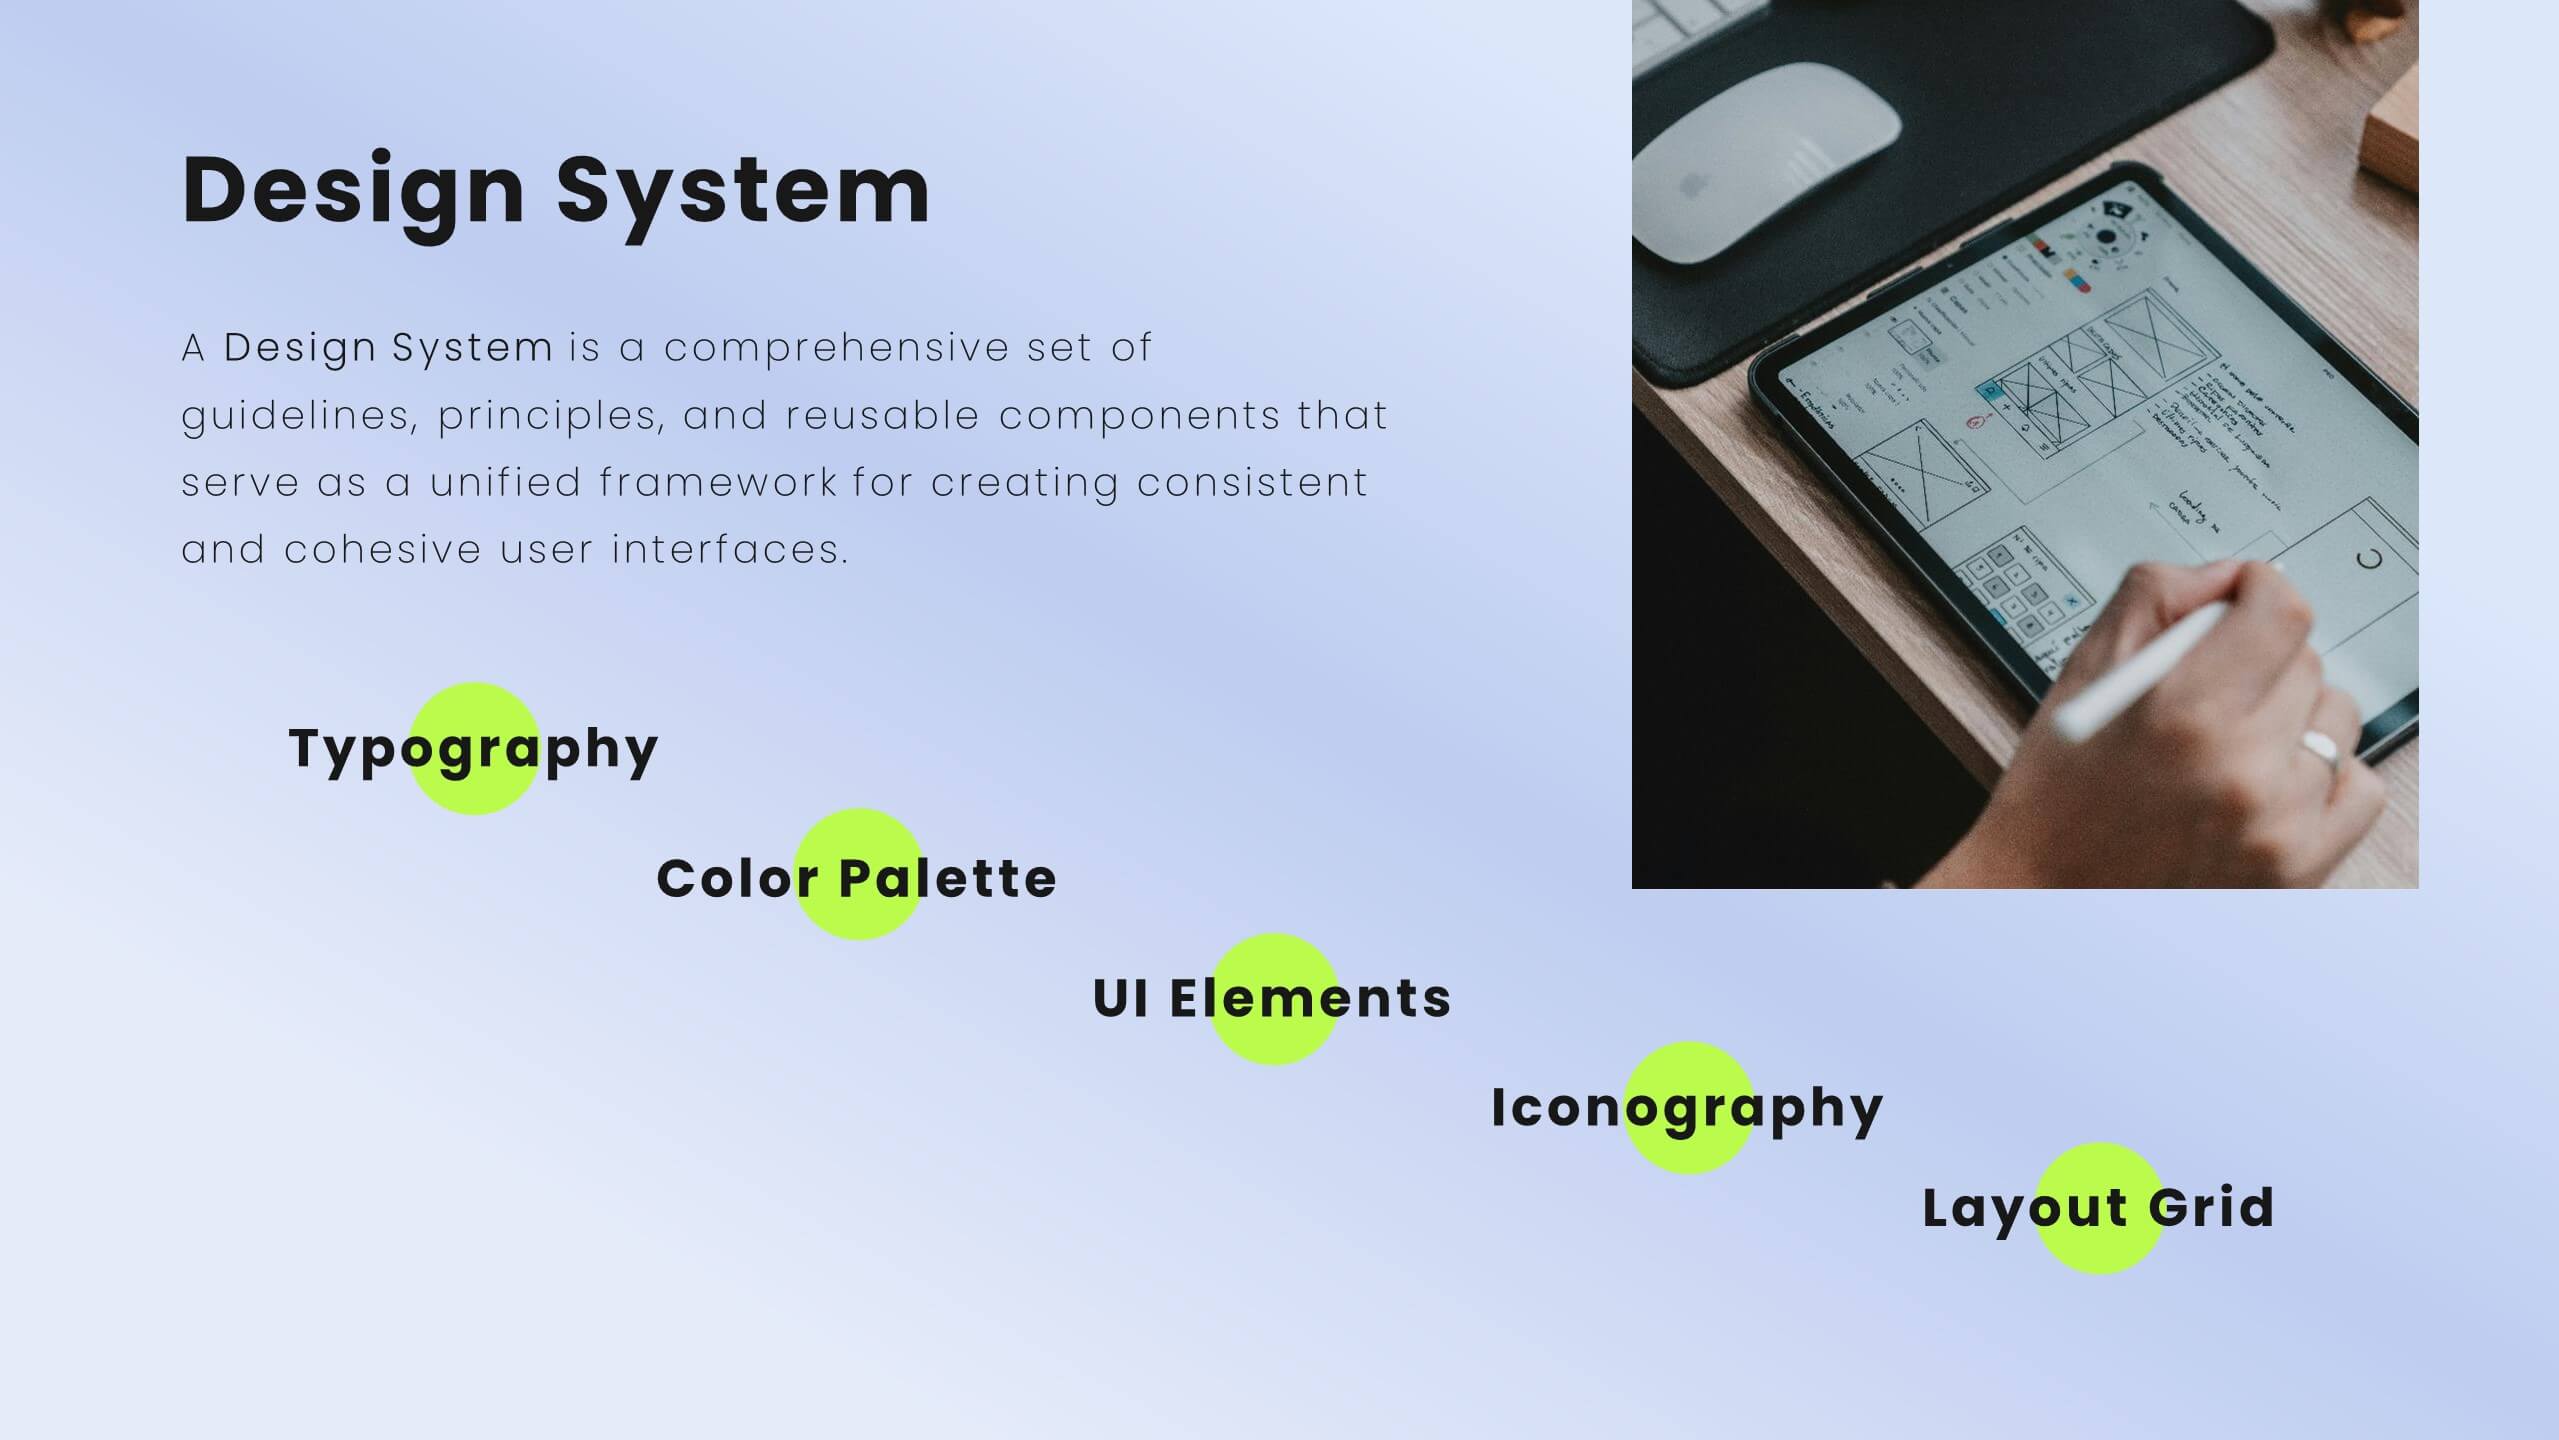
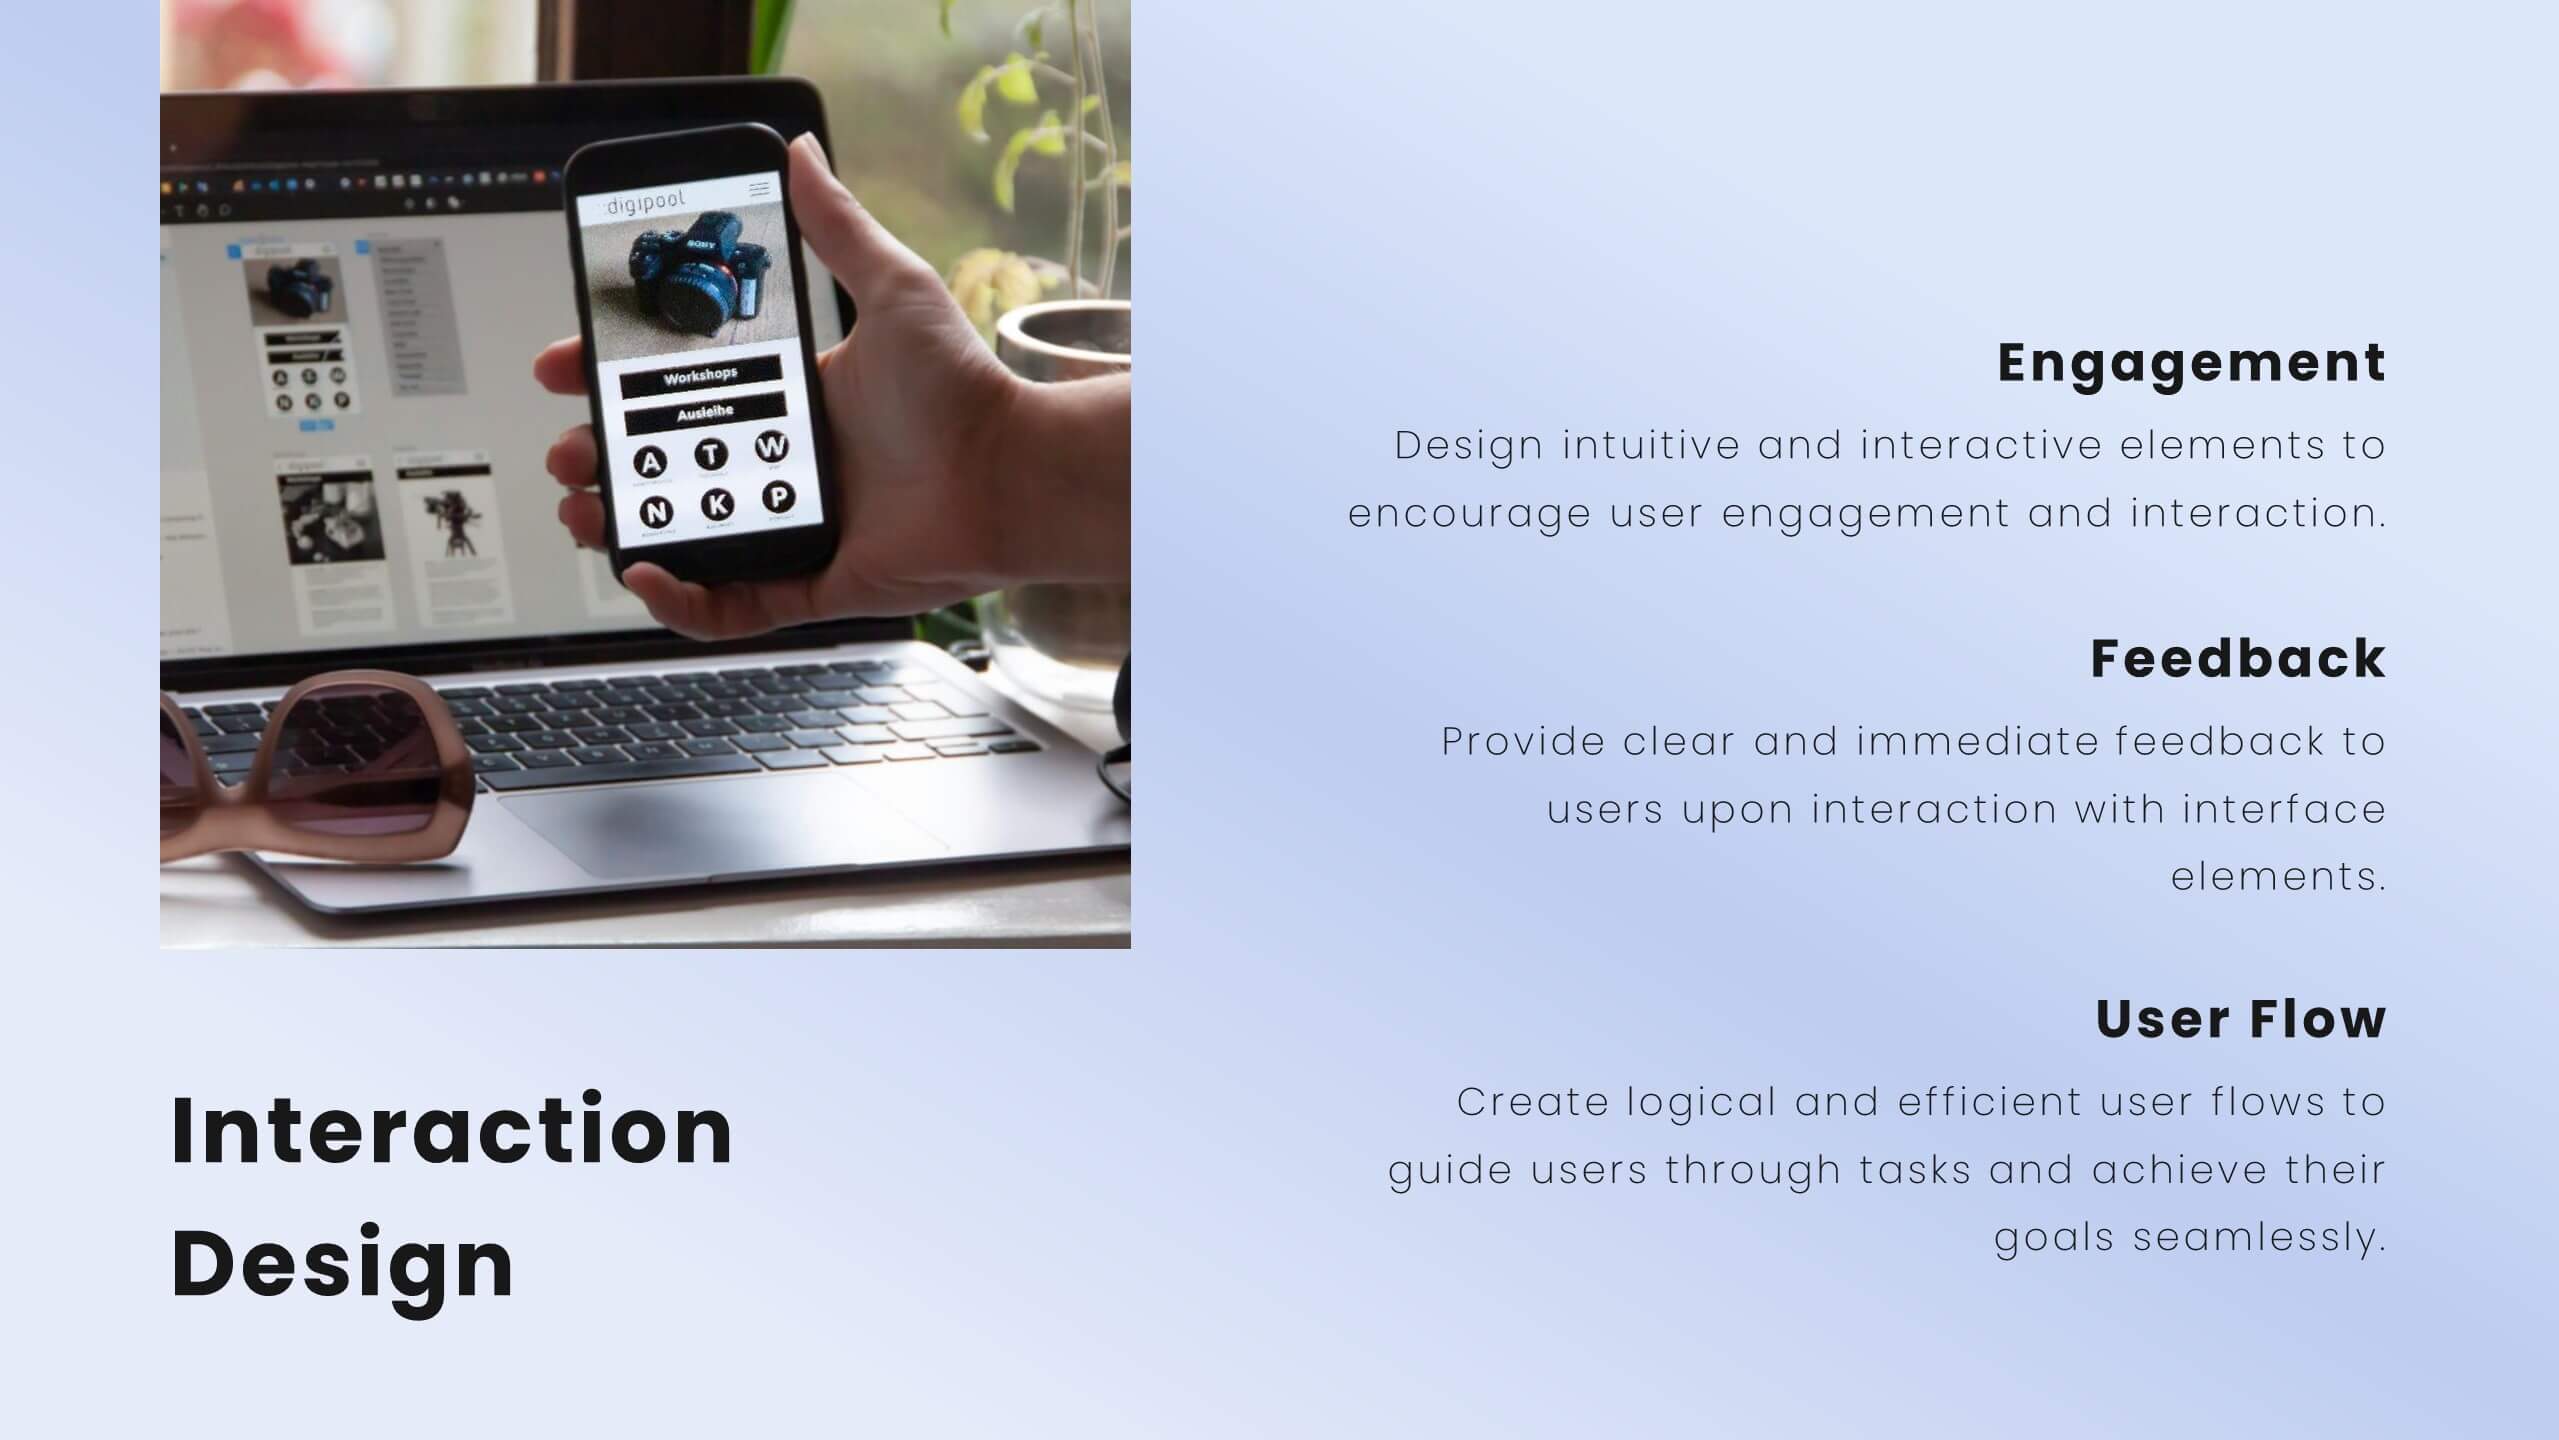
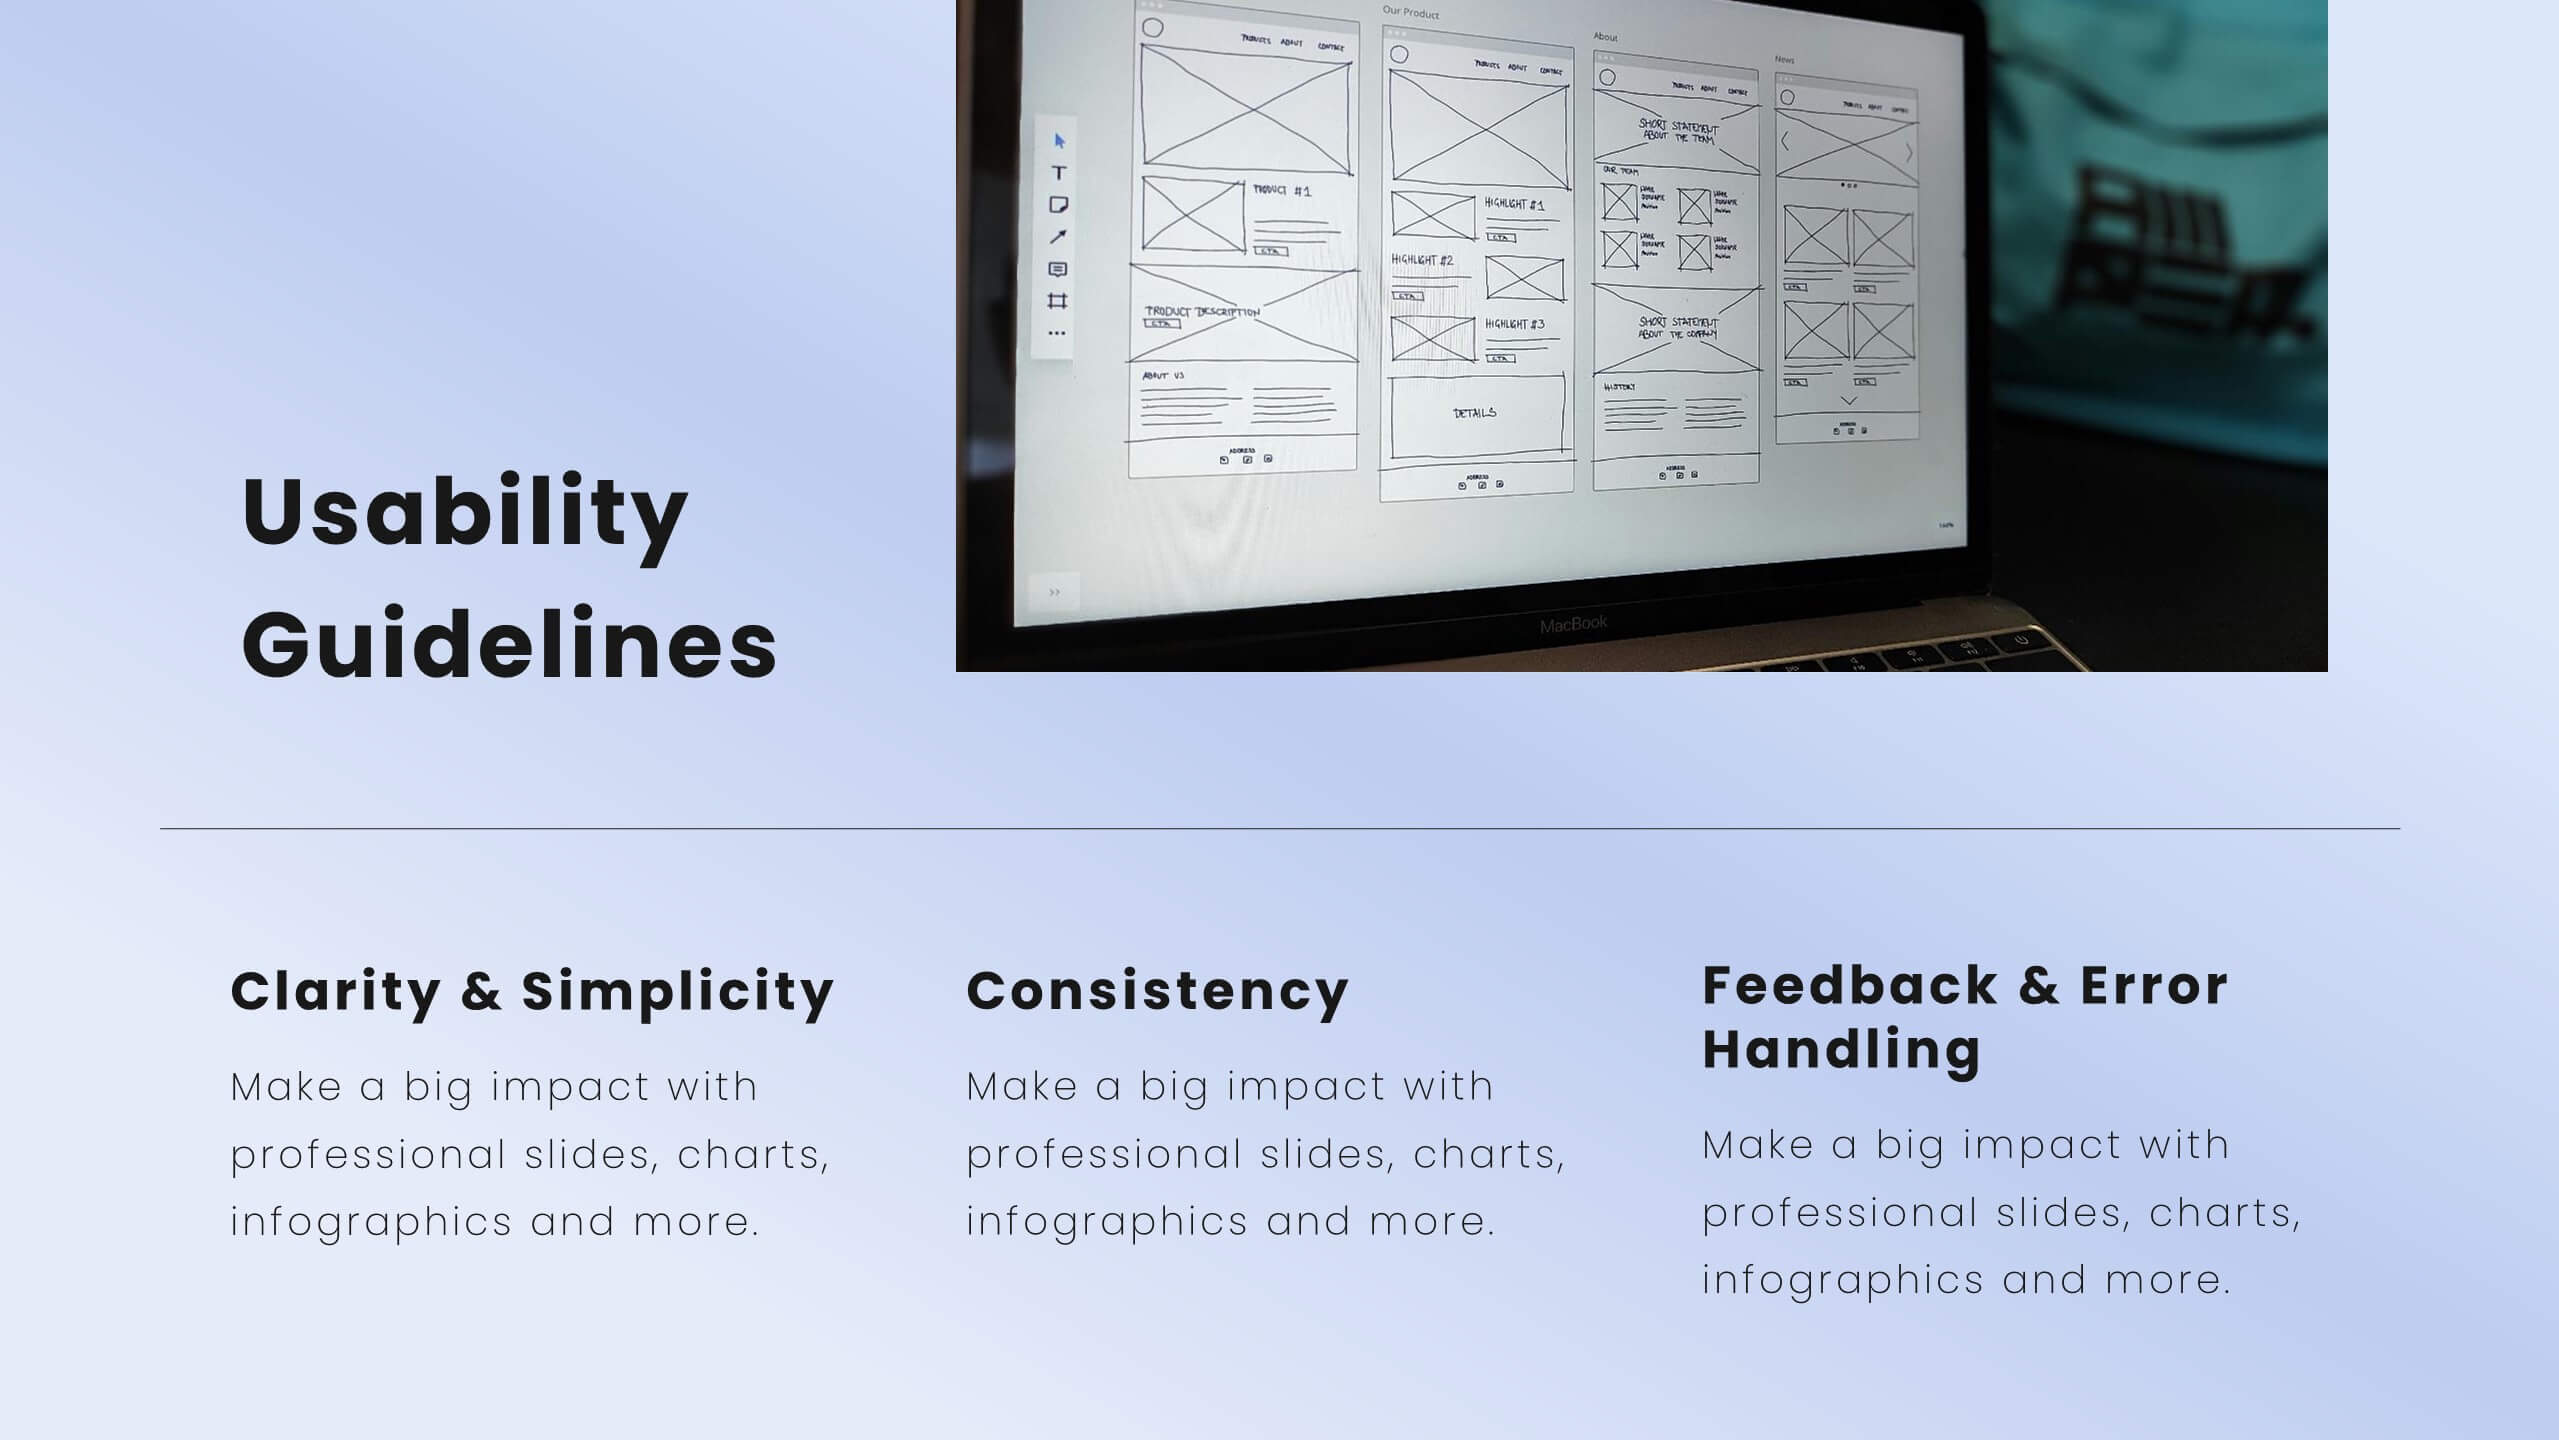
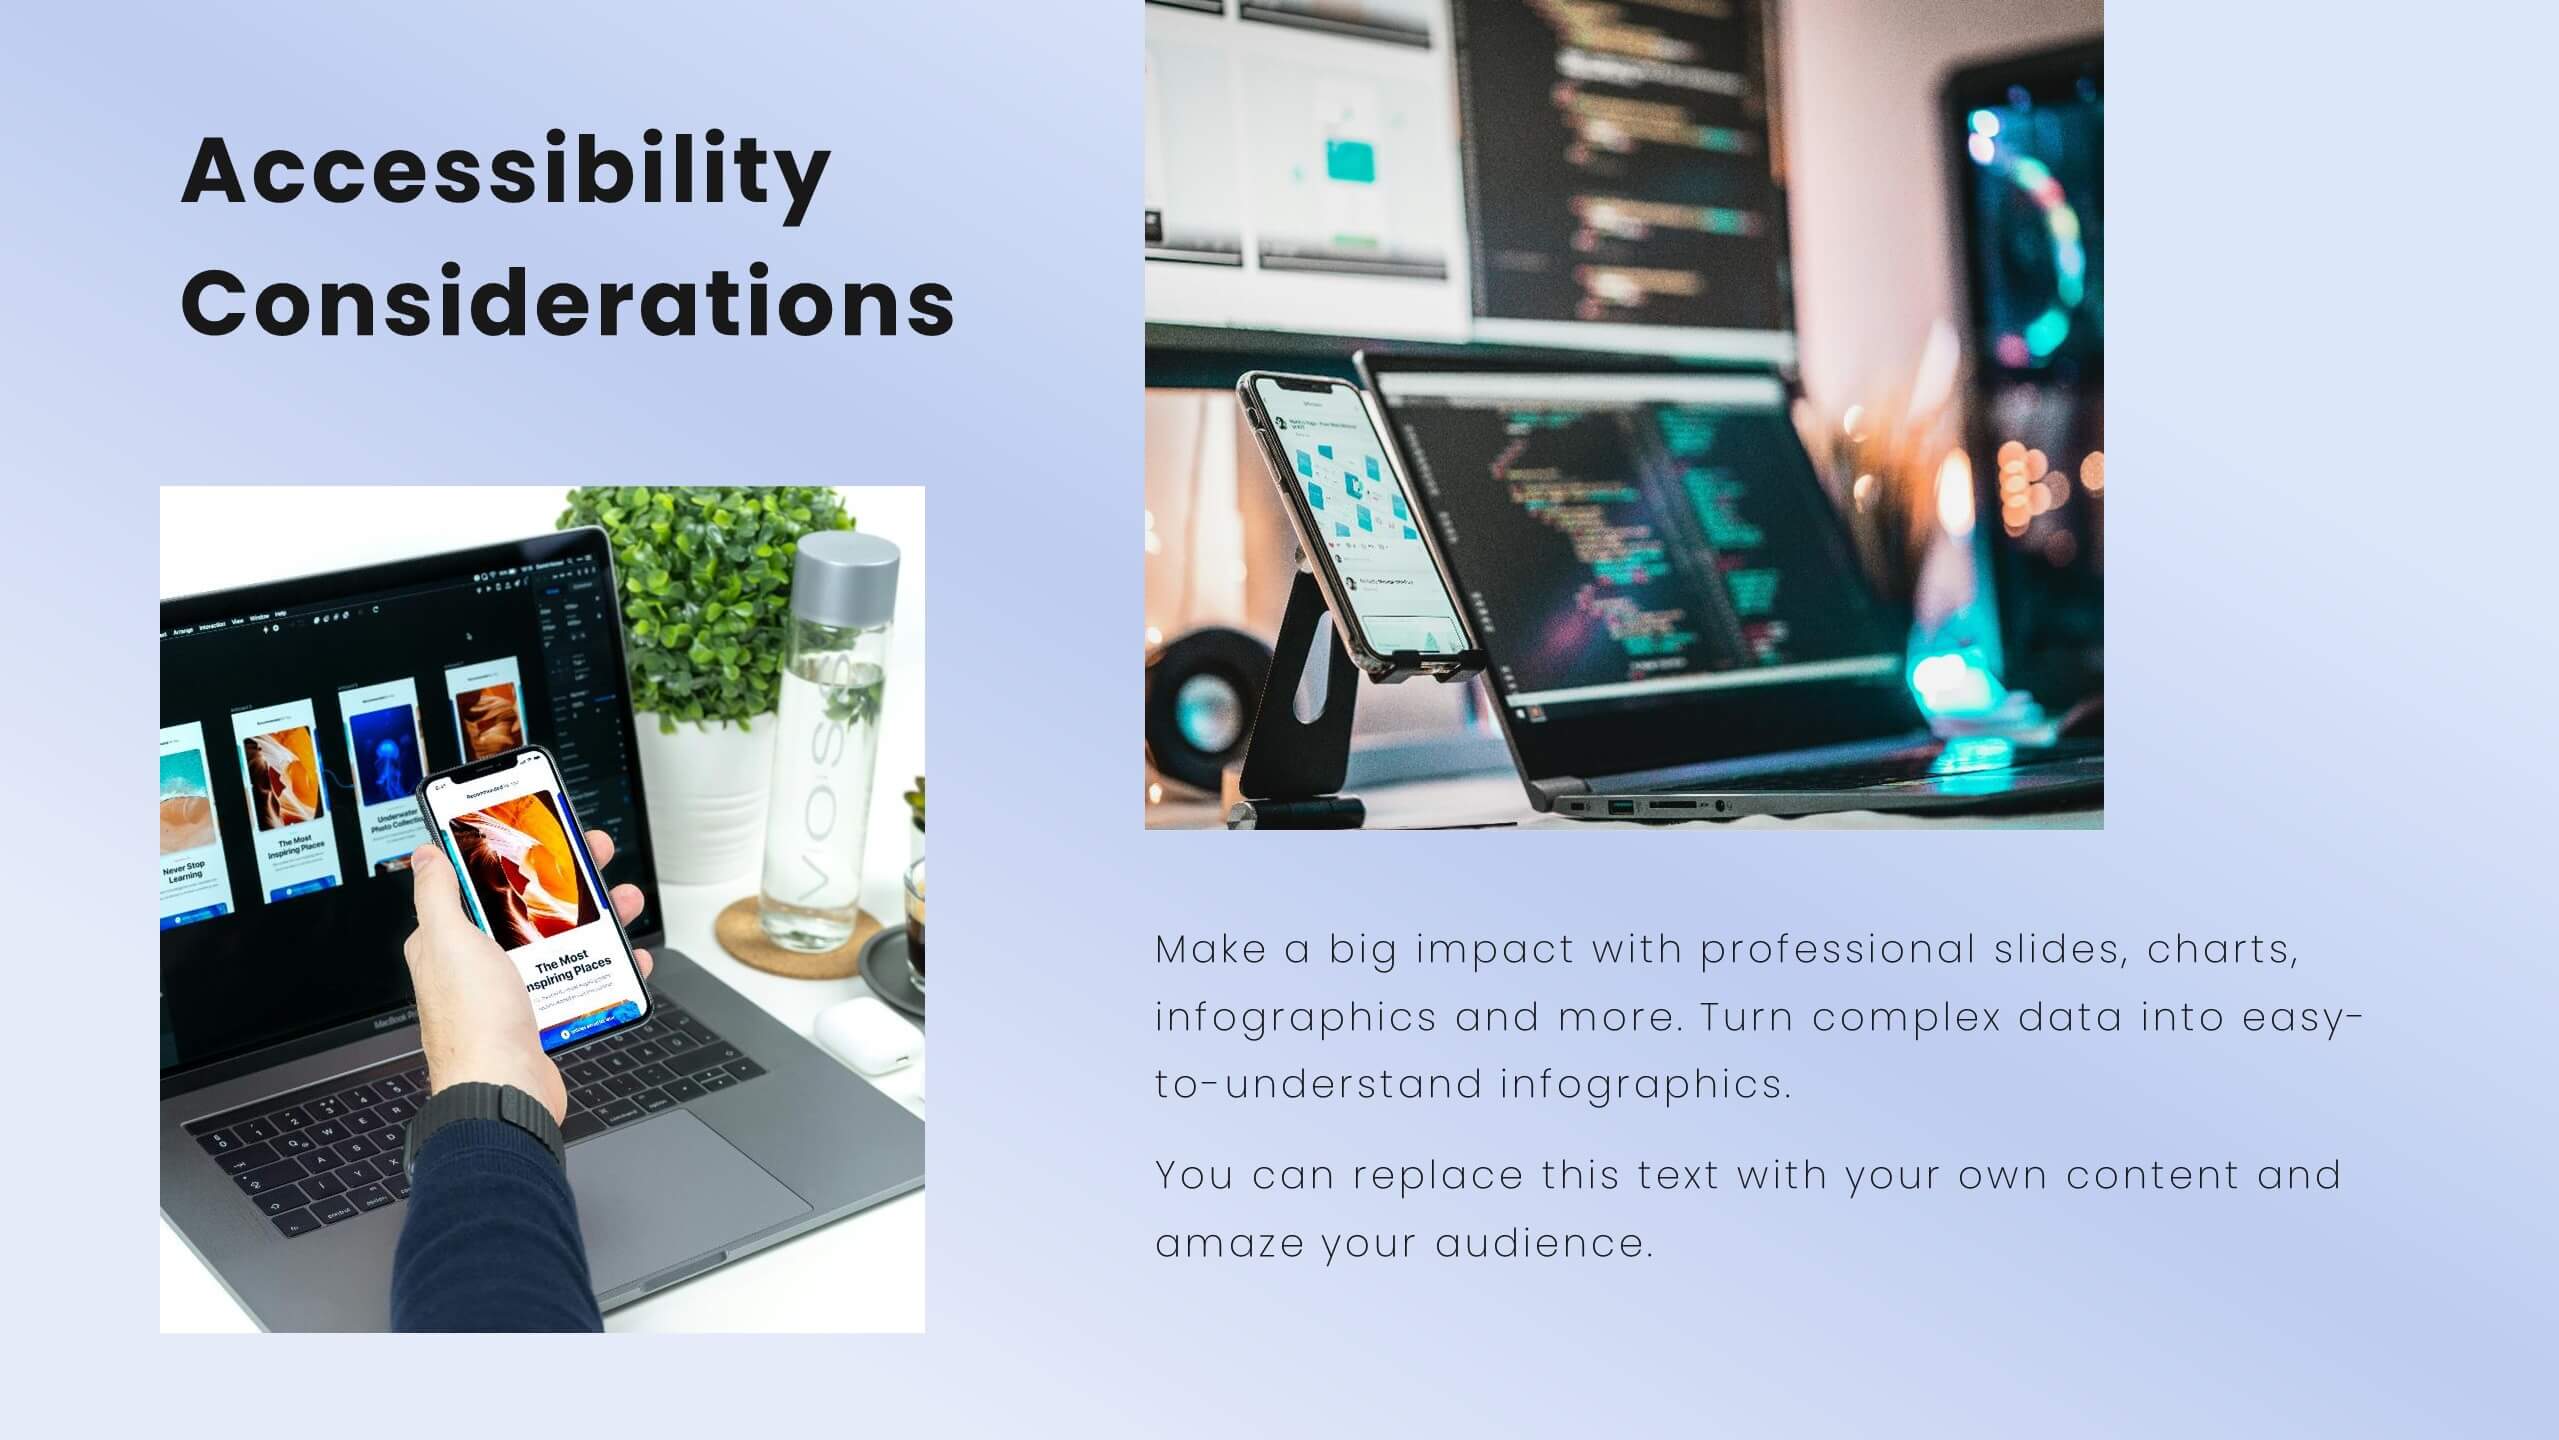
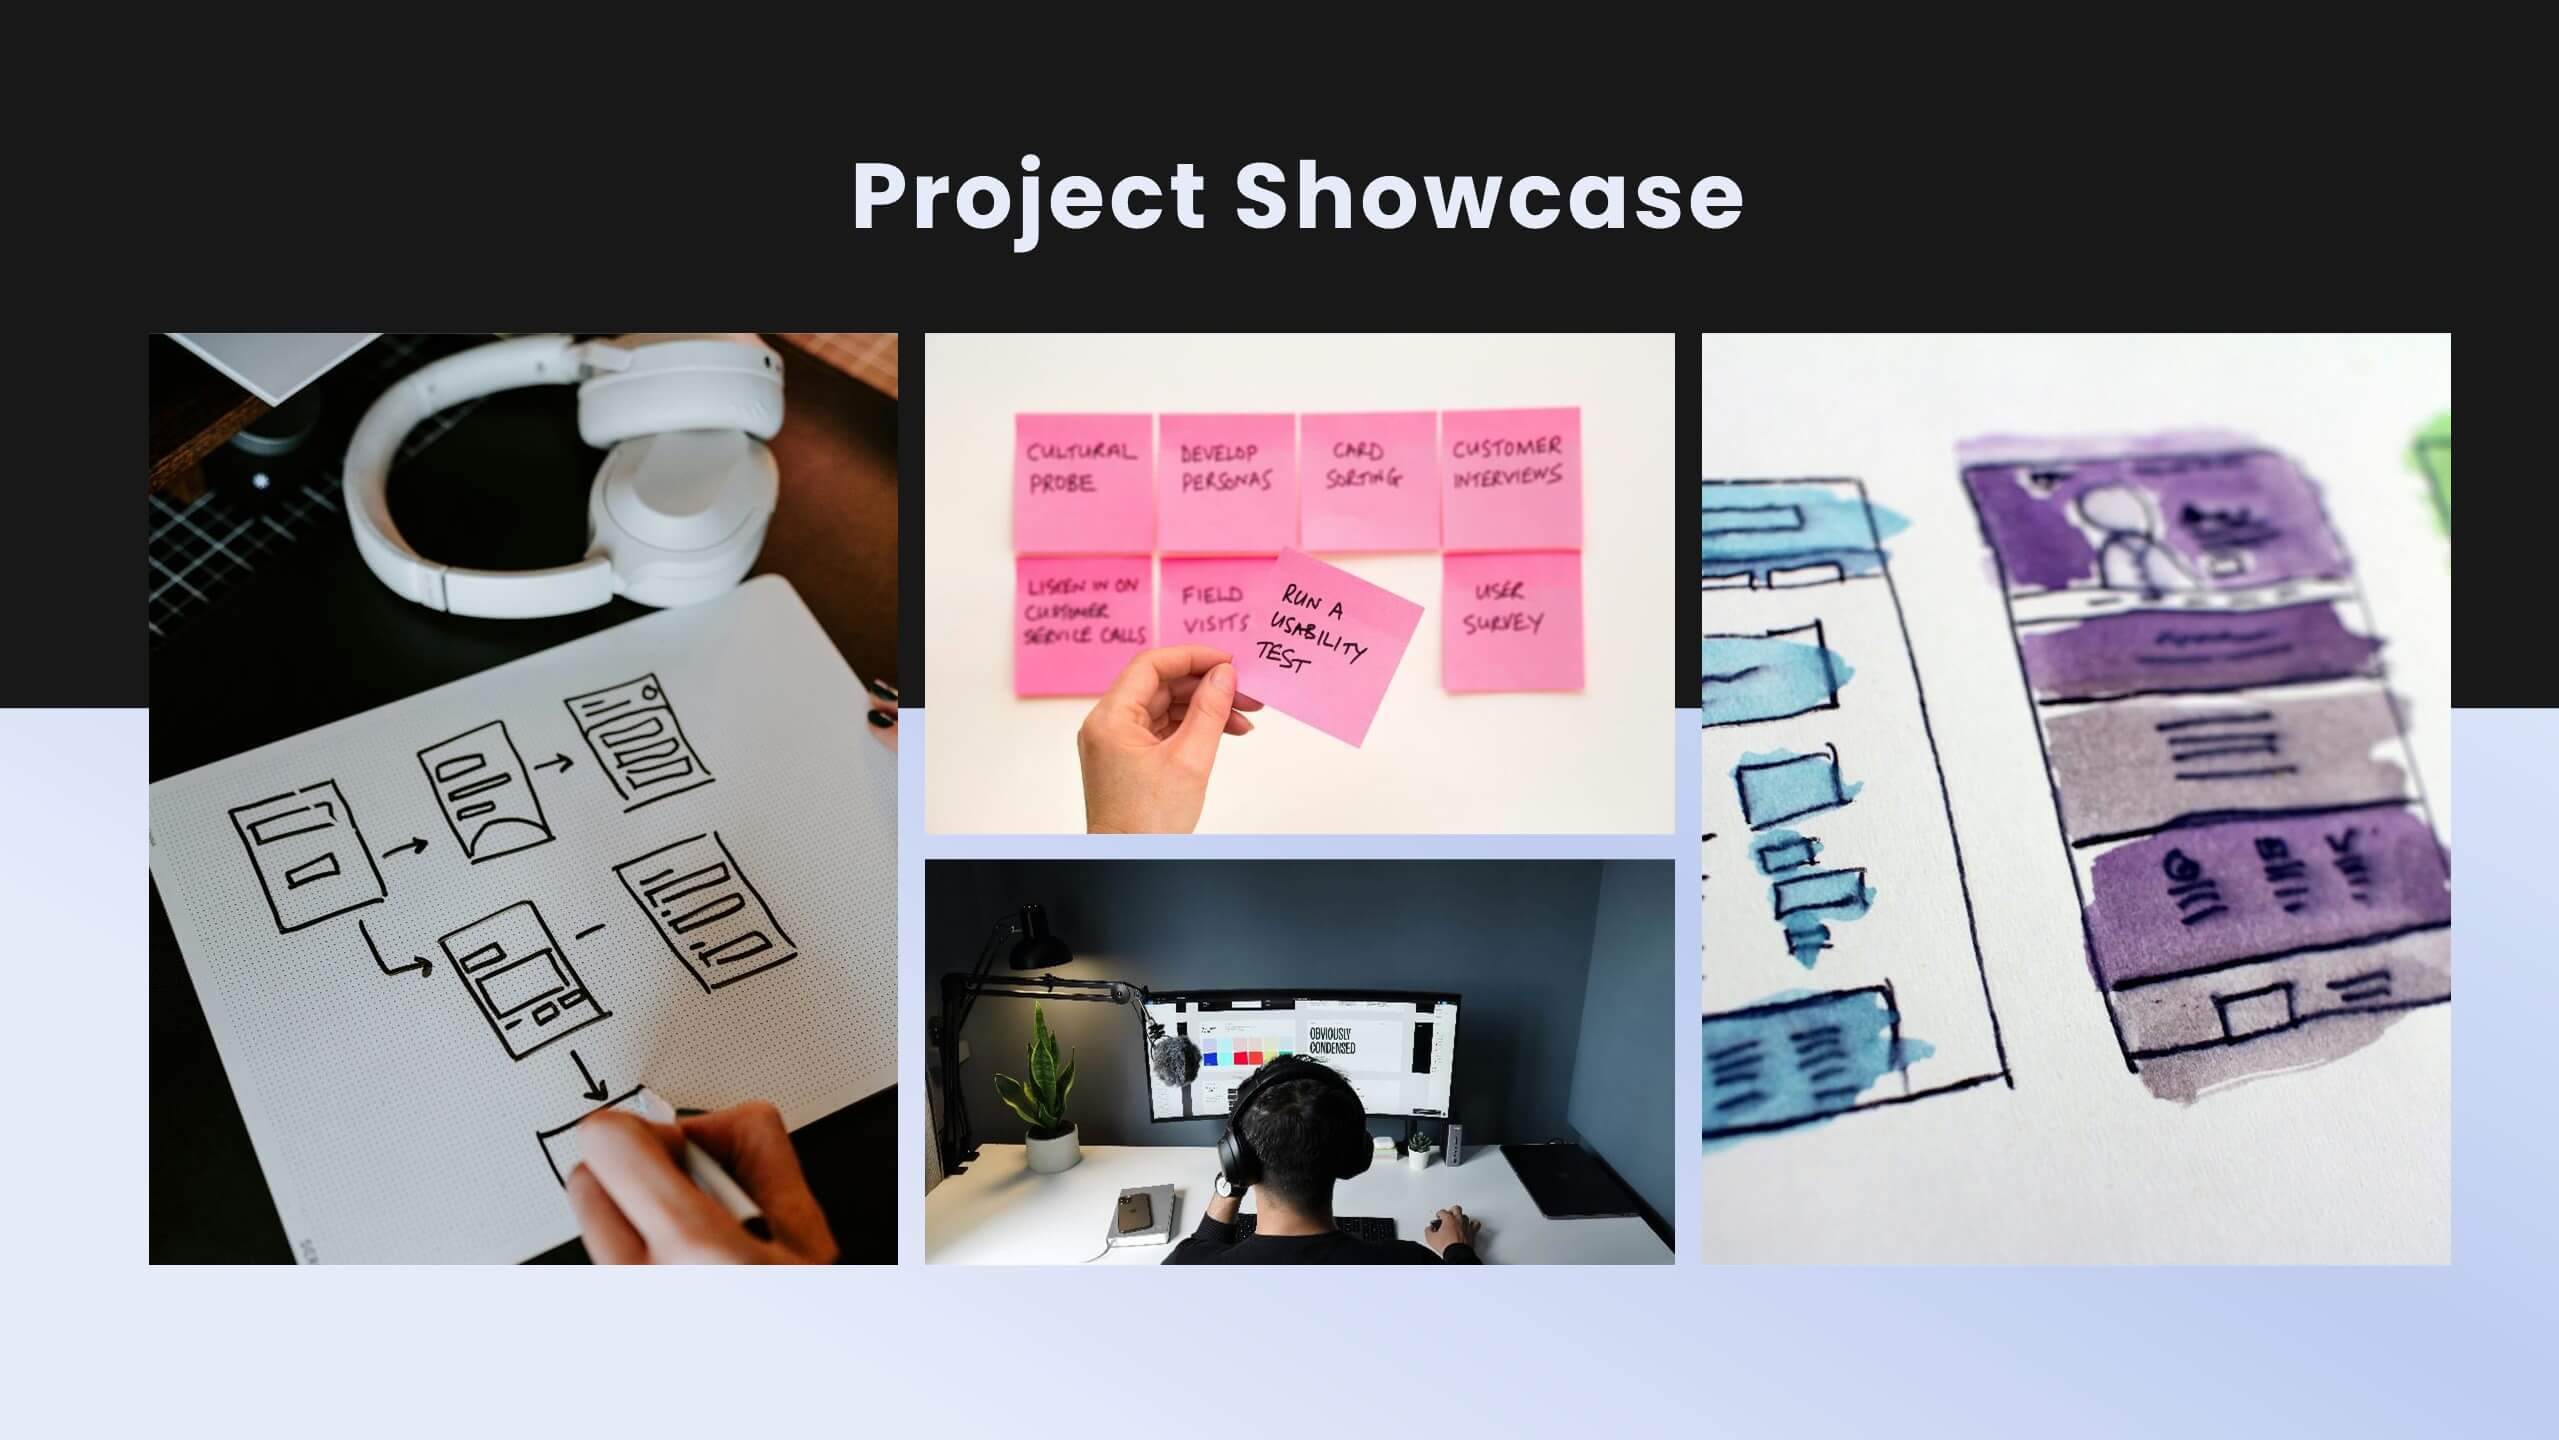
Jigsaw User Experience Proposal Presentation
Enhance user experience with this comprehensive UX proposal template! Perfect for outlining user research, personas, and design principles. Ideal for UX/UI designers aiming to present their strategies and solutions. Compatible with PowerPoint, Keynote, and Google Slides, this template ensures your UX proposals are clear, professional, and impactful. Create exceptional user experiences today!


5 diapositivas
Best Travel Planning Template
Bring wanderlust to life with a slide that turns trip planning into a clear, engaging journey. This presentation breaks down key travel steps—documents, packing, routes, and timing—using simple visuals that keep details organized and easy to follow. Fully customizable and compatible with PowerPoint, Keynote, and Google Slides.