


Características


¿Tienes alguna pregunta?
Recomendar


4 diapositivas
Sports Event Overview Presentation
Get ready to energize your audience with a bold, dynamic slide that brings every activity to life. This presentation focuses on showcasing multiple sports in a clear, organized way, helping you highlight key event details, categories, or program insights with ease. Designed for smooth storytelling, it keeps your information structured and visually engaging from start to finish. Fully compatible with PowerPoint, Keynote, and Google Slides.


6 diapositivas
Threat and Mitigation Bowtie Model
Break down complex threats and responses with the Threat and Mitigation Bowtie Model Presentation. This infographic visualizes the relationship between root causes, a central hazard event, and its potential consequences—alongside the controls that mitigate them. Clean, editable layouts and multiple visual states let you emphasize either side of the bowtie. Ideal for risk assessments, business continuity planning, and safety presentations. Compatible with PowerPoint, Keynote, and Google Slides.


20 diapositivas
Ashen Sales Proposal Presentation
The Sales Proposal Presentation Template is designed to help you showcase your sales strategy effectively. With 20 fully customizable slides, it covers key areas such as market analysis, sales objectives, pricing strategy, and future opportunities. Ideal for professionals, it’s compatible with PowerPoint, Keynote, and Google Slides.


6 diapositivas
Event and Meeting Schedule Calendar Presentation
Simplify your weekly planning with this modern and visually intuitive event calendar template. Featuring a clean grid layout, this presentation allows you to organize key meetings, deadlines, or project highlights across six weeks. Each week is color-coded for quick reference, and each event box is fully editable to include titles and custom notes. Ideal for team leaders, educators, corporate planners, and event organizers. Compatible with PowerPoint, Keynote, and Google Slides for effortless use.


12 diapositivas
6-Step Timeline Presentation
Visualize milestones effortlessly with this 6-Step Timeline template. Ideal for project planning, business strategies, and process tracking, this fully customizable timeline offers a clear, structured layout. Easily adjust text, colors, and elements to match your branding. Compatible with PowerPoint, Keynote, and Google Slides for seamless integration.


21 diapositivas
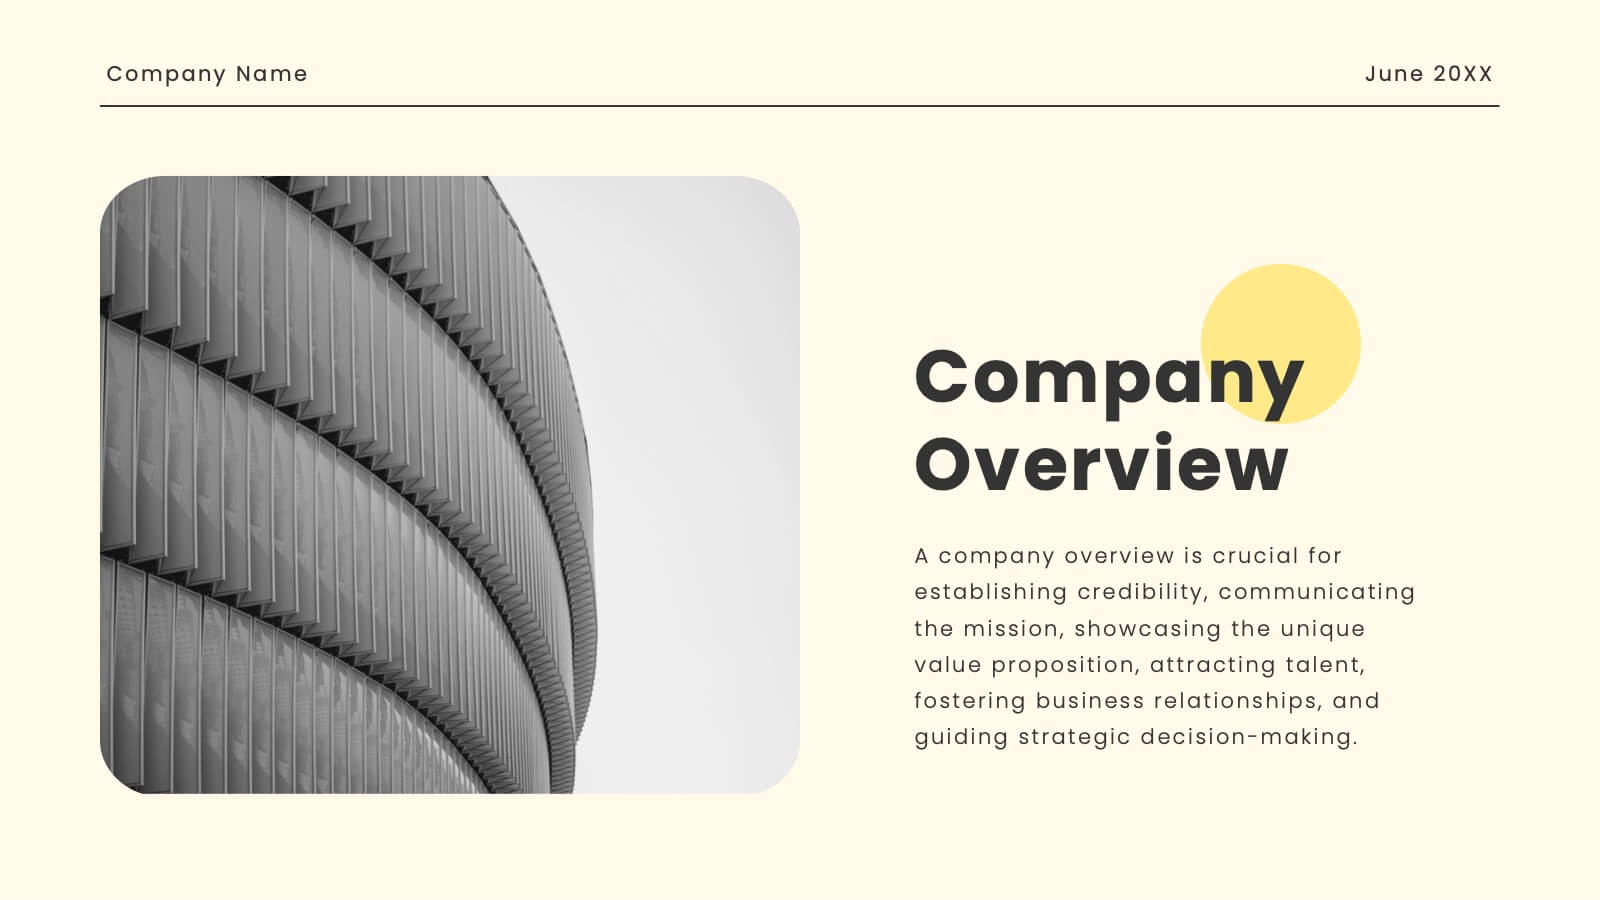
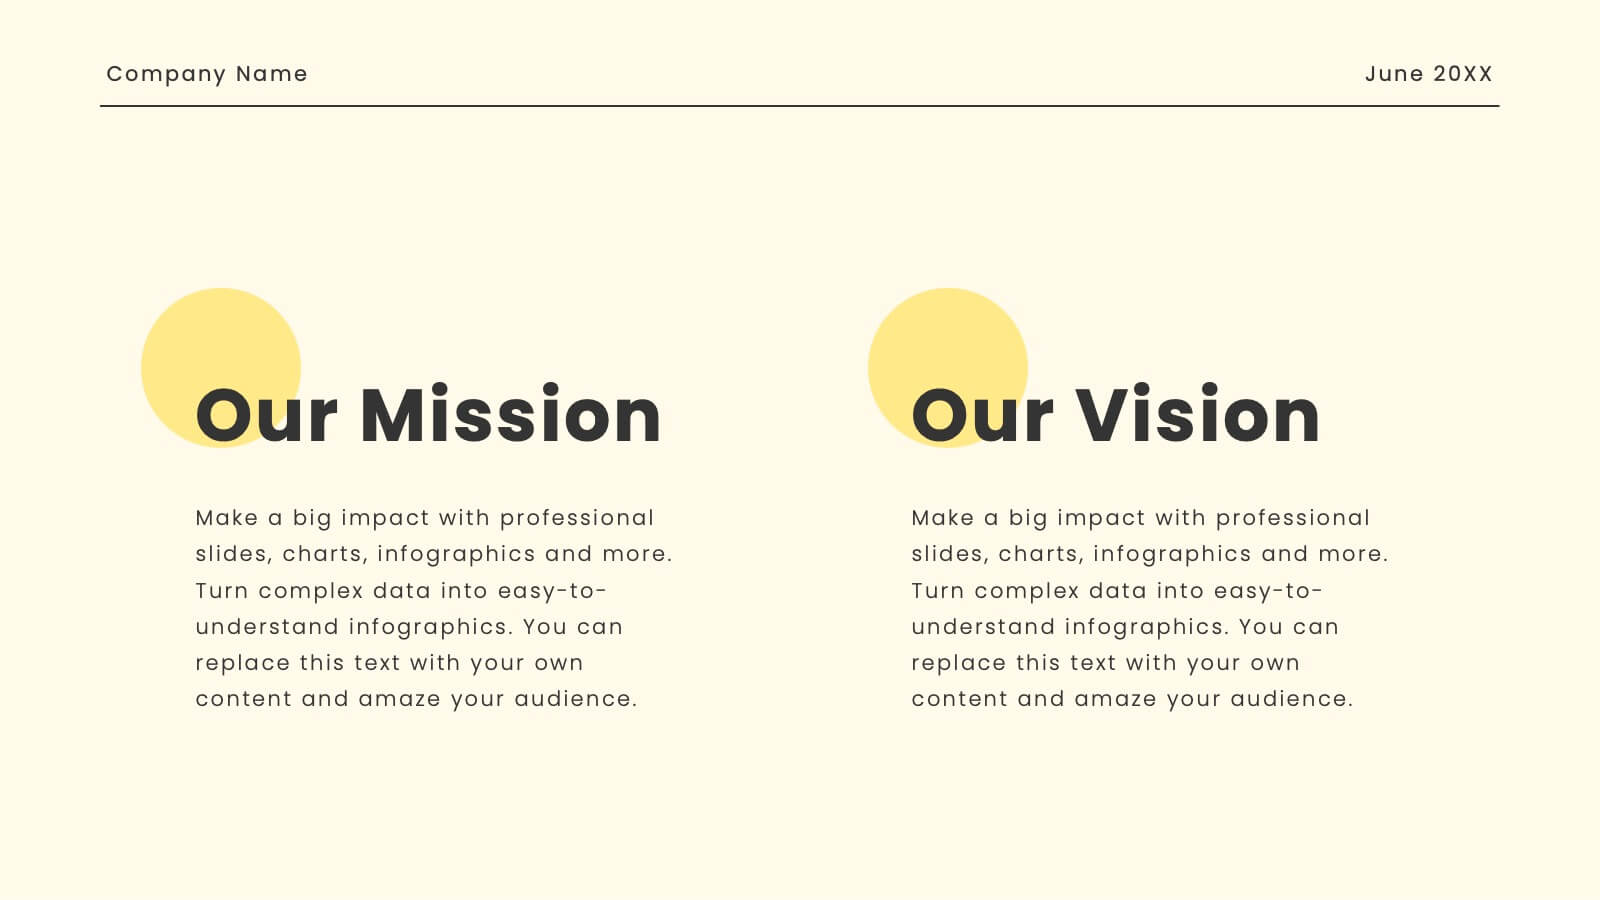
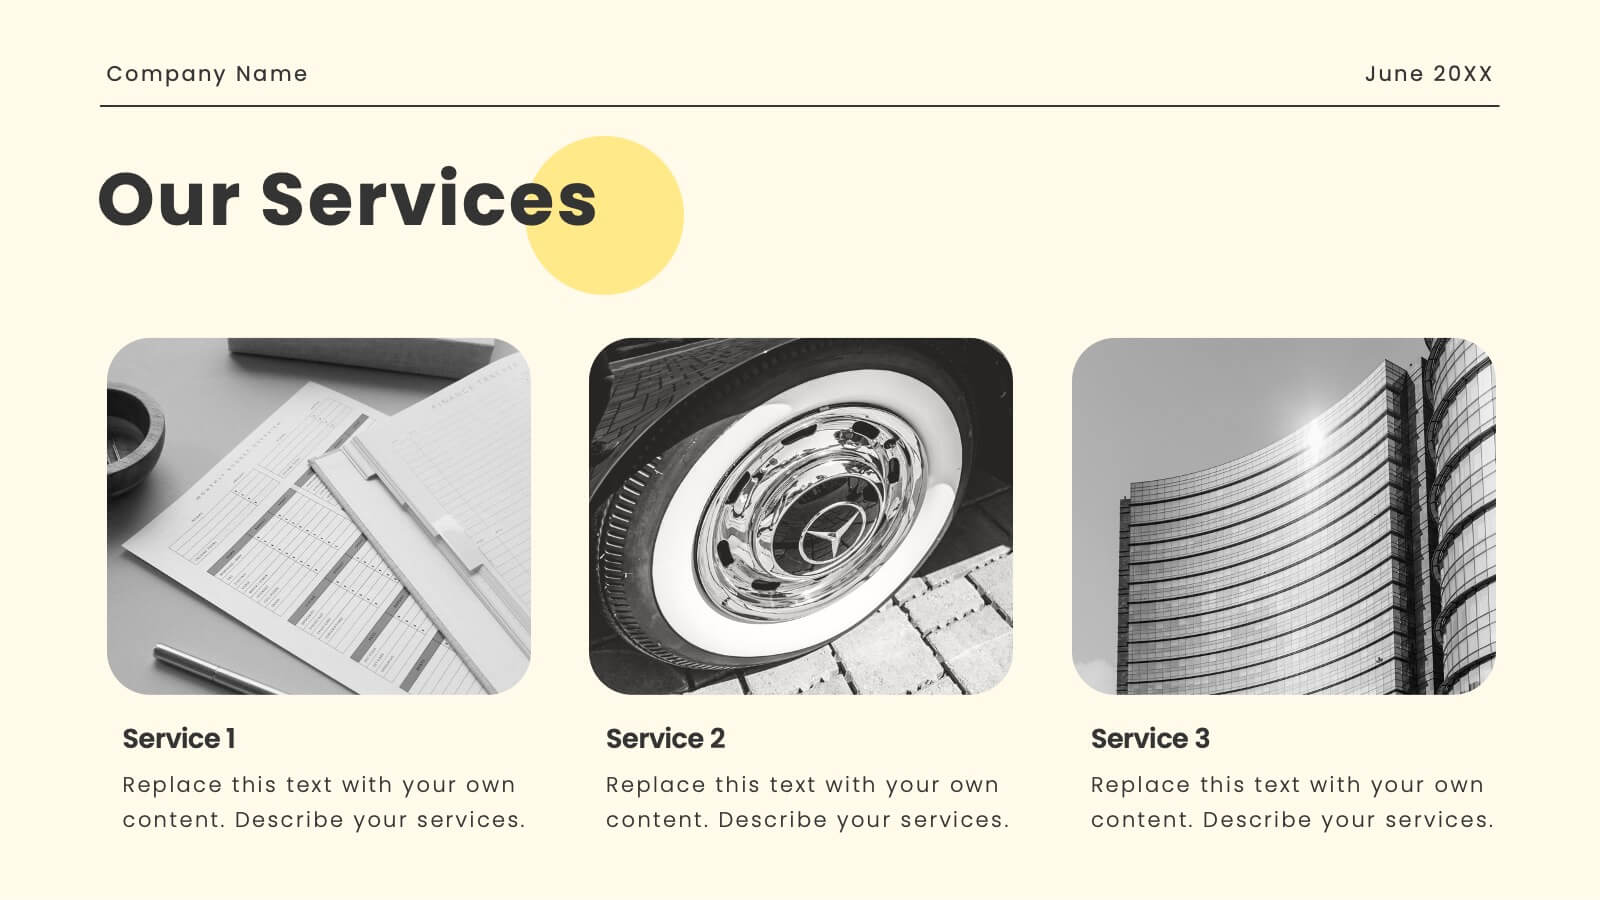
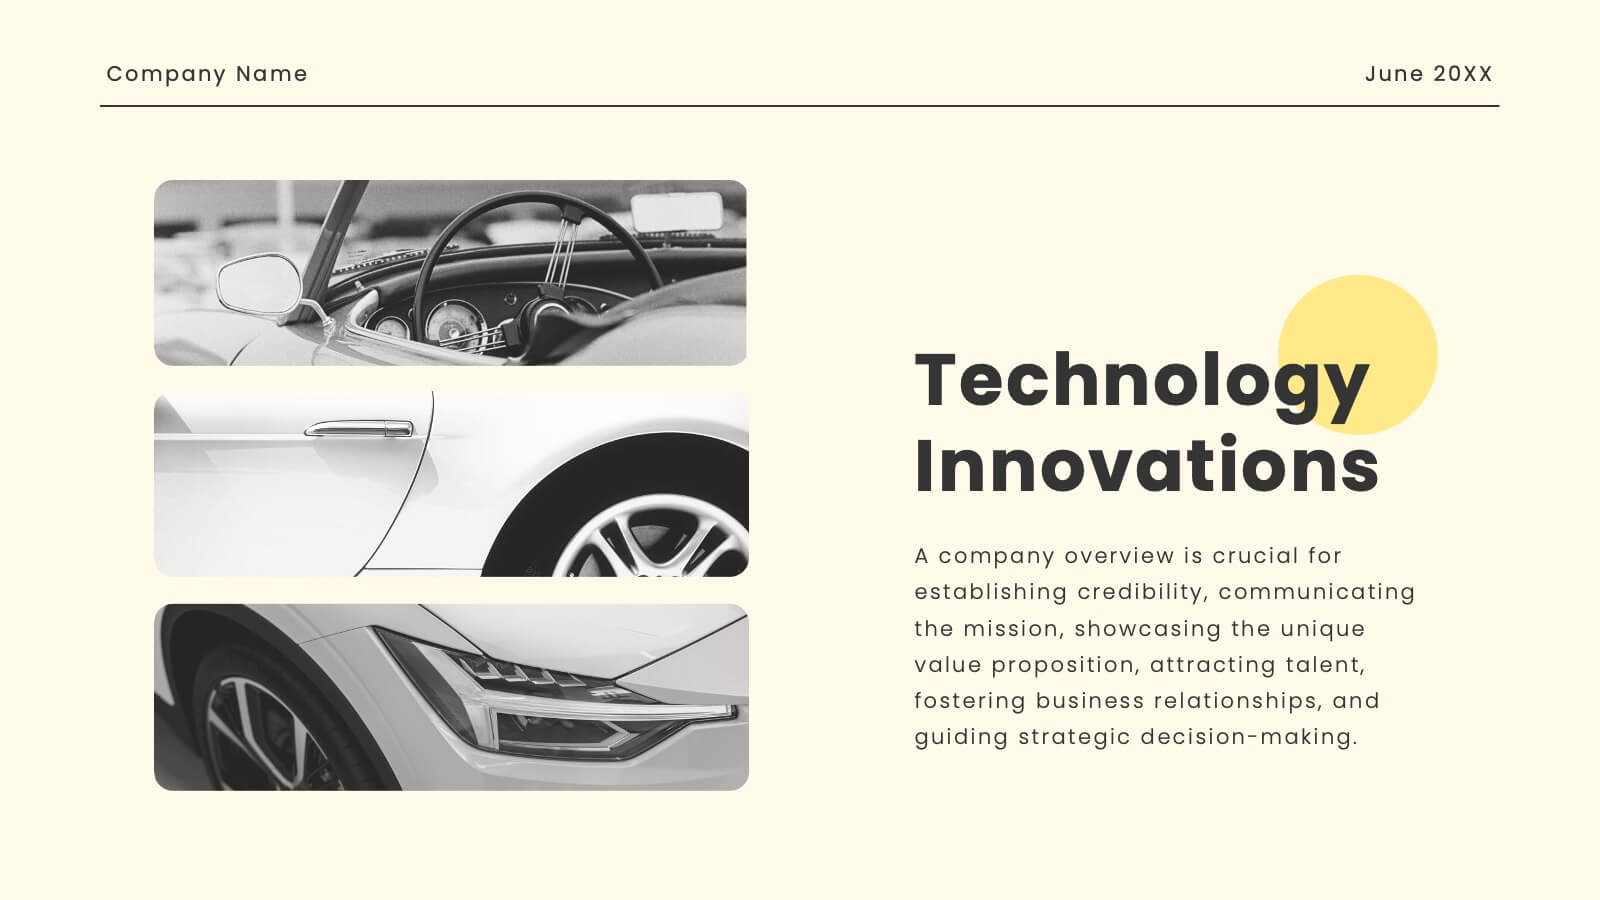
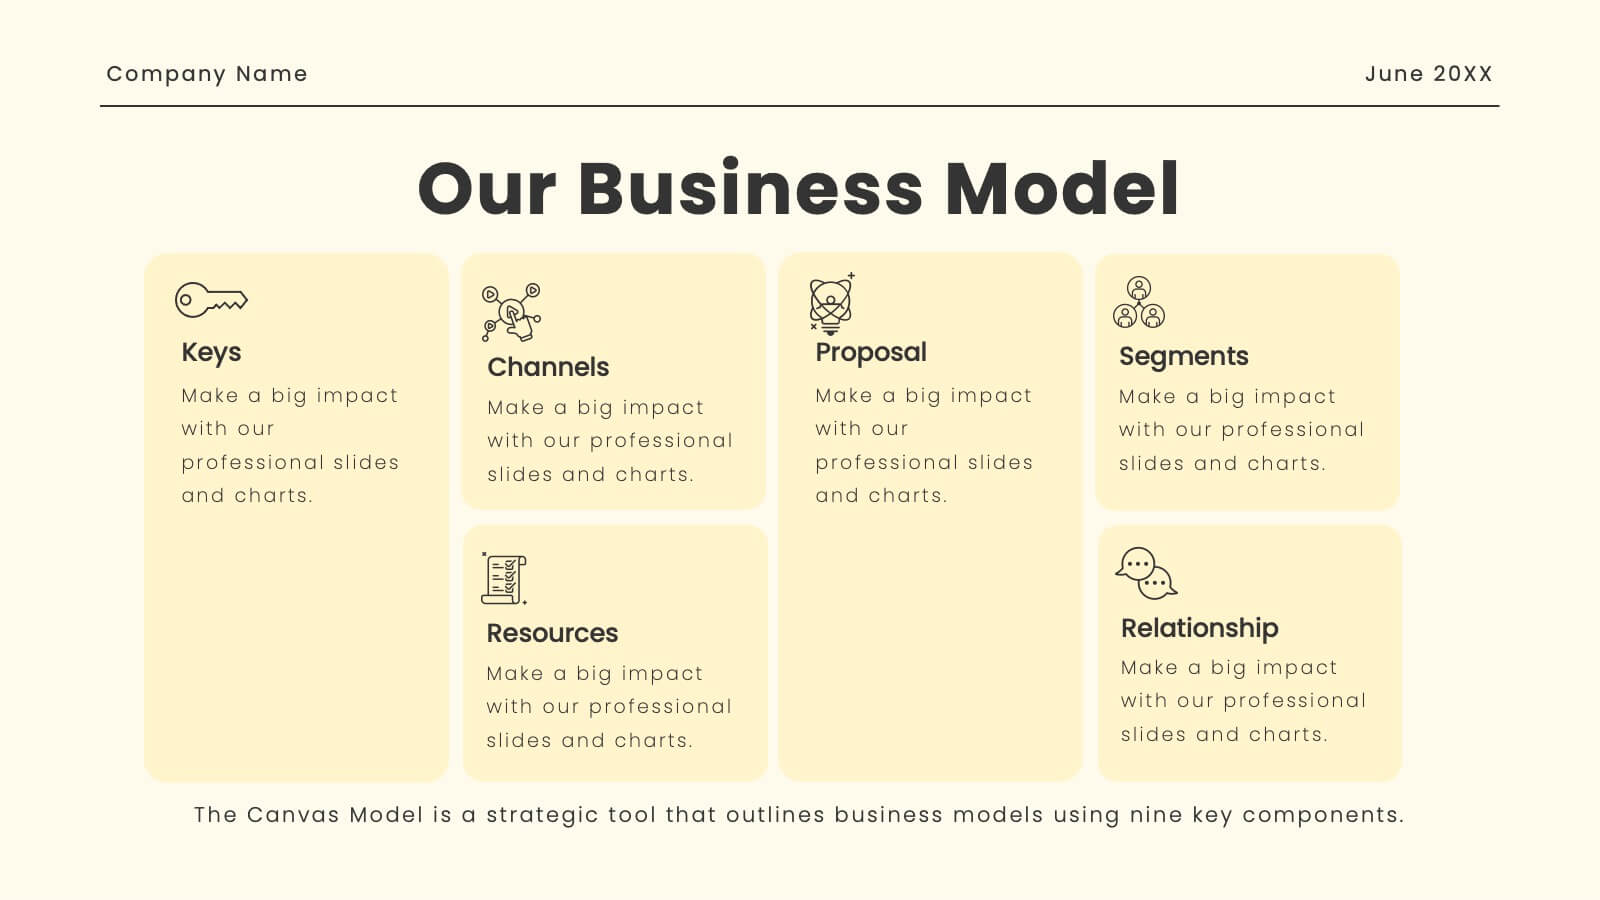
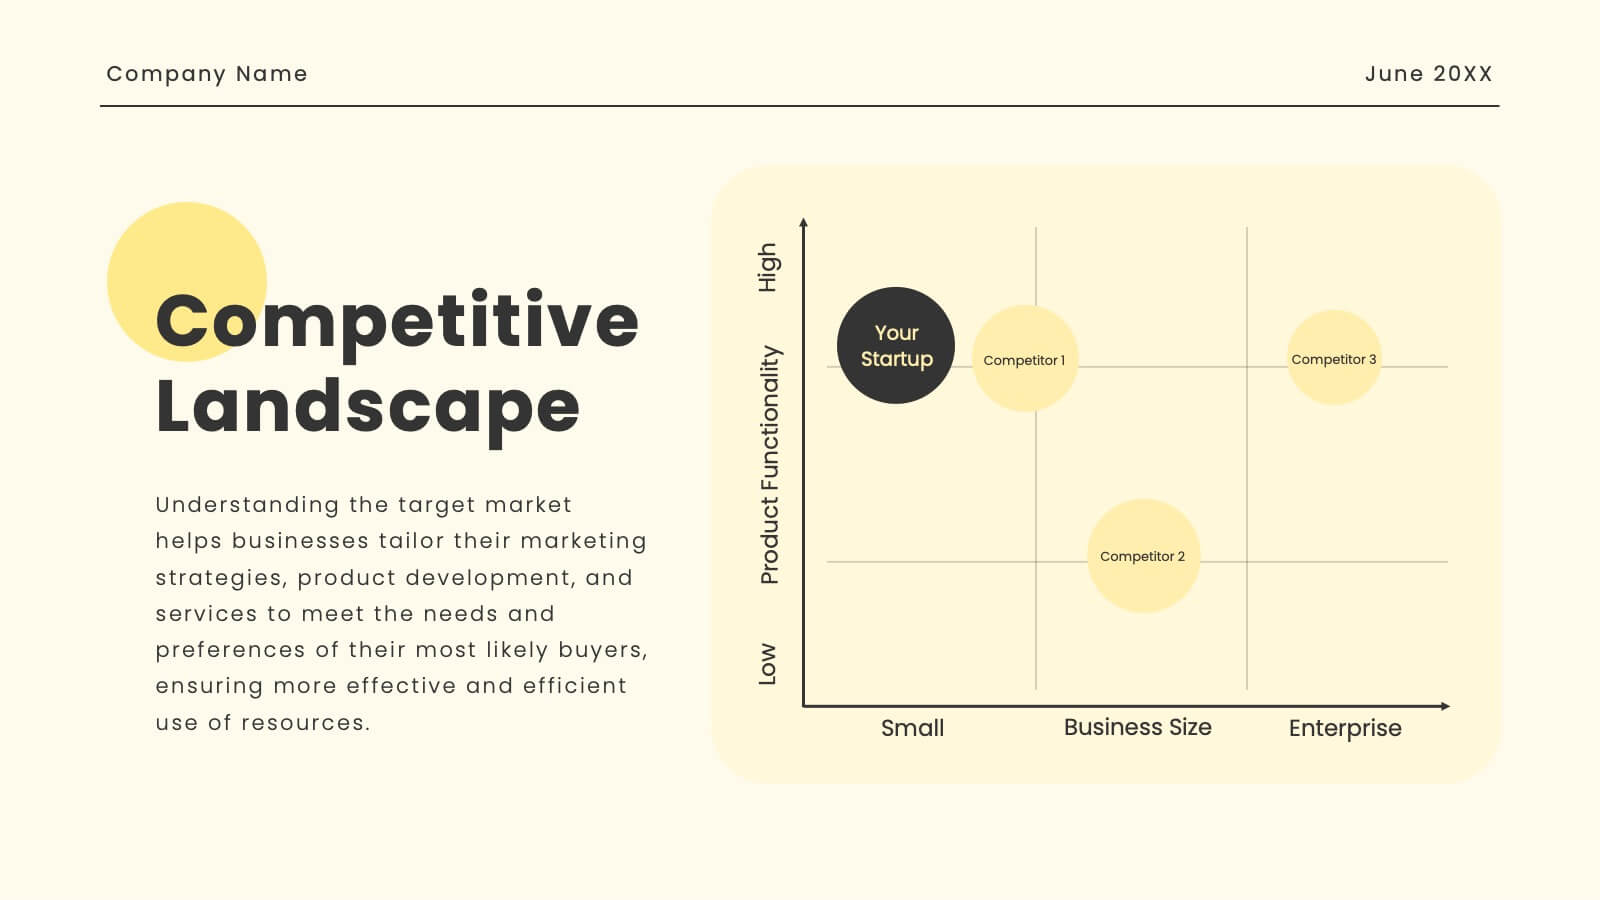
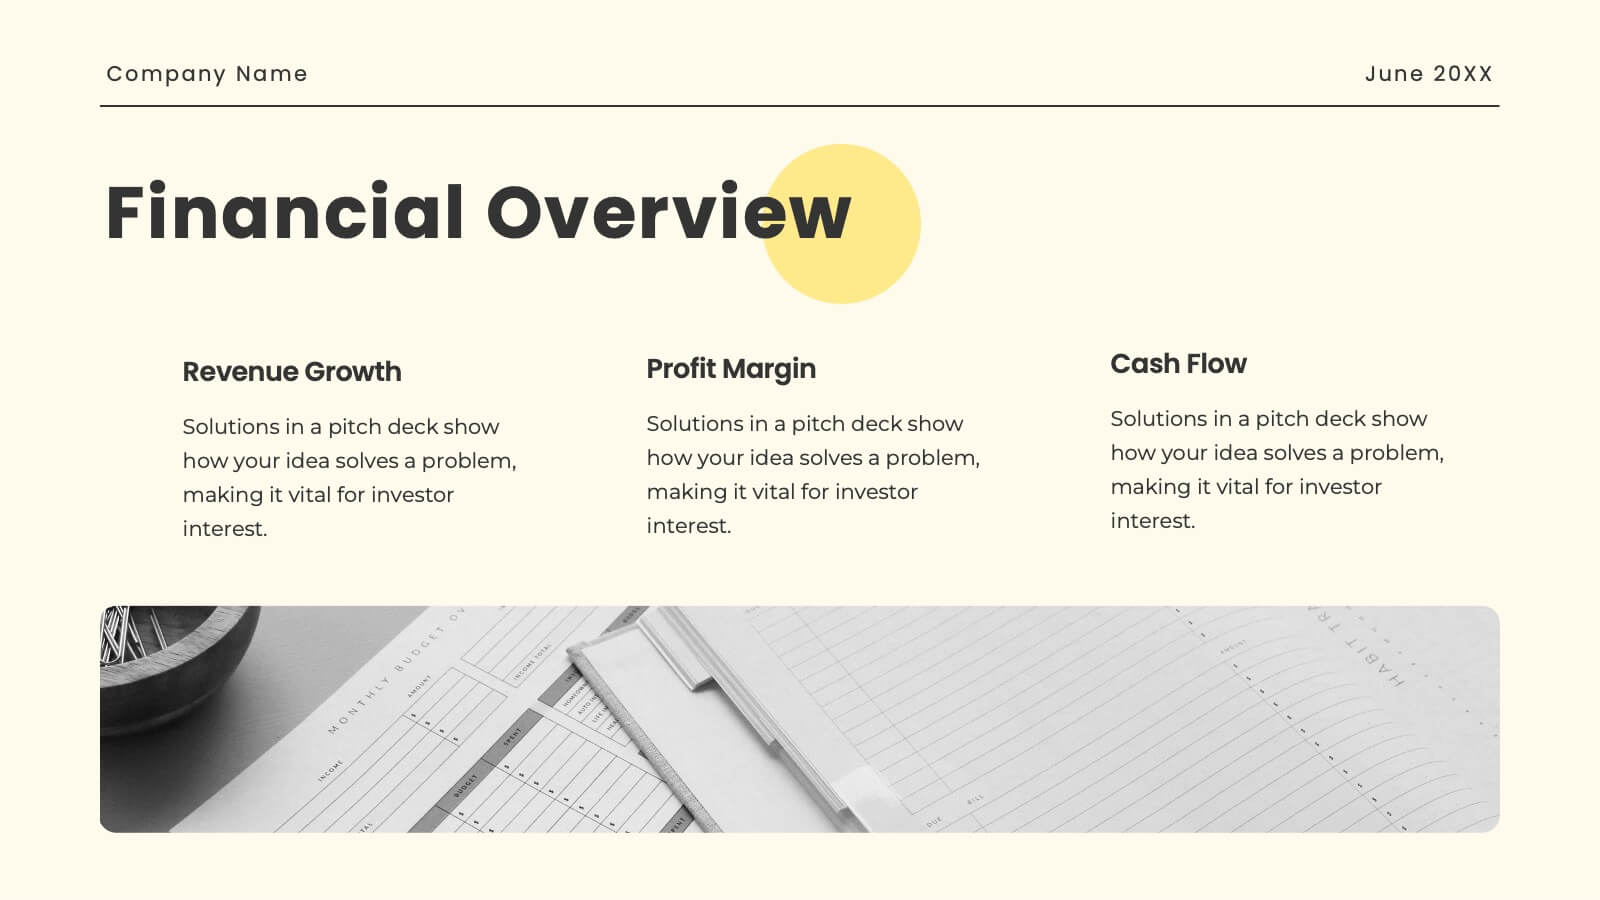
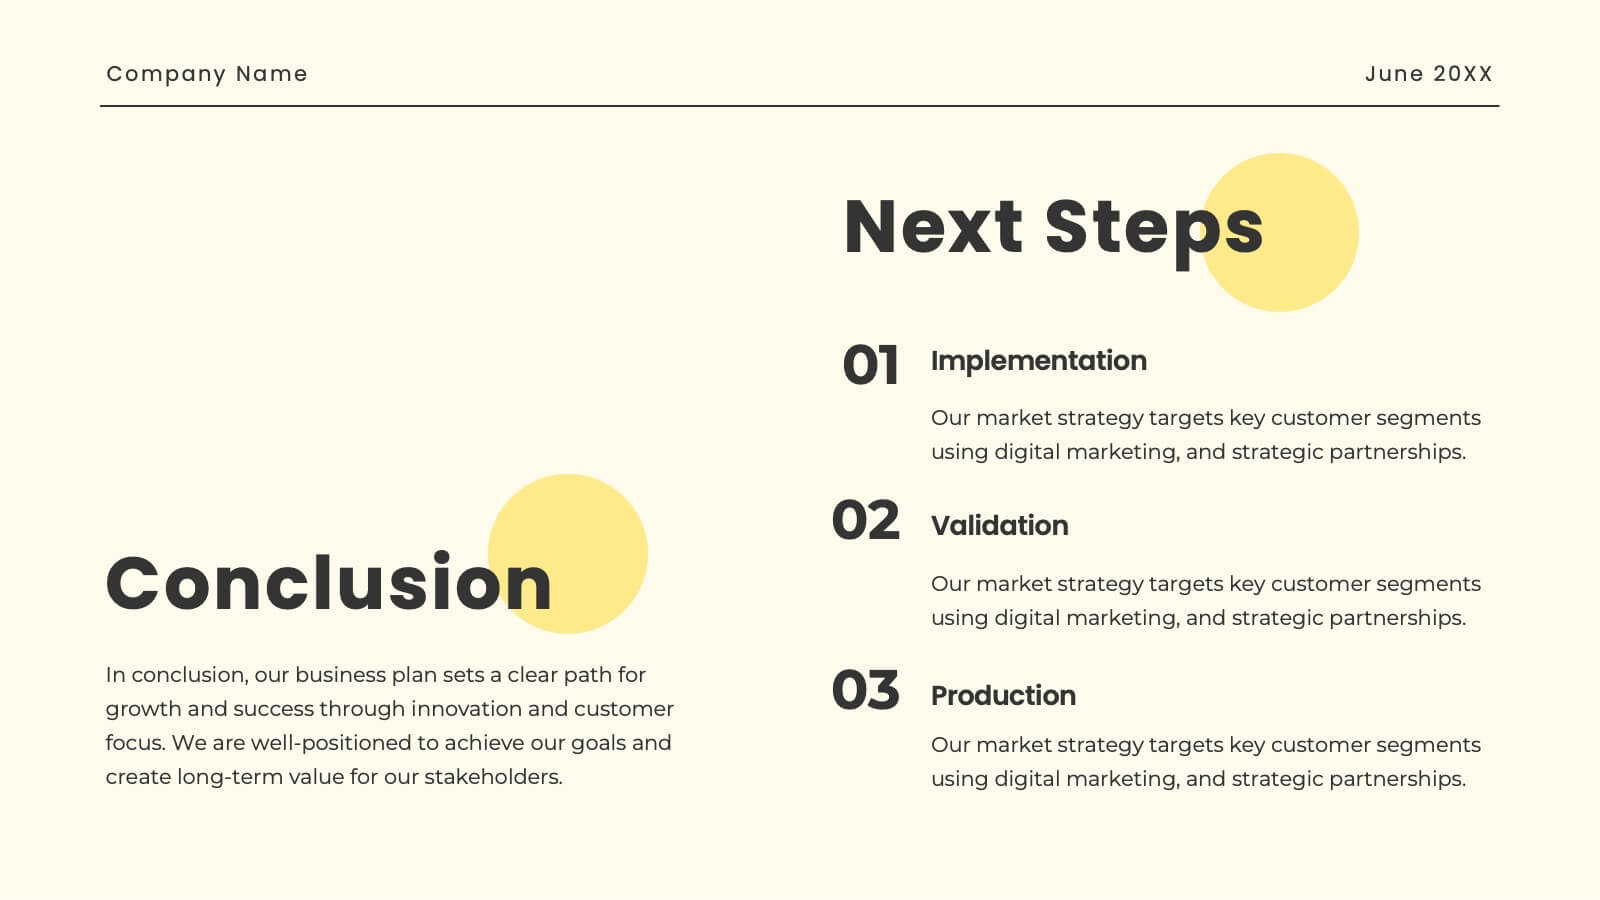
Oasis Startup Business Plan Presentation
Present your corporate business plan with confidence! This template includes sections for company overview, mission, vision, services, target market, and more. Showcase your market strategy, sales channels, growth plan, and financial overview. Perfect for conveying a professional and comprehensive business plan. Compatible with PowerPoint, Keynote, and Google Slides. Impress your audience today!


4 diapositivas
Interactive Data Dashboard Display Presentation
Present data with clarity using this Interactive Data Dashboard Display presentation. Designed to showcase multiple metrics at once, it includes pie charts, donut charts, bubble graphs, and bar comparisons. Ideal for business reports, marketing insights, or performance reviews. Fully editable in Canva, PowerPoint, and Google Slides for flexible customization.


6 diapositivas
5G Network Infographic
5G, short for fifth-generation wireless technology, is the latest generation of mobile network technology designed to provide faster, more reliable, and higher capacity wireless communication. This infographic template is designed to educate viewers about the key features, benefits, and impact of 5G technology on various aspects of our lives. This template aims to provide a comprehensive and easy-to-understand overview of the transformative capabilities of 5G technology. It serves as a valuable resource for individuals, businesses, and organizations seeking to understand the potential impact and benefits of 5G on various aspects of our lives and the broader technological landscape.


6 diapositivas
Environmental Protection and Ecology Plan Presentation
Highlight your green initiatives with the Environmental Protection and Ecology Plan Presentation. Featuring a lightbulb-leaf graphic, this template helps you present sustainability goals, eco strategies, and key action steps clearly. Ideal for environmental reports, proposals, or educational content. Fully customizable in Canva, PowerPoint, or Google Slides.


5 diapositivas
Risks Assessment Matrix Presentation
Visualize risk like never before with a clear, color-coded grid that helps you evaluate impact, likelihood, and priority in seconds. Perfect for project planning, compliance reviews, or business strategy sessions, this presentation makes complex assessments simple. Fully compatible with PowerPoint, Keynote, and Google Slides for effortless editing.


8 diapositivas
Biological Structure and Function Presentation
Visualize biological processes with the Biological Structure and Function infographic. Featuring a hexagonal layout, this template allows you to categorize key concepts such as molecular functions, chemical reactions, and biological systems. Fully editable and available for PowerPoint, Keynote, and Google Slides.


4 diapositivas
Income and Expense Highlights Presentation
Enhance learning with the Interactive Digital Learning Experience Presentation. This template mimics a multiple-choice format, making it perfect for quizzes, training modules, or eLearning content. Each slide includes labeled options (A–D) alongside a modern vertical interface, ideal for engaging assessments or lesson recaps. Fully editable in Canva, PowerPoint, Keynote, and Google Slides.


7 diapositivas
Business Plan Strategy Infographic
A business plan is a written document that outlines a company's goals and the strategy it will use to achieve those goals. This infographic template is a comprehensive roadmap for how a business intends to operate, grow, and succeed in its market. Compatible with Powerpoint, Keynote, and Google Slides. This template is meticulously designed to help you craft a well-structured business plan, empowering entrepreneurs and professionals to navigate their journey to success. Let this be your compass as you navigate the complexities of entrepreneurship and strive for business excellence!


7 diapositivas
Investment Management Infographic
Investment management, also known as asset management or fund management, involves the professional management of various securities and assets with the goal of achieving specific investment objectives for individuals, institutions, or entities. This infographic will encourage your audience to start or enhance their investment journey for financial prosperity. Customize the content, design, and visuals to craft an engaging and informative infographic that educates about investment management. This infographic should serve as a useful guide for both beginners and those looking to refine their investment strategies.


21 diapositivas
Cascade Marketing Proposal Template Presentation
Ignite your creativity with our dazzling Cascade Marketing Proposal Template Presentation! This captivating design brings your ideas to life, ensuring your presentation stands out. The sleek, dark theme is punctuated by electric blue accents, adding a modern, professional touch. Each slide is meticulously crafted, offering a perfect blend of visuals and content that keeps your audience engaged from start to finish. From the Company Overview to Growth Projections, every aspect of your pitch is highlighted with style and clarity. The template is fully customizable, allowing you to tailor it to your brand's identity effortlessly. Whether you're pitching to investors or presenting internally, this template has everything you need to make a lasting impression. Compatible with PowerPoint, Keynote, and Google Slides, it’s versatile and easy to use. Get ready to electrify your next presentation and leave your audience in awe!


5 diapositivas
Monthly Sales Report Infographics
A monthly sales report is a document that provides an overview of a company's sales performance during a specific month. These infographic templates are perfect for sales managers, business owners, or analysts who want to present monthly sales performance and trends to stakeholders, team members, or clients. This is an effective tool for presenting sales data in a visually engaging and comprehensive way. With these templates, you can create professional and impactful sales reports that effectively convey the story behind the numbers. Compatible with Powerpoint, Keynote, and Google Slides.


19 diapositivas
Sales Proposal Presentation
Secure your next big deal with our Sales Proposal presentation template, tailored to make your pitch unforgettable. It's a comprehensive toolkit for sales professionals designed to address every aspect of your offering. The slides smoothly guide your audience through your company overview, mission, product or service features, and the solutions you provide to the client's problems. They are meticulously structured to help you outline your value proposition, address customer pain points, and present a convincing case with customer testimonials. The design is not just visually appealing but also conducive to narrative flow, presenting cost and pricing details with clarity, and allowing room for engaging Q&A sessions. This template is ideal for sales pitches, adaptable across PowerPoint, Keynote, and Google Slides. It helps you build a persuasive argument for why your solution is the best fit for the client, providing a professional edge in a competitive marketplace.