


Características


¿Tienes alguna pregunta?
Recomendar


7 diapositivas
Circle Planning Infographic
Embark on holistic planning with our circle planning infographic. Encased within a pure white canvas and punctuated with harmonious green, insightful purple, and strategic blue, our template encapsulates the cyclical nature of meticulous planning. Endowed with concise infographics, indicative icons, and adaptable image placeholders, it elucidates the continuity and stages of planning processes. Flawlessly designed for Powerpoint, Keynote, or Google Slides. An irreplaceable tool for project managers, business strategists, educators, or any professional aiming for a rounded approach to planning.


7 diapositivas
Strategic Alignment Using McKinsey 7S Presentation
Showcase organizational effectiveness with this Strategic Alignment Using McKinsey 7S Presentation. This diagram template visually maps all seven interconnected elements—Strategy, Structure, Systems, Shared Values, Skills, Style, and Staff—making it easy to communicate business alignment and transformation goals. Perfect for consultants, team leaders, and strategy professionals. Fully customizable in PowerPoint, Keynote, and Google Slides.


13 diapositivas
Simple Sales Proposal Presentation
This proposal template provides a streamlined approach for presenting sales strategies and solutions. Starting with a visually striking cover slide, it sets the scene for an engaging pitch. The template meticulously organizes content from the initial problem identification to the presentation of real numbers that underscore the proposal's validity. Each section, from the elucidation of the problem to the detailed solutions and real-world case studies, is laid out for maximum impact and understanding. Personable touches are incorporated through the 'Meet Our Team' segment, bolstering the proposal with credibility. The template culminates with a strong call to action, urging the audience to seize the collaborative opportunity, and is rounded off with a polite 'Thank You' to leave a lasting impression. This template is a boon for sales professionals seeking to communicate their value proposition with clarity and persuasiveness.


6 diapositivas
End-to-End Business Process Visualization Presentation
Present every stage of your operations clearly with the End-to-End Business Process Visualization Presentation. This structured layout is perfect for mapping out linear workflows across departments, from initiation to final delivery. Easily customizable and compatible with PowerPoint, Canva, and Google Slides for seamless editing.


5 diapositivas
Annual Achievements and Highlights Presentation
Celebrate your progress with the Annual Achievements and Highlights Presentation. This timeline-style layout guides viewers along a visual path of milestones year by year. Each pin represents a key accomplishment, backed by icons and editable text for context. Perfect for end-of-year reviews or company retrospectives. Compatible with PowerPoint, Google Slides, and Canva.


7 diapositivas
Breast Cancer Awareness Infographic Presentation
A Breast Cancer Awareness infographic is a visual representation of important information related to breast cancer awareness, such as statistics, risk factors, prevention methods, screening guidelines, treatment options, and survivorship. The goal of this breast cancer awareness infographic is to educate people about breast cancer, increase awareness of the disease, and encourage early detection and treatment. This template has a pink theme and many helpful illustrations. It is fully editable and can be designed in various styles and formats, including graphs, illustrations, and photographs.


20 diapositivas
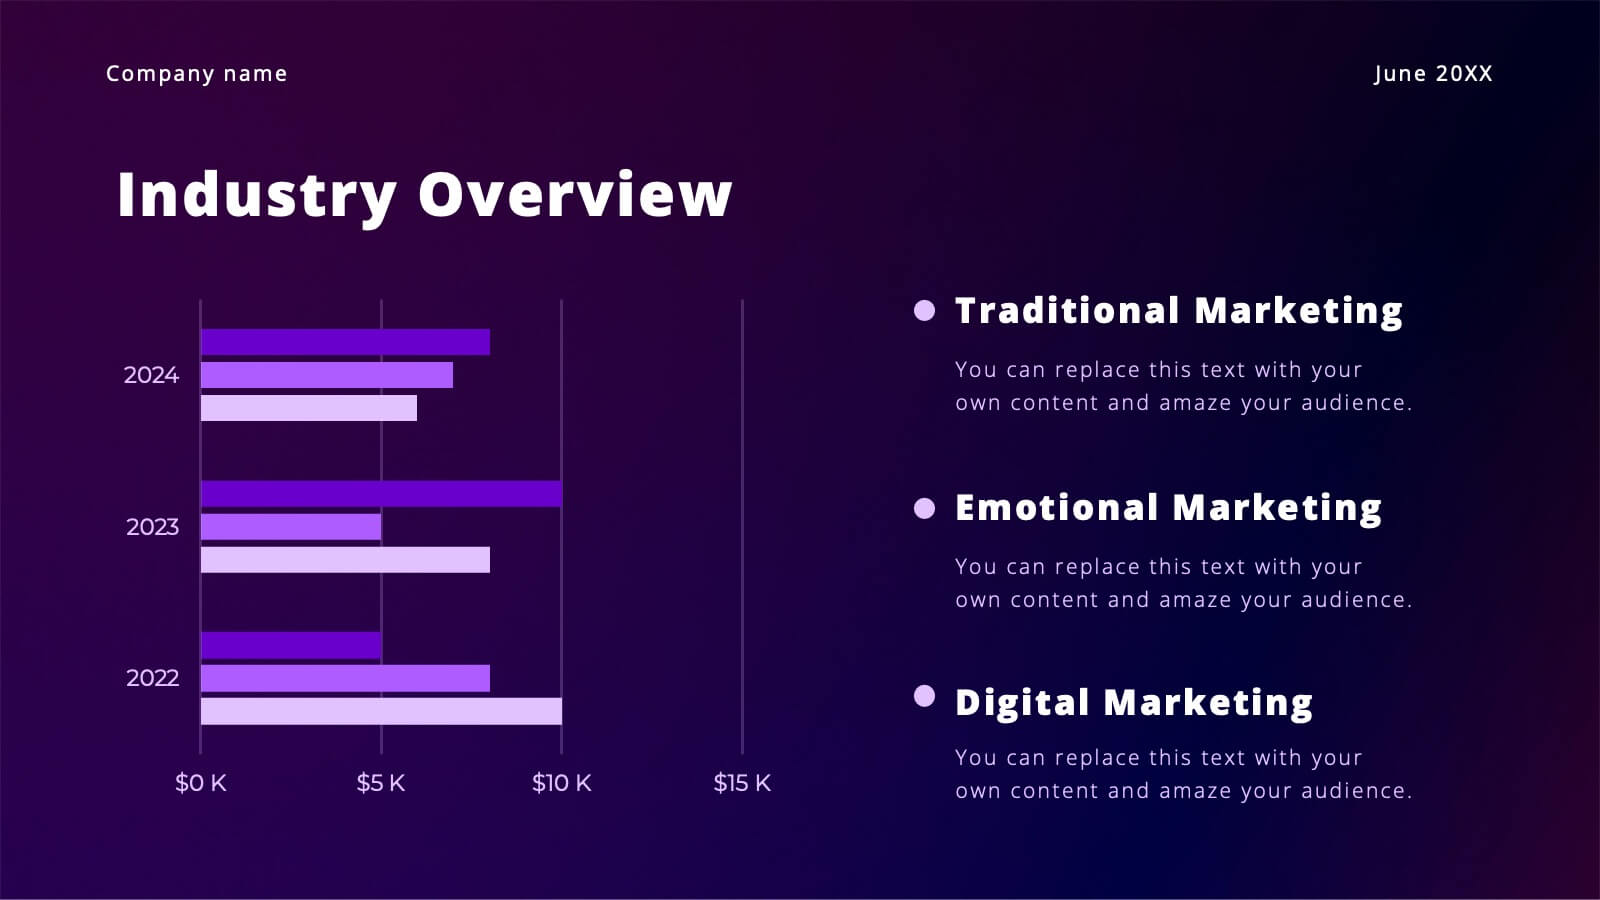
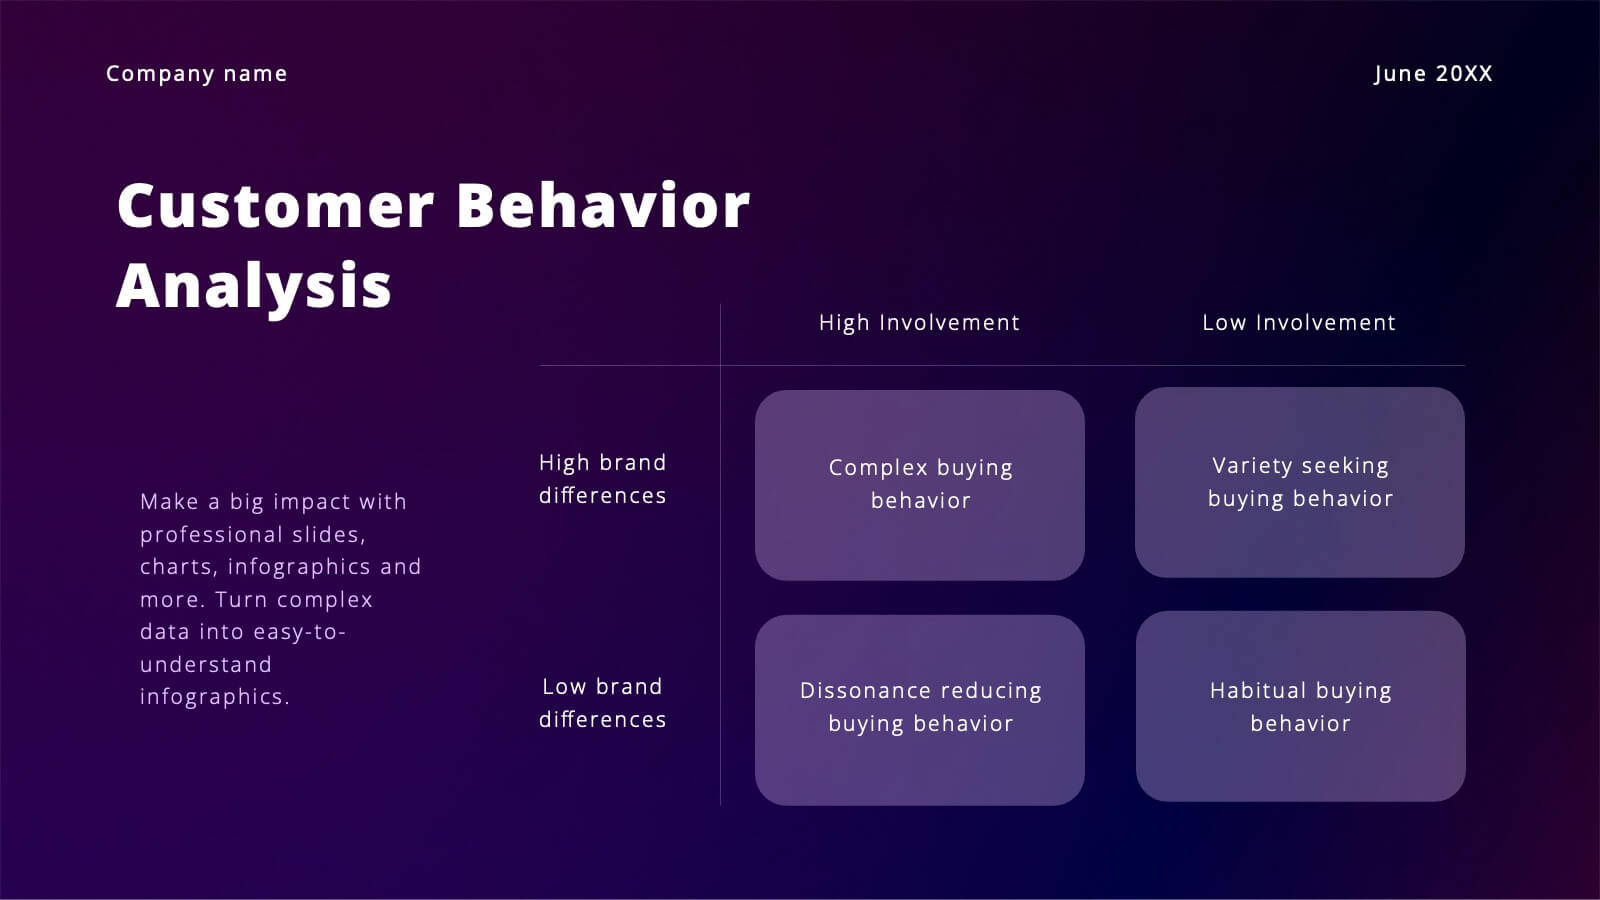
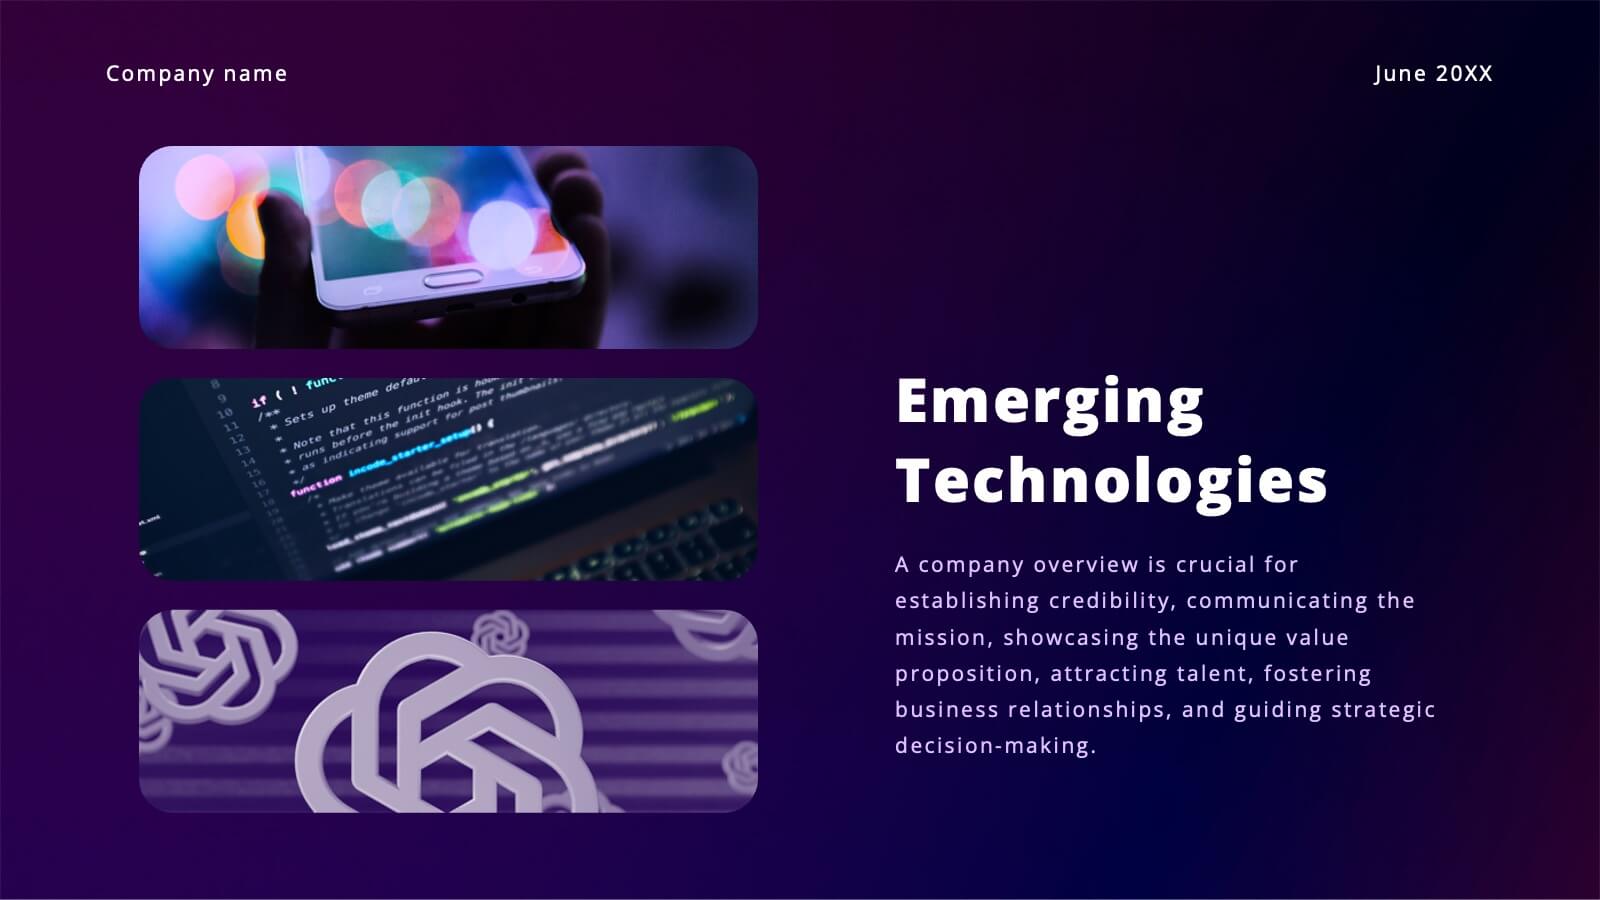
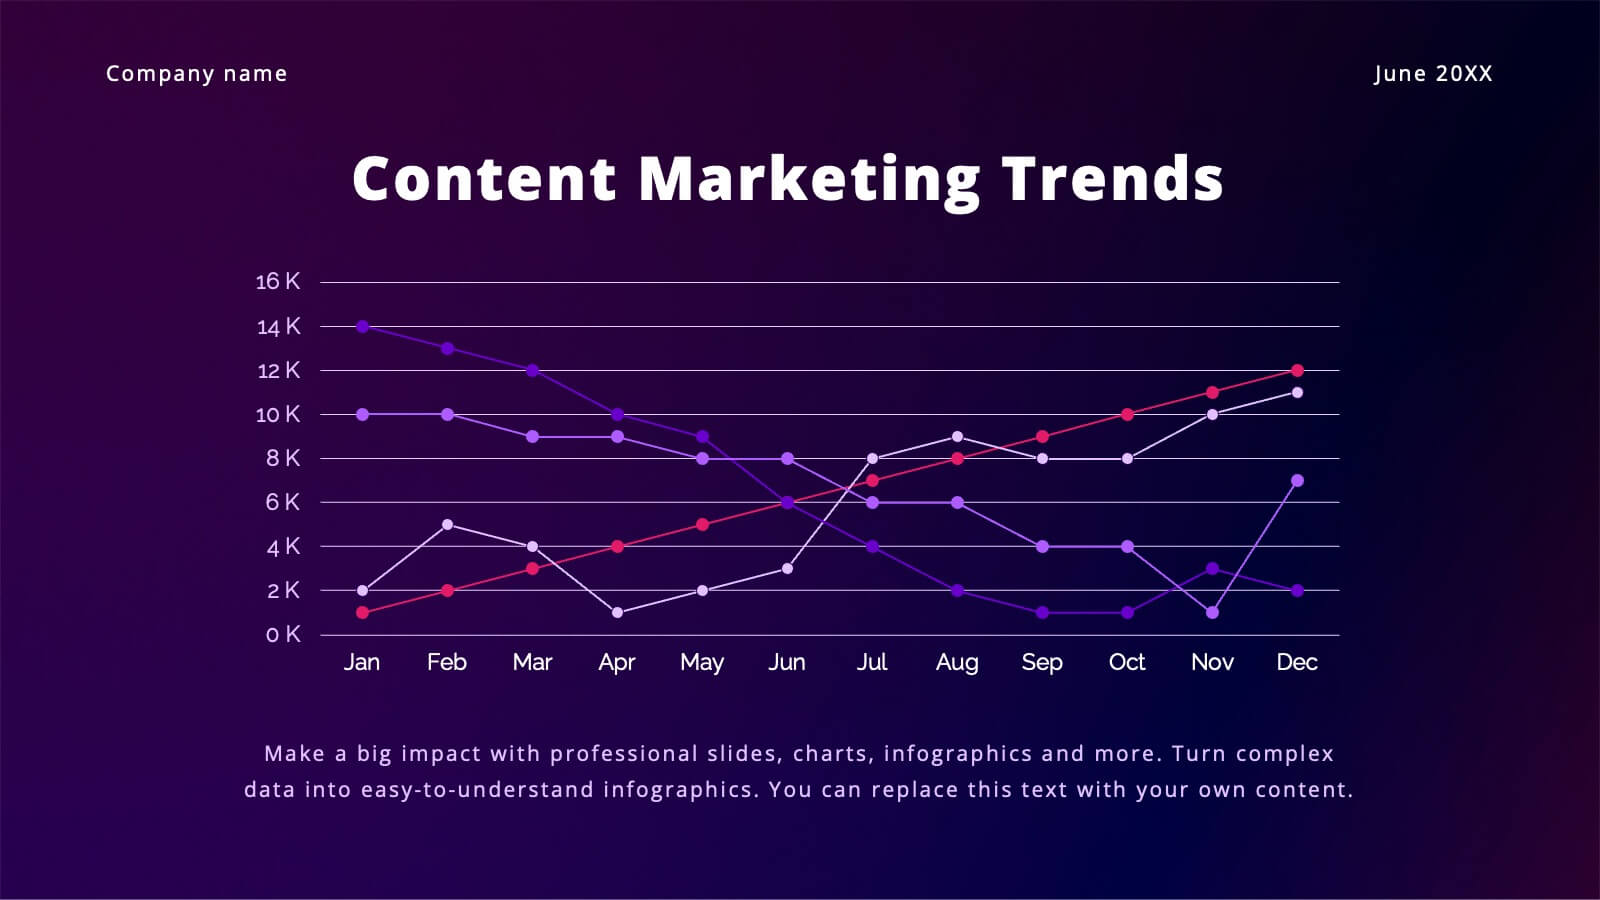
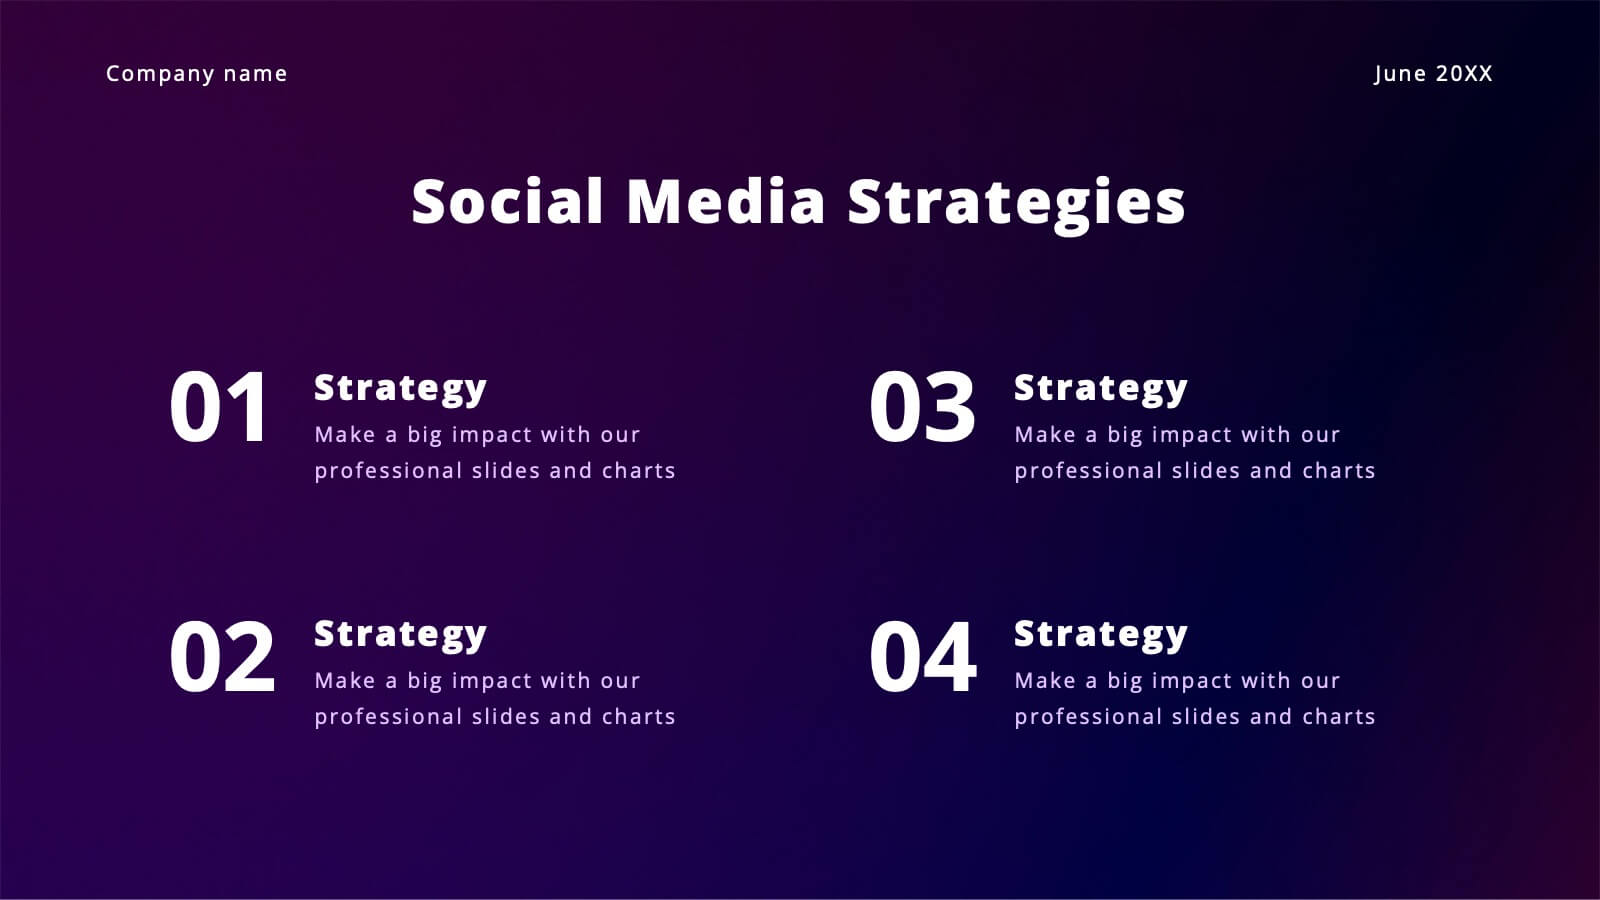
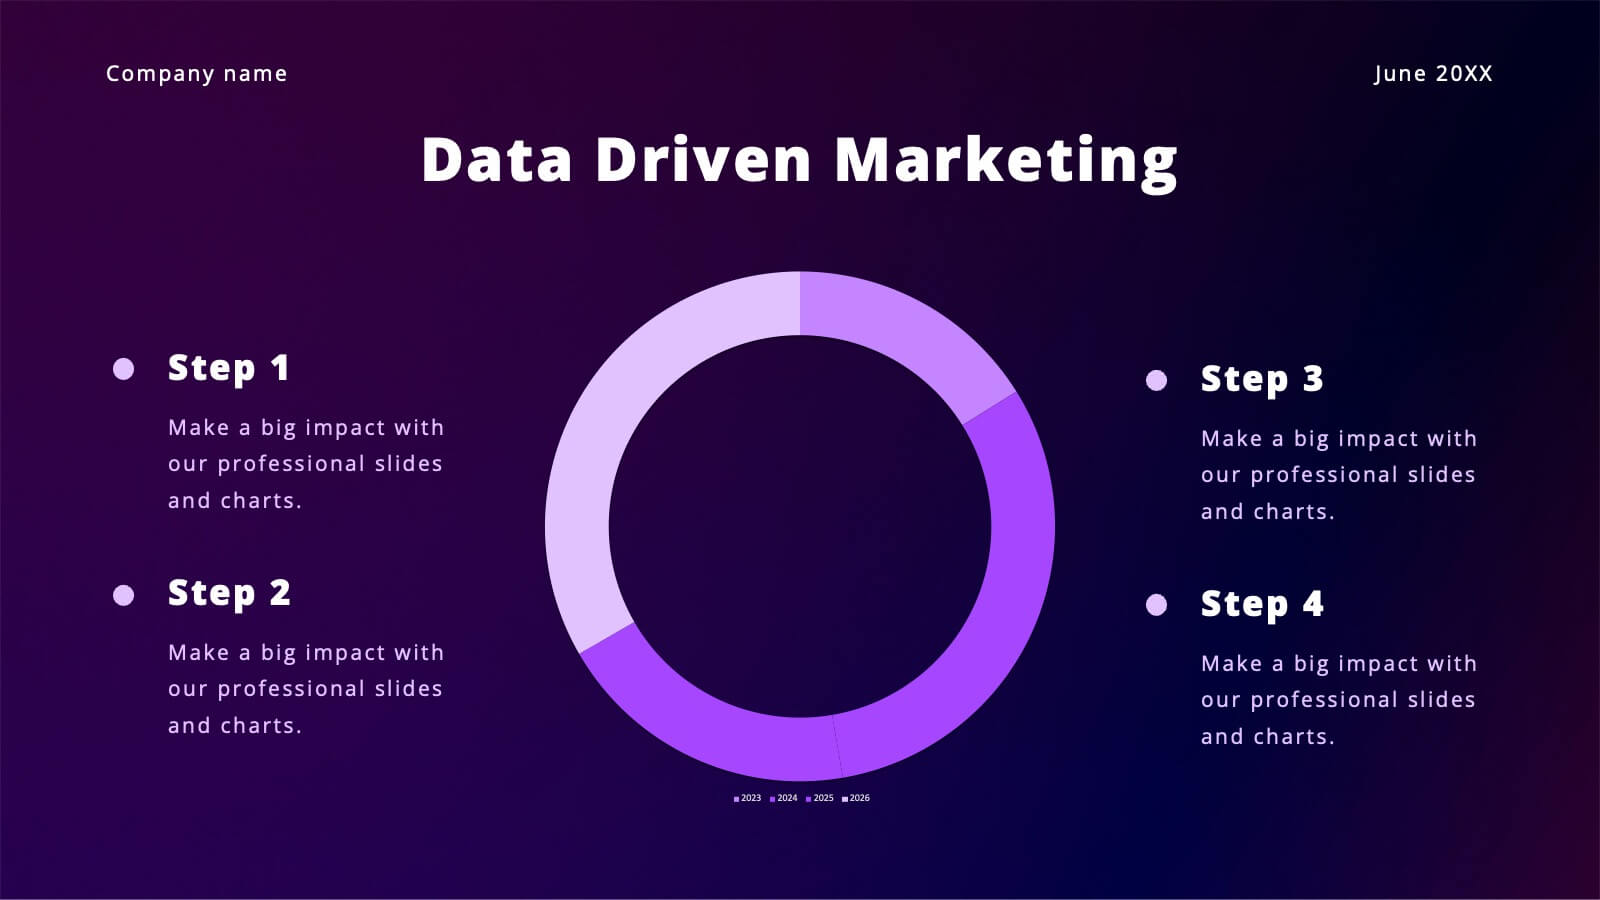
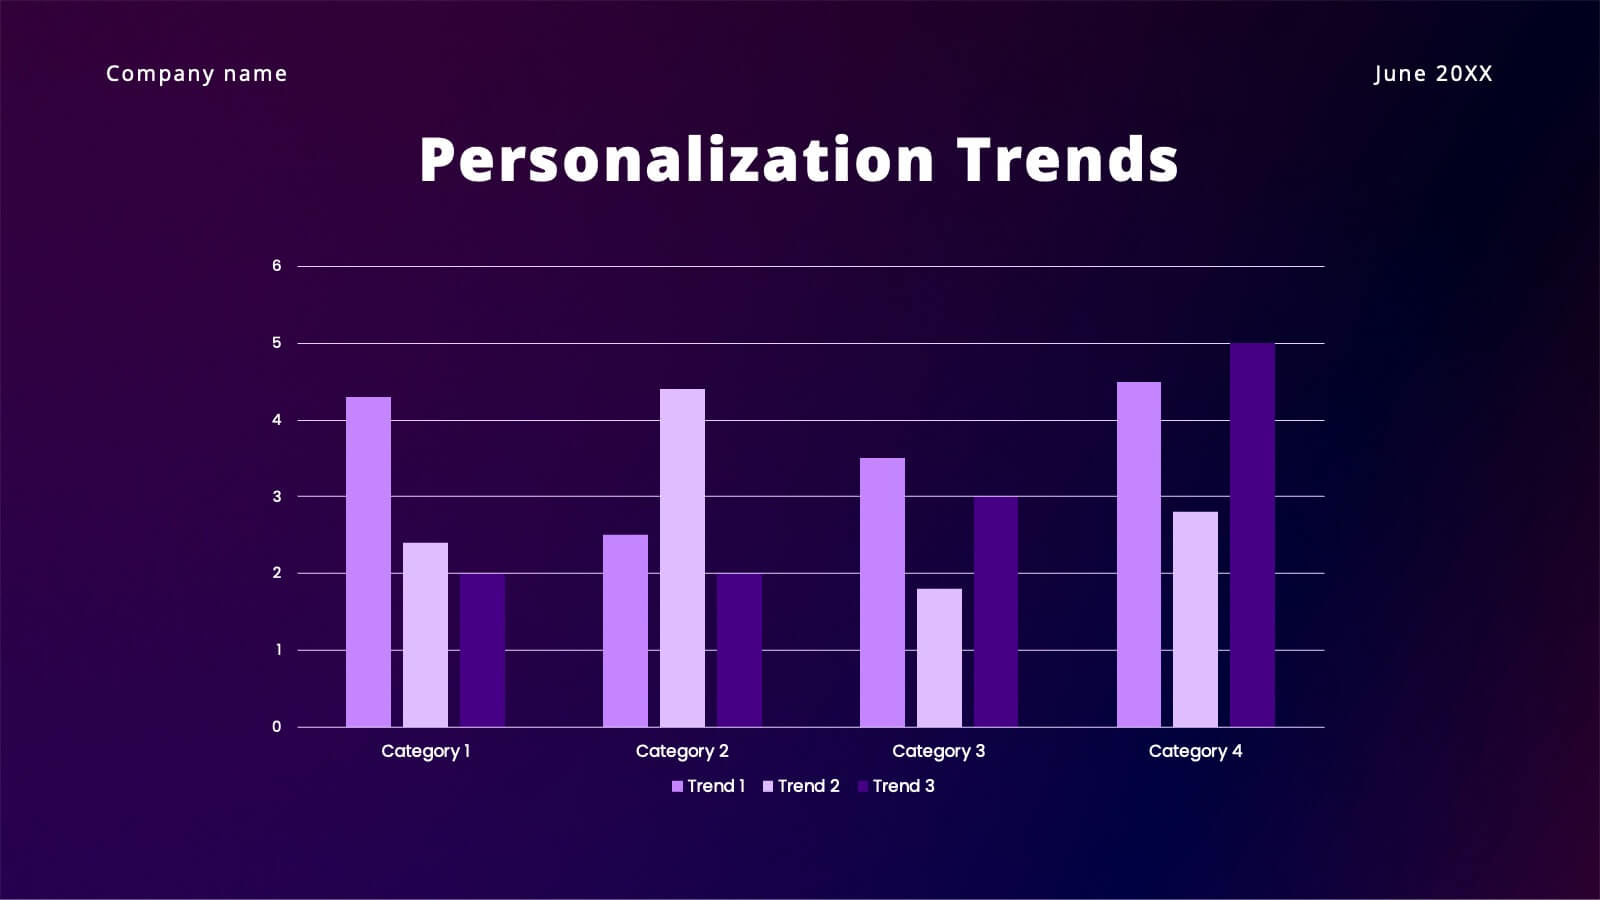
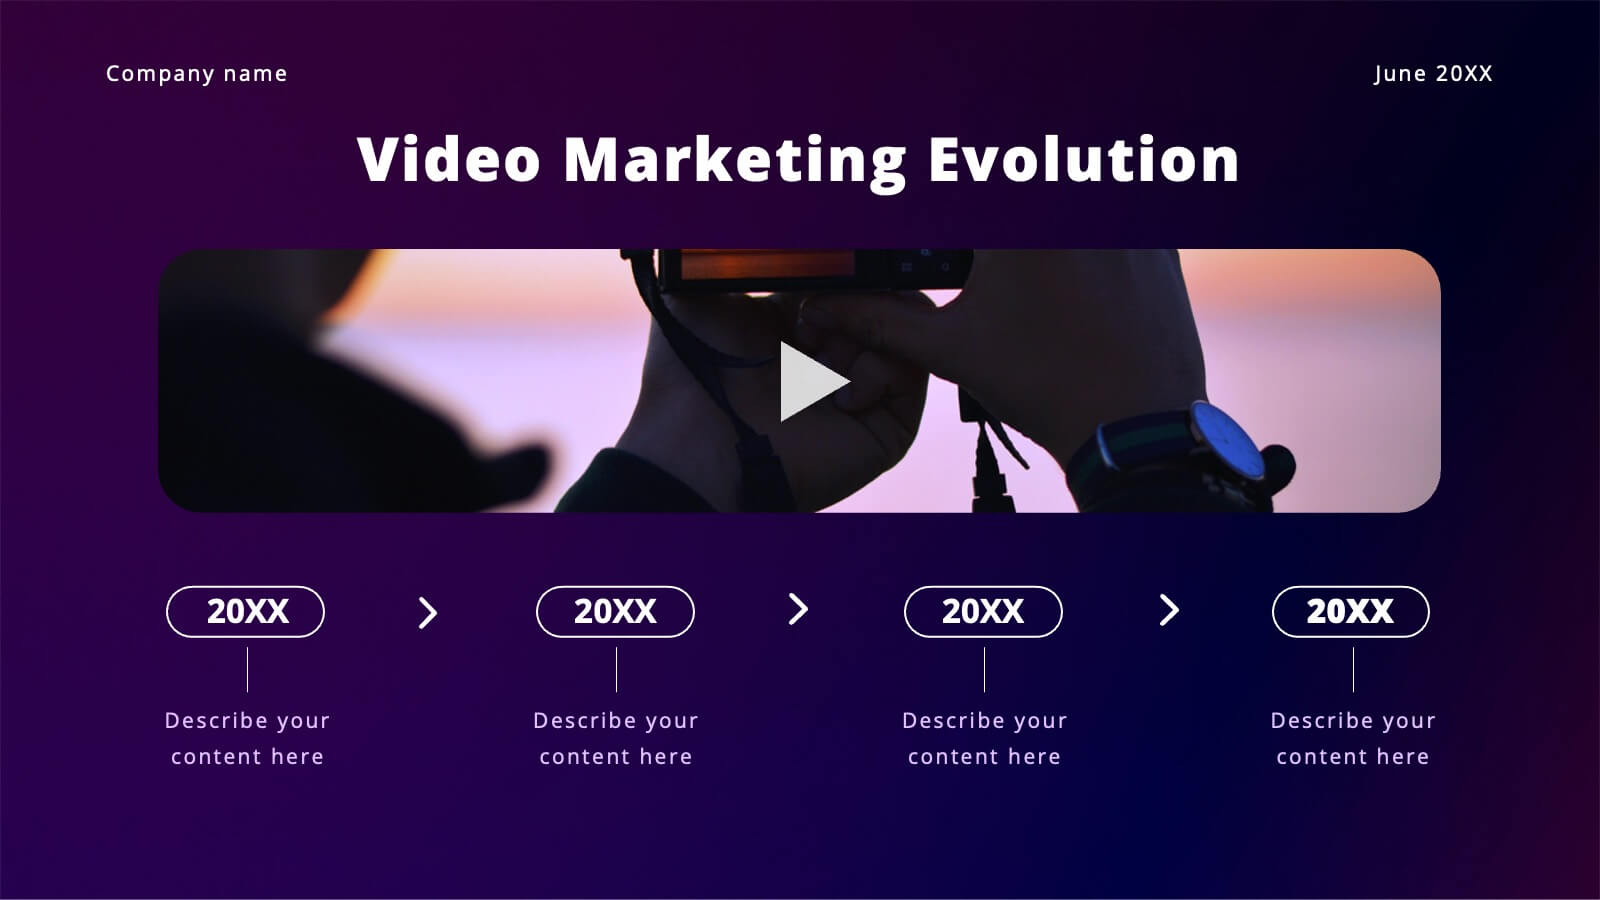
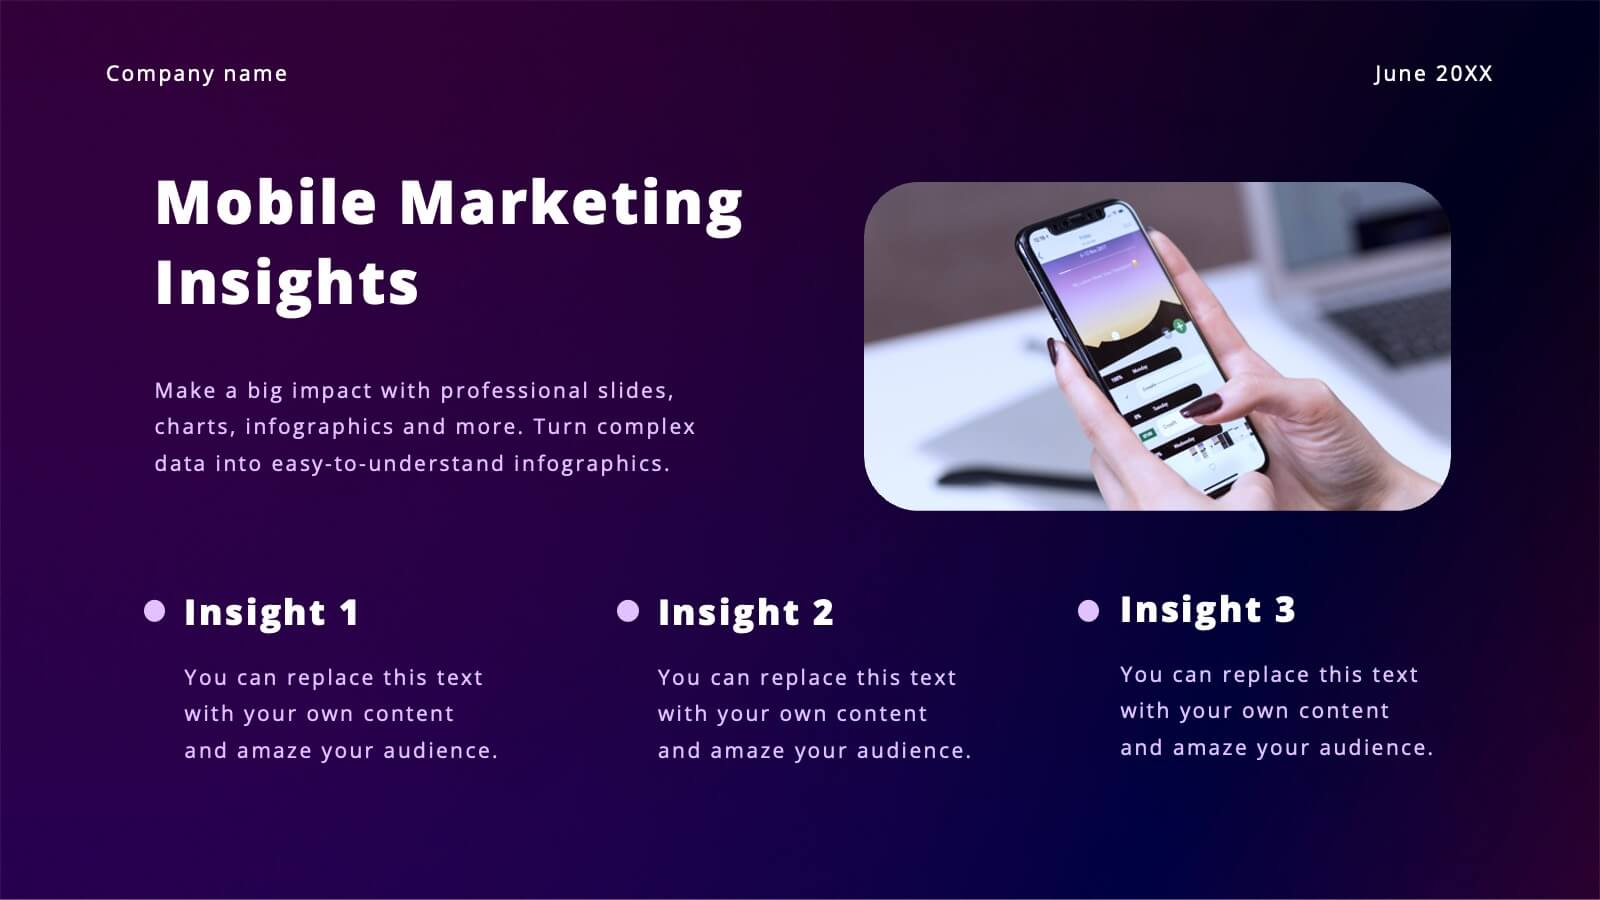
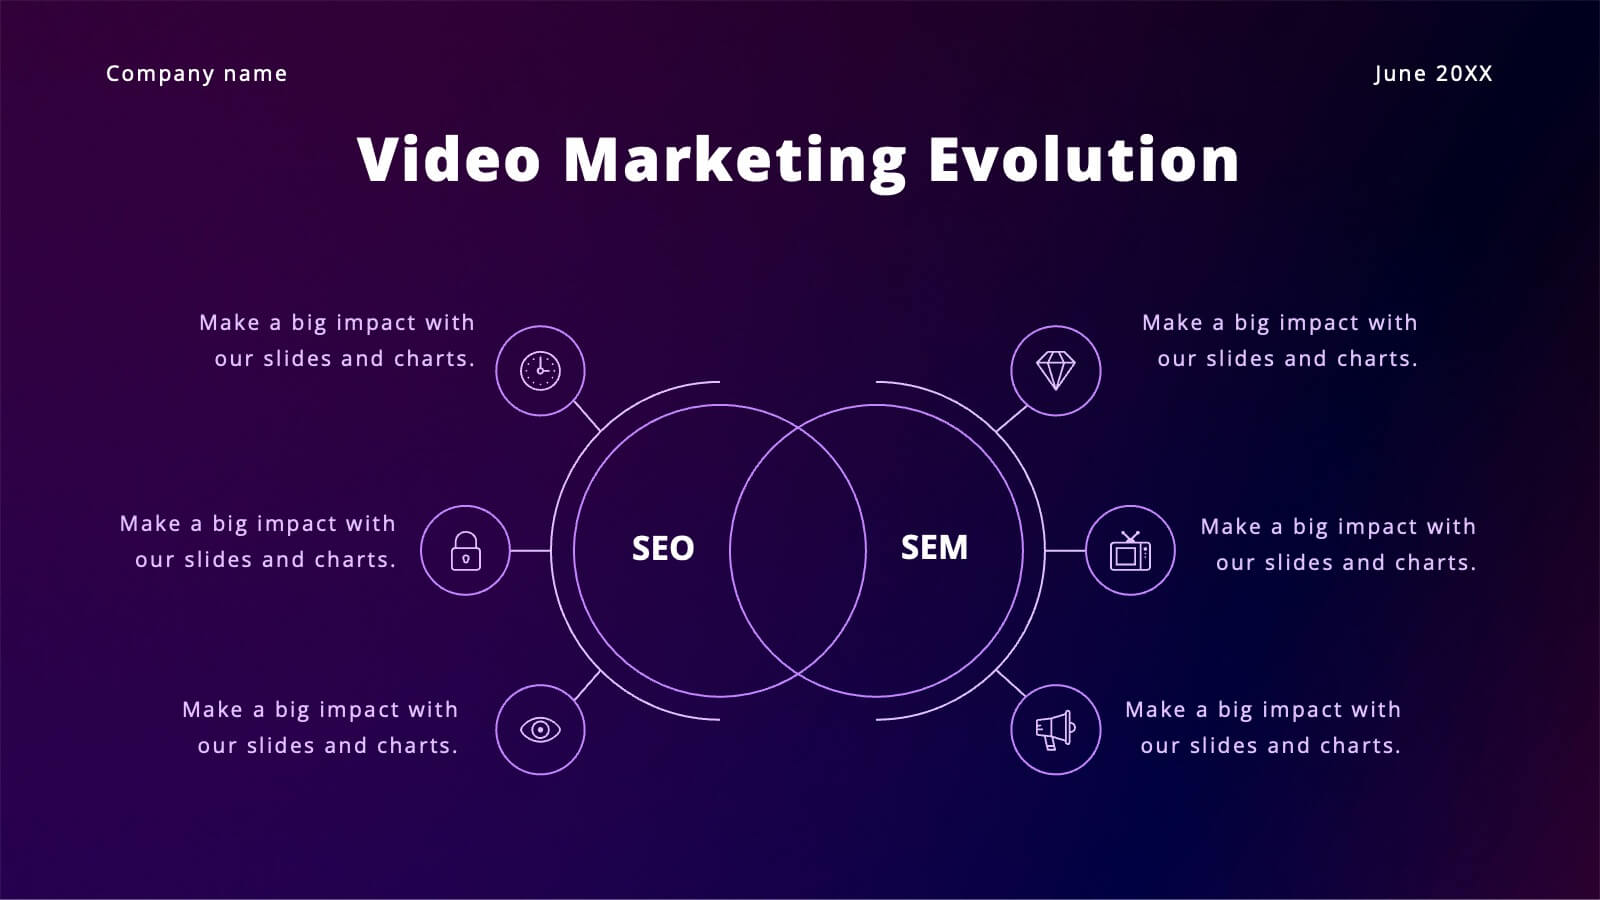
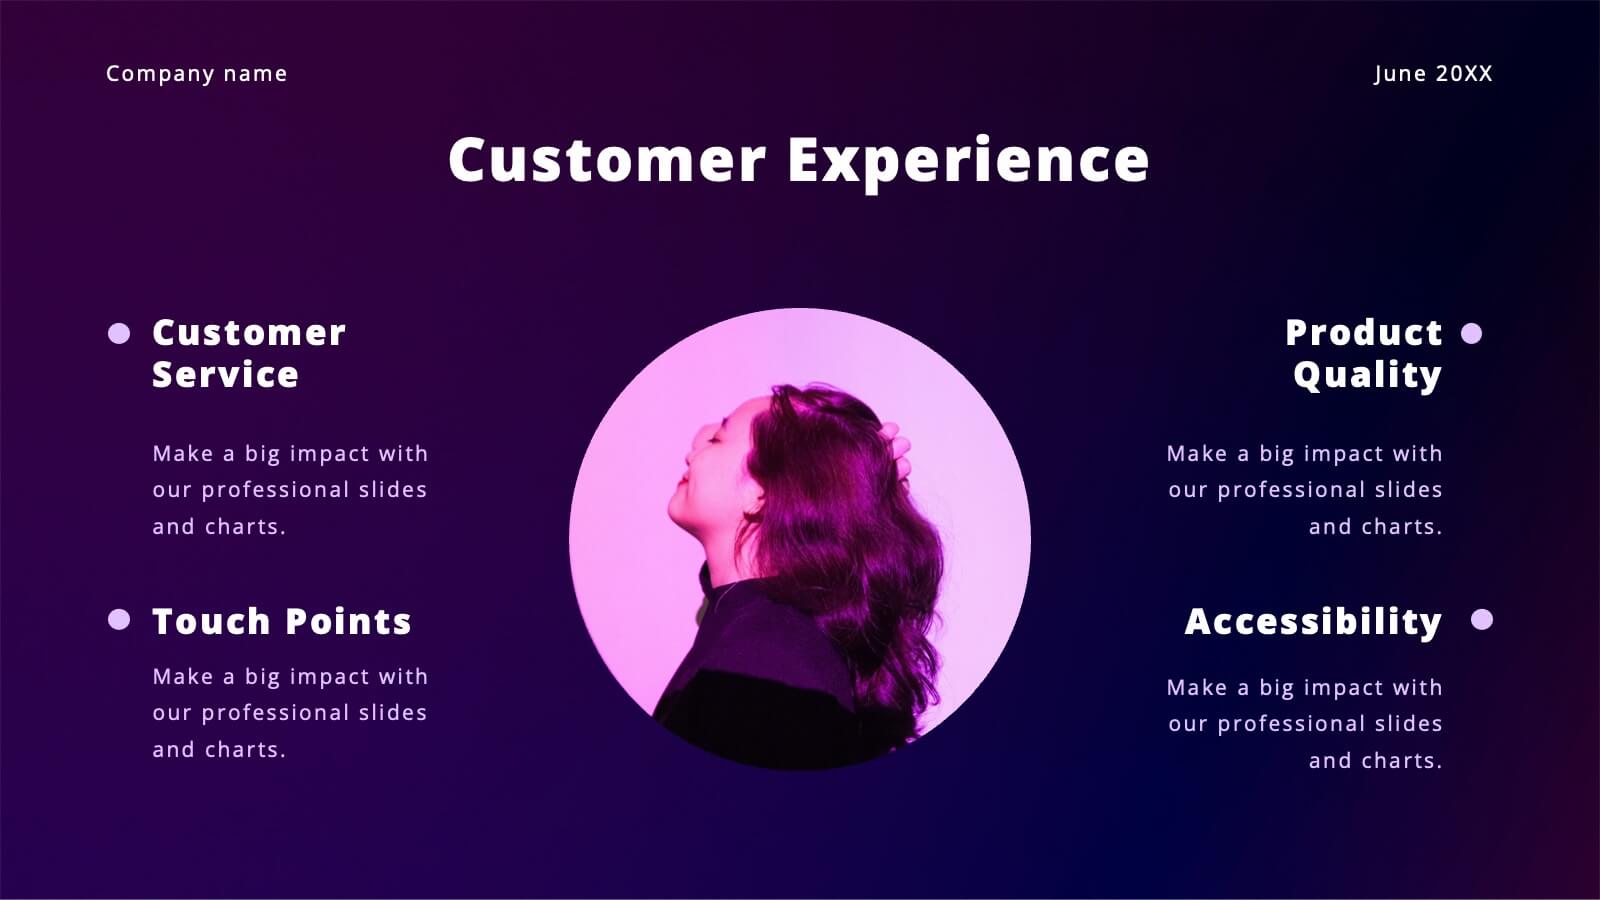
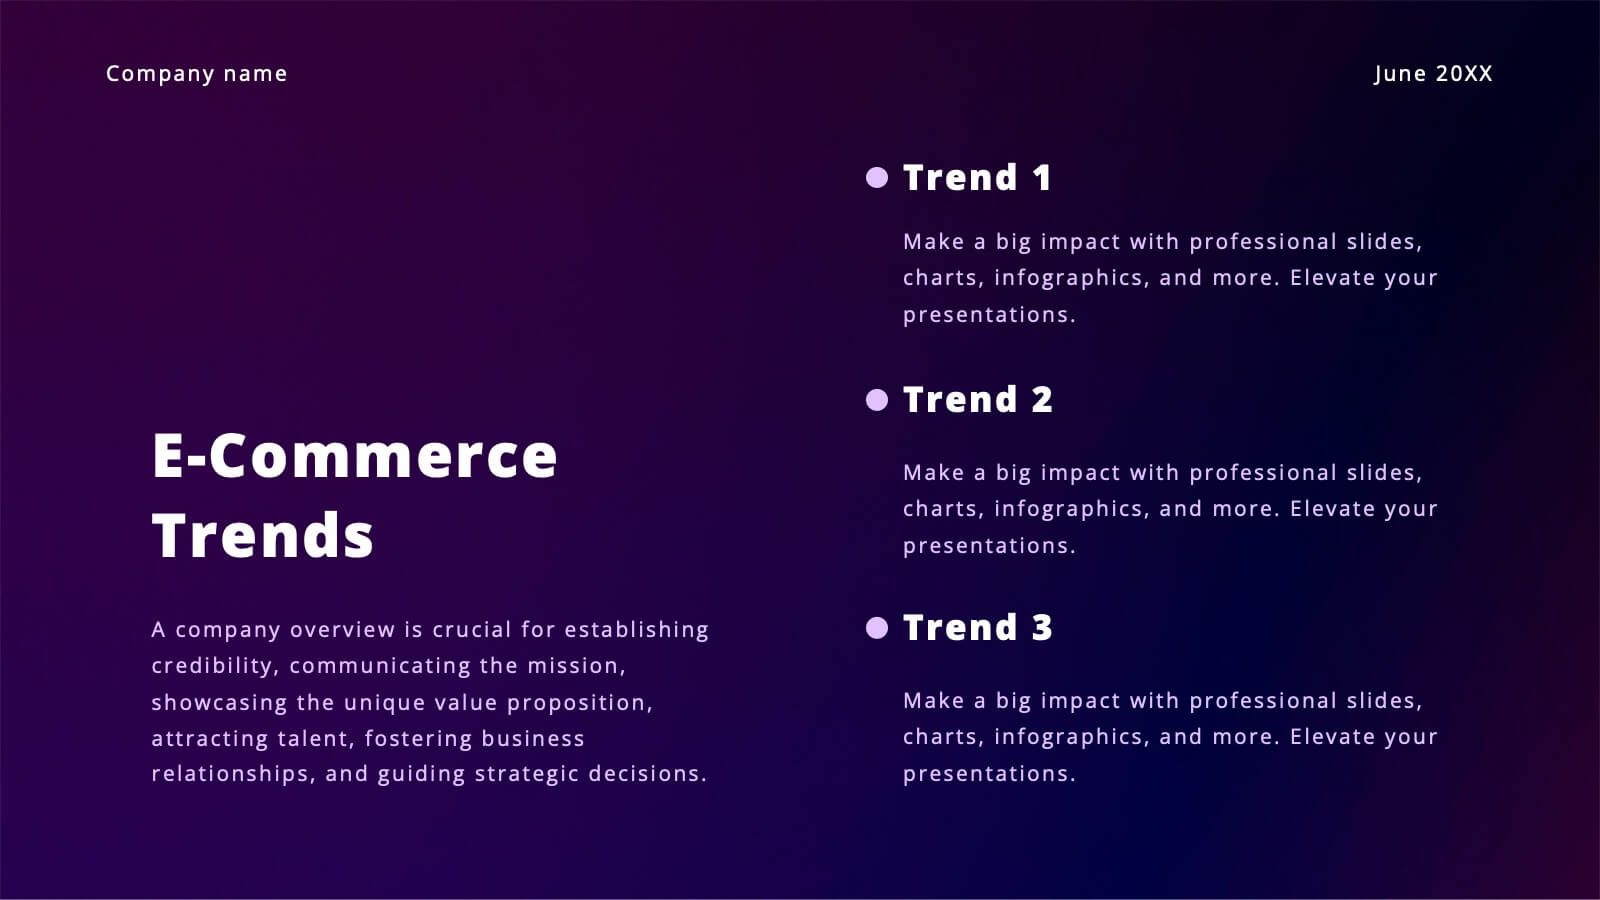
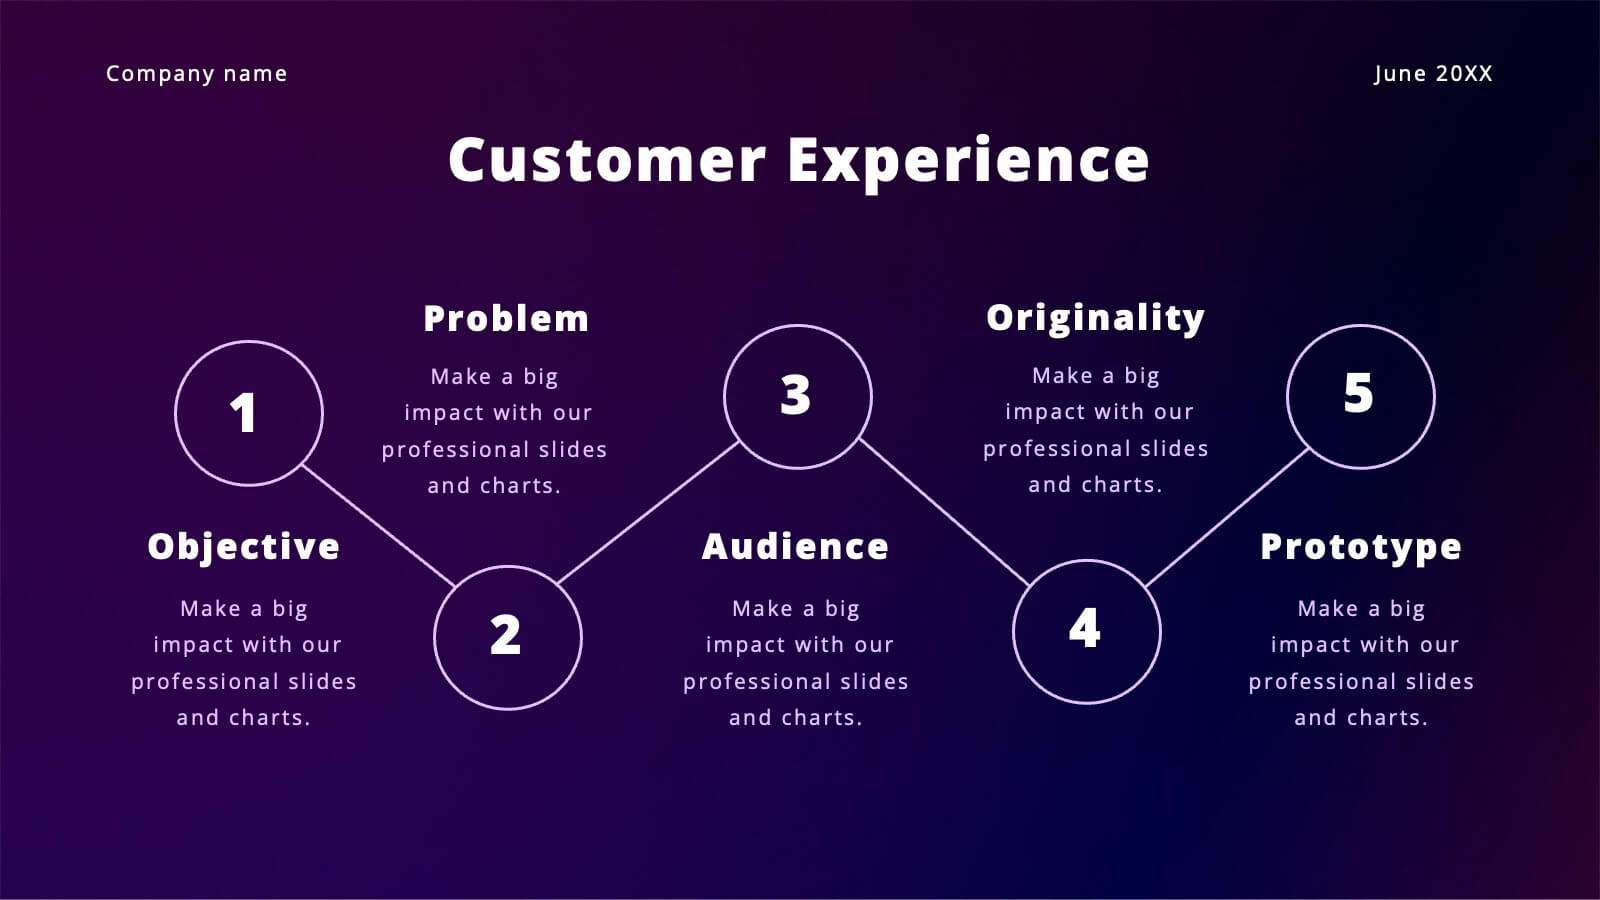
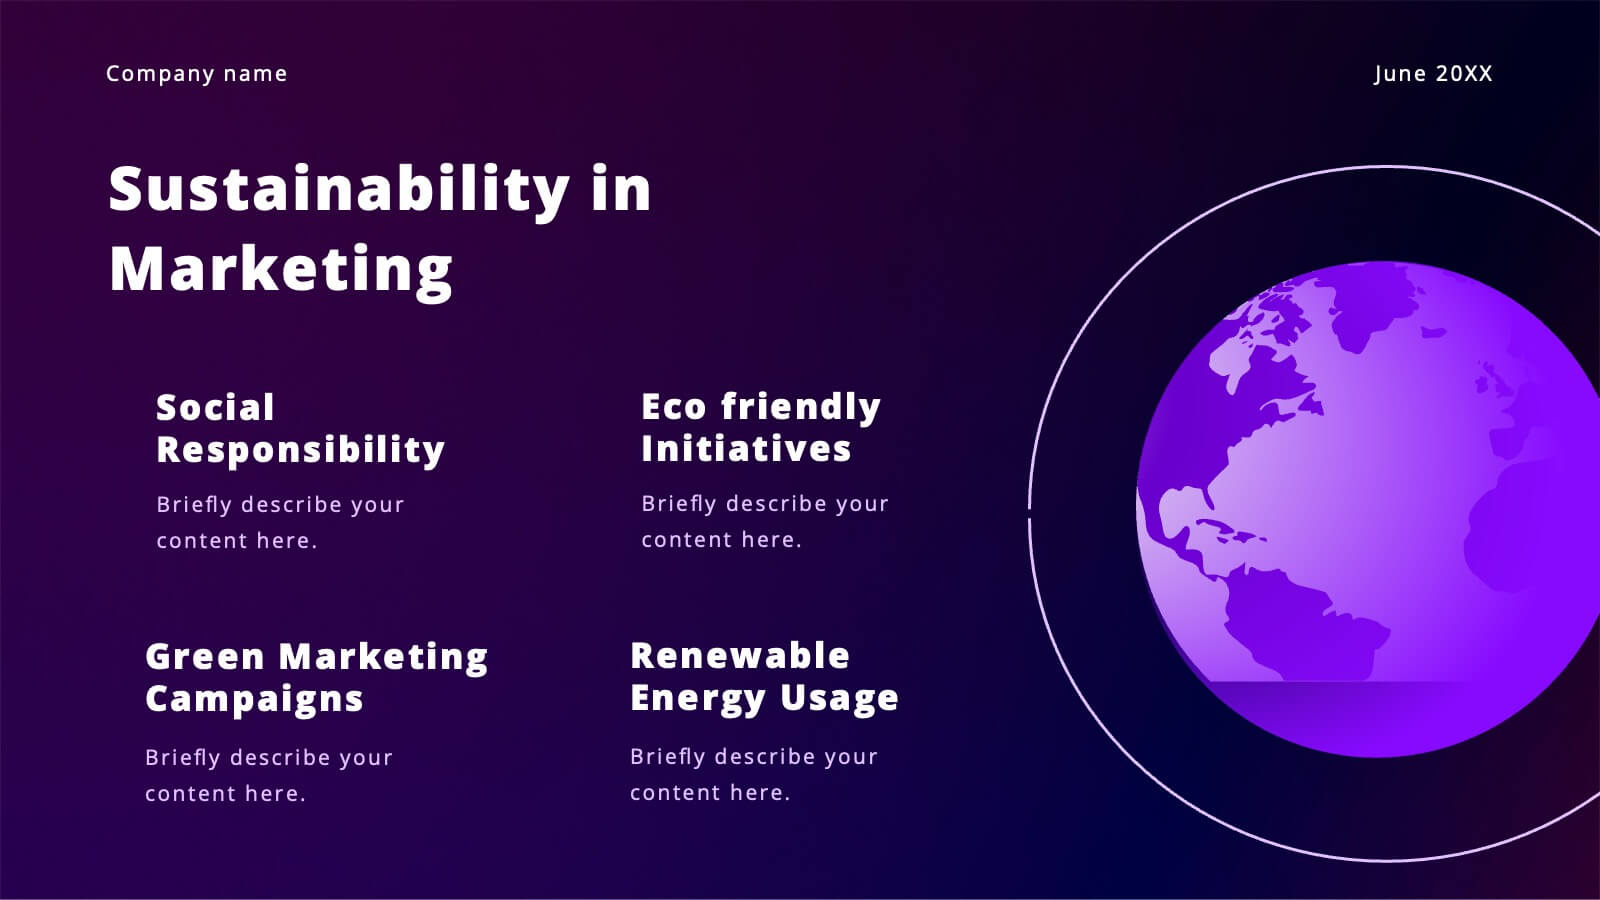
Vibrant Content Marketing Pitch Deck Presentation
Boost your marketing pitch with this vibrant deck! Covering industry overviews, customer behavior analysis, and emerging technologies, it’s designed to captivate your audience. Highlight social media strategies, data-driven marketing, and e-commerce trends effortlessly. Perfect for presenting a comprehensive marketing plan. Compatible with PowerPoint, Keynote, and Google Slides. Make your next pitch stand out!


7 diapositivas
Marketing Strategy Wheel Infographic
Our Marketing Strategy Wheel Infographic is an invaluable asset for marketers, strategists, and business leaders. This visual tool is designed to outline the multi-faceted approach required for a successful marketing strategy, incorporating various elements that contribute to a comprehensive marketing plan. The infographic displays sections like market analysis, goal setting, budget allocation, and action plans in a circular layout, symbolizing the interconnected nature of marketing efforts. By presenting these components, the infographic serves as a guide for developing a balanced and effective marketing strategy. You can tailor this infographic to include specific tactics, channels, and metrics relevant to your organization, making it a versatile tool for internal strategy sessions, client presentations, or marketing education. This SEO-optimized graphic is crafted to communicate complex marketing plans in an accessible and engaging manner. Use our Marketing Strategy Wheel Infographic to visually communicate your marketing plan's structure and components, ensuring a holistic approach to reaching your business objectives.


23 diapositivas
Phantasia Sales Pitch Deck Presentation
Impress stakeholders and close deals effectively with this sleek and dynamic pitch deck template. With structured slides for company overview, problem statements, and market opportunities, you can present your solutions with clarity and impact. Showcase your business model, revenue streams, and unique selling propositions to stand out in a competitive landscape. This template also includes slides for financial projections, growth strategies, and funding requirements, making it an excellent choice for entrepreneurs, sales teams, and business leaders. The modern design ensures your data is engaging and easy to follow, keeping your audience focused on your message. Fully editable and compatible with PowerPoint, Google Slides, and Keynote, this template provides the customization options you need to align with your branding and goals. Perfect for delivering professional and persuasive presentations.


5 diapositivas
Modern Tech Stack Overview Presentation
Showcase your technology architecture with this Modern Tech Stack Overview. Featuring a robotic hand and circular layout, it’s ideal for product demos, software architecture, or developer briefings. Designed for PowerPoint, Keynote, and Google Slides, this deck makes complex tech structures easy to understand and visually engaging for modern audiences.


26 diapositivas
Beginner's Guide to Investing Presentation
This presentation template is a fantastic starting point for anyone looking to dive into the world of investing. Designed with clarity and accessibility in mind, it caters specifically to beginners eager to understand the fundamentals of investment strategies and options. The template introduces users to the basics of stocks, bonds, and other investment vehicles, using easy-to-understand language and clear, informative visuals. The content is laid out in a logical sequence, beginning with basic concepts and gradually progressing to more complex investment ideas and strategies. Slides are enriched with diagrams, charts, and comparison tables that break down financial data and trends in a digestible format. Key investment terms are explained through engaging infographics that make learning both interactive and effective. To ensure a broad usability range, the template is fully compatible with popular presentation platforms such as PowerPoint, Google Slides, and Keynote. This compatibility allows users to easily adapt and present the information across different devices and settings, making it an invaluable tool for personal education or group training sessions in various learning environments.


4 diapositivas
Leadership Training Framework Presentation
Inspire growth and guide your team toward success with this clear and modern presentation layout. Designed to illustrate leadership principles, development stages, and coaching strategies, it helps communicate training goals with professionalism and ease. Fully customizable and compatible with PowerPoint, Keynote, and Google Slides for seamless use across platforms.


4 diapositivas
Team Performance Improvement Plan Presentation
Bring strategy to life with a clean, focused layout that makes team growth easy to follow. This template helps visualize performance gaps, goals, and action steps in a simple format, perfect for outlining improvement plans and productivity initiatives. Fully editable in PowerPoint, Keynote, and Google Slides for seamless team collaboration.


5 diapositivas
Personal SWOT Infographics
Embark on a journey of self-discovery and professional development with our personal SWOT infographics template. Rendered in a palette that combines the tranquility of blue, the growth associated with green, and the innovative spirit of purple, this resource is a catalyst for introspection. Whether you're a career coach or individual standing at a crossroads, these vertical, creatively informative graphics illuminate strengths, weaknesses, opportunities, and threats in a visually compelling spectrum. Compatible with Powerpoint, Keynote, and Google Slides. The inclusion of intuitive icons and adaptable image placeholders simplifies complex introspection.


5 diapositivas
Western Europe Political Map Slide Presentation
Showcase political insights and regional data with a clear, modern map design that highlights countries across Western Europe. Perfect for comparing demographics, election data, or market performance, this layout combines clarity with visual impact. Fully compatible with PowerPoint, Keynote, and Google Slides for easy customization and professional presentations.


4 diapositivas
Investment Analysis Finance Presentation
Target your financial insights with this Investment Analysis Finance Presentation. Designed with a bold bullseye diagram and four labeled pointers, this slide helps communicate core focus areas, ROI, risk zones, or asset distribution. Ideal for pitch decks, portfolio reviews, and financial reports. Fully editable in PowerPoint, Keynote, and Google Slides—perfect for analysts, investors, and finance professionals.


5 diapositivas
5 Types of Credit Cards Explained Presentation
Unlock the world of smarter spending with this clear, engaging layout designed to break down different credit card types in a simple, visual way. It helps you present features, benefits, and key distinctions with ease, making financial concepts easy to understand. Fully editable and compatible with PowerPoint, Keynote, and Google Slides.