


Características


¿Tienes alguna pregunta?
Recomendar


3 diapositivas
Break Even Financial Model Presentation
Bring your financial story to life with this sleek and professional presentation design. Ideal for illustrating profit margins, cost recovery, or growth potential, it helps visualize when investments start to pay off. Fully customizable and compatible with PowerPoint, Keynote, and Google Slides for effortless editing and impactful presentations.


5 diapositivas
Target Audience Demographics
Present gender-based audience insights with this clean, dual-bar infographic slide. Ideal for showing comparative statistics between men and women across five demographic categories. Use this layout to support marketing analysis, campaign targeting, or consumer behavior reports. Editable in PowerPoint, Keynote, and Google Slides.


7 diapositivas
Science Program Infographic Presentation
Science play's a crucial role in shaping our understanding of the world around us and has numerous applications in fields such as medicine and environmental science. This template can be used to present your science project in a professional fashion. The infographic contains all the graphs, figures and data you need, so that all you need to include is your own text. This is a creative template perfect for your next scientific research projects. It can be used to present the results of a study or an experiment. This template is compatible with powerpoint, keynote and google slides.


20 diapositivas
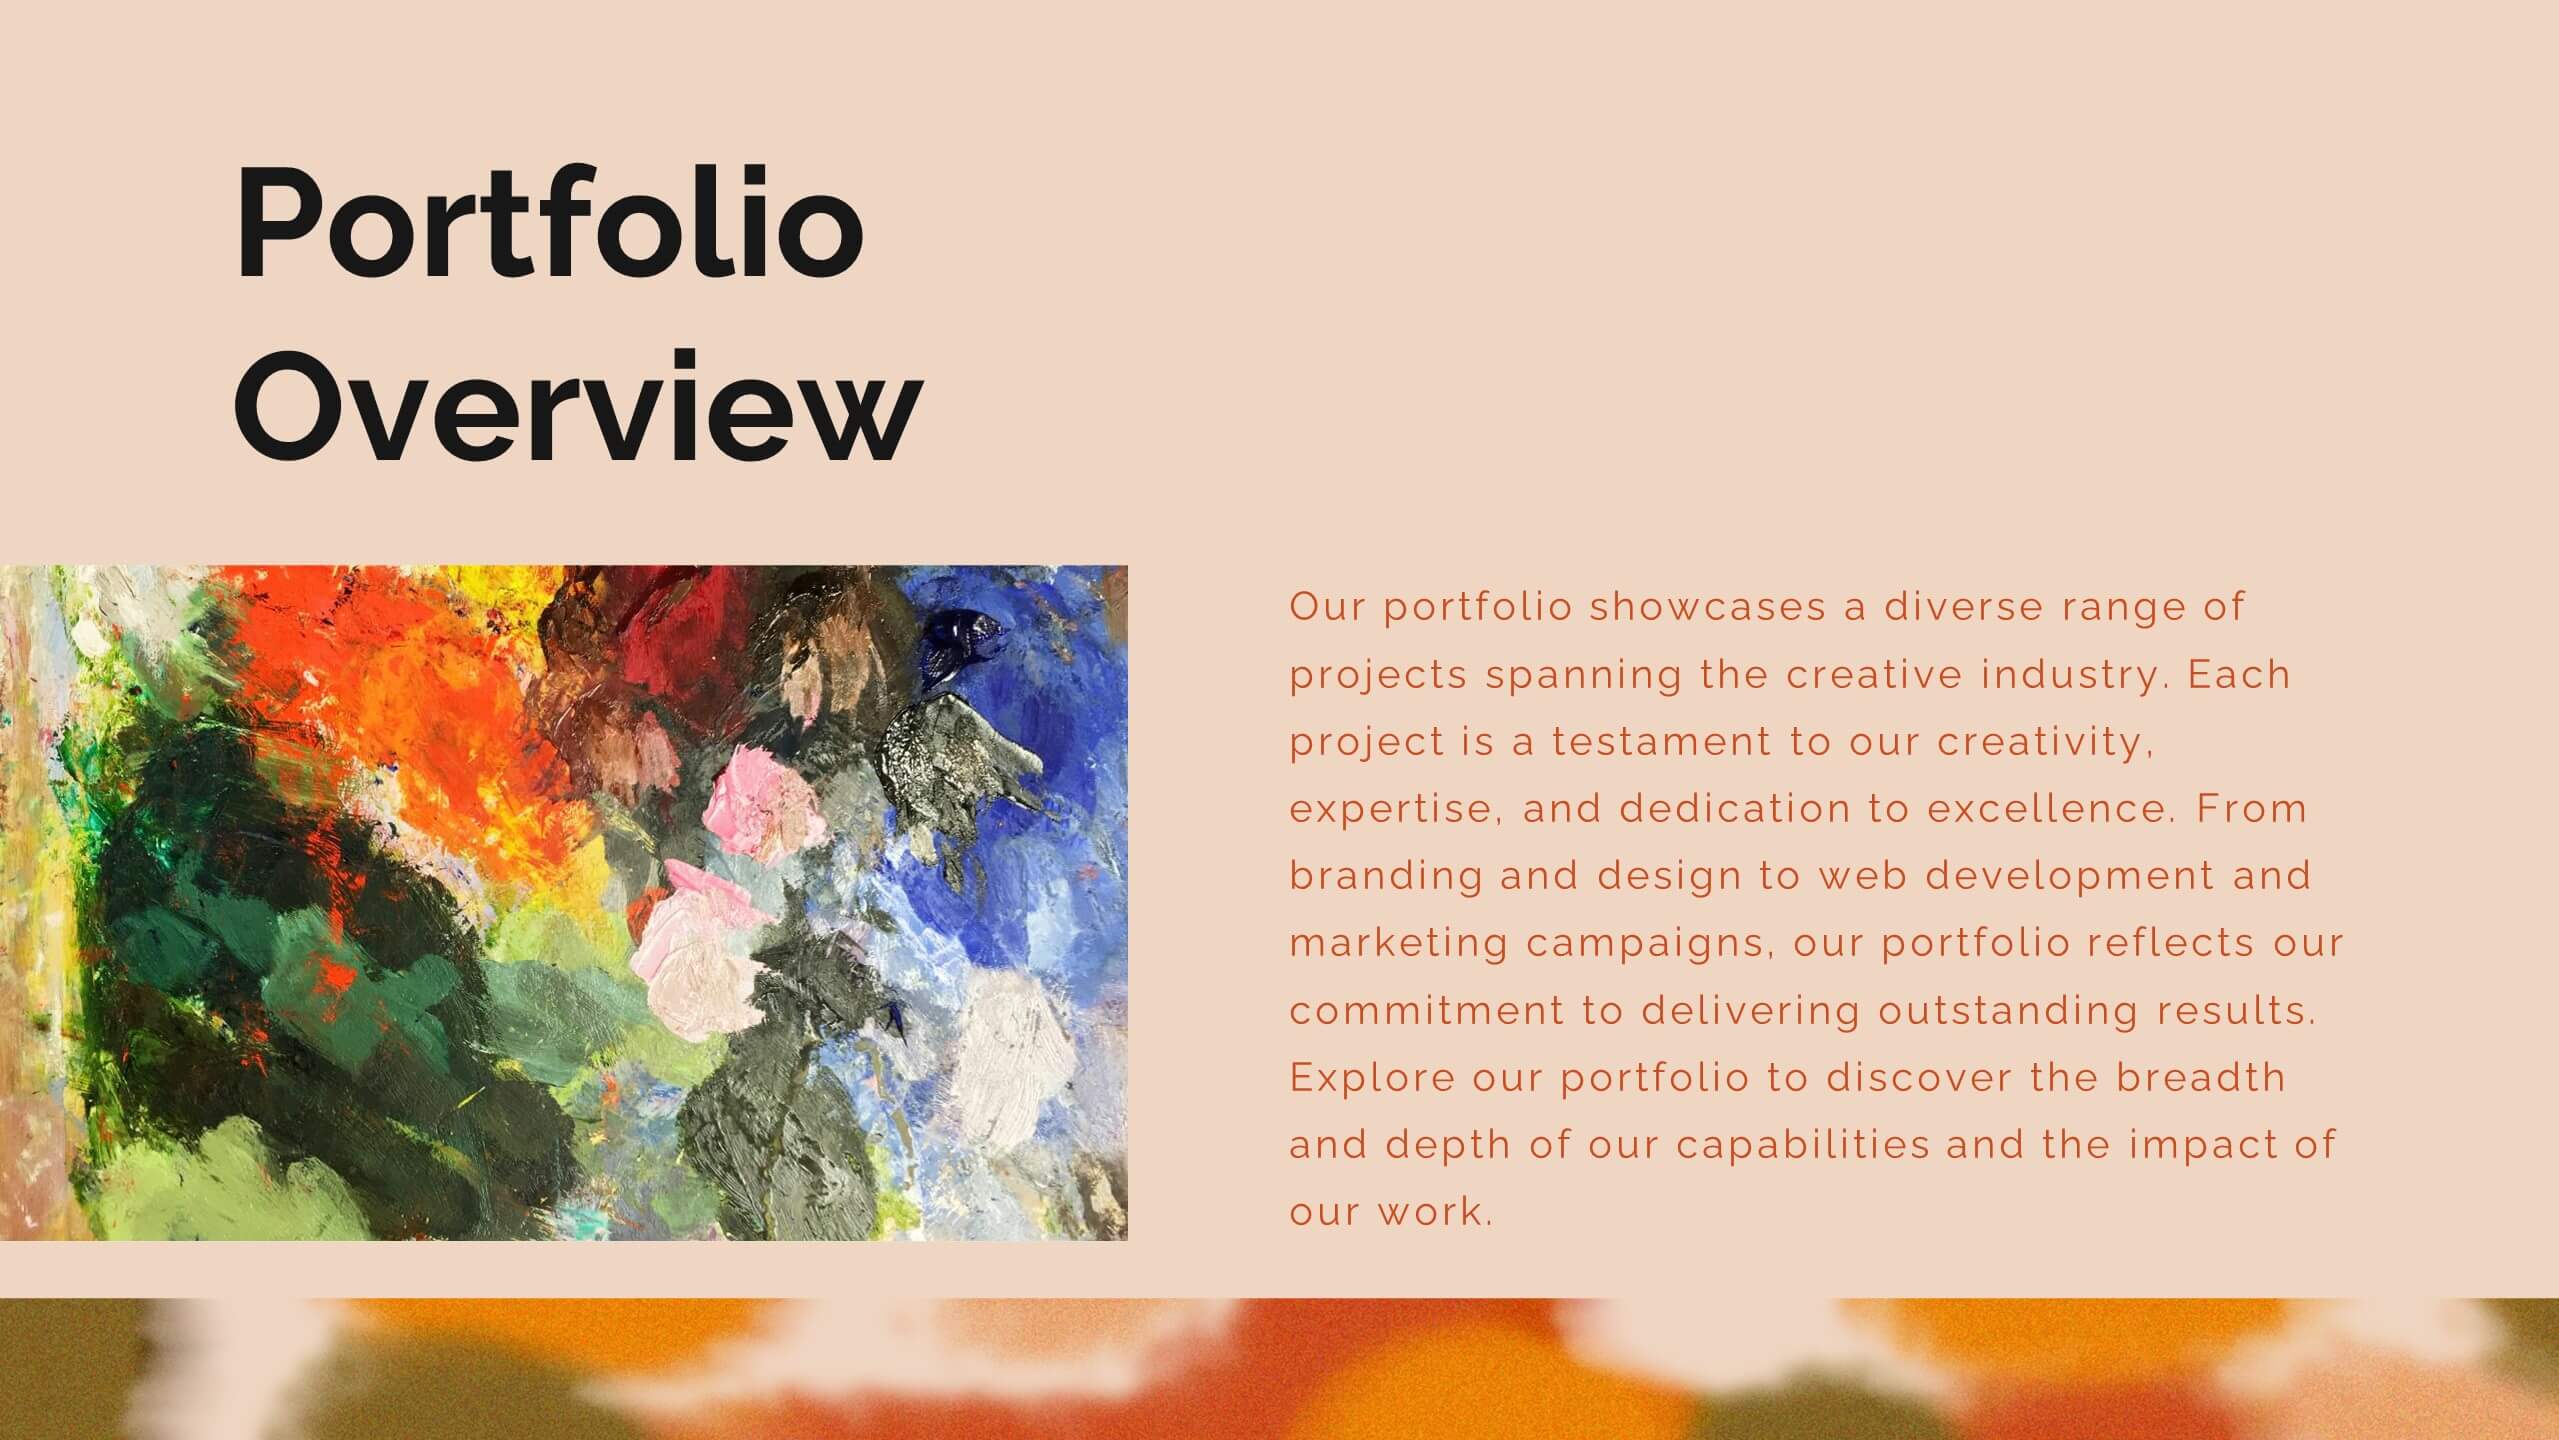
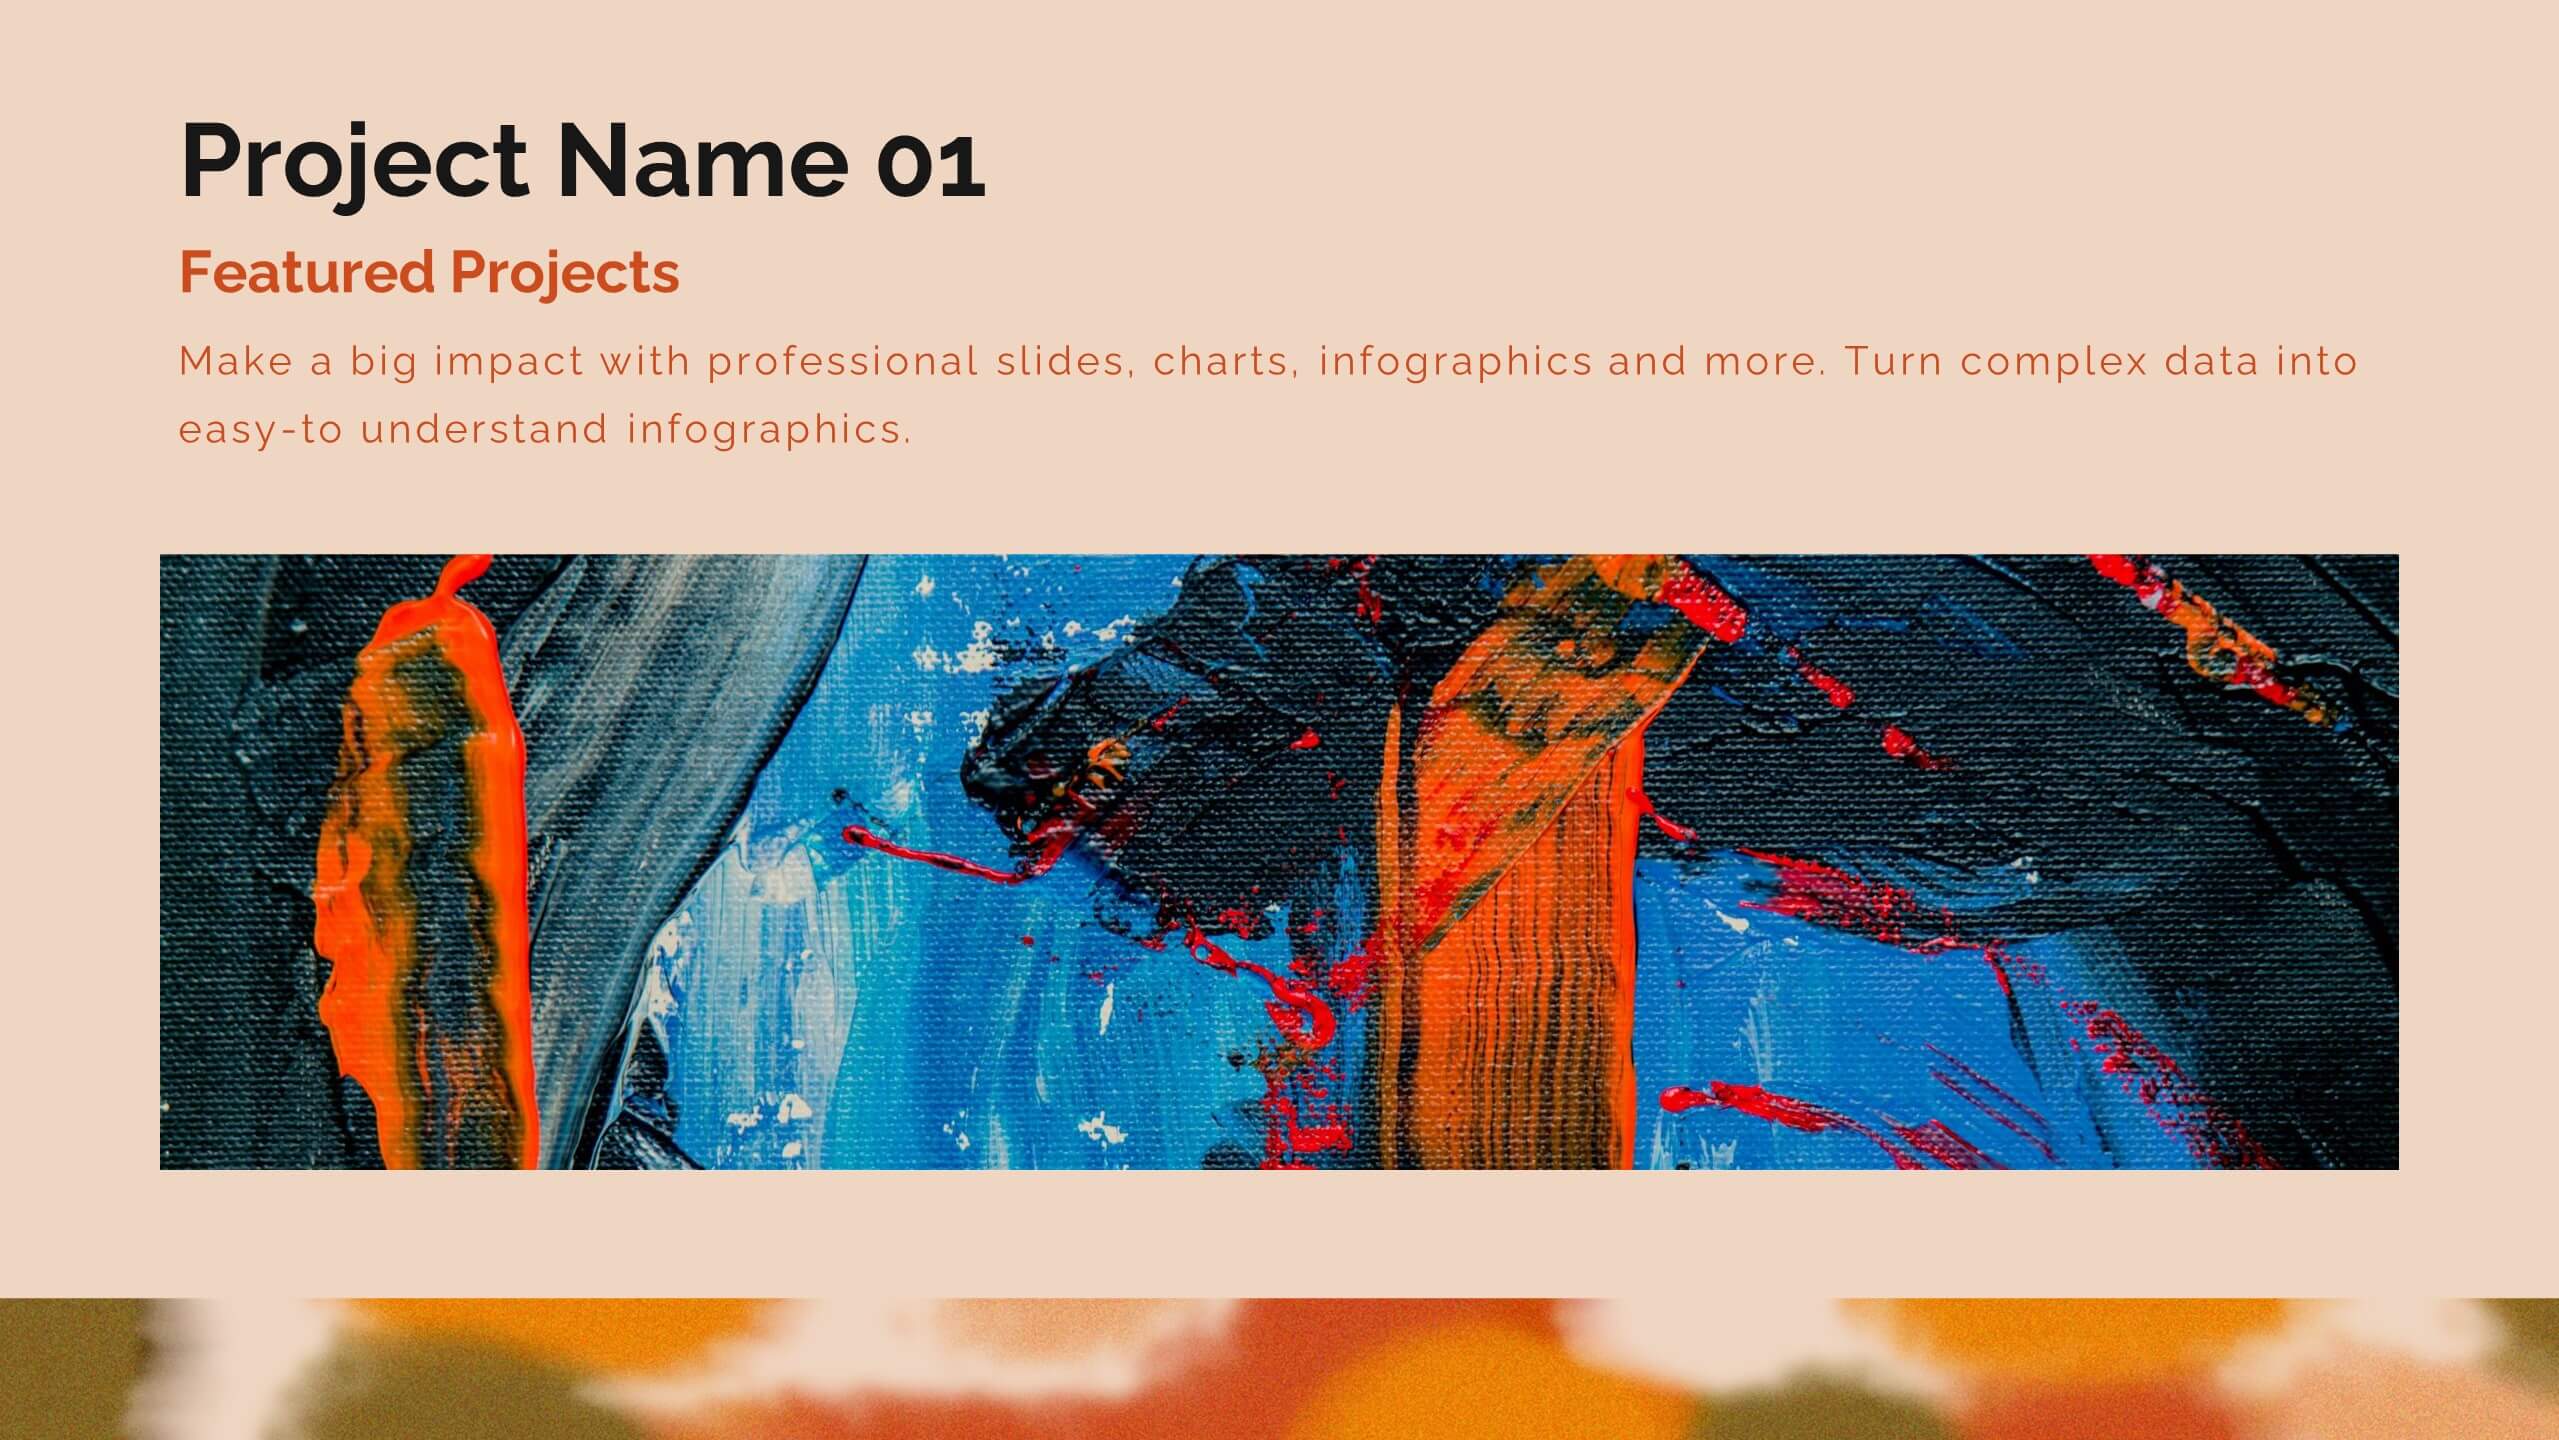
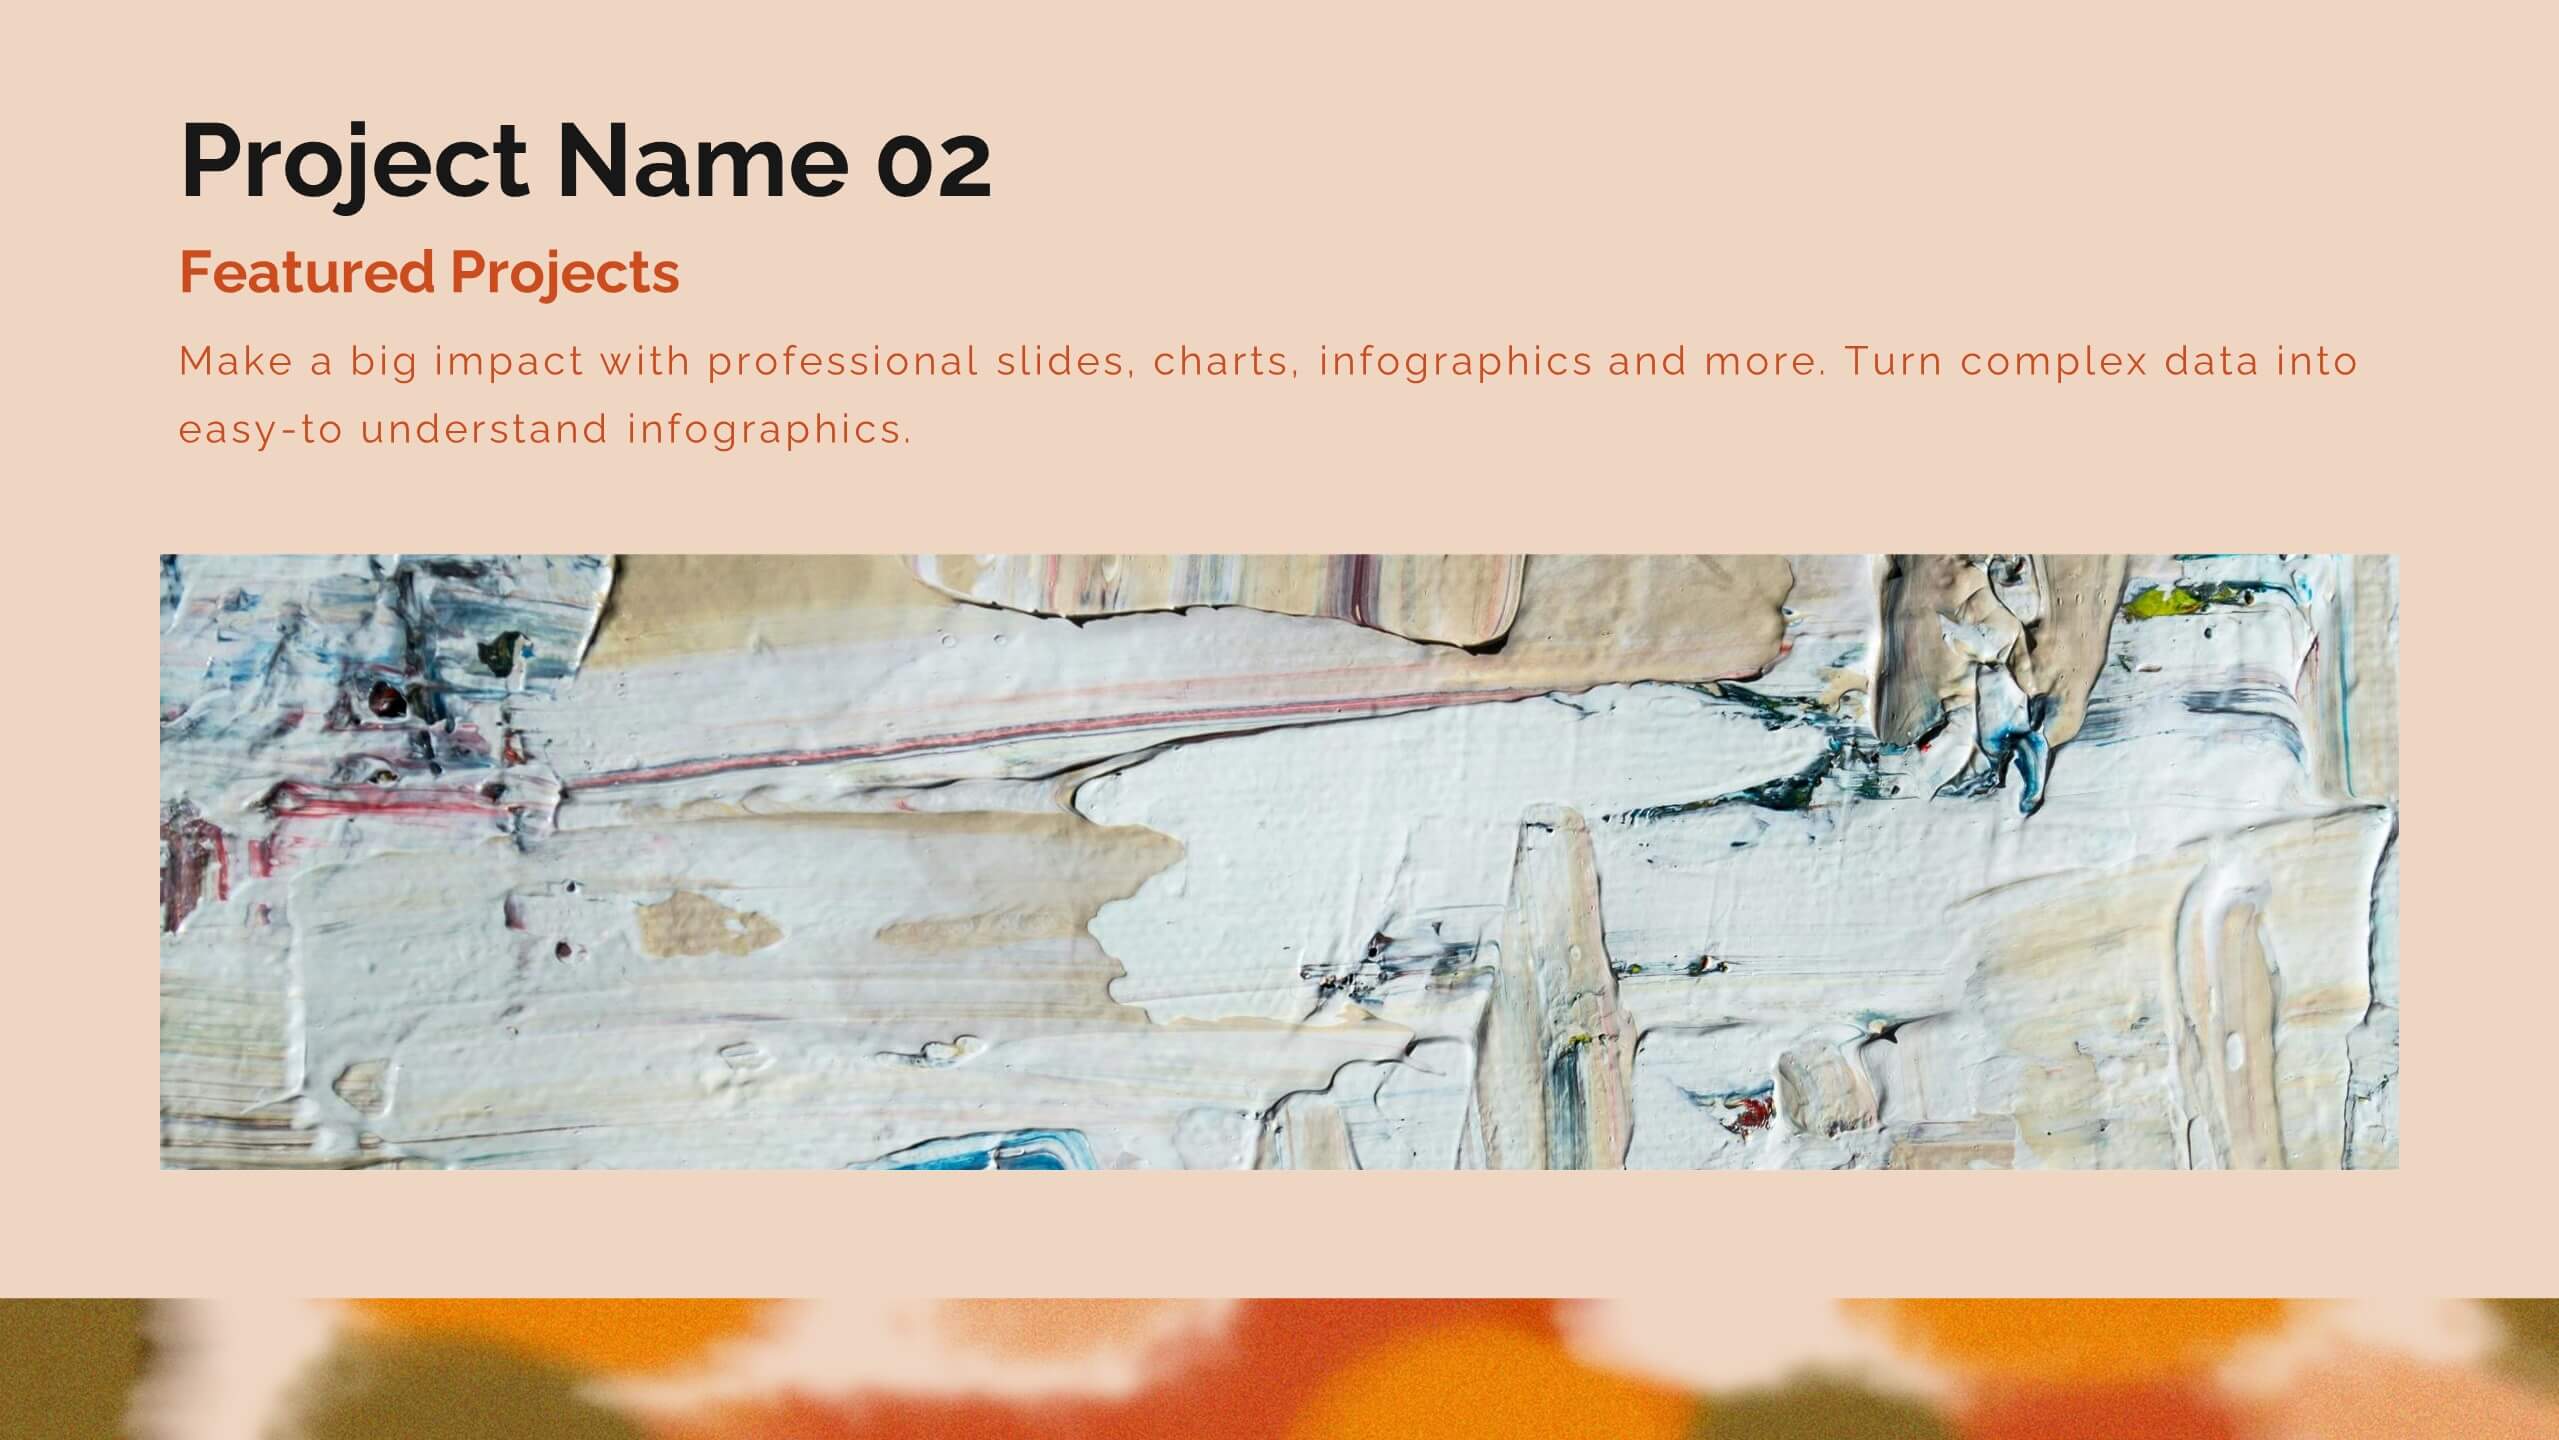
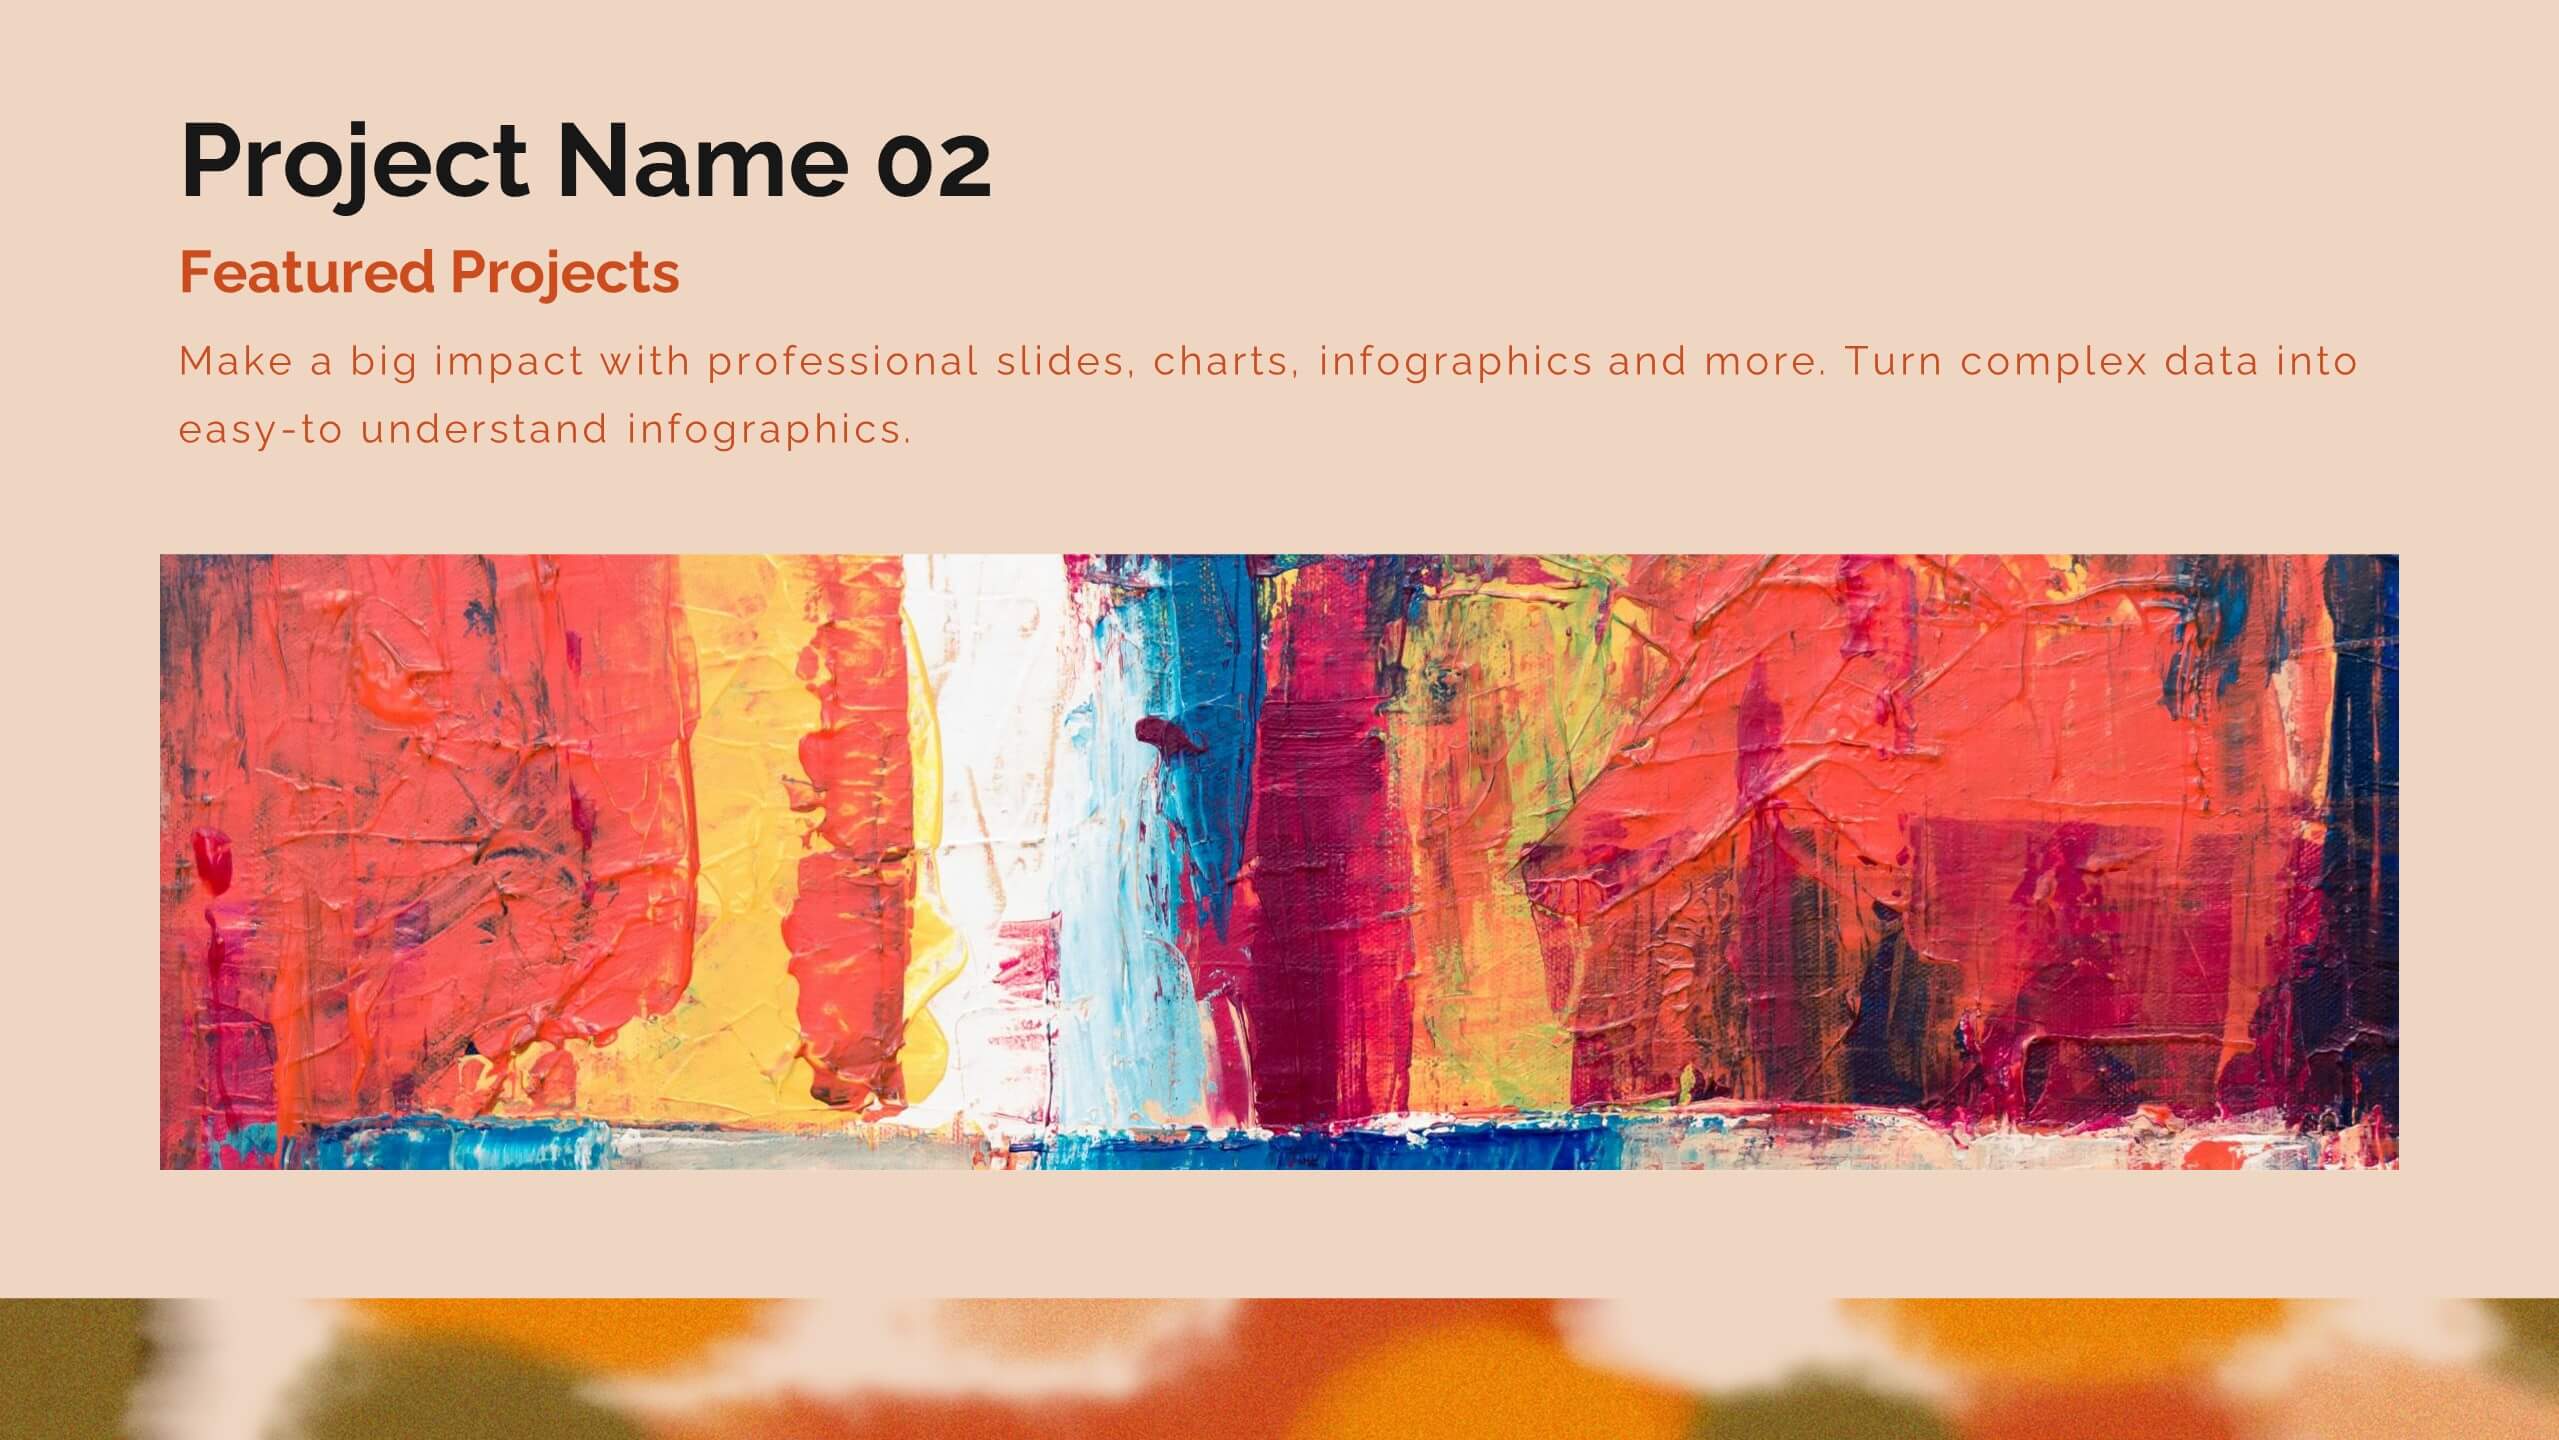
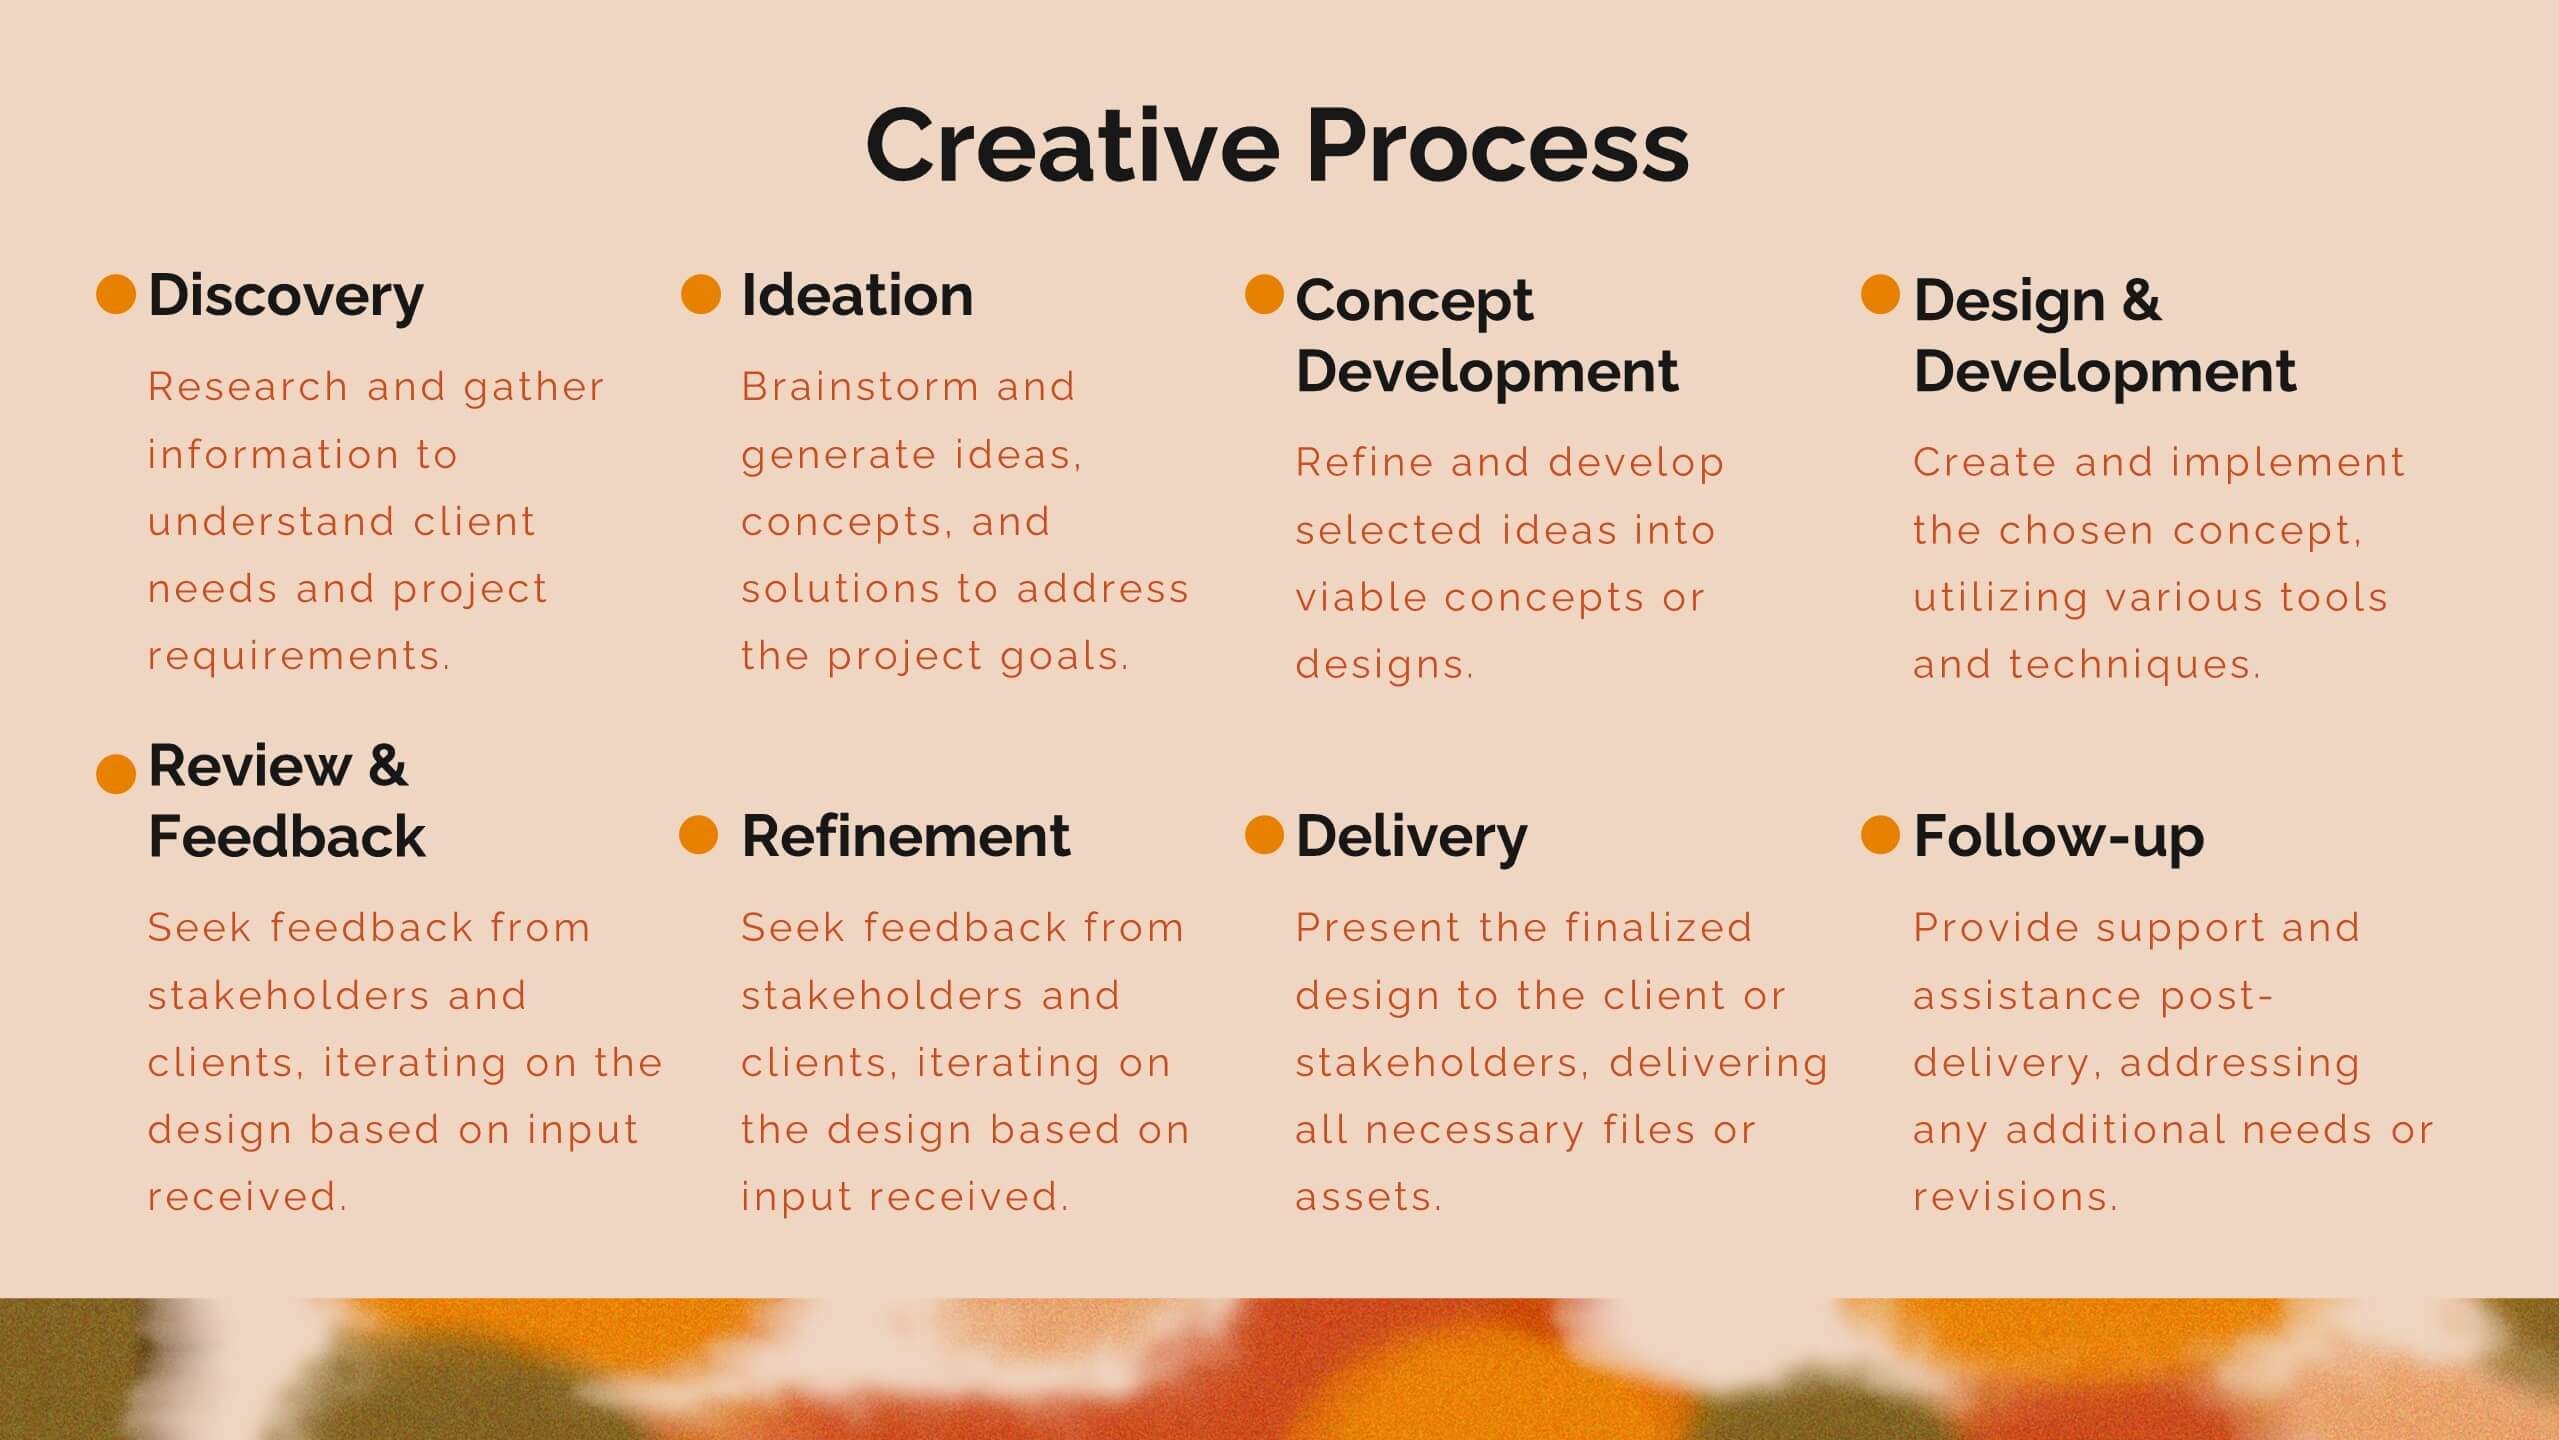
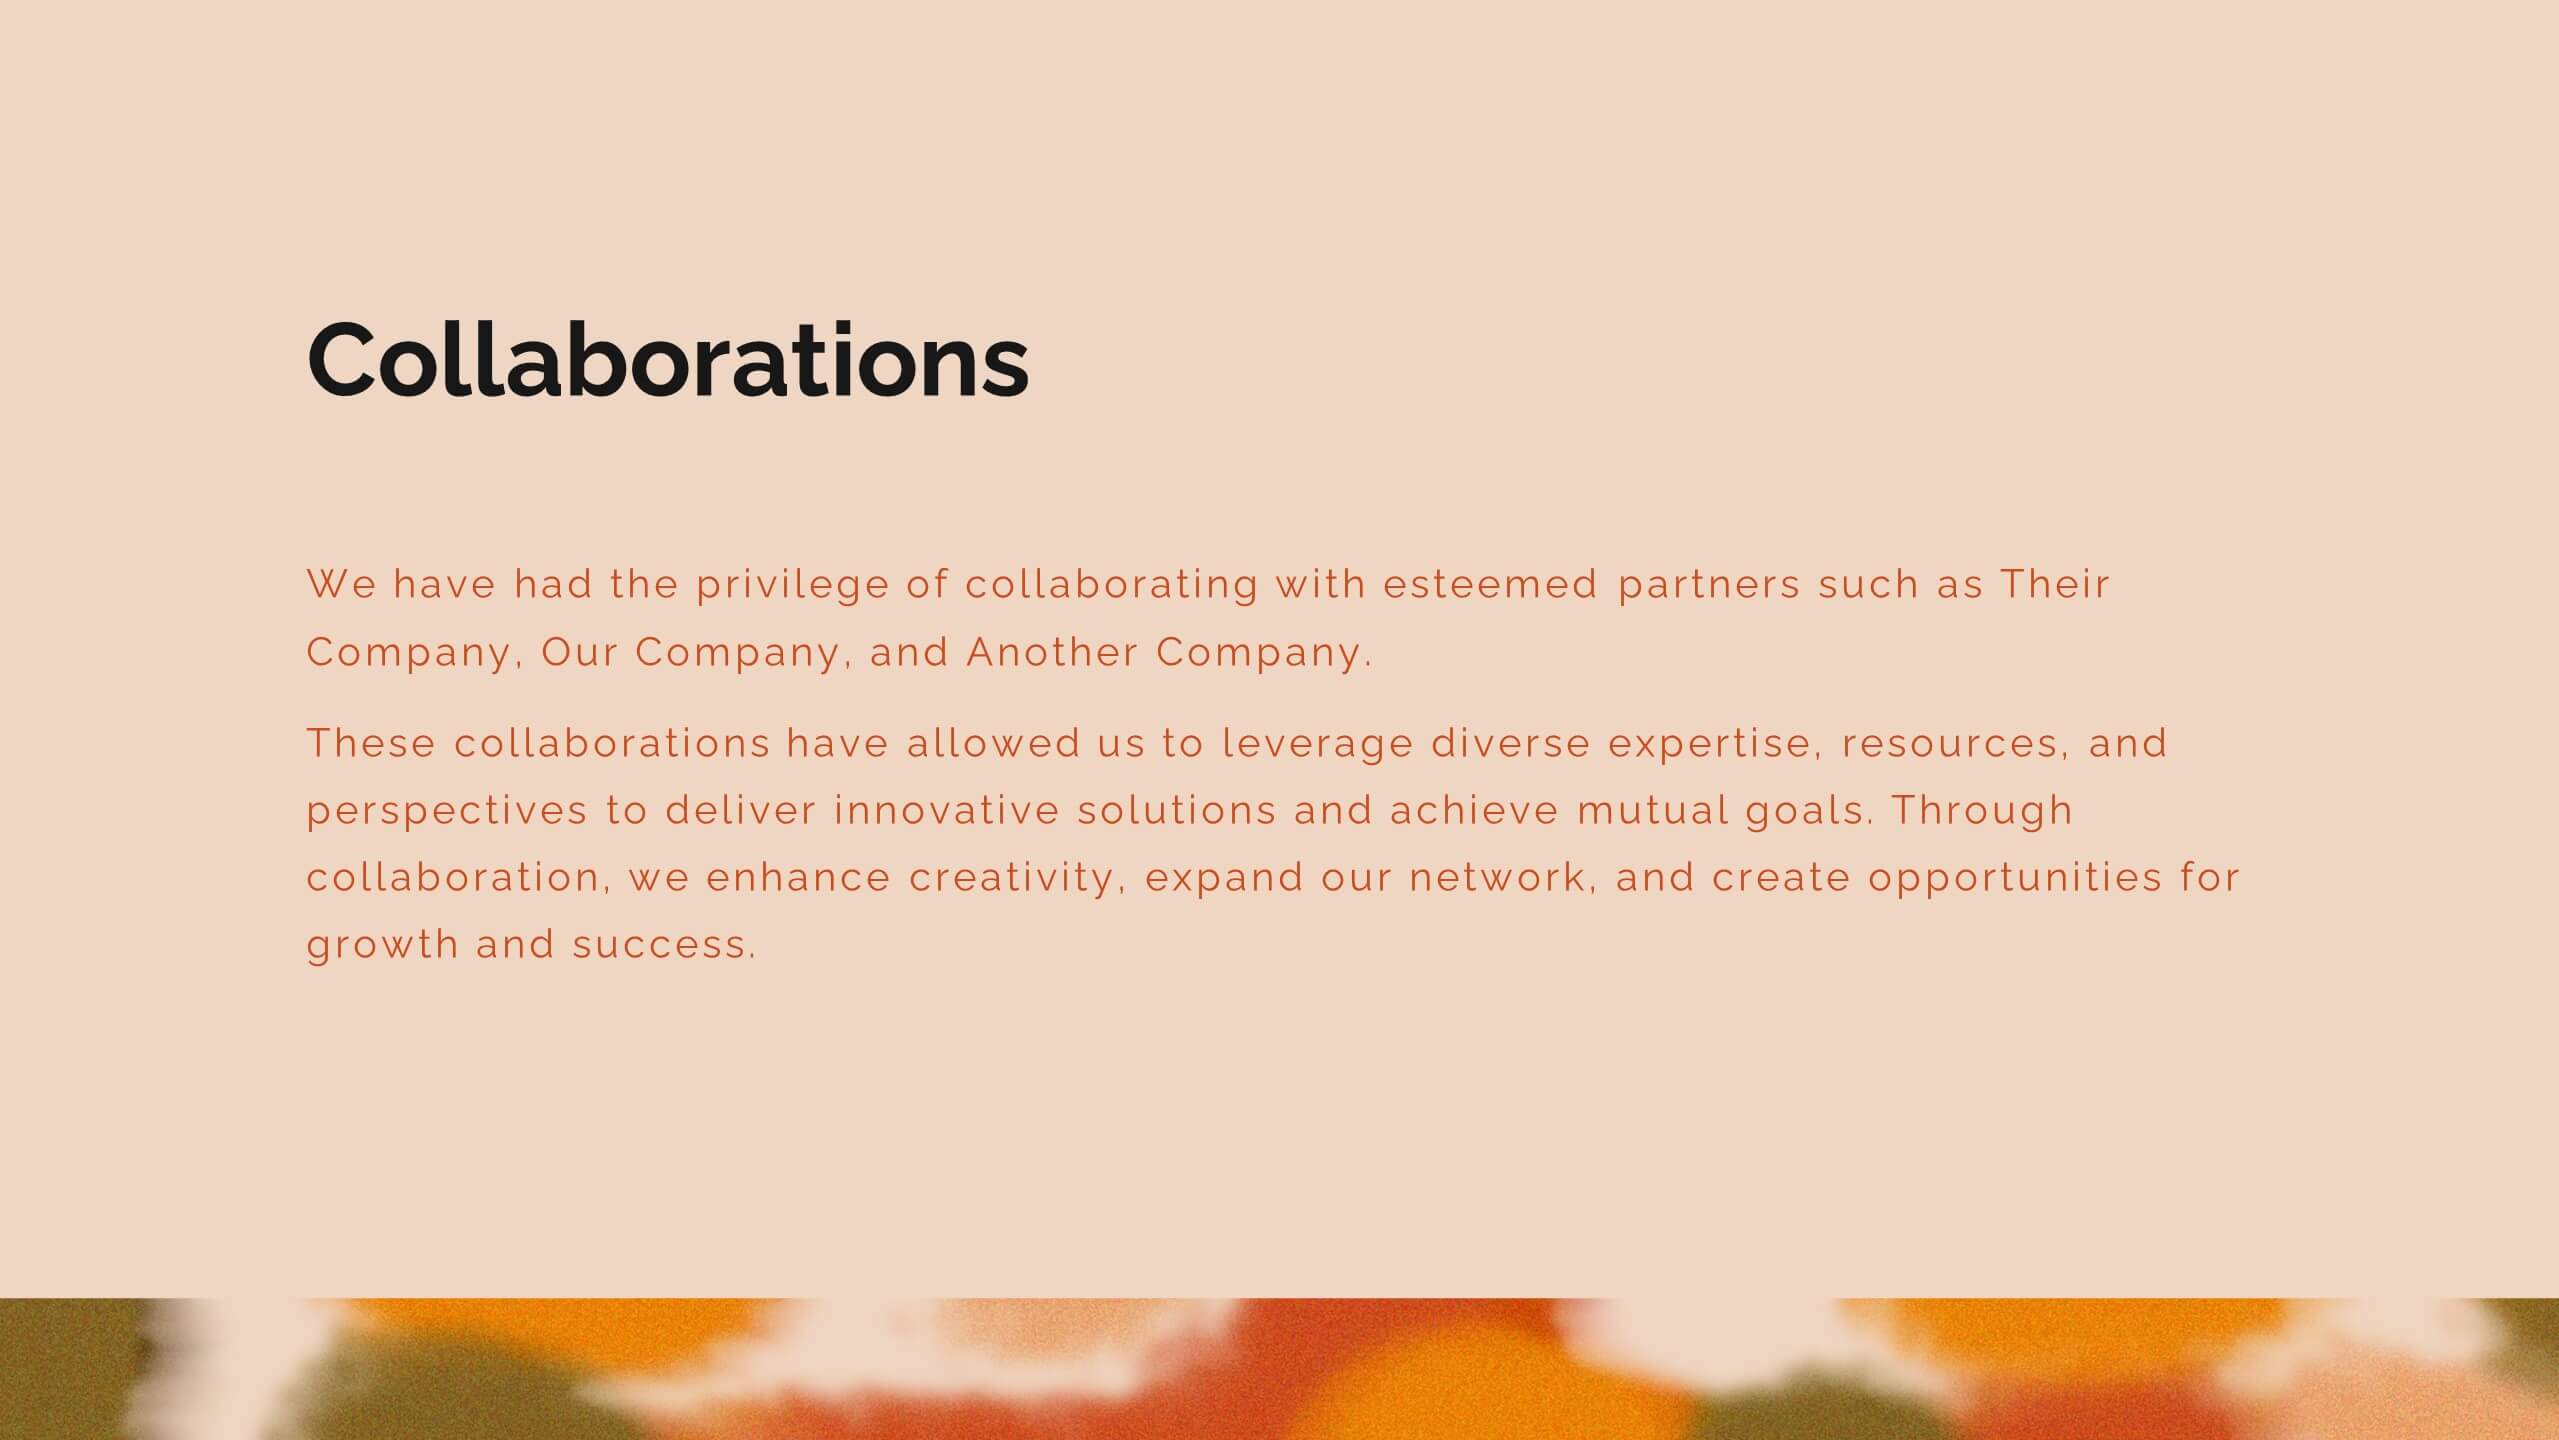
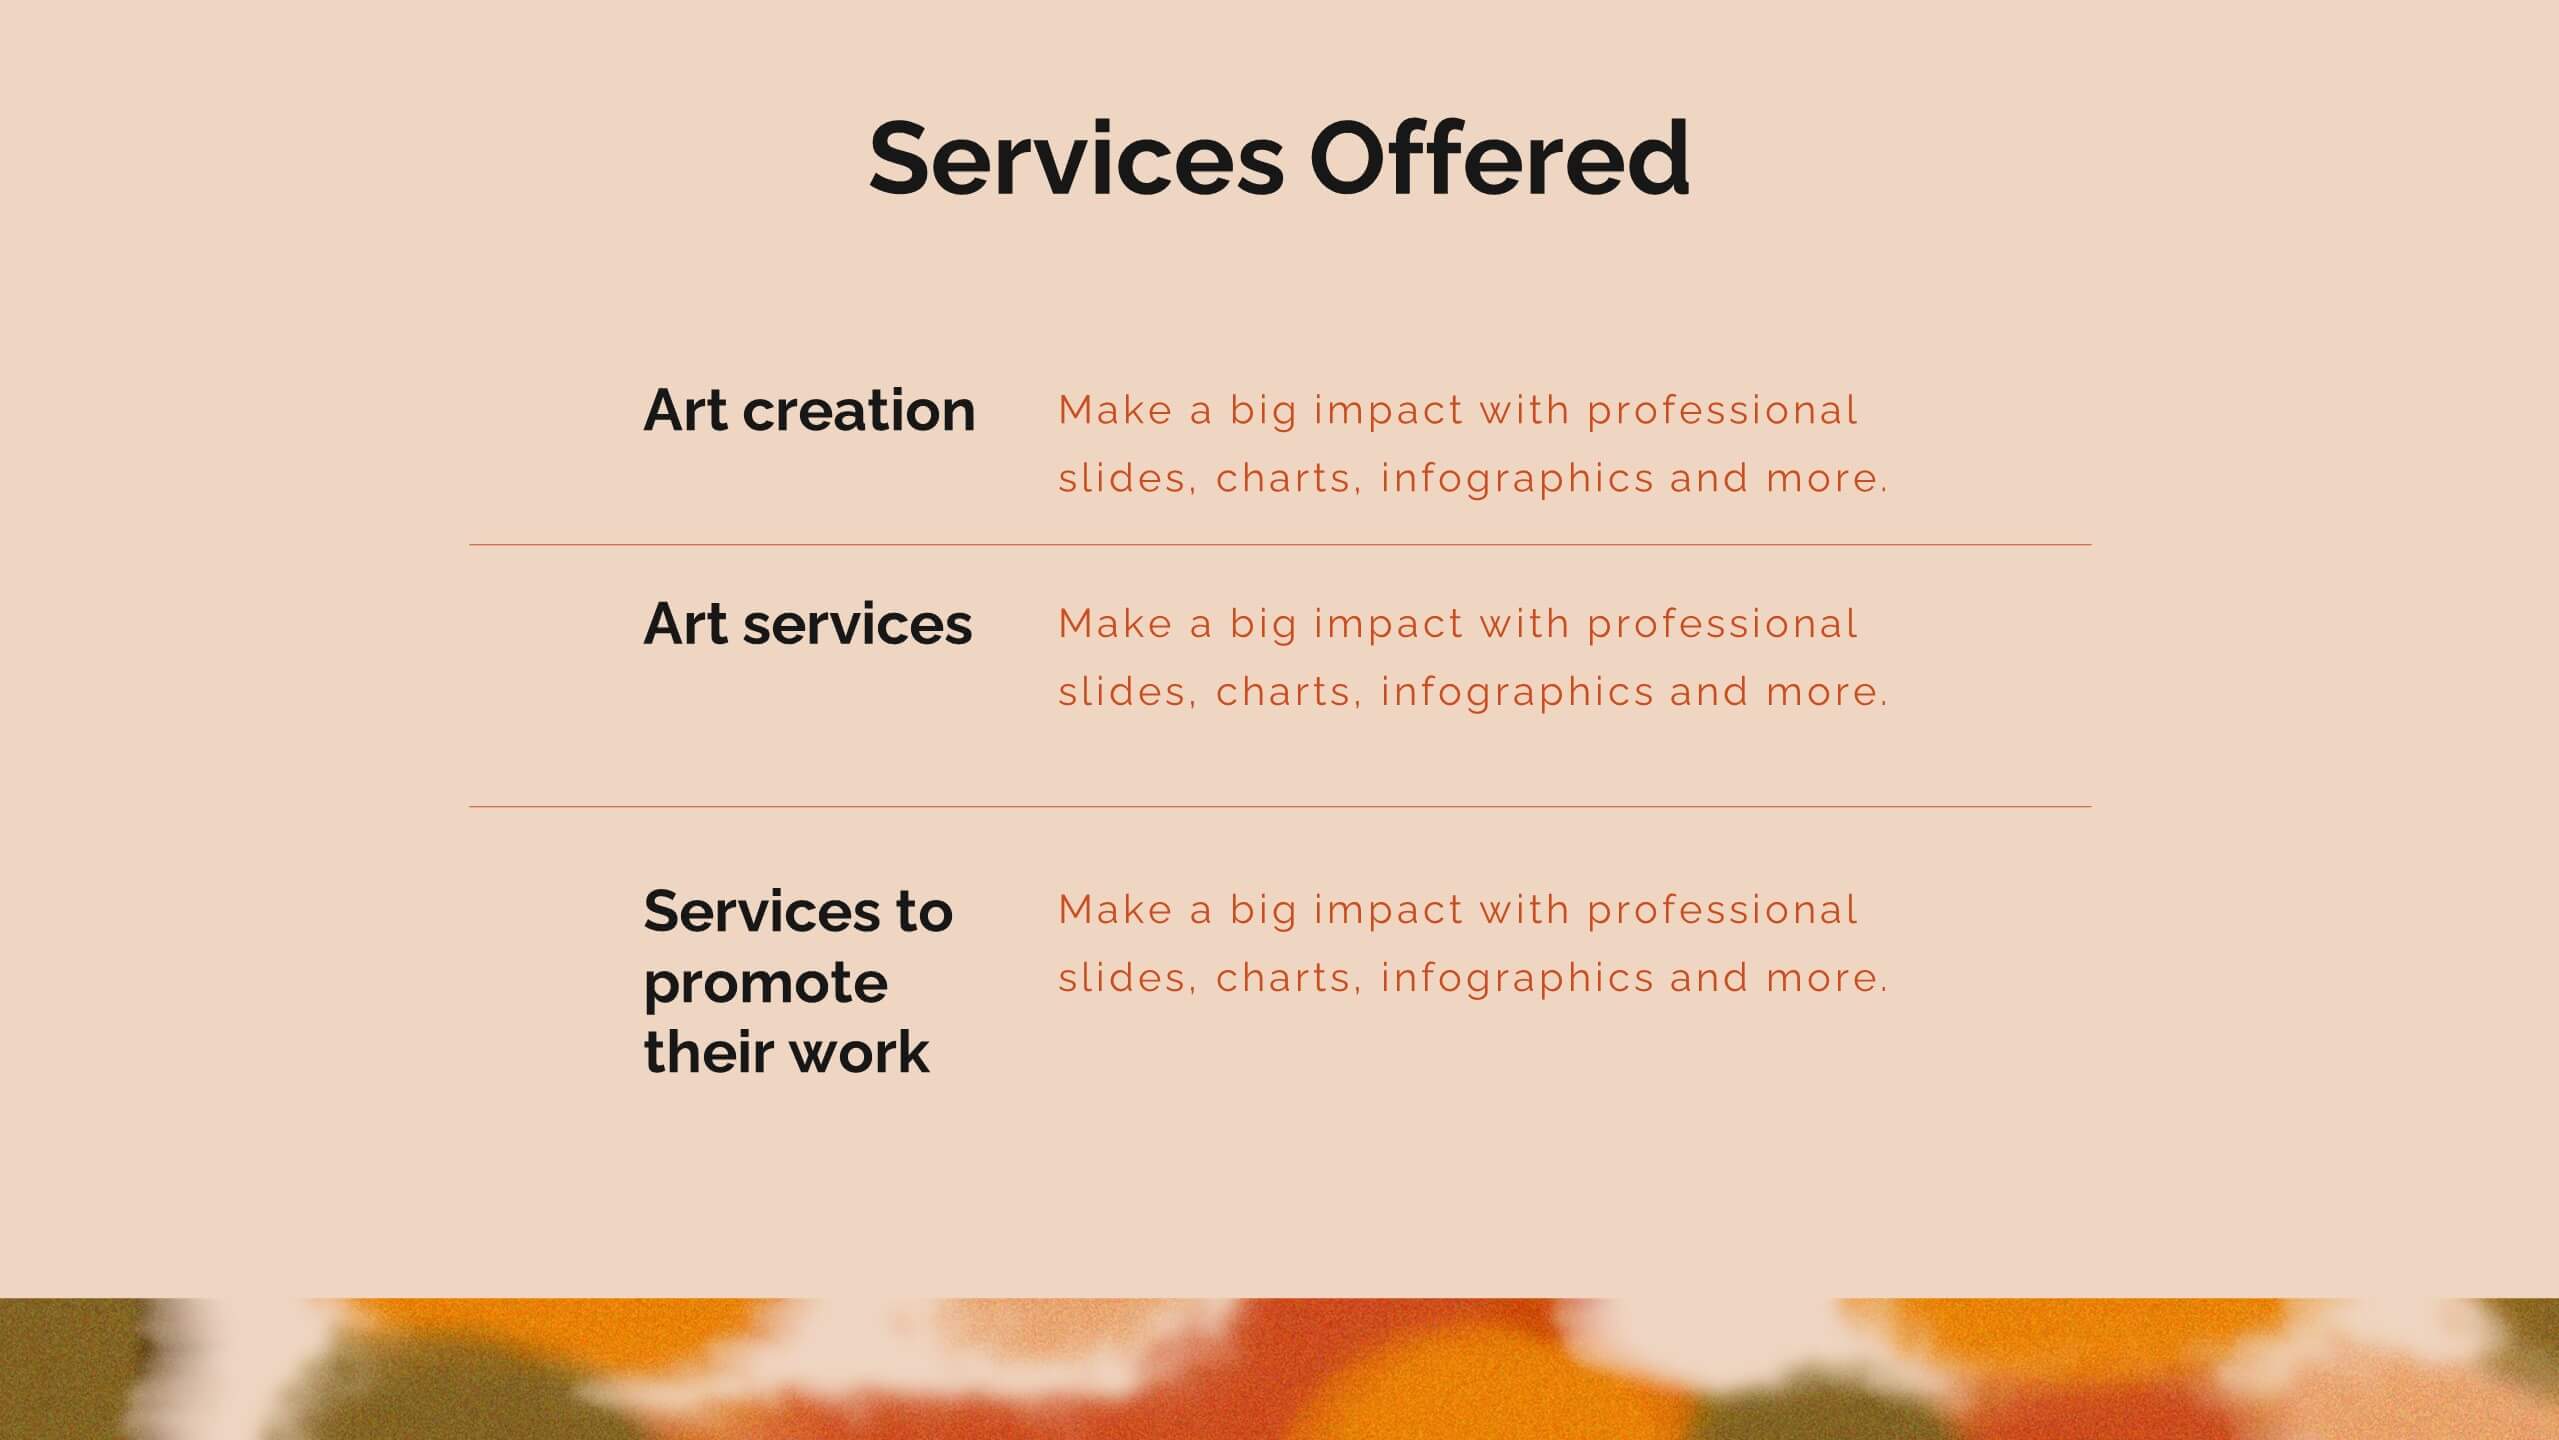
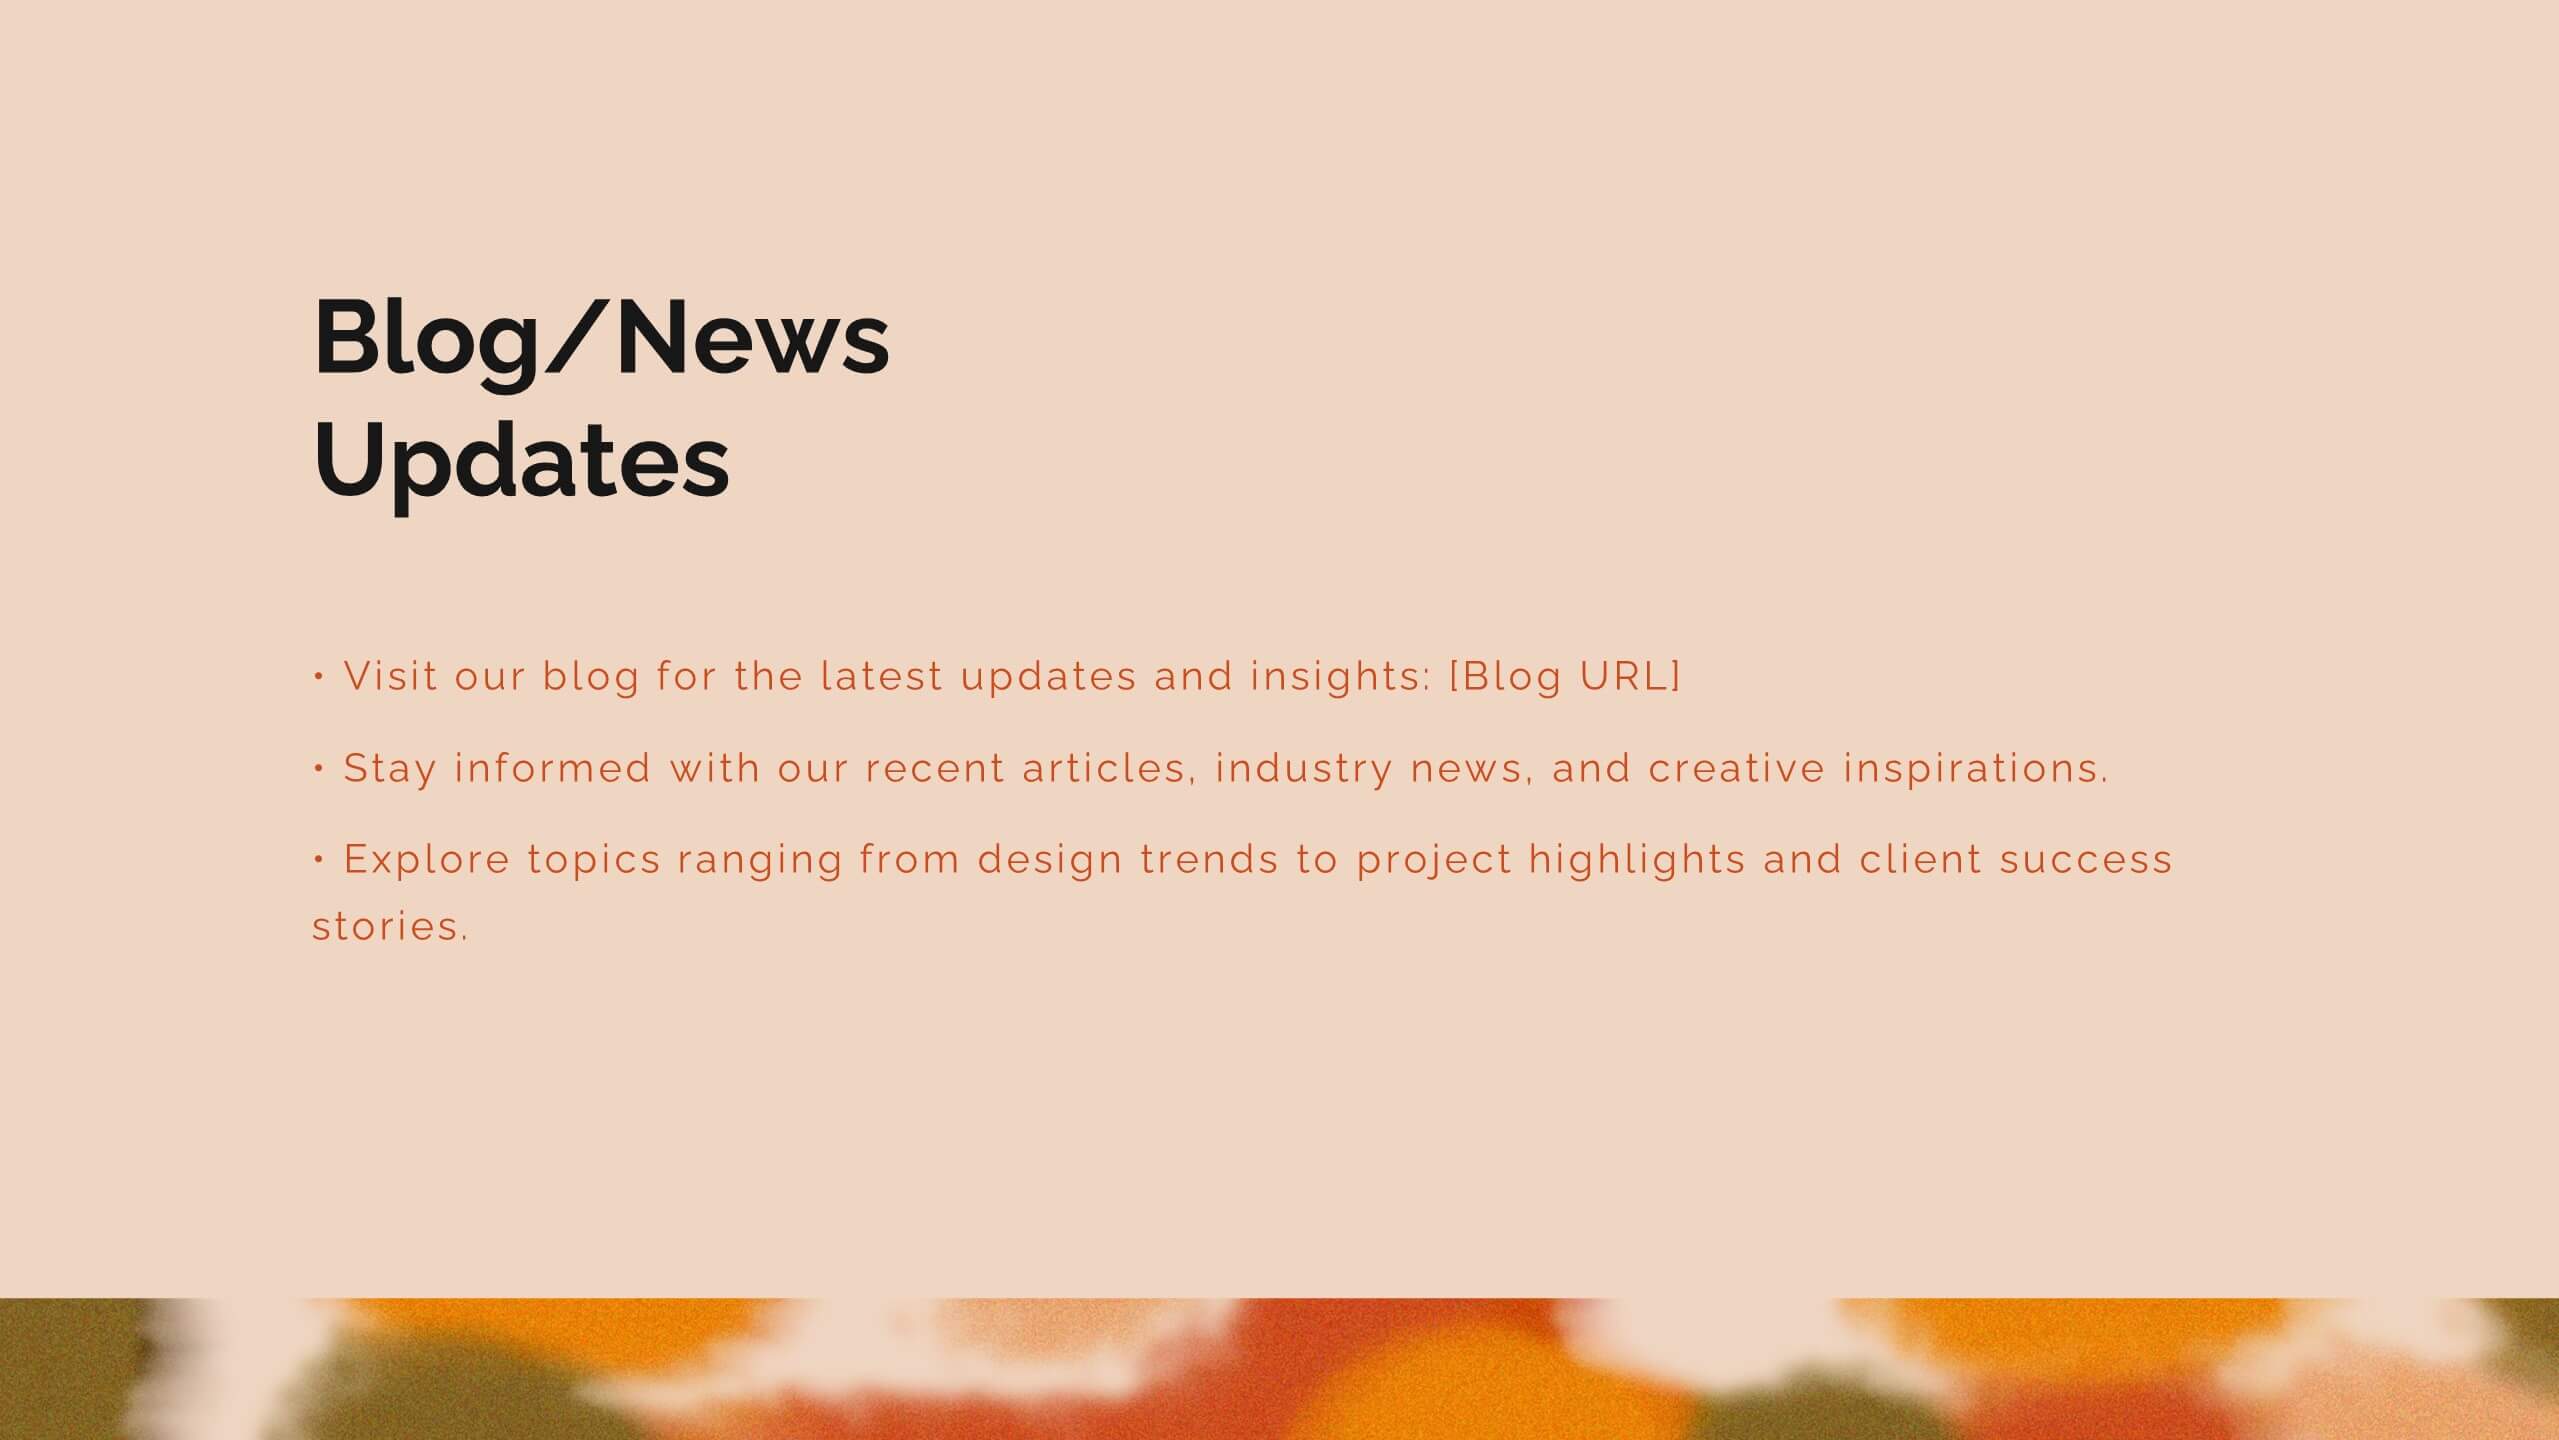
Zenith Artist Portfolio Presentation
Showcase your artistic journey with this captivating portfolio template! Perfect for presenting your projects, creative process, and client testimonials. Ideal for artists aiming to highlight their work and achievements. Compatible with PowerPoint, Keynote, and Google Slides, this template ensures your portfolio is visually stunning and professionally presented. Make your art stand out!


7 diapositivas
Target Market Segmentation Infographic Presentation
A Target Market refers to a specific group of customers or consumers that a company or organization aims to sell its products or services too. This template has a design that can compliment your company's or organization's branding elements to make it a professional looking presentation. This template is perfect for the audience with in-depth knowledge of marketing; the template allows you to include important facts and statistics that will make it easily understandable by all types of audiences. The template comes with different chart slides, nice color combinations and graphs!


7 diapositivas
Health Science Infographic
Dive deep into the realm of health science with our health science infographic. Merging the meticulousness of a laboratory with health, this infographic is crafted in pristine white complemented by refreshing green shades. The design captures the essence of both the clinical and nurturing facets of health science. Integrated within the template are tailored graphics symbolizing various aspects of health science. Compatible with PowerPoint, Keynote, and Google Slides. The icons are designed to convey complex scientific concepts with clarity, while the strategically placed image placeholders allow for the incorporation of real-life visuals or explanatory diagrams.


4 diapositivas
Business Strategy Alternatives Presentation
Present and compare strategic choices effectively with the Business Strategy Alternatives Presentation template. Designed to highlight key decision points, competitive advantages, and alternative approaches, this slide is ideal for business strategy discussions, market positioning, and executive planning. Fully customizable for PowerPoint, Keynote, and Google Slides to fit your presentation needs.


5 diapositivas
Startup Business Plan Presentation
Launch your ideas with clarity using this Startup Business Plan slide template. The rocket-inspired visual guides your audience through five strategic stages, each labeled with editable icons and titles—perfect for pitching goals, financials, timelines, or key operations. Ideal for entrepreneurs and early-stage companies, this slide is easy to customize in PowerPoint, Keynote, or Google Slides.


6 diapositivas
Strategy Wheel Infographic Slide
Present key strategies, priorities, or action items in a visually engaging circular format. This infographic template is ideal for showcasing 5 interconnected components in business plans, marketing strategies, or process flows. Fully editable in PowerPoint, Keynote, and Google Slides for seamless customization.


7 diapositivas
Buyer Infographic
Discover the power of visual storytelling with our dynamic Infographic Template, designed to bring the buyer's journey to life in full color and engaging detail! Each slide is a palette of opportunity, with bold hues and intuitive layouts that transform standard data into a compelling narrative. This template is a marketer’s dream, perfect for delineating complex buyer behaviors, demographics, and decision processes in an easily digestible format. It leverages striking graphics and concise text to illuminate key insights that drive consumer actions, making it indispensable for presentations, reports, or online content. Customize to your heart’s content, adjusting colors, fonts, and layouts to align perfectly with your branding. Whether you're detailing market trends, consumer feedback, or purchase patterns, this template ensures your data not only informs but also inspires. Ideal for strategists, sales teams, and marketers, it's your secret weapon in crafting stories that not only tell but also sell.


8 diapositivas
Employee Training and Development Presentation
Optimize your team's growth with the 'Employee Training and Development' presentation template. This layout strategically organizes training modules, showcasing clear pathways for skills enhancement and career progression. Compatible with PowerPoint, Keynote, and Google Slides, it's ideal for delivering engaging and instructional corporate training sessions.


5 diapositivas
Business Choices and Outcomes Analysis Presentation
Visually connect key business options with their potential results using the Business Choices and Outcomes Analysis slide. Featuring a clean puzzle-style layout, this template is perfect for illustrating decision pathways, pros and cons, or strategy alternatives. Ideal for consultants, managers, and analysts. Easily customizable in PowerPoint, Keynote, and Google Slides.


8 diapositivas
Environmental and Social Sustainability
Showcase your sustainability efforts with this layered pyramid slide, perfect for visualizing tiered environmental or social responsibility strategies. Ideal for ESG reporting, sustainability workshops, or stakeholder presentations. Fully customizable in PowerPoint, Keynote, and Google Slides to match your brand and message.


5 diapositivas
Lean Six Sigma Business Strategy
Present your continuous improvement plan with this visually compelling Lean Six Sigma pyramid slide. Each layer represents a key phase—Define, Measure, Analyze, Improve, and Control—making it ideal for team training, process mapping, or performance reviews. Fully editable in PowerPoint, Keynote, and Google Slides.


6 diapositivas
Pattern-Based Layouts Using Geometry
Present your process, timeline, or flow with clarity using the Pattern-Based Layouts Using Geometry Presentation. This clean, step-by-step format uses bold numbered icons and curved geometric blocks to guide viewers through five key stages. Ideal for sequential content, strategies, or workflows. Easily customizable in PowerPoint, Keynote, and Google Slides.


6 diapositivas
Pyramid-Triangle Visual Logic Presentation
Present interconnected concepts with clarity using the Pyramid-Triangle Visual Logic Presentation. This layout uses a hexagonal pyramid structure to show relationships between six ideas or categories, making it ideal for strategy models, balanced frameworks, or multi-step solutions. Each section includes a title, icon, and editable content block to ensure clarity and customization. Compatible with PowerPoint, Keynote, and Google Slides.


6 diapositivas
Academic Science Infographic Presentation
Bring your scientific insights to life with a clean, engaging slide that turns complex concepts into an easy-to-follow visual story. This presentation highlights key academic data through connected icons and structured text, helping you explain research findings clearly and confidently. Fully compatible with PowerPoint, Keynote, and Google Slides.