Conference Agenda Slide Presentation
PowerPoint Template and Google Slides Theme
Características
Etiquetas
- Eliminar de favoritos
Plantilla de PowerPoint
1 MB
Plantilla de Google Slides
Enlace externo
Plantilla de Keynote
1 MB
Recomendar
- Eliminar de favoritos
Plantilla de PowerPoint
1 MB
Plantilla de Google Slides
Enlace externo
Plantilla de Keynote
2 MB
2 diapositivas
Visual Resume and Project Gallery Presentation
Showcase your personality and creative work with the Visual Resume and Project Gallery Presentation. This vibrant layout blends a professional “About Me” section with a clean, image-focused gallery—ideal for designers, freelancers, or artists. Fully editable in Canva, PowerPoint, Keynote, and Google Slides for easy customization and seamless presentation.
- Eliminar de favoritos
Plantilla de PowerPoint
1 MB
Plantilla de Google Slides
Enlace externo
Plantilla de Keynote
1 MB
5 diapositivas
User-Centered Design with Empathy Map Presentation
Improve User Insights with the Empathy Map for User-Centered Design! This User-Centered Design with Empathy Map template provides a structured approach to understanding user behaviors, motivations, and needs. Designed with clear quadrant sections, this template helps teams map out key insights for UX research, customer journey mapping, and product development. Ideal for designers, marketers, and strategists, this fully editable slide deck works seamlessly with PowerPoint, Keynote, and Google Slides for a hassle-free customization experience.
- Eliminar de favoritos
Plantilla de PowerPoint
1 MB
Plantilla de Google Slides
Enlace externo
Plantilla de Keynote
2 MB
10 diapositivas
Concept Mapping with Bubble Map
Break down complex ideas into visual clusters with this hexagon-style concept mapping template. Designed to organize information into thematic groups, it's ideal for brainstorming, mind mapping, or presenting strategies and workflows. Each section uses color-coded bubble maps for easy navigation. Fully editable in PowerPoint, Keynote, and Google Slides.
- Eliminar de favoritos
Plantilla de PowerPoint
1 MB
Plantilla de Google Slides
Enlace externo
Plantilla de Keynote
1 MB
6 diapositivas
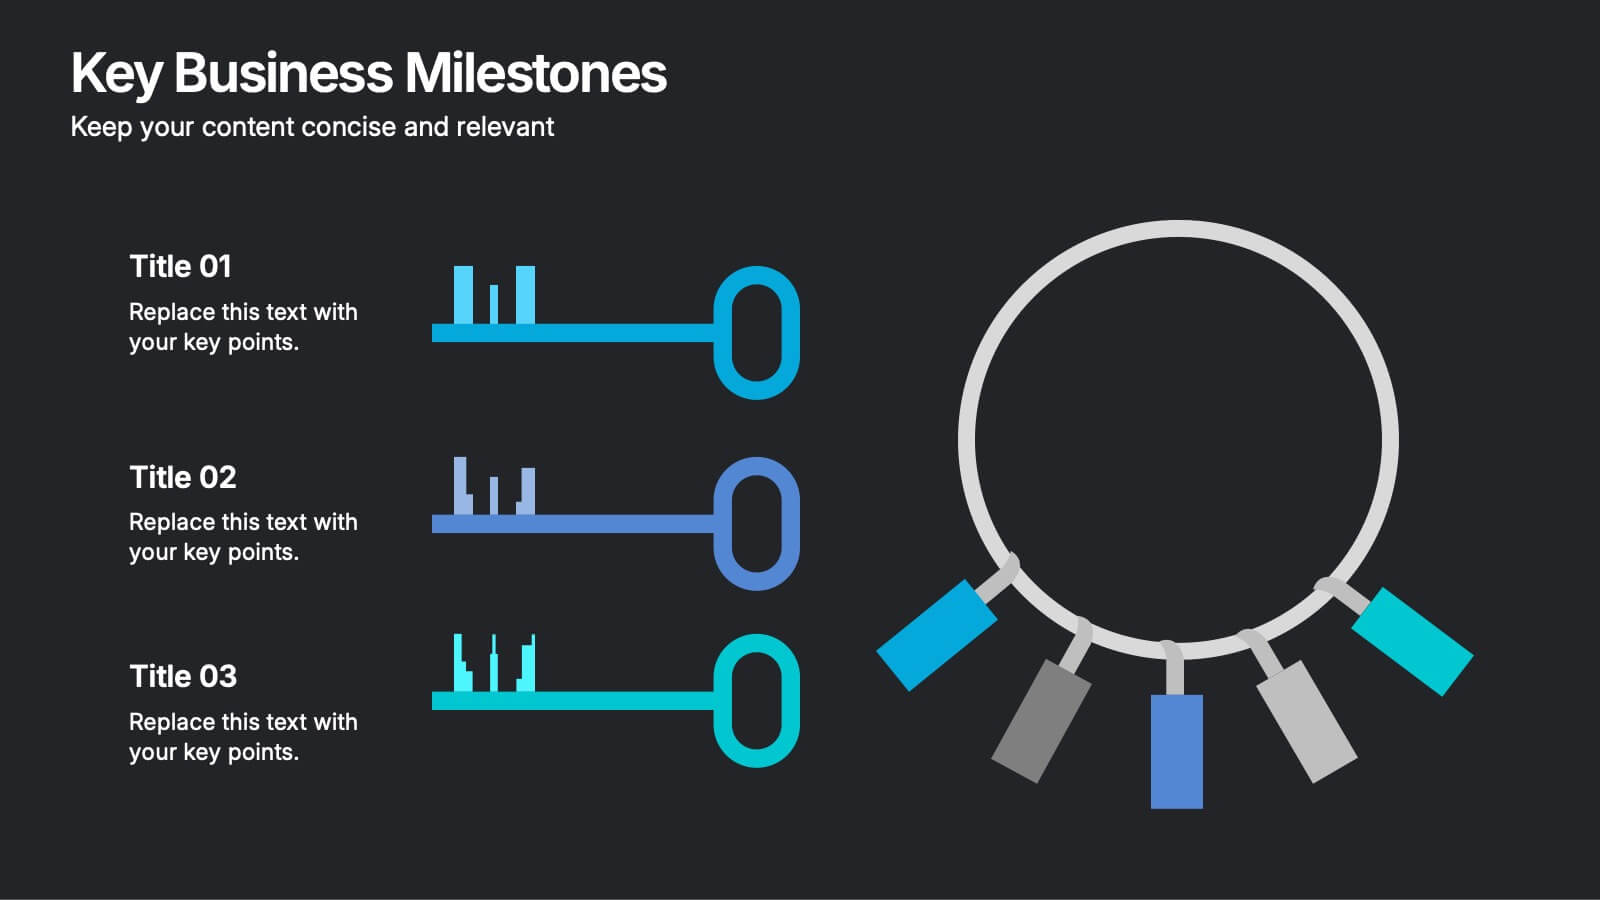
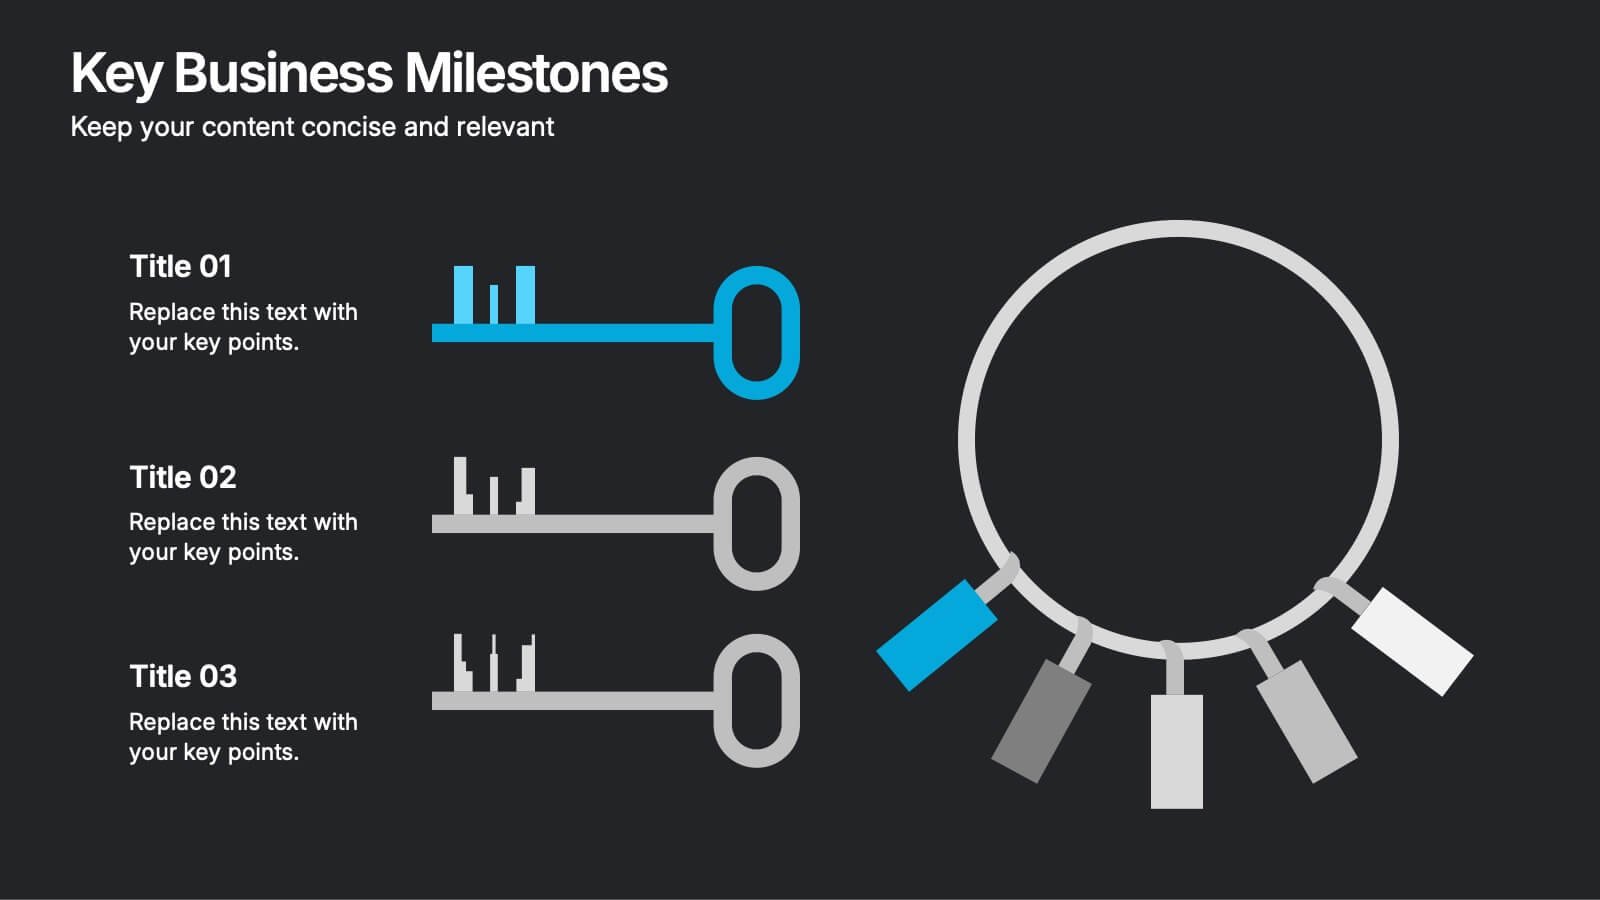
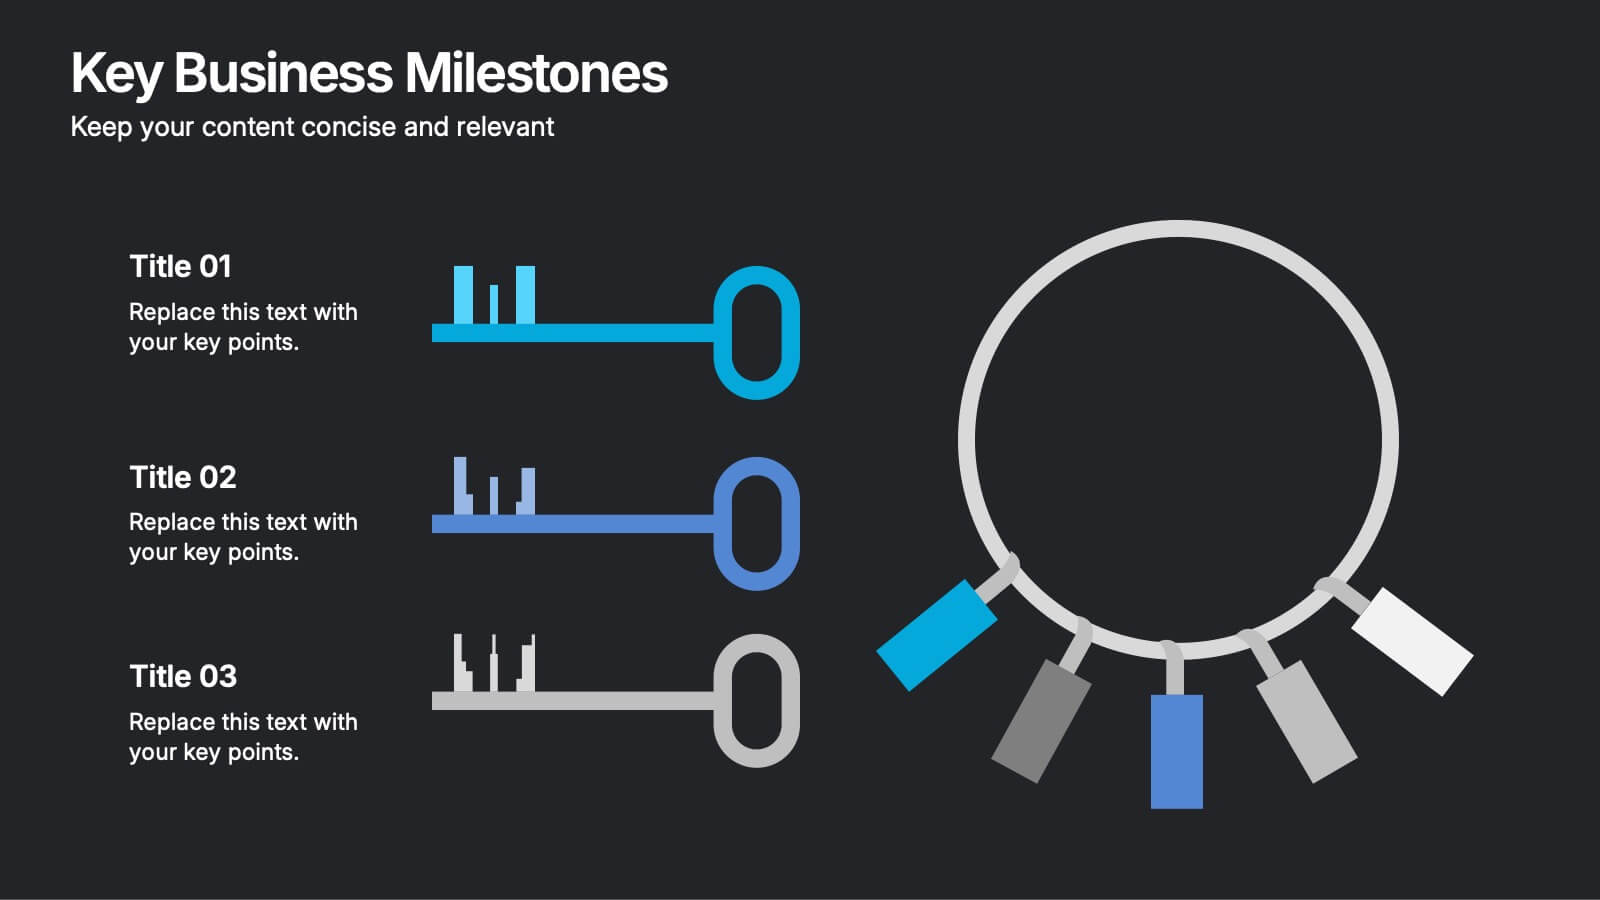
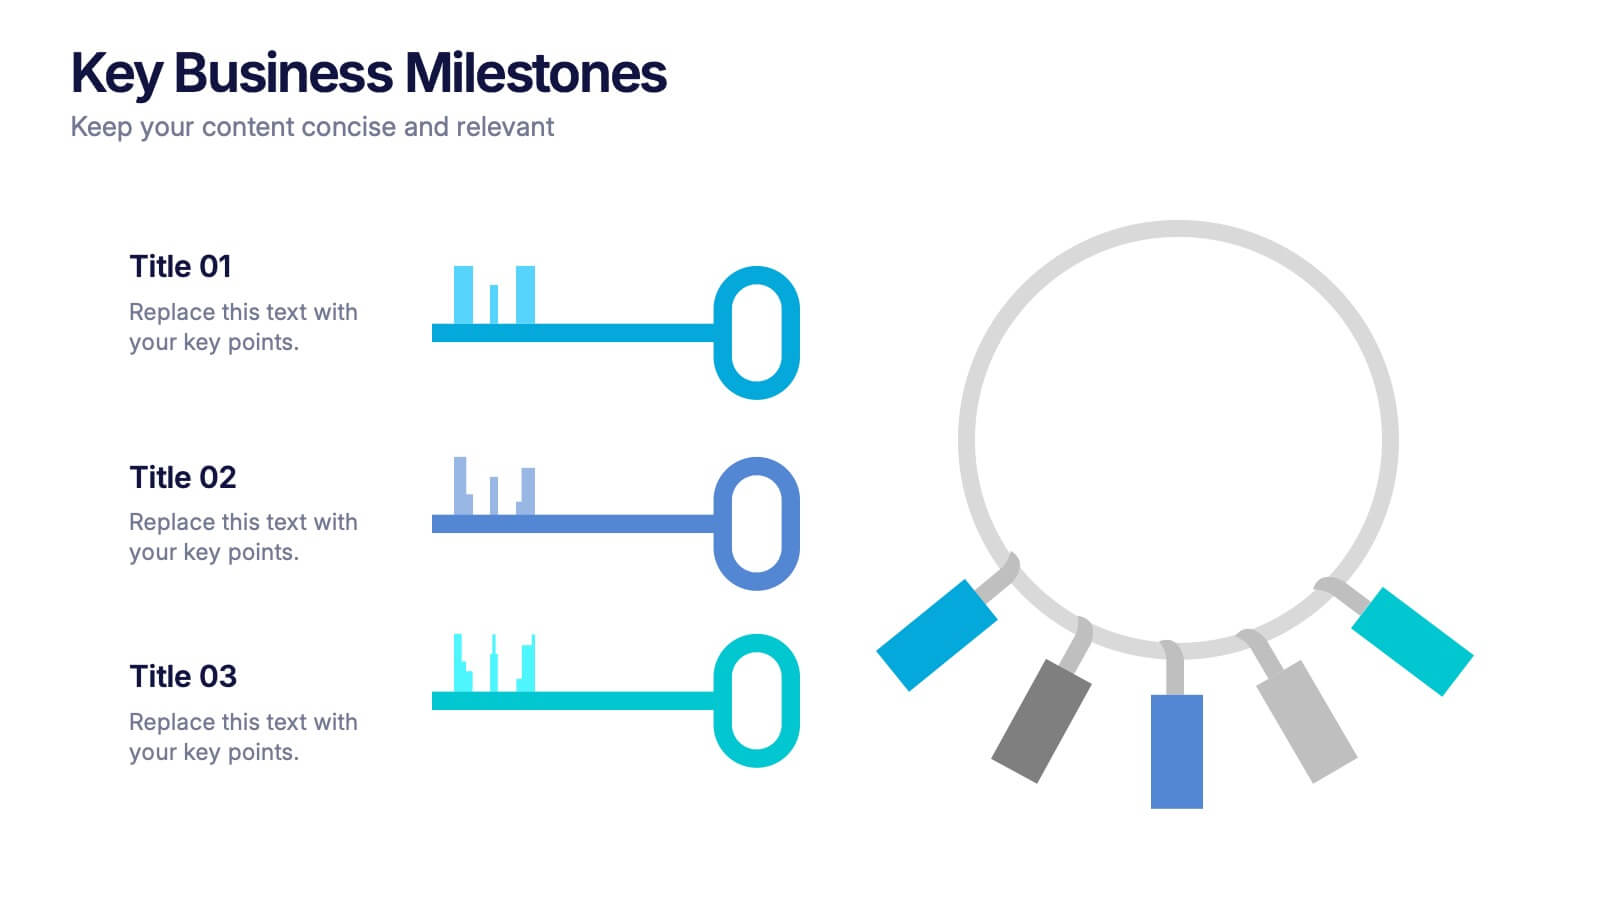
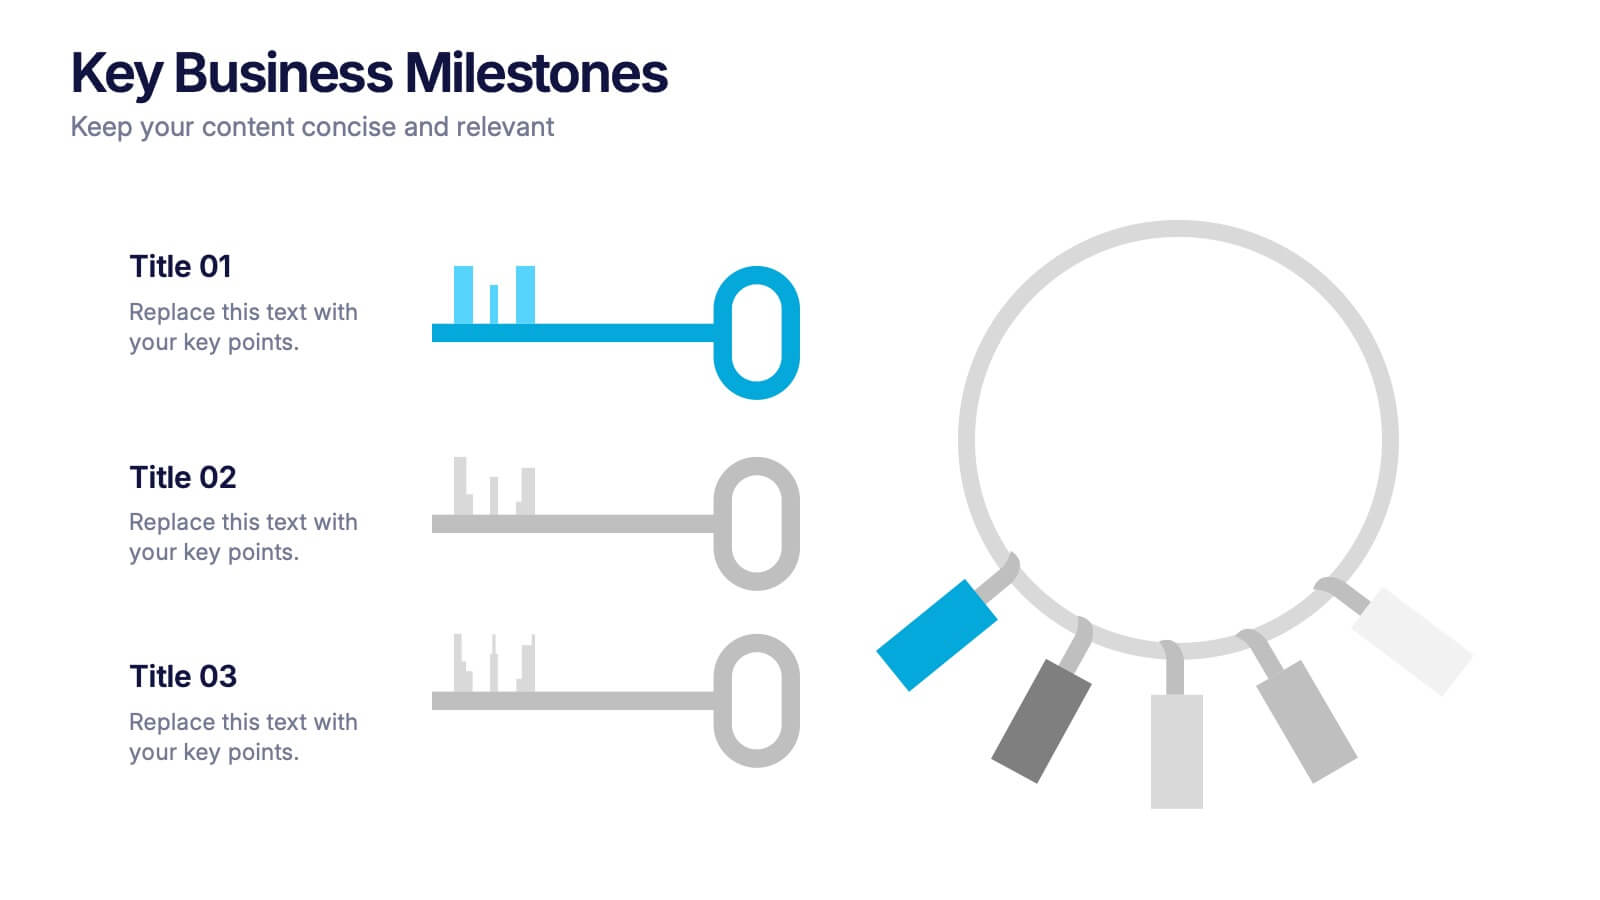
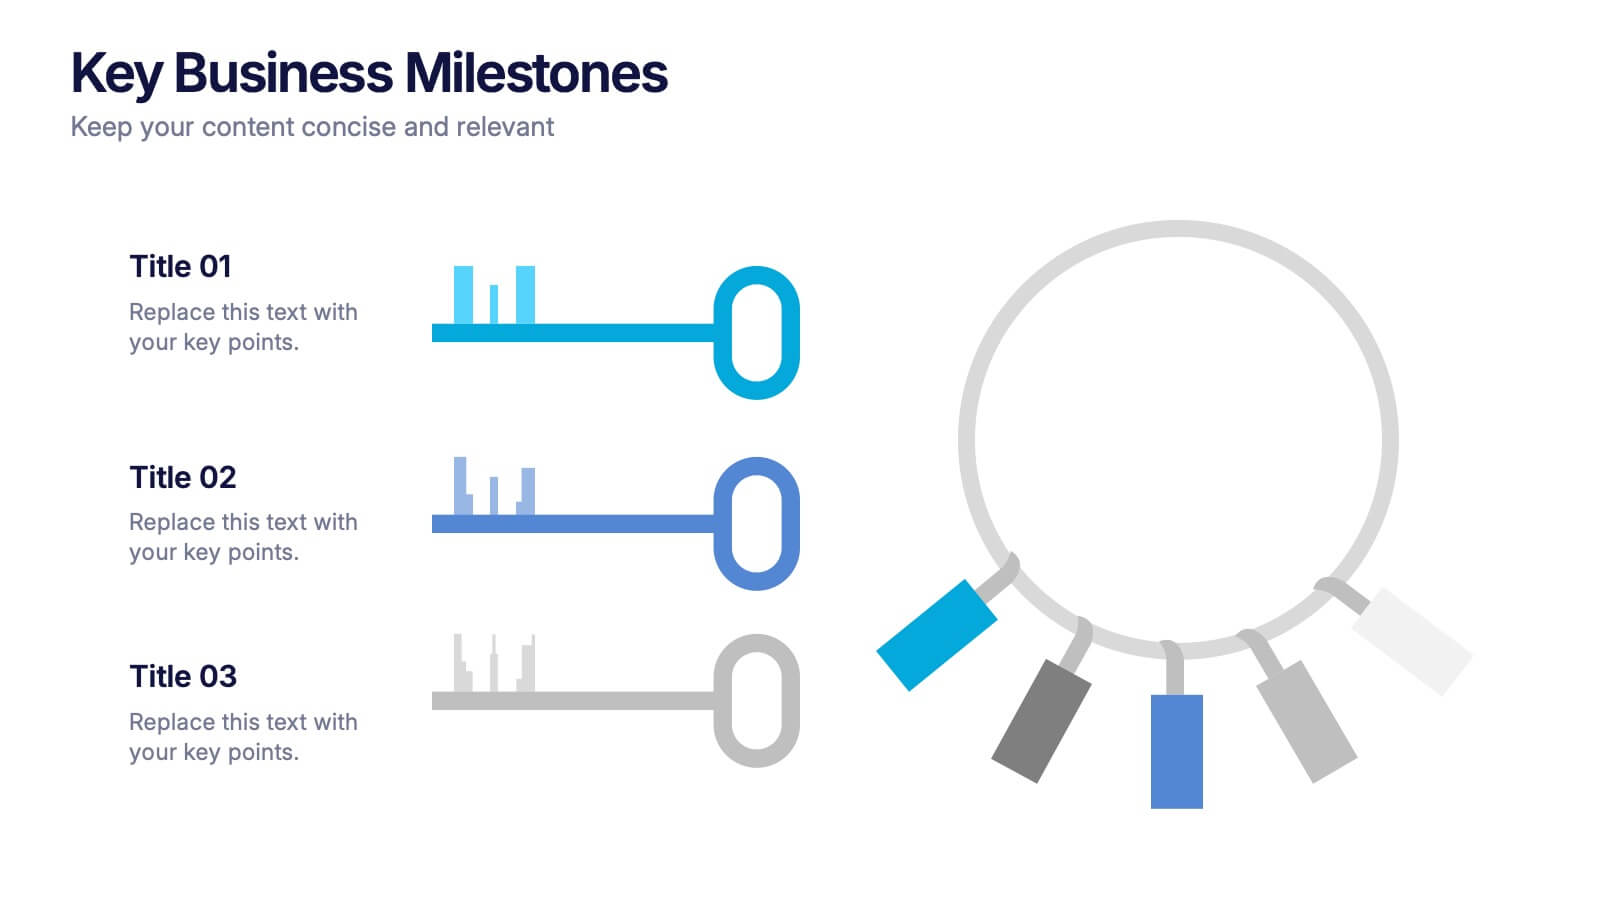
Key Business Milestones Presentation
Showcase your company’s journey with this dynamic and professional presentation design. Perfect for highlighting achievements, key phases, and growth stages, it helps you visualize progress with clarity and impact. Fully editable and compatible with PowerPoint, Keynote, and Google Slides, making milestone storytelling simple and visually compelling.
- Eliminar de favoritos
Plantilla de PowerPoint
1 MB
Plantilla de Google Slides
Enlace externo
Plantilla de Keynote
1 MB
6 diapositivas
Profit Threshold Break-Even Calculation Presentation
Illustrate financial performance with this profit threshold timeline. The layout spans from big loss to high profit, marking each stage with flag icons and editable labels. Ideal for break-even analysis, sales strategies, or ROI comparisons. Easily customizable in PowerPoint, Keynote, and Google Slides to match your brand’s visual identity.
- Eliminar de favoritos
Plantilla de PowerPoint
1 MB
Plantilla de Google Slides
Enlace externo
Plantilla de Keynote
1 MB
5 diapositivas
Strategic Matrix Grid Analysis Presentation
Clarify your strategic insights with the Strategic Matrix Grid Analysis Presentation. This layout uses a 2x2 quadrant design to showcase four key categories or scenarios—ideal for SWOT, risk vs. reward, product positioning, or capability mapping. Clean labels, icons, and text areas help break down each quadrant’s significance. Fully editable in PowerPoint, Google Slides, Keynote, and Canva.
- Eliminar de favoritos
Plantilla de PowerPoint
1 MB
Plantilla de Google Slides
Enlace externo
Plantilla de Keynote
2 MB
6 diapositivas
Project Planning and Task Allocation Presentation
Streamline your project timelines with the Project Planning and Task Allocation Presentation. This template uses a clear horizontal flow to map out six key tasks or stages, making it ideal for visualizing schedules, assigning responsibilities, or showcasing milestones. Fully editable in PowerPoint, Google Slides, Keynote, and Canva.
- Eliminar de favoritos
Plantilla de PowerPoint
1 MB
Plantilla de Google Slides
Enlace externo
Plantilla de Keynote
1 MB
5 diapositivas
Education Jobs Infographics
Education Jobs encompass a wide range of roles and responsibilities focused on providing education, training, and support to learners of all ages. This template is designed to showcase the diverse range of careers available in the education sector. Use this template to inform and inspire individuals interested in pursuing a career in education, whether as teachers, administrators, counselors, researchers, or other specialized roles. With its visually engaging design and comprehensive information, this template will help your audience navigate the world of education jobs and make informed career decisions.
- Eliminar de favoritos
Plantilla de PowerPoint
1 MB
Plantilla de Google Slides
Enlace externo
Plantilla de Keynote
1 MB
5 diapositivas
Corporate Ethics and Legal Guidelines
Clearly outline company policies and ethical standards with this organized and professional slide. Featuring a checklist-style layout with customizable categories, it’s ideal for corporate trainings, compliance presentations, and HR onboarding. Fully editable and compatible with PowerPoint, Keynote, and Google Slides.
- Eliminar de favoritos
Plantilla de PowerPoint
1 MB
Plantilla de Google Slides
Enlace externo
Plantilla de Keynote
1 MB
4 diapositivas
Competitive Advantage Blue Ocean Strategy
Highlight strategic positioning with this Competitive Advantage Blue Ocean template. Designed with clear flow visuals and modern iconography, it’s perfect for showcasing unique value propositions, competitive edges, and market leadership strategies. Easy to edit in PowerPoint, Keynote, and Google Slides for seamless customization.
- Eliminar de favoritos
Plantilla de PowerPoint
1 MB
Plantilla de Google Slides
Enlace externo
Plantilla de Keynote
2 MB
6 diapositivas
Social Science Infographics
The "Social Science" infographic template is an intellectually stimulating and visually engaging tool, thoughtfully designed for PowerPoint, Keynote, and Google Slides. This template is a brilliant resource for educators, researchers, and students who seek to present the multifaceted aspects of social sciences in a clear and compelling manner. This template skillfully encompasses various disciplines within social science, such as anthropology, sociology, psychology, and political science. It presents key theories, methodologies, and findings in an organized and digestible format. This makes it an invaluable aid for academic presentations, research proposals, or educational discussions, facilitating a deeper understanding of human society and social relationships. The design is as thought-provoking as the subject it represents, with a color scheme that stimulates intellectual curiosity while maintaining clarity and focus. This not only enhances the visual appeal of the presentation but also complements the analytical and reflective nature of social science. Whether used in a lecture hall, a conference, or a study group, this template ensures that the complex world of "Social Science" is presented in an engaging, informative, and visually captivating manner.
- Eliminar de favoritos
Plantilla de PowerPoint
1 MB
Plantilla de Google Slides
Enlace externo
Plantilla de Keynote
1 MB
5 diapositivas
Risk Assessment Heat Map Presentation
Evaluate risks effectively with a structured heat map. This Risk Assessment Heat Map helps visualize potential threats by mapping probability and impact levels. Ideal for risk management, business continuity planning, and decision-making. Fully customizable and compatible with PowerPoint, Keynote, and Google Slides for professional and seamless integration.
- Eliminar de favoritos
Plantilla de PowerPoint
1 MB
Plantilla de Google Slides
Enlace externo
Plantilla de Keynote
2 MB
5 diapositivas
Market Expansion Strategies in South America Map Presentation
Explore opportunities with the Market Expansion Strategies in South America Map template, showcasing key business insights across various regions in South America. This presentation is your gateway to understanding market dynamics and planning strategic moves. It features a customizable map with percentage indicators, ideal for displaying market growth and regional trends. Compatible with PowerPoint, Keynote and Google Slides.
- Eliminar de favoritos
Plantilla de PowerPoint
1 MB
Plantilla de Google Slides
Enlace externo
Plantilla de Keynote
1 MB
5 diapositivas
Digital Strategy and Online Campaigns Presentation
Aim for success with the Digital Strategy and Online Campaigns Presentation. This template uses a dynamic target and arrow graphic to represent strategic goals, campaign directions, and marketing focus. Ideal for showcasing KPIs, digital initiatives, and performance insights. Fully customizable in PowerPoint, Keynote, and Google Slides.
- Eliminar de favoritos
Plantilla de PowerPoint
1 MB
Plantilla de Google Slides
Enlace externo
Plantilla de Keynote
1 MB
7 diapositivas
Empathy Map Tools Infographic
Navigate the intricate landscapes of human emotions with our empathy map infographic. Bathed in the reflective tones of blue, the clarity of white, and the insightful hints of yellow, our template offers a deep dive into understanding and capturing user experiences. Equipped with purpose-driven infographics, intuitive icons, and relevant image placeholders, it visualizes the nuances of empathy in a tangible manner. Meticulously tailored for Powerpoint, Keynote, or Google Slides. An invaluable tool for UX designers, psychologists, researchers, or any professional keen on enhancing user experiences. Delve deeper; let every slide amplify understanding.
- Eliminar de favoritos
Plantilla de PowerPoint
1 MB
Plantilla de Google Slides
Enlace externo
Plantilla de Keynote
1 MB
4 diapositivas
Cost Breakdown for Business Planning Presentation
Visually balance your budget strategy with the Cost Breakdown for Business Planning Presentation. Featuring a scale-style layout, this slide helps you compare two financial metrics or allocations with clarity and simplicity. Ideal for showcasing trade-offs, resource planning, or funding distribution. Fully editable in PowerPoint, Google Slides, Keynote, and Canva.
- Eliminar de favoritos
Plantilla de PowerPoint
5 MB
Plantilla de Google Slides
Enlace externo
Plantilla de Keynote
4 MB
5 diapositivas
Creative Watercolor Style Presentation
Splash your ideas onto the page with a layout that blends artistic watercolor accents and clean, modern structure. This presentation helps you showcase insights, steps, or concepts in a visually soothing format that feels both creative and professional. Ideal for storytelling or branding discussions. Fully compatible with PowerPoint, Keynote, and Google Slides.


