


Características


¿Tienes alguna pregunta?
Recomendar


12 diapositivas
User Experience Journey Presentation
The "User Experience Journey Presentation" template offers a comprehensive visualization of the stages involved in user interaction with a product or service. This infographic template maps out each phase of the user experience journey, depicted in a sequence of steps marked from A to F, each stage highlighted with unique icons and a gradient color scheme enhancing visual appeal and understanding. Suitable for UX professionals, marketers, and product developers, this template aids in illustrating the process from initial contact to post-use evaluation, emphasizing key points at each stage. It is an invaluable tool for presentations aimed at enhancing customer satisfaction and optimizing user interaction strategies.


26 diapositivas
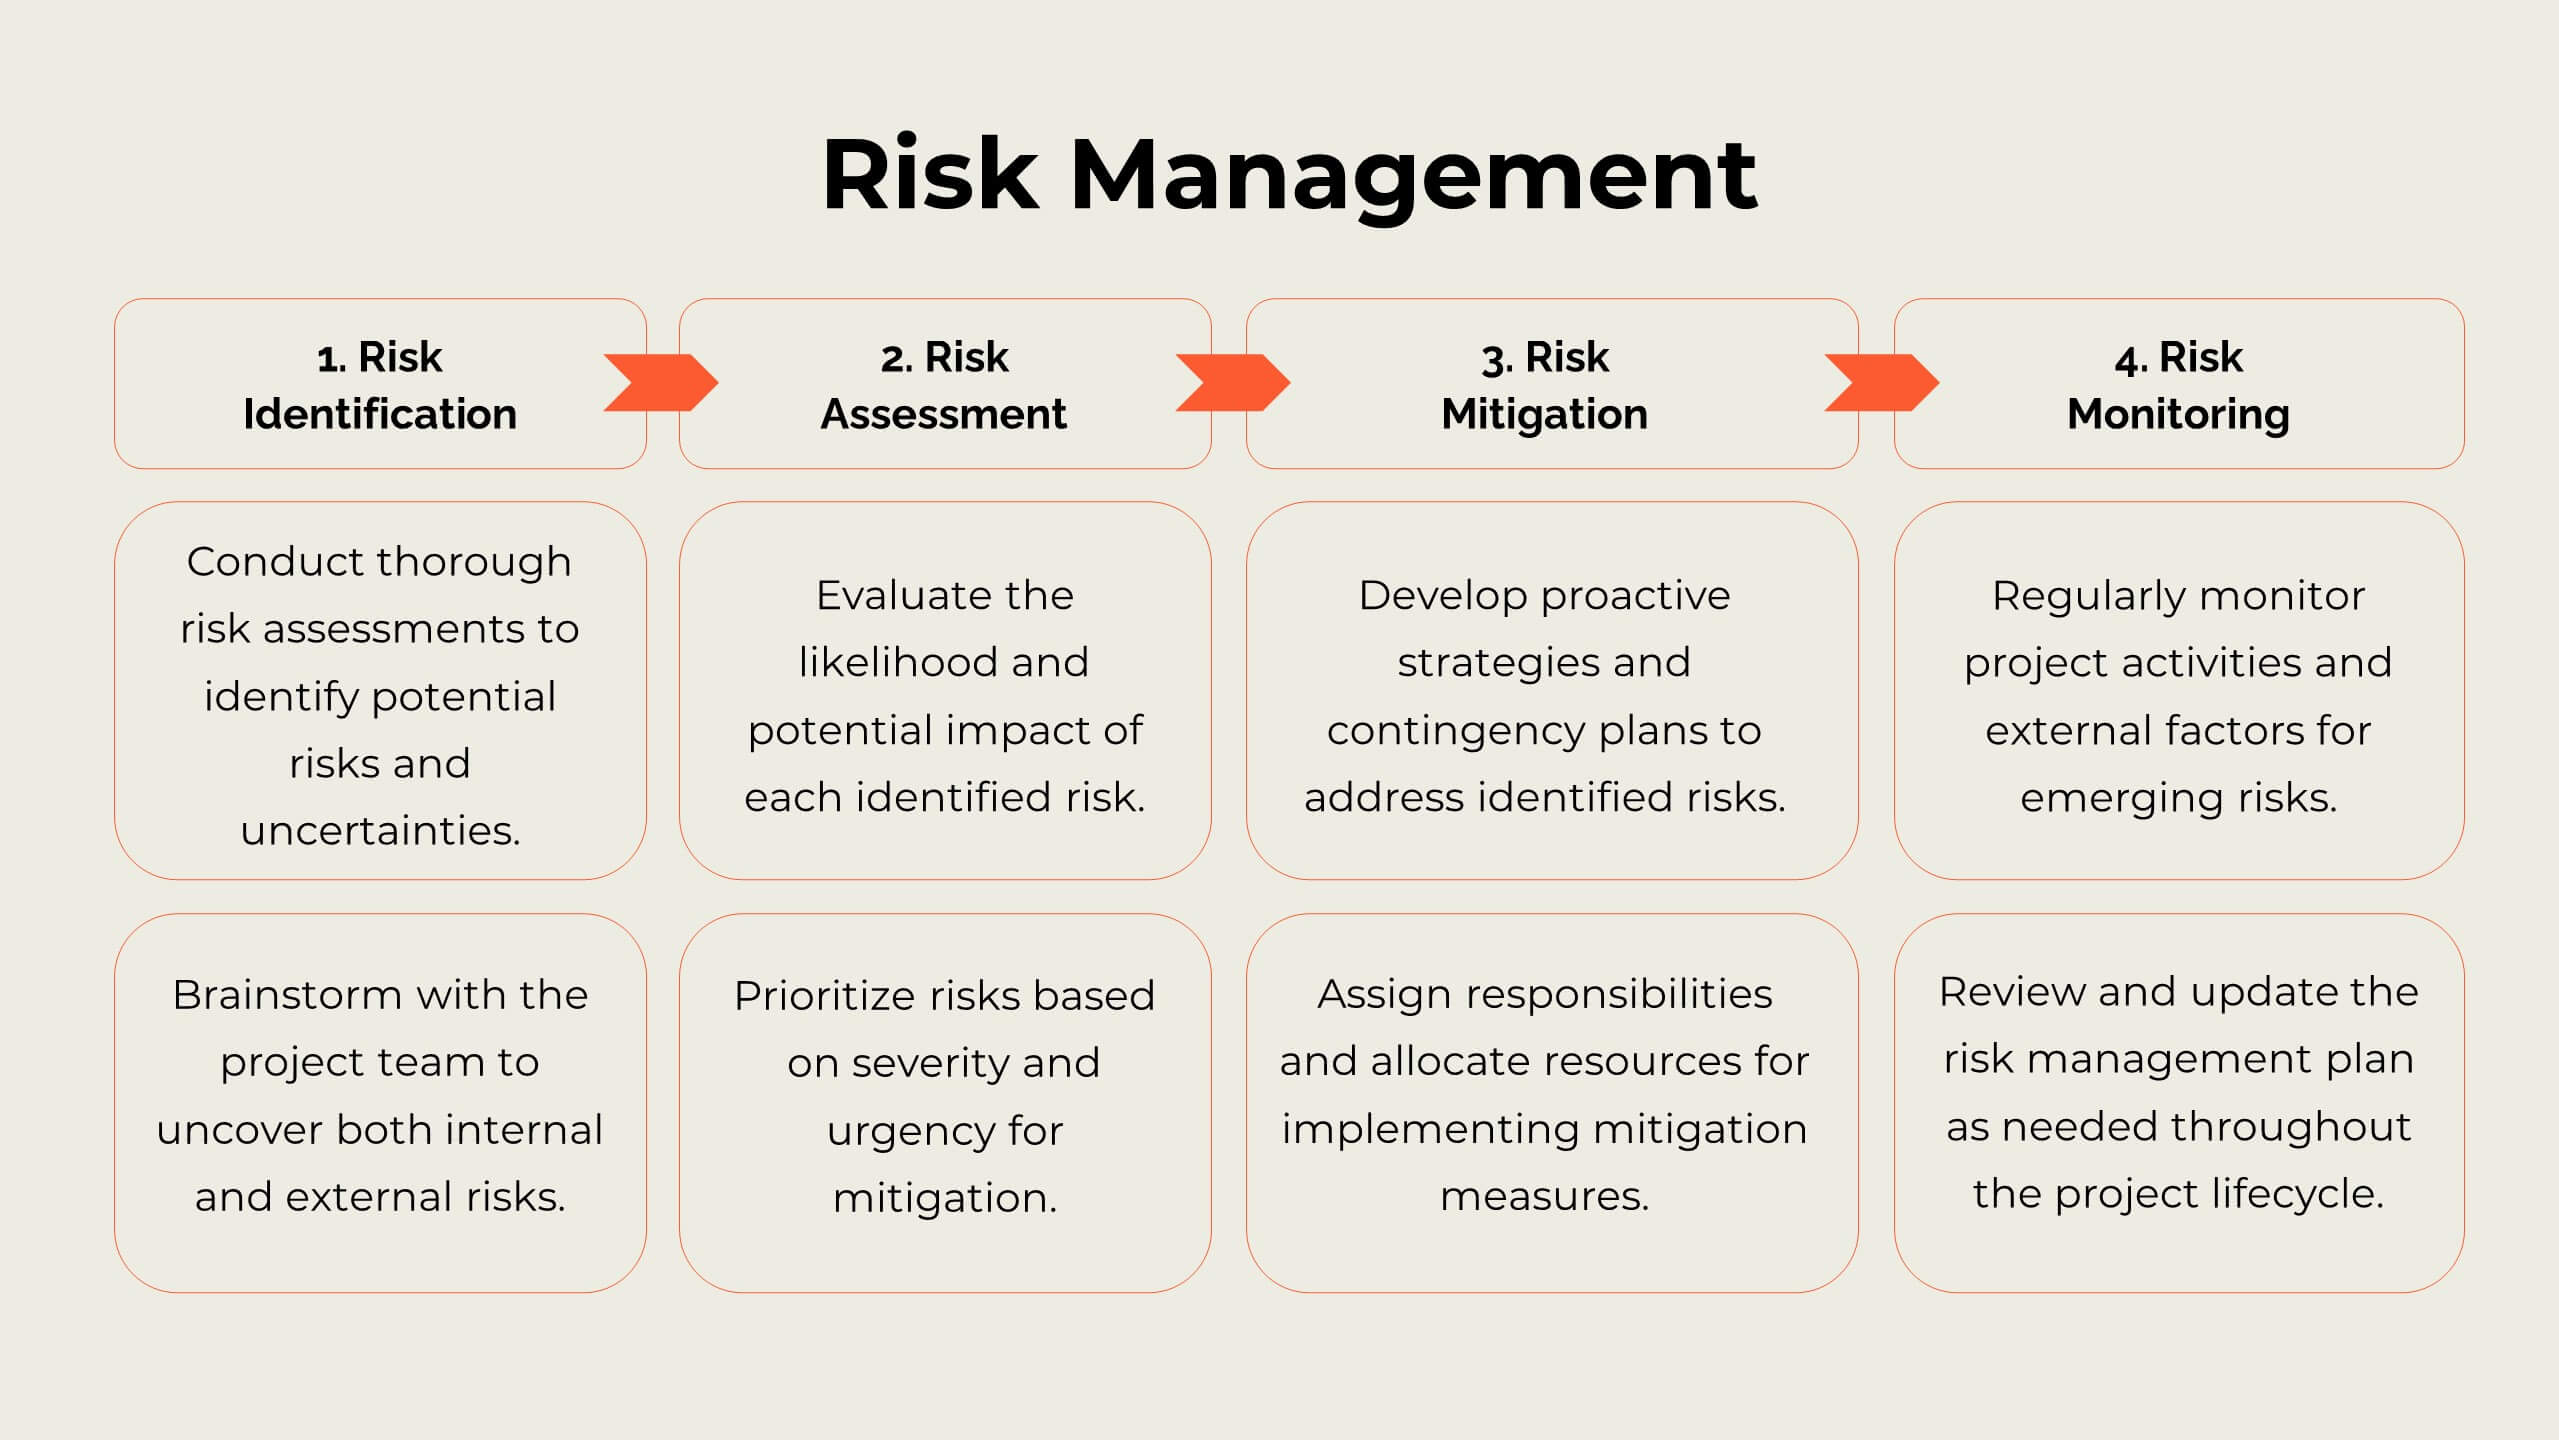
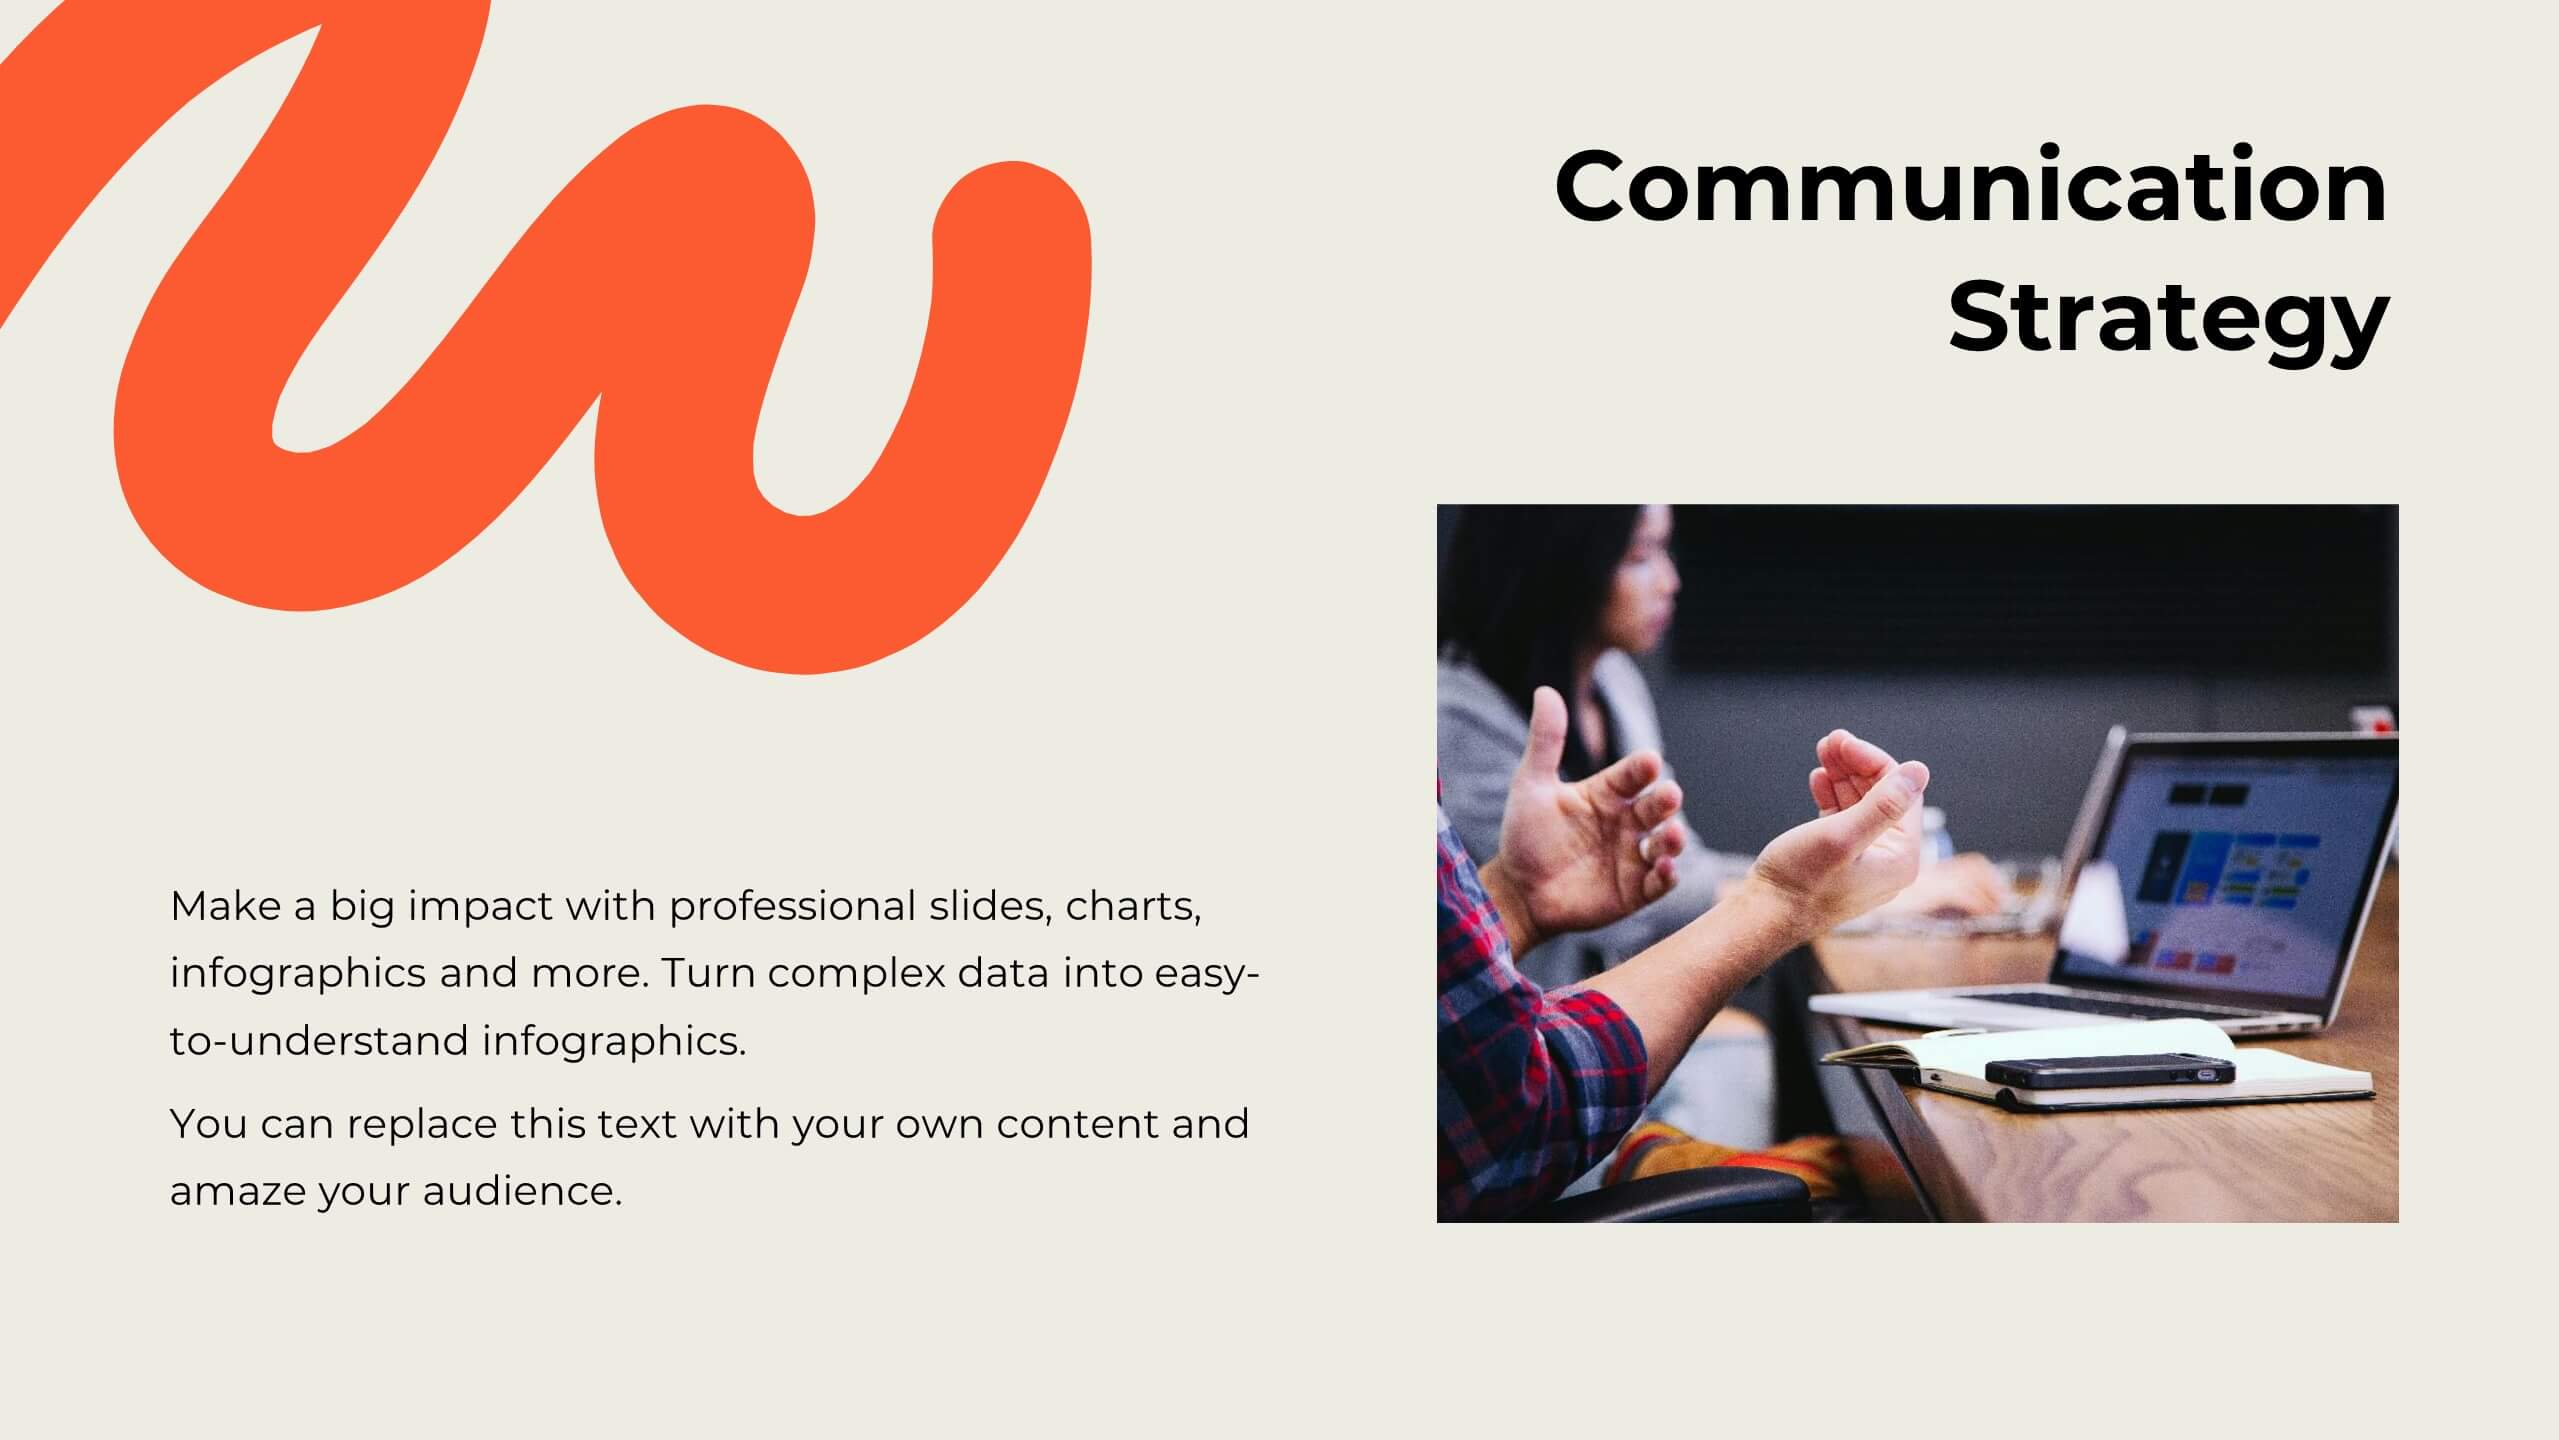
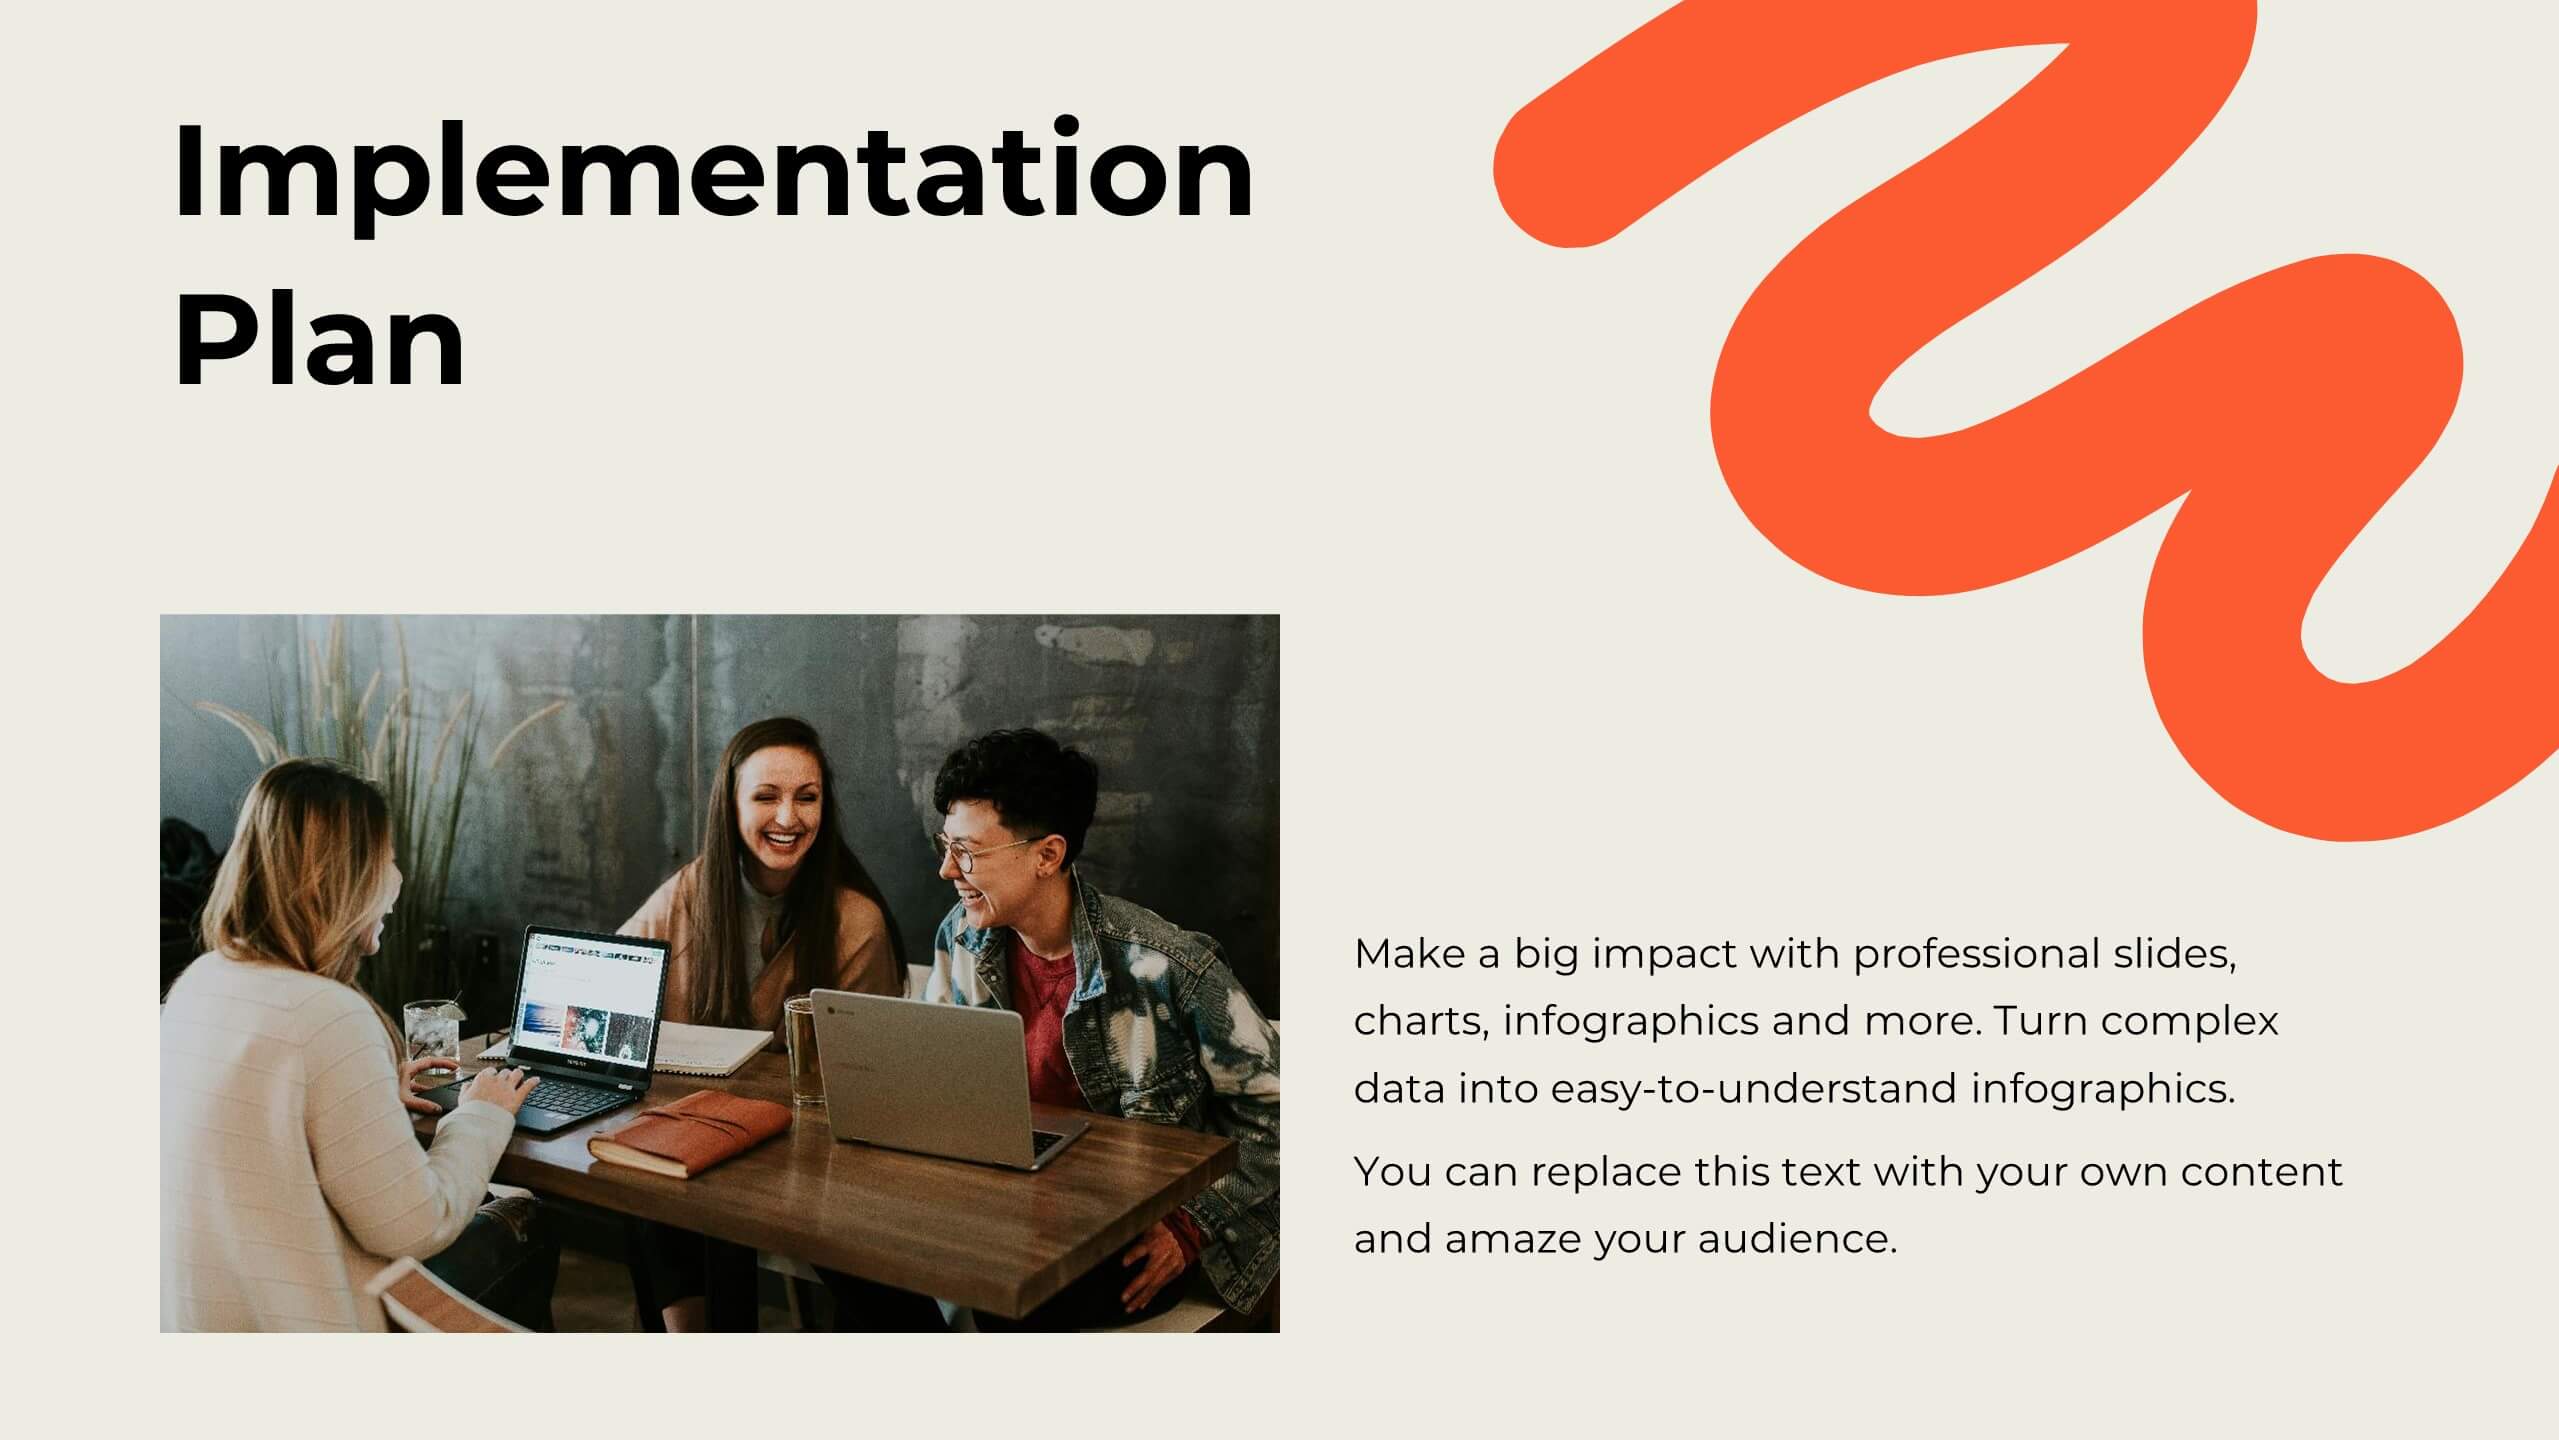
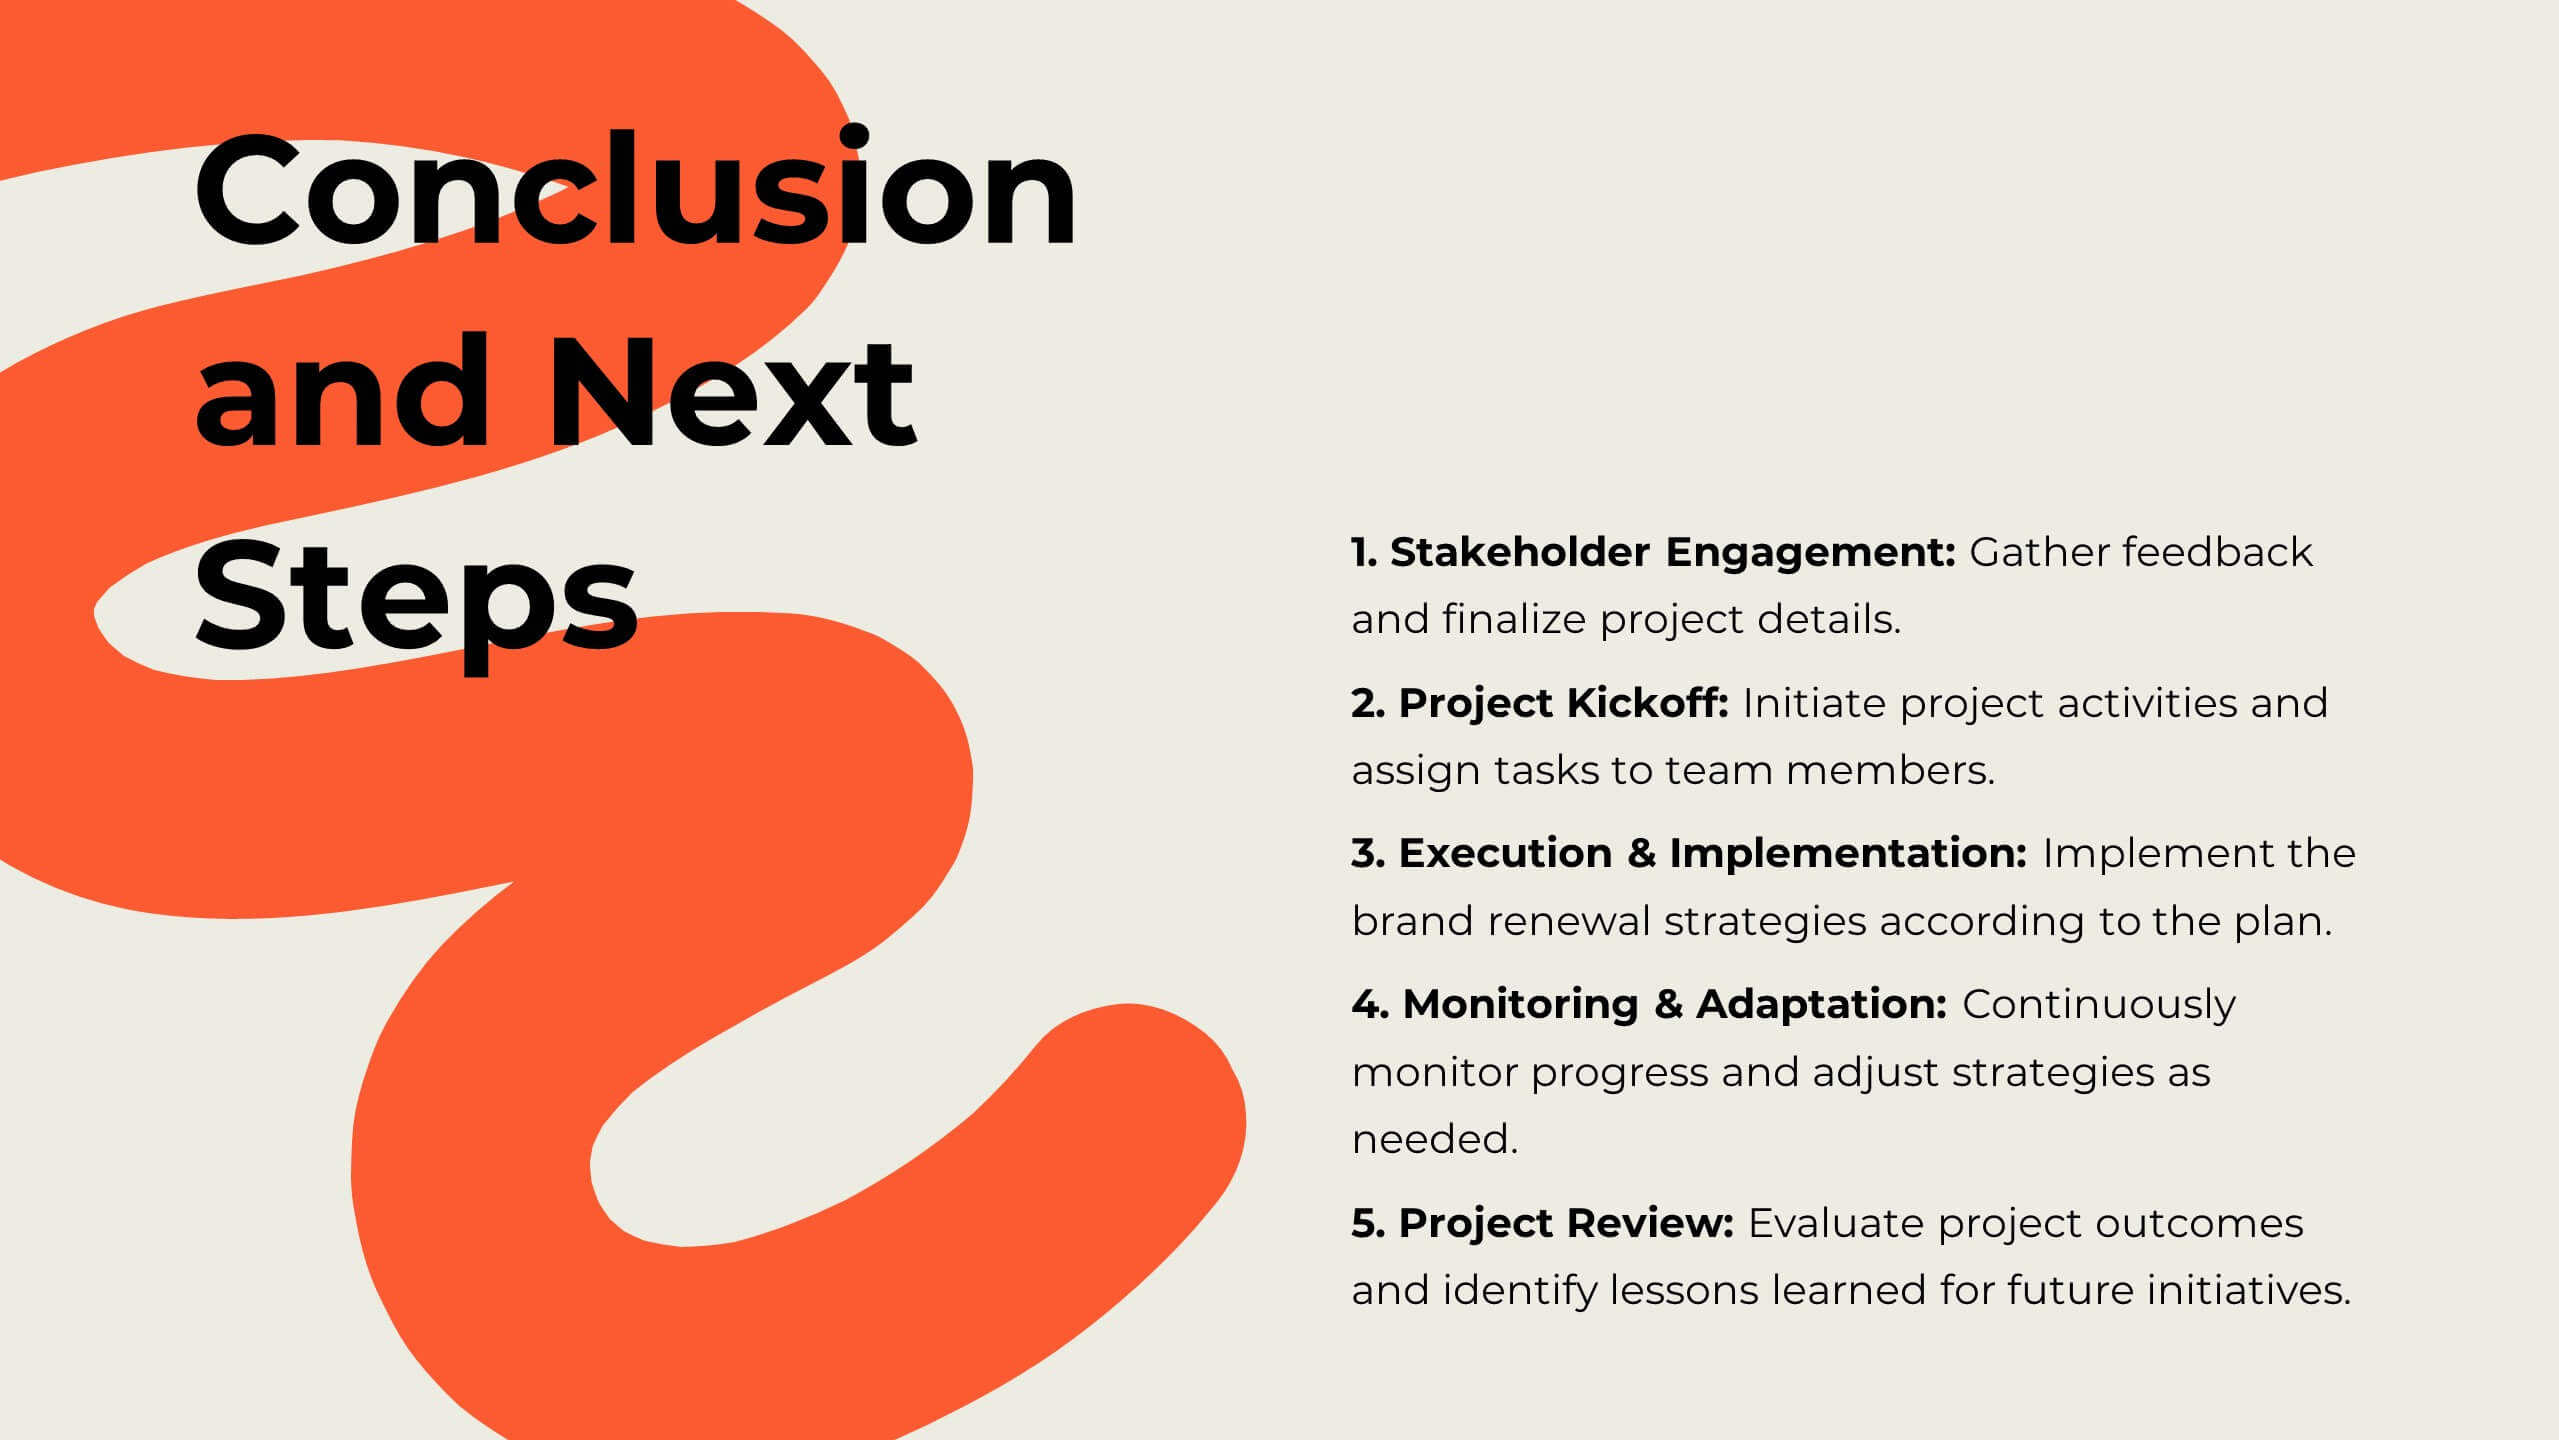
Salus Rebranding Project Plan Presentation
This rebranding project plan template offers a clear framework for presenting brand identity transformation. Covering brand values, identity components, target audience, positioning, and guidelines, it’s ideal for companies refreshing their brand. Compatible with PowerPoint, Keynote, and Google Slides, it ensures a streamlined, professional presentation of your rebranding strategy.


22 diapositivas
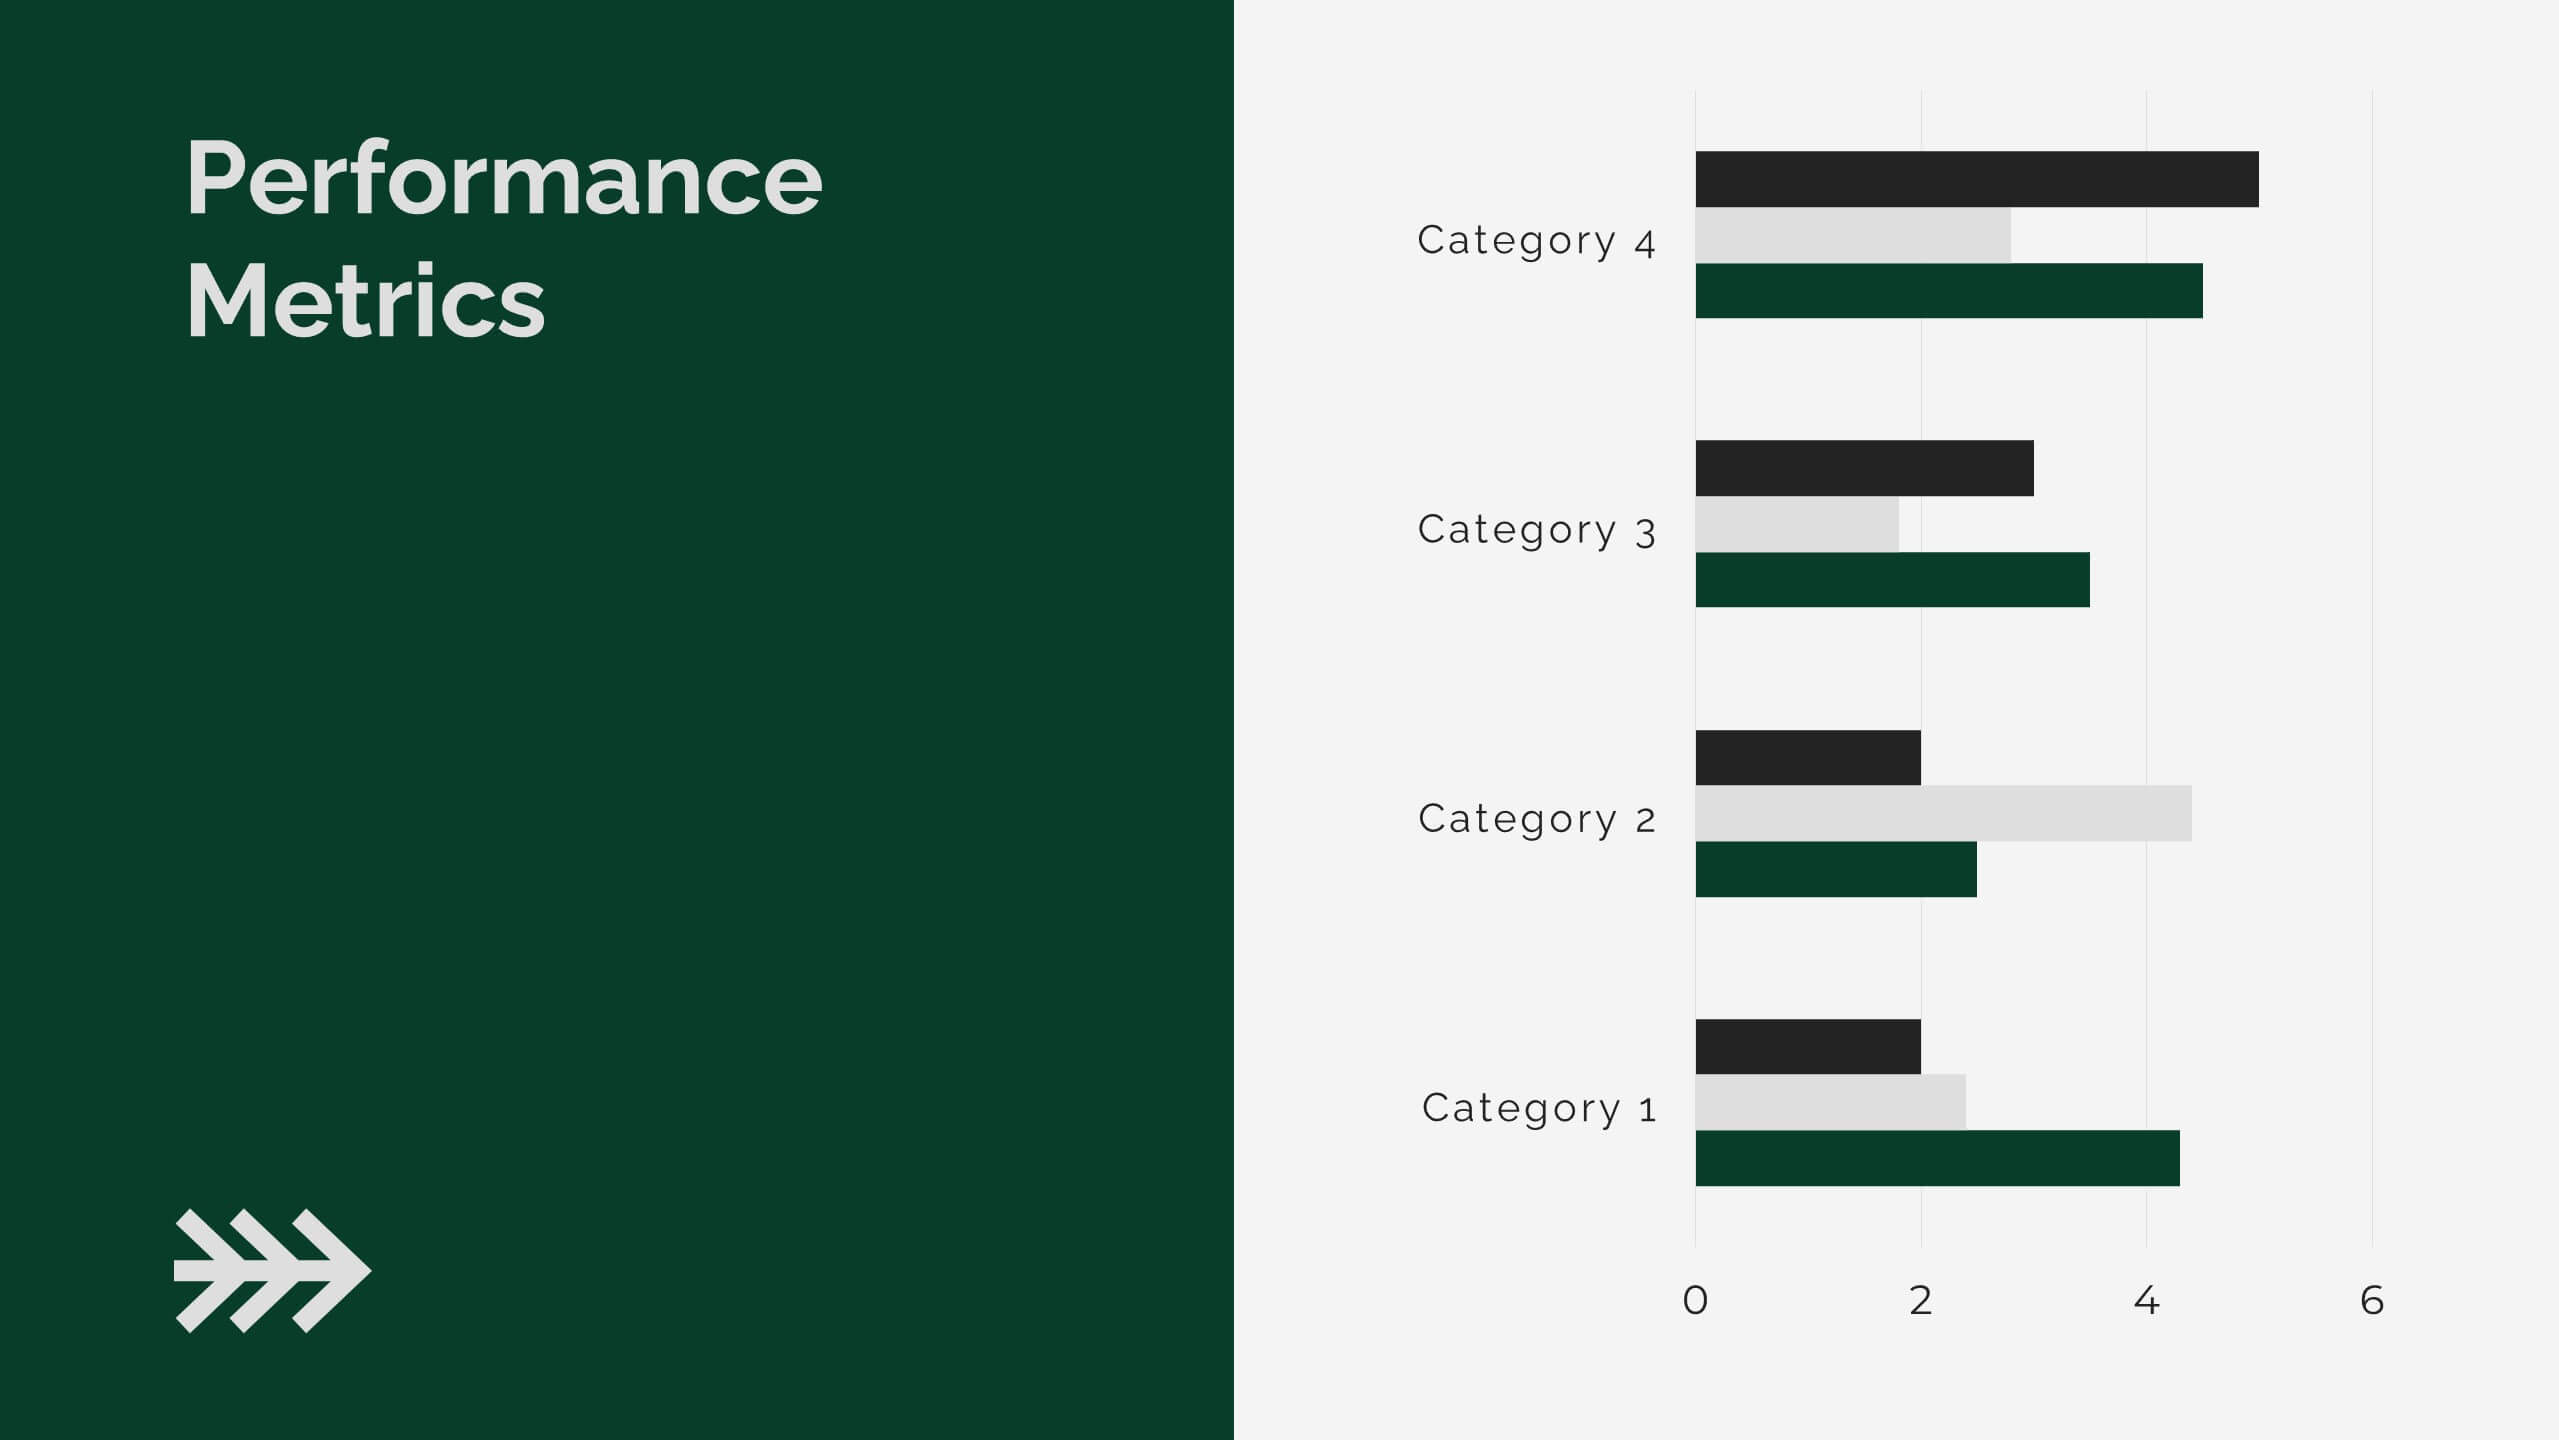
Tempest Product Strategy Report Presentation
Accelerate your product strategy with this bold presentation template! Ideal for outlining your product's market opportunity, unique selling proposition, and revenue model, it includes slides for competitive analysis, marketing strategy, and financials. Impress stakeholders with dynamic visuals and clear, structured content. Compatible with PowerPoint, Keynote, and Google Slides for seamless presentations on any platform.


20 diapositivas
Syntax Creative Design Report Presentation
The Design Presentation Template empowers you to deliver visually stunning and organized presentations. With 20 fully editable slides, it includes sections like design briefs, elements, processes, mood boards, prototypes, and timelines. Tailored for designers and creative teams, it's compatible with PowerPoint, Keynote, and Google Slides for seamless customization and impact.


7 diapositivas
SCRUM Roles Infographic
Dive into the agile world with our SCRUM roles infographic. This template is designed to depict the various roles within the SCRUM framework, offering clarity and insight into the collaborative heart of agile methodologies. With a clean white canvas set against hues of blue, it provides a modern yet comprehensive overview of the roles. Ideal for agile coaches, trainers, and organizations transitioning to agile methodologies, this infographic is tailored to showcase the importance of each role. With its compatibility, spanning PowerPoint, Keynote, and Google Slides, presentations are bound to be a breeze, regardless of the platform you favor.


6 diapositivas
Checklist and To-Do List Presentation
Bring order and elegance to your presentation with this sleek, easy-to-edit layout perfect for summarizing ideas, listing features, or outlining processes. Its balanced design ensures clarity and flow while keeping your slides visually engaging. Fully compatible with PowerPoint, Keynote, and Google Slides for effortless customization and professional results.


7 diapositivas
Creative Tree Diagram Infographic
Unveil hierarchical structures or processes with our evocative tree diagram infographic. Set against a pristine white canvas and enriched with shades of trusty blue and organic green, this creative template epitomizes growth, interconnections, and systematic understanding. Embellished with crisp infographics, intuitive icons, and illustrative image placeholders, it effortlessly visualizes layered information. Perfectly tailored for Powerpoint, Keynote, or Google Slides. An indispensable resource for project managers, educators, business analysts, or any organization aiming to display branching information or decisions. Grow with clarity; let each slide branch out into a wealth of understanding.


6 diapositivas
Sales Team Infographic
The series presented showcases various slide templates tailored for enhancing sales team strategies and communication. Each slide is crafted to assist sales professionals in detailing team structures, sales goals, performance metrics, and strategic initiatives effectively. Utilizing vibrant color blocks and streamlined design elements, these templates make complex sales data approachable and engaging, facilitating clear and impactful presentations. The collection is designed with adaptability in mind, incorporating elements that can be easily customized to fit different team needs and company branding. These include comparative layouts for benchmarking, timeline formats for showcasing sales cycles, and diagrammatic representations for visualizing sales processes and results. Perfect for internal meetings, sales training sessions, and stakeholder presentations, these templates serve as essential tools for sales leaders to convey their team’s progress, celebrate wins, and strategize for future sales endeavors.


6 diapositivas
Organizational Change Management Strategy Presentation
Navigate organizational change effectively with this dynamic and structured presentation slide. Featuring a puzzle-piece design, this template visually represents the interconnected steps of change management. Ideal for business leaders, HR professionals, and consultants, it helps illustrate transition processes, strategic adjustments, and team alignment. Fully editable, allowing you to customize text, colors, and layout to fit your business needs. Compatible with PowerPoint, Keynote, and Google Slides for effortless use.


10 diapositivas
Key Information Recap Summary
Conclude your presentation with clarity using this Key Information Recap Summary slide. Featuring a modern key-shaped design with four customizable sections, it’s perfect for summarizing essential insights. Fully compatible with PowerPoint, Keynote, and Google Slides.


3 diapositivas
Financial Planning and Budget Forecast Presentation
Present your financial goals with clarity using the Financial Planning and Budget Forecast Presentation. This modern, minimalist layout helps you break down percentage allocations, forecast future spending, and visualize budget insights with eye-catching graphics. Perfect for finance teams, startups, and consultants. Fully customizable in PowerPoint, Google Slides, Keynote, and Canva.


6 diapositivas
Anatomy of the Body Infographics
Explore the Anatomy of the Body with our customizable infographic template. This template is fully compatible with popular presentation software like PowerPoint, Keynote, and Google Slides, allowing you to easily customize it to illustrate and communicate various aspects of human anatomy. The Anatomy of the Body infographic template offers a visually engaging platform to outline the major systems, organs, and structures within the human body. Whether you're a student, healthcare professional, or simply interested in understanding the human body, this template provides a user-friendly canvas to create informative presentations and educational materials. Deepen your knowledge of human anatomy with this SEO-optimized infographic template, thoughtfully designed for clarity and ease of use. Customize it to showcase the circulatory system, respiratory system, digestive system, skeletal system, and more, ensuring that your audience gains a comprehensive understanding of the complex and fascinating world of human anatomy. Start crafting your personalized infographic today to explore the Anatomy of the Body in greater detail.


23 diapositivas
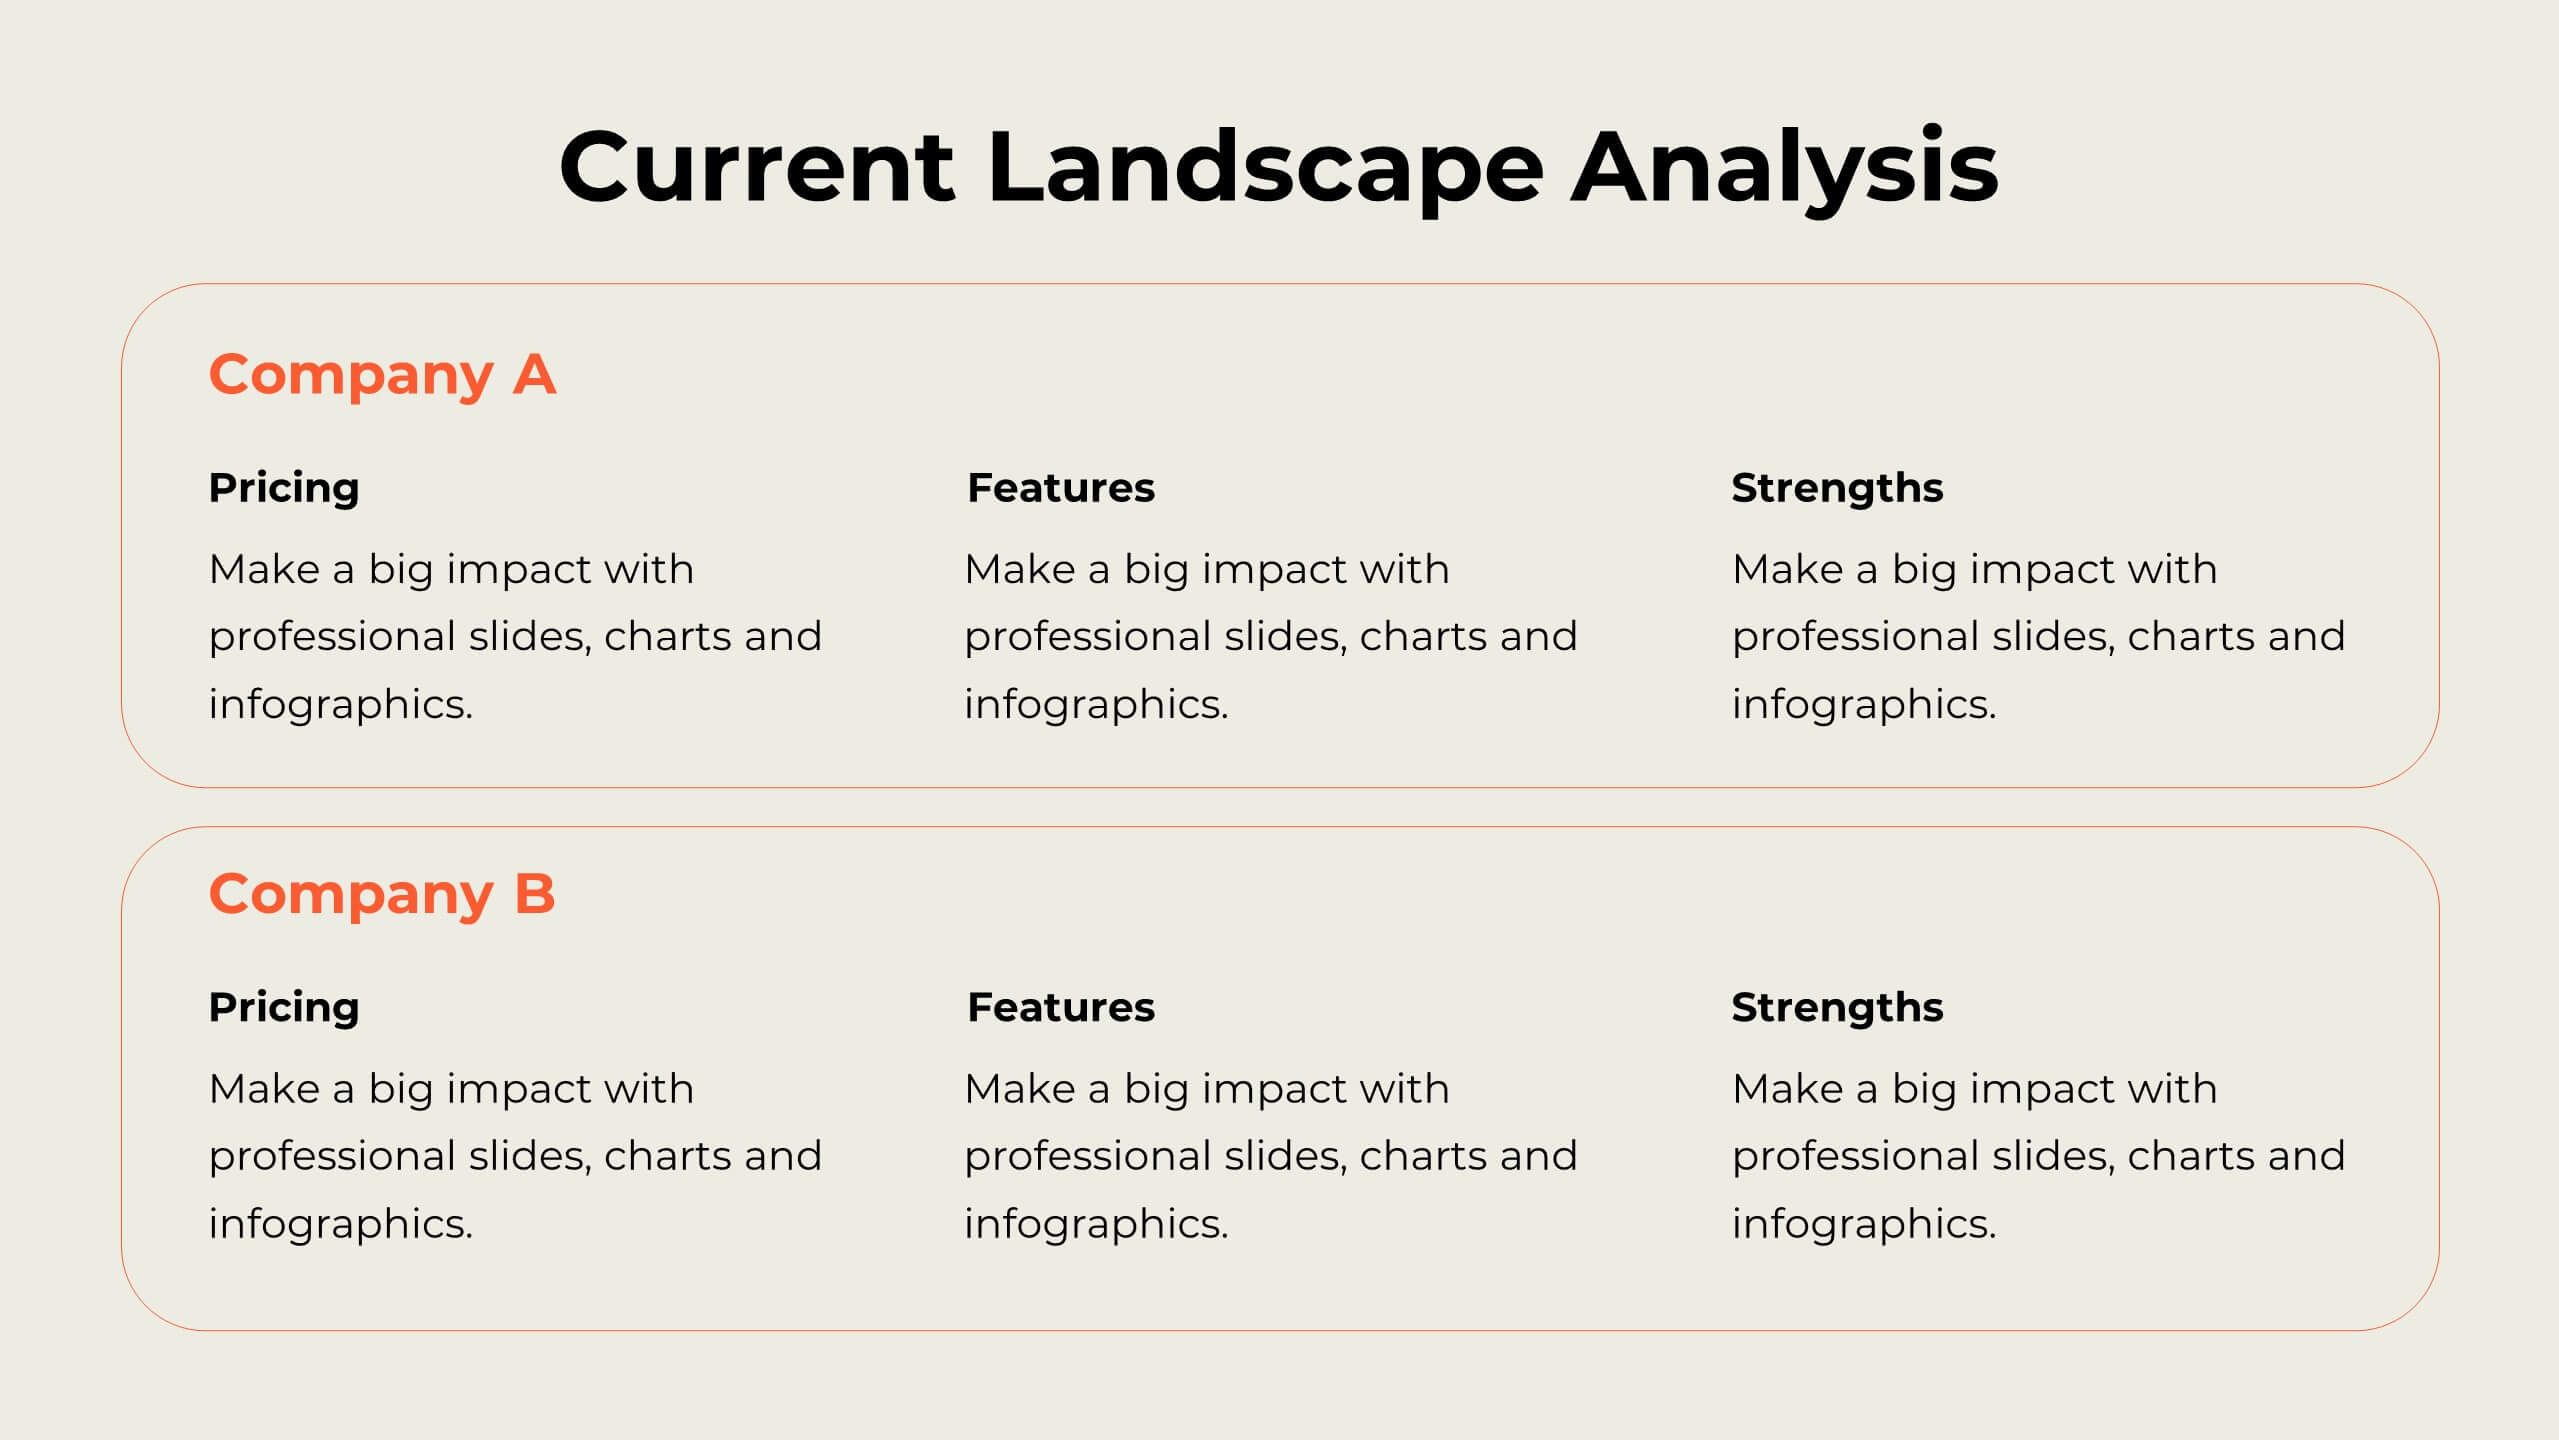
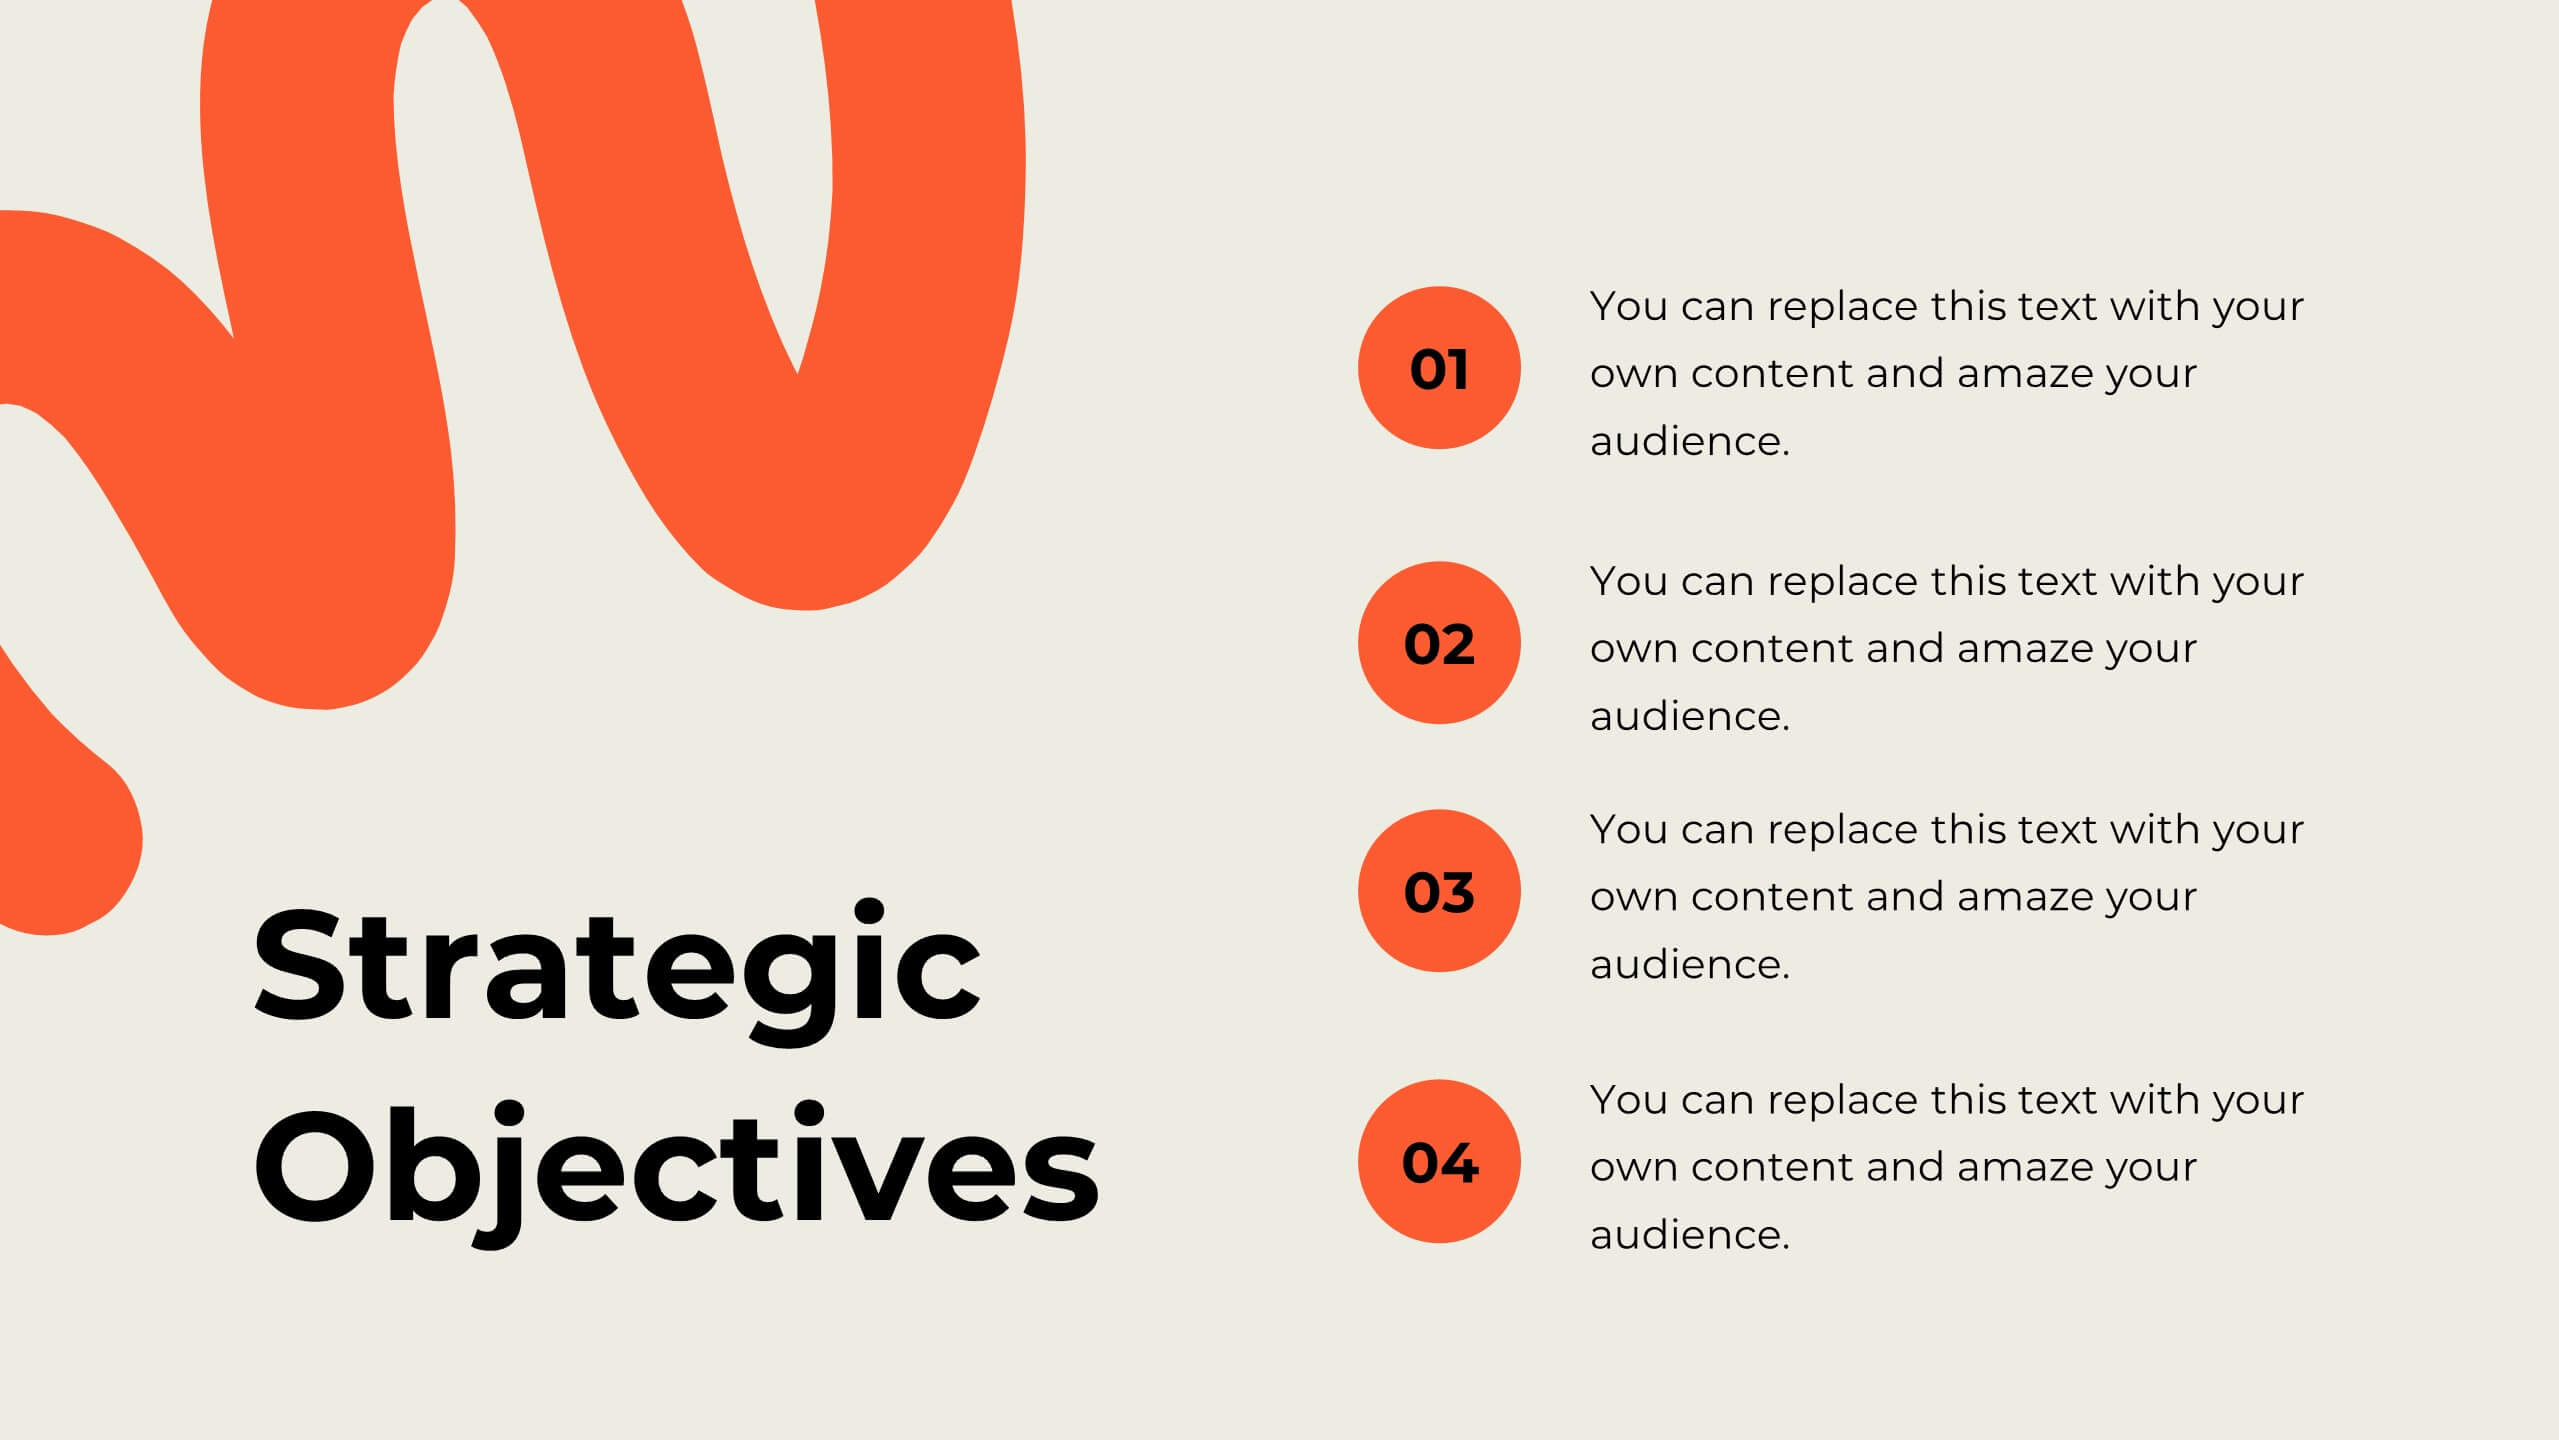
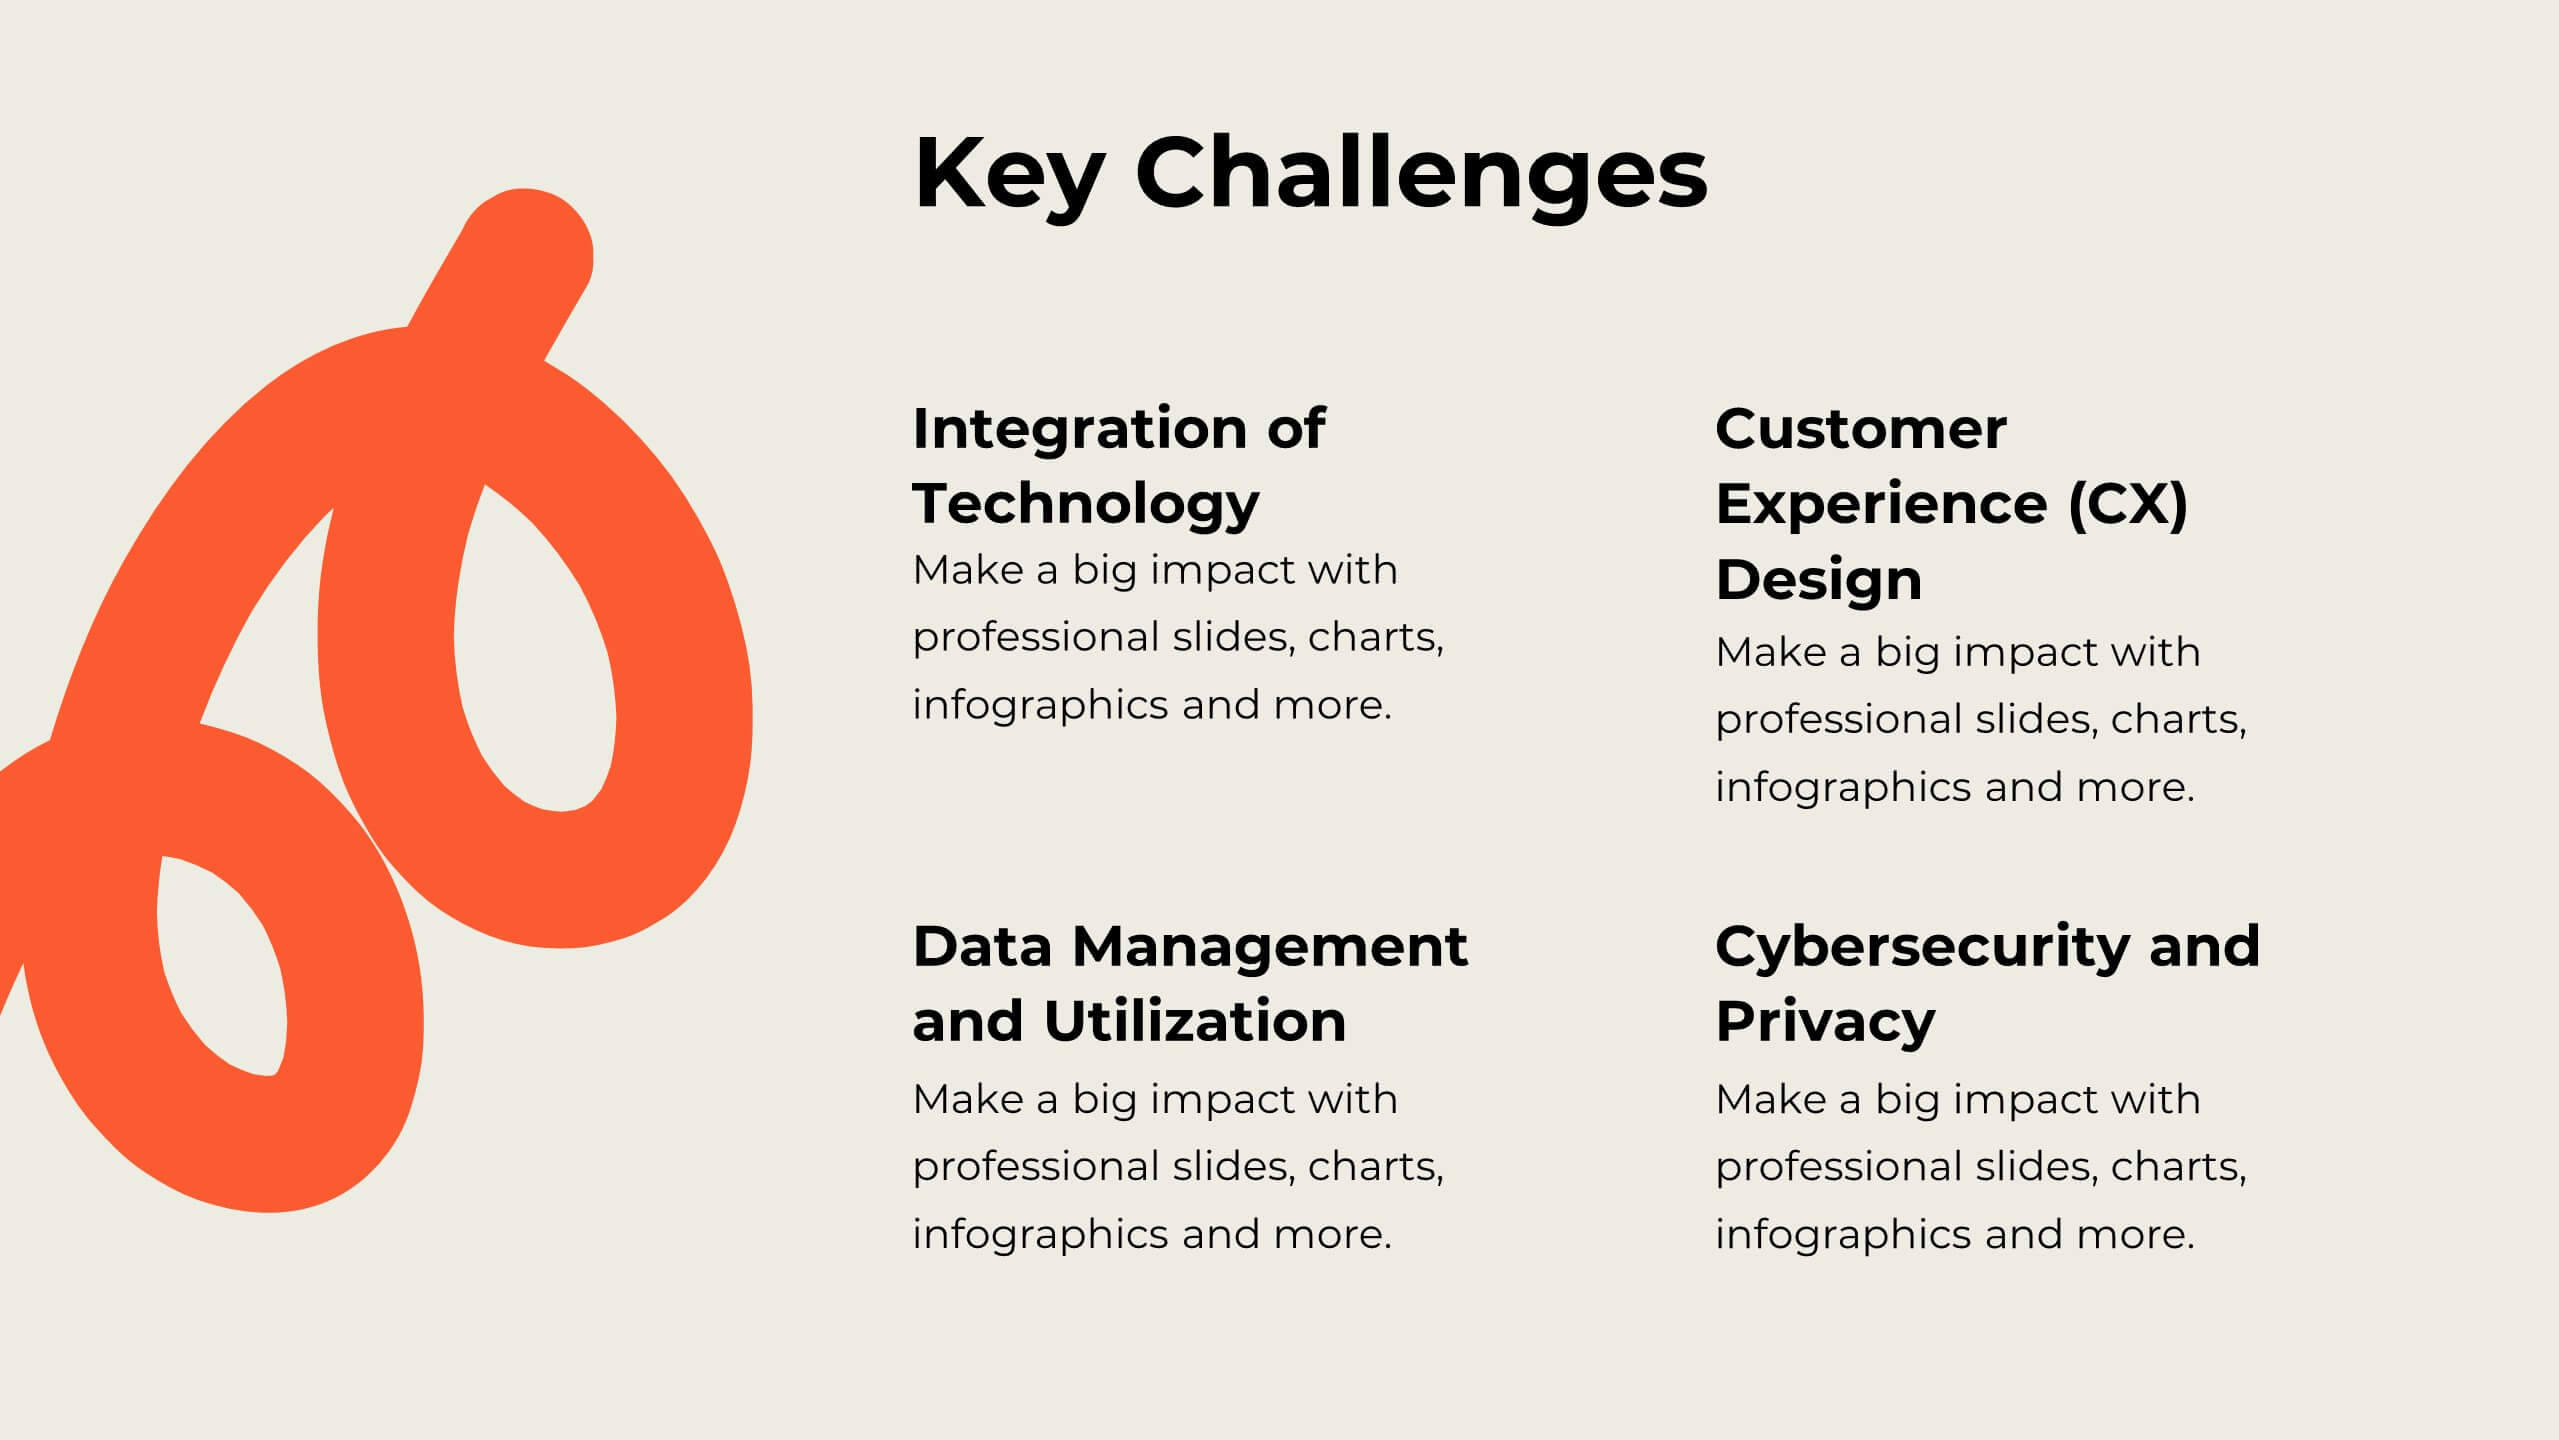
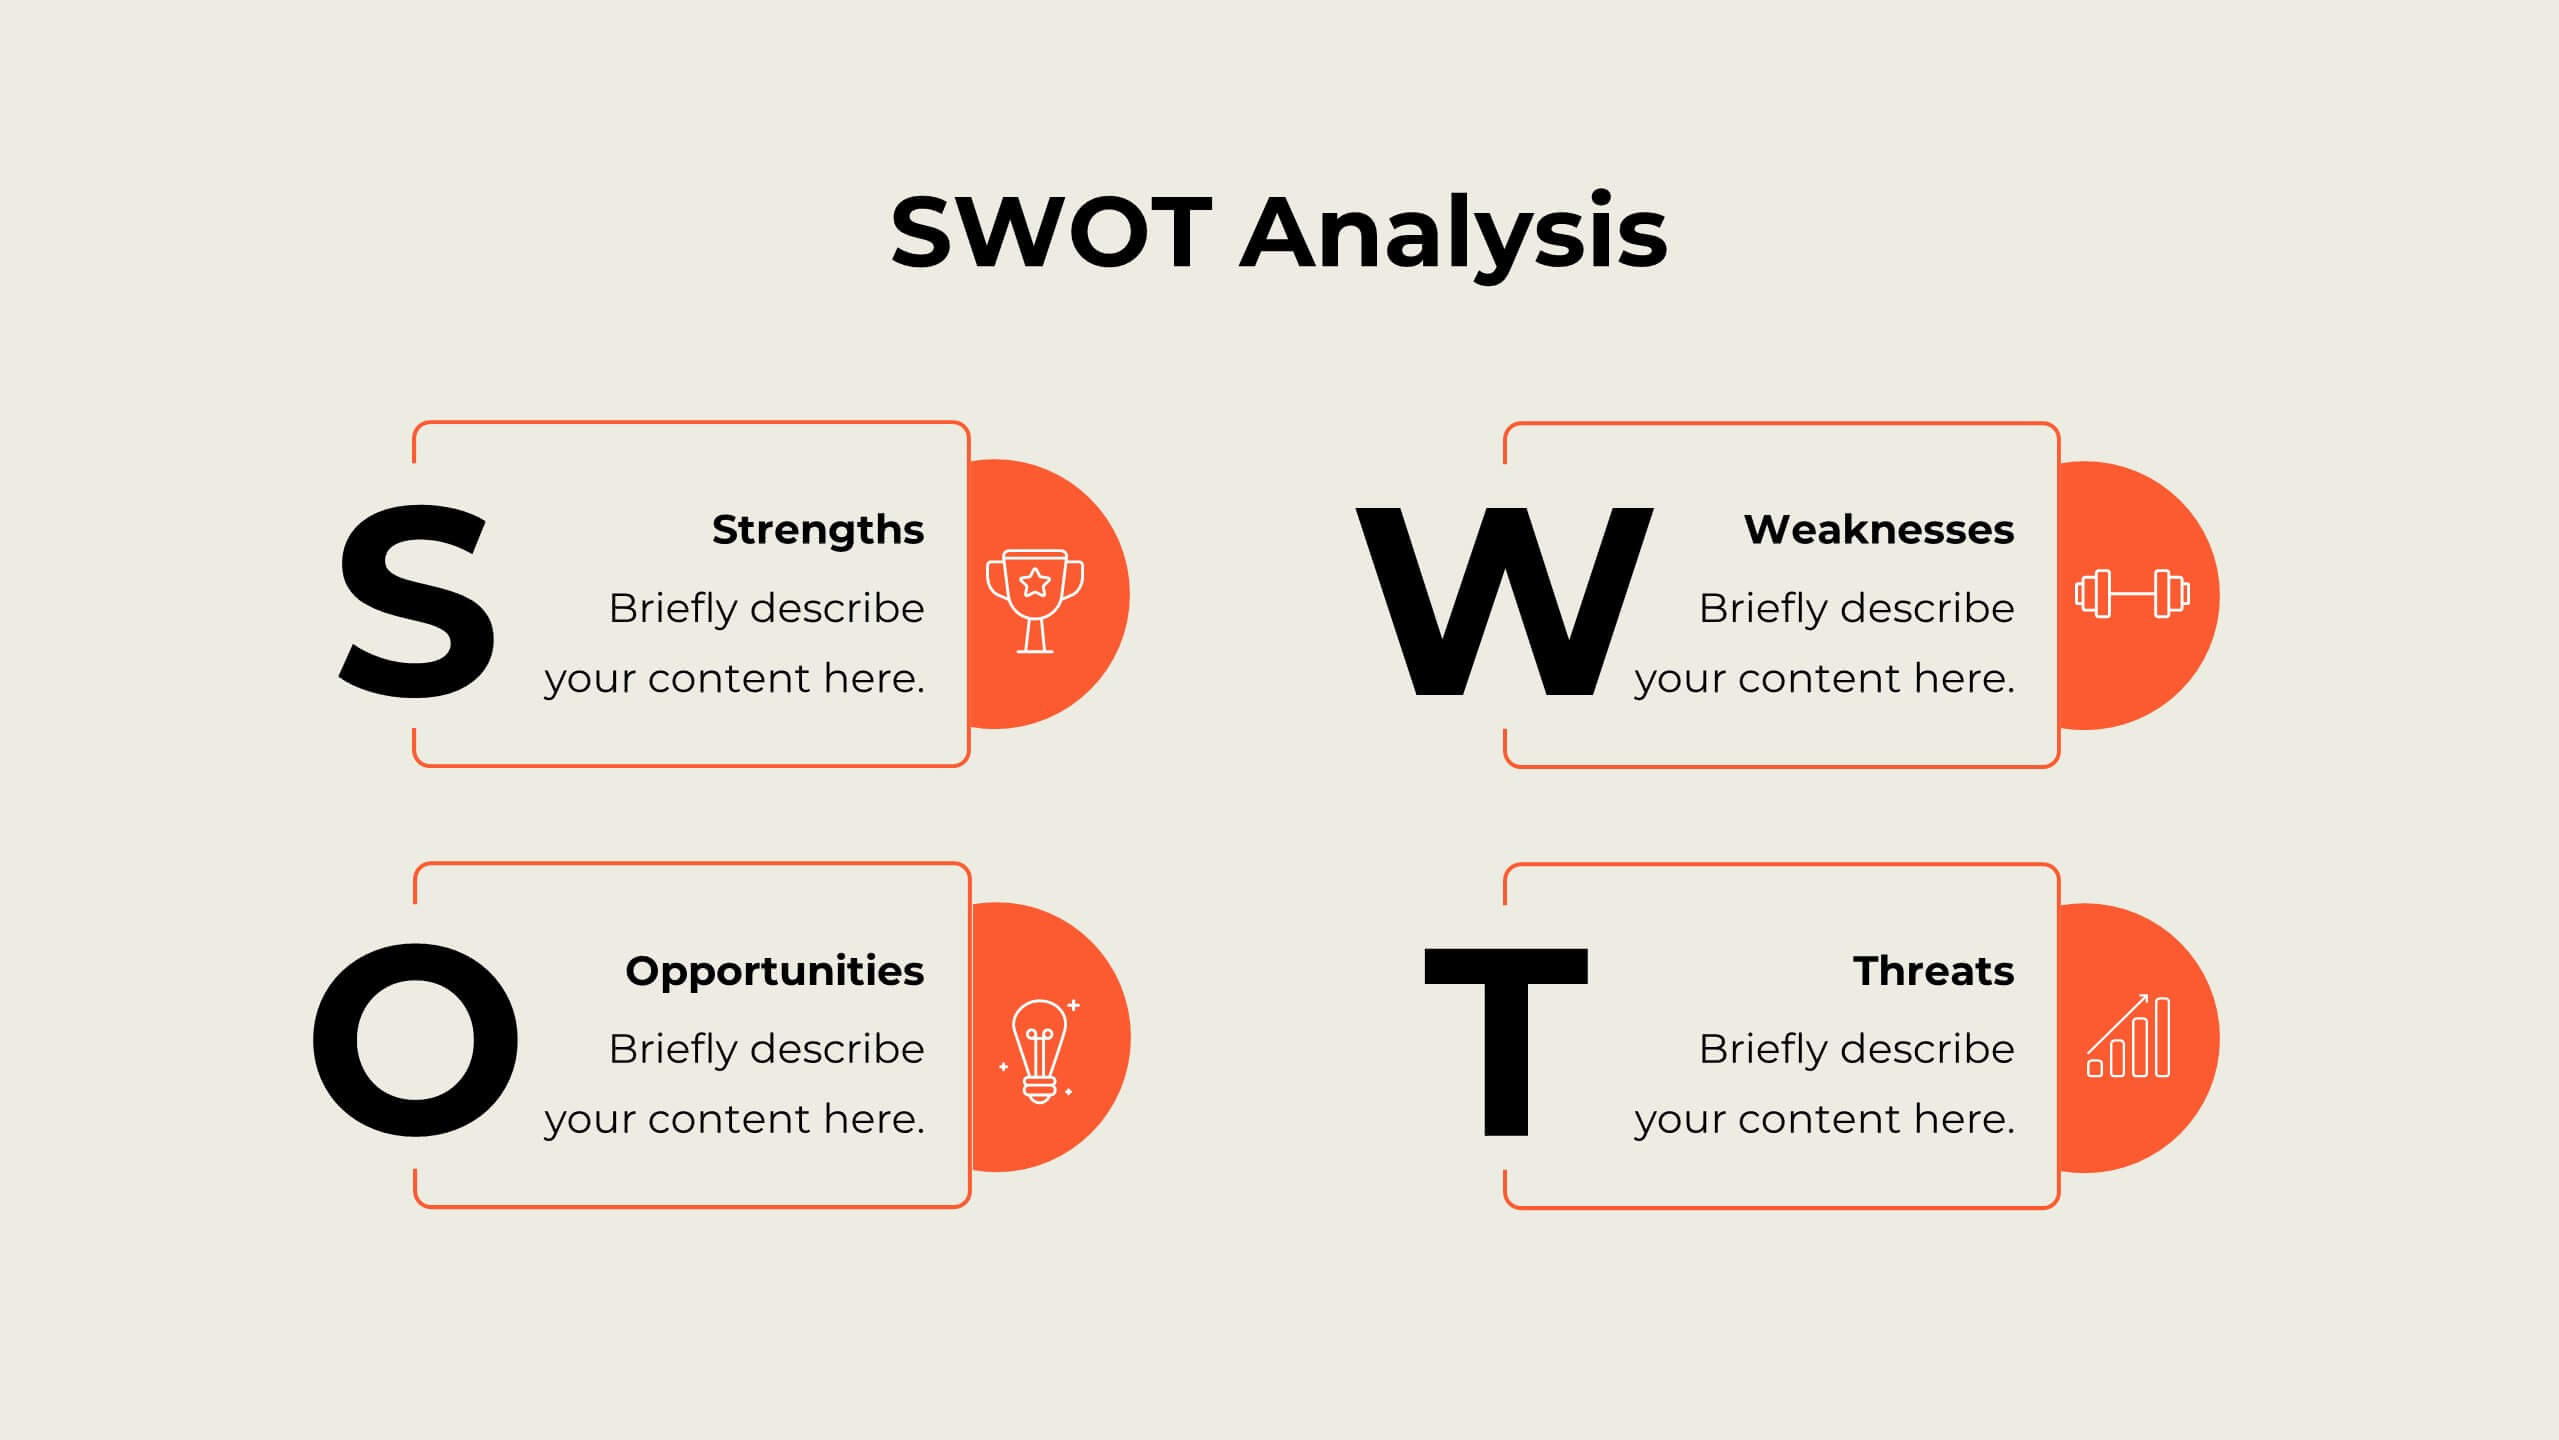
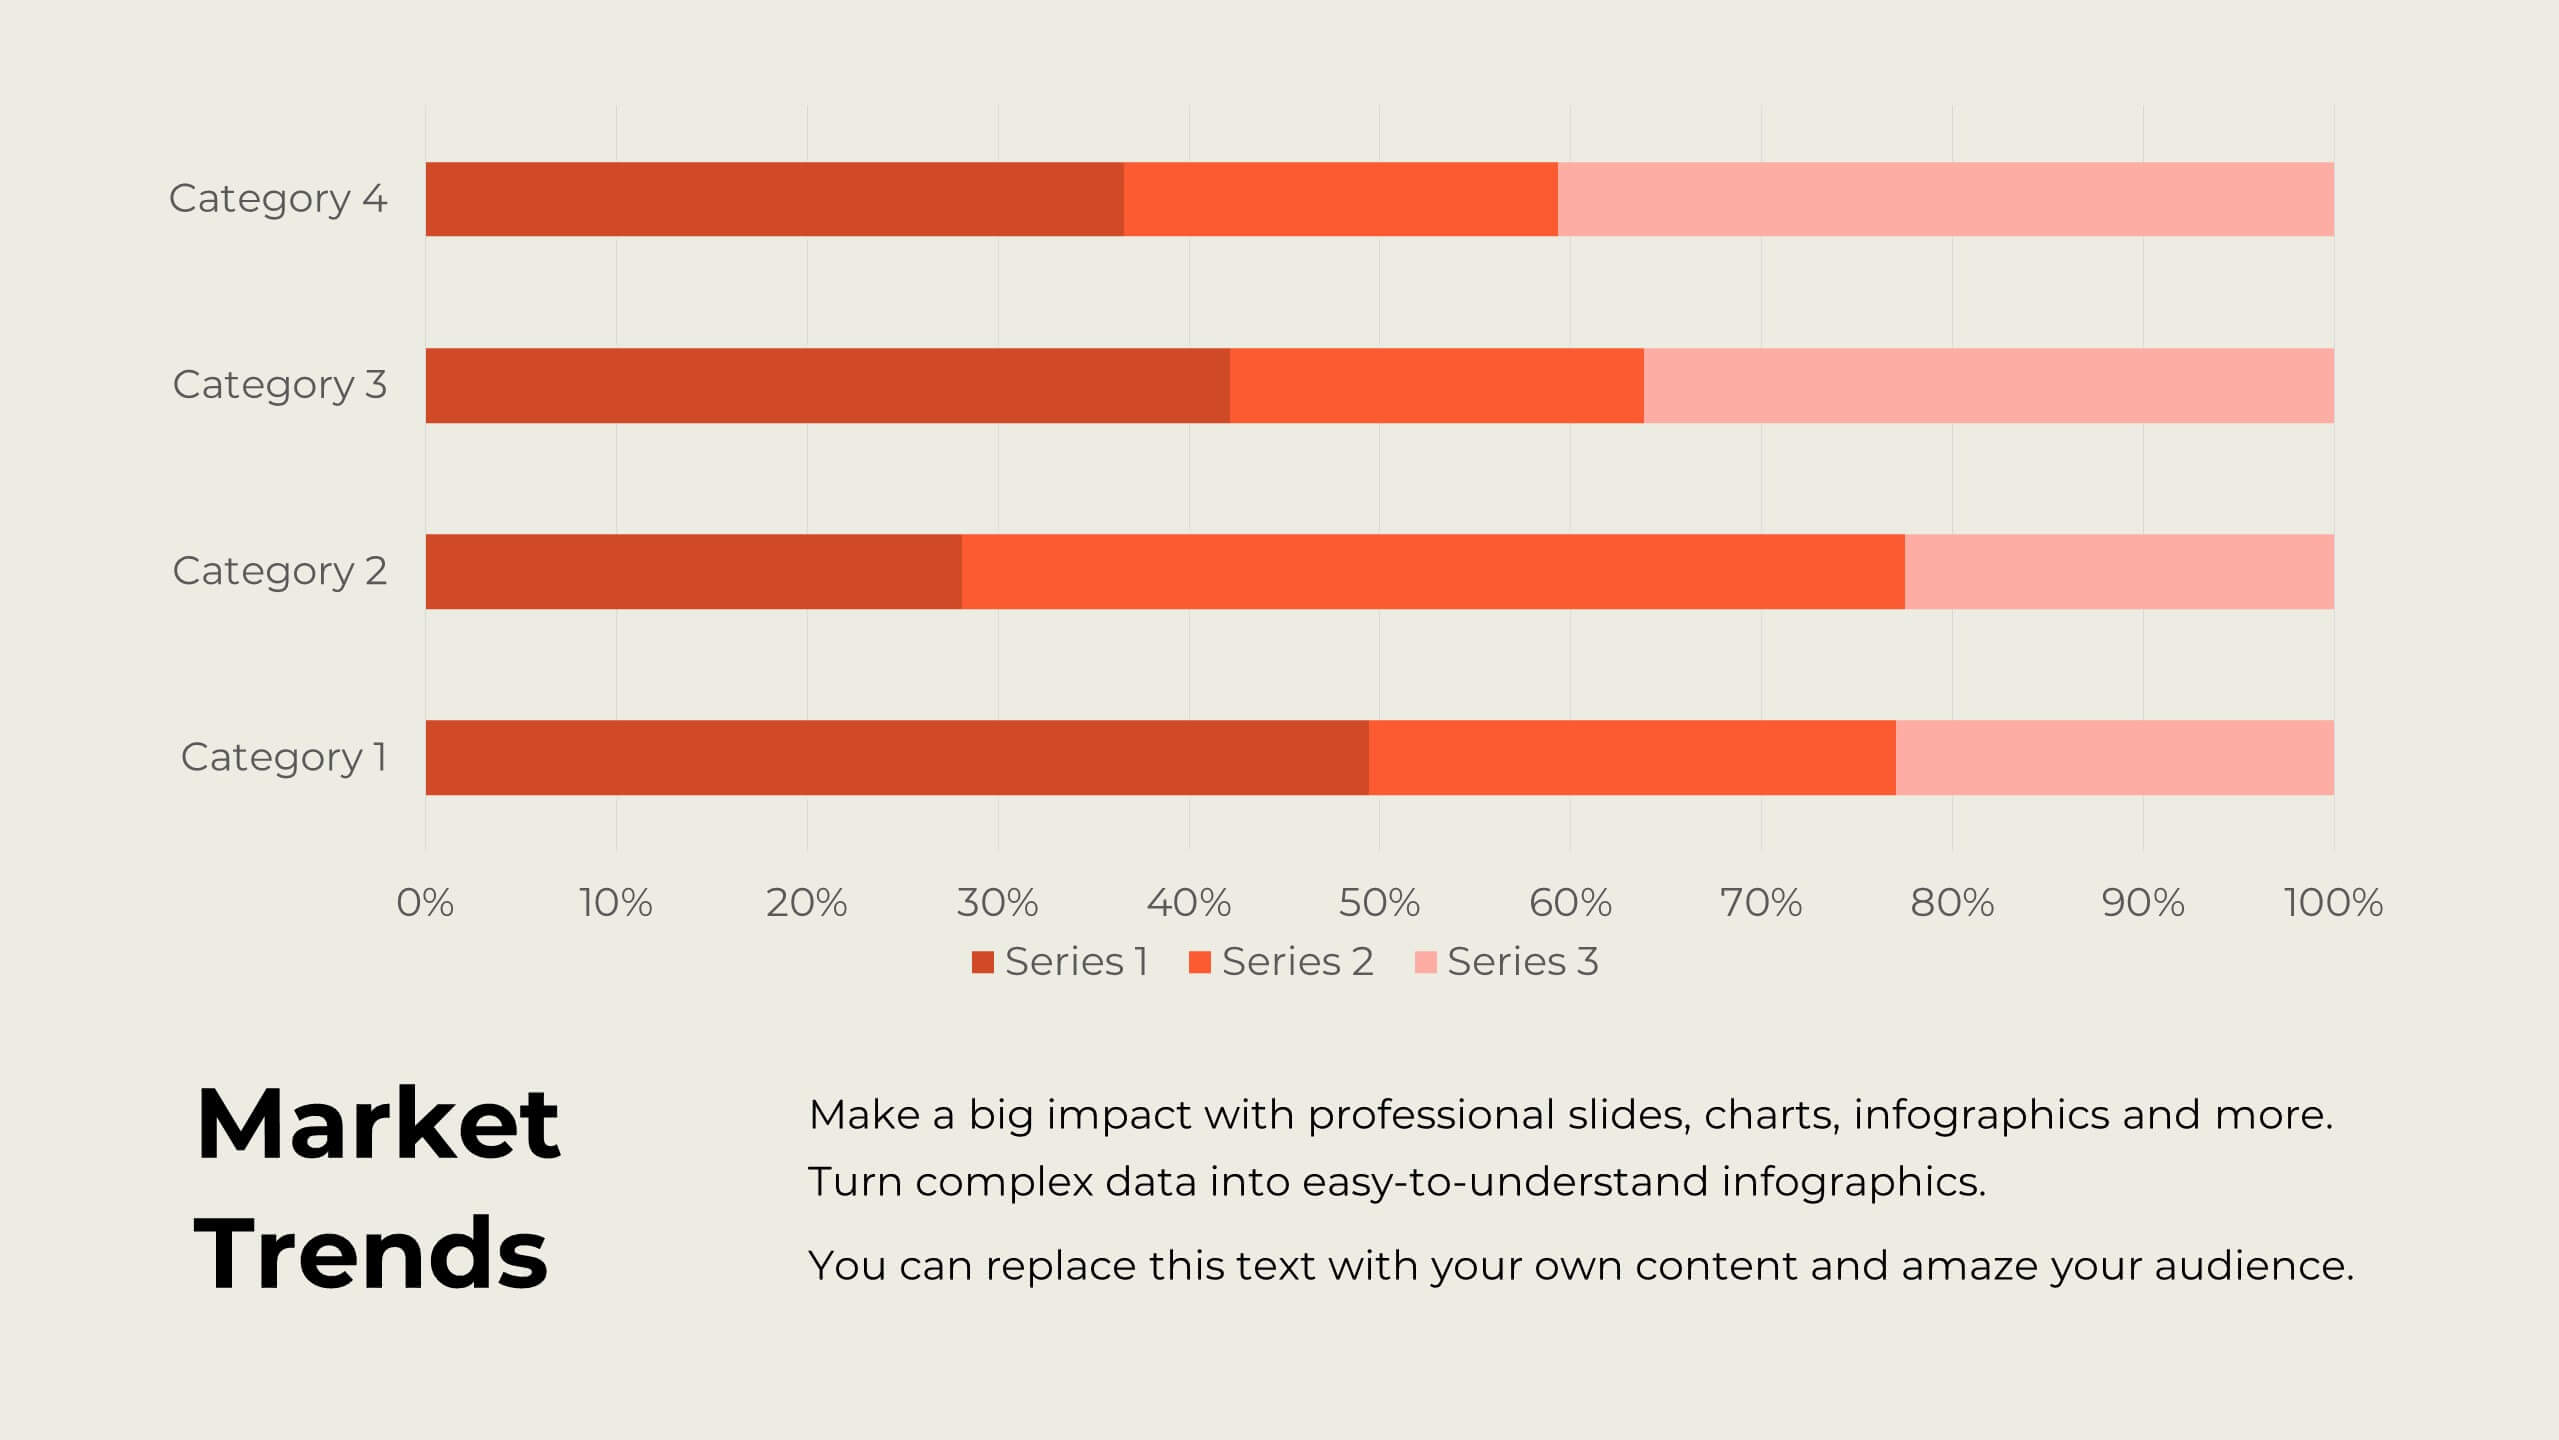
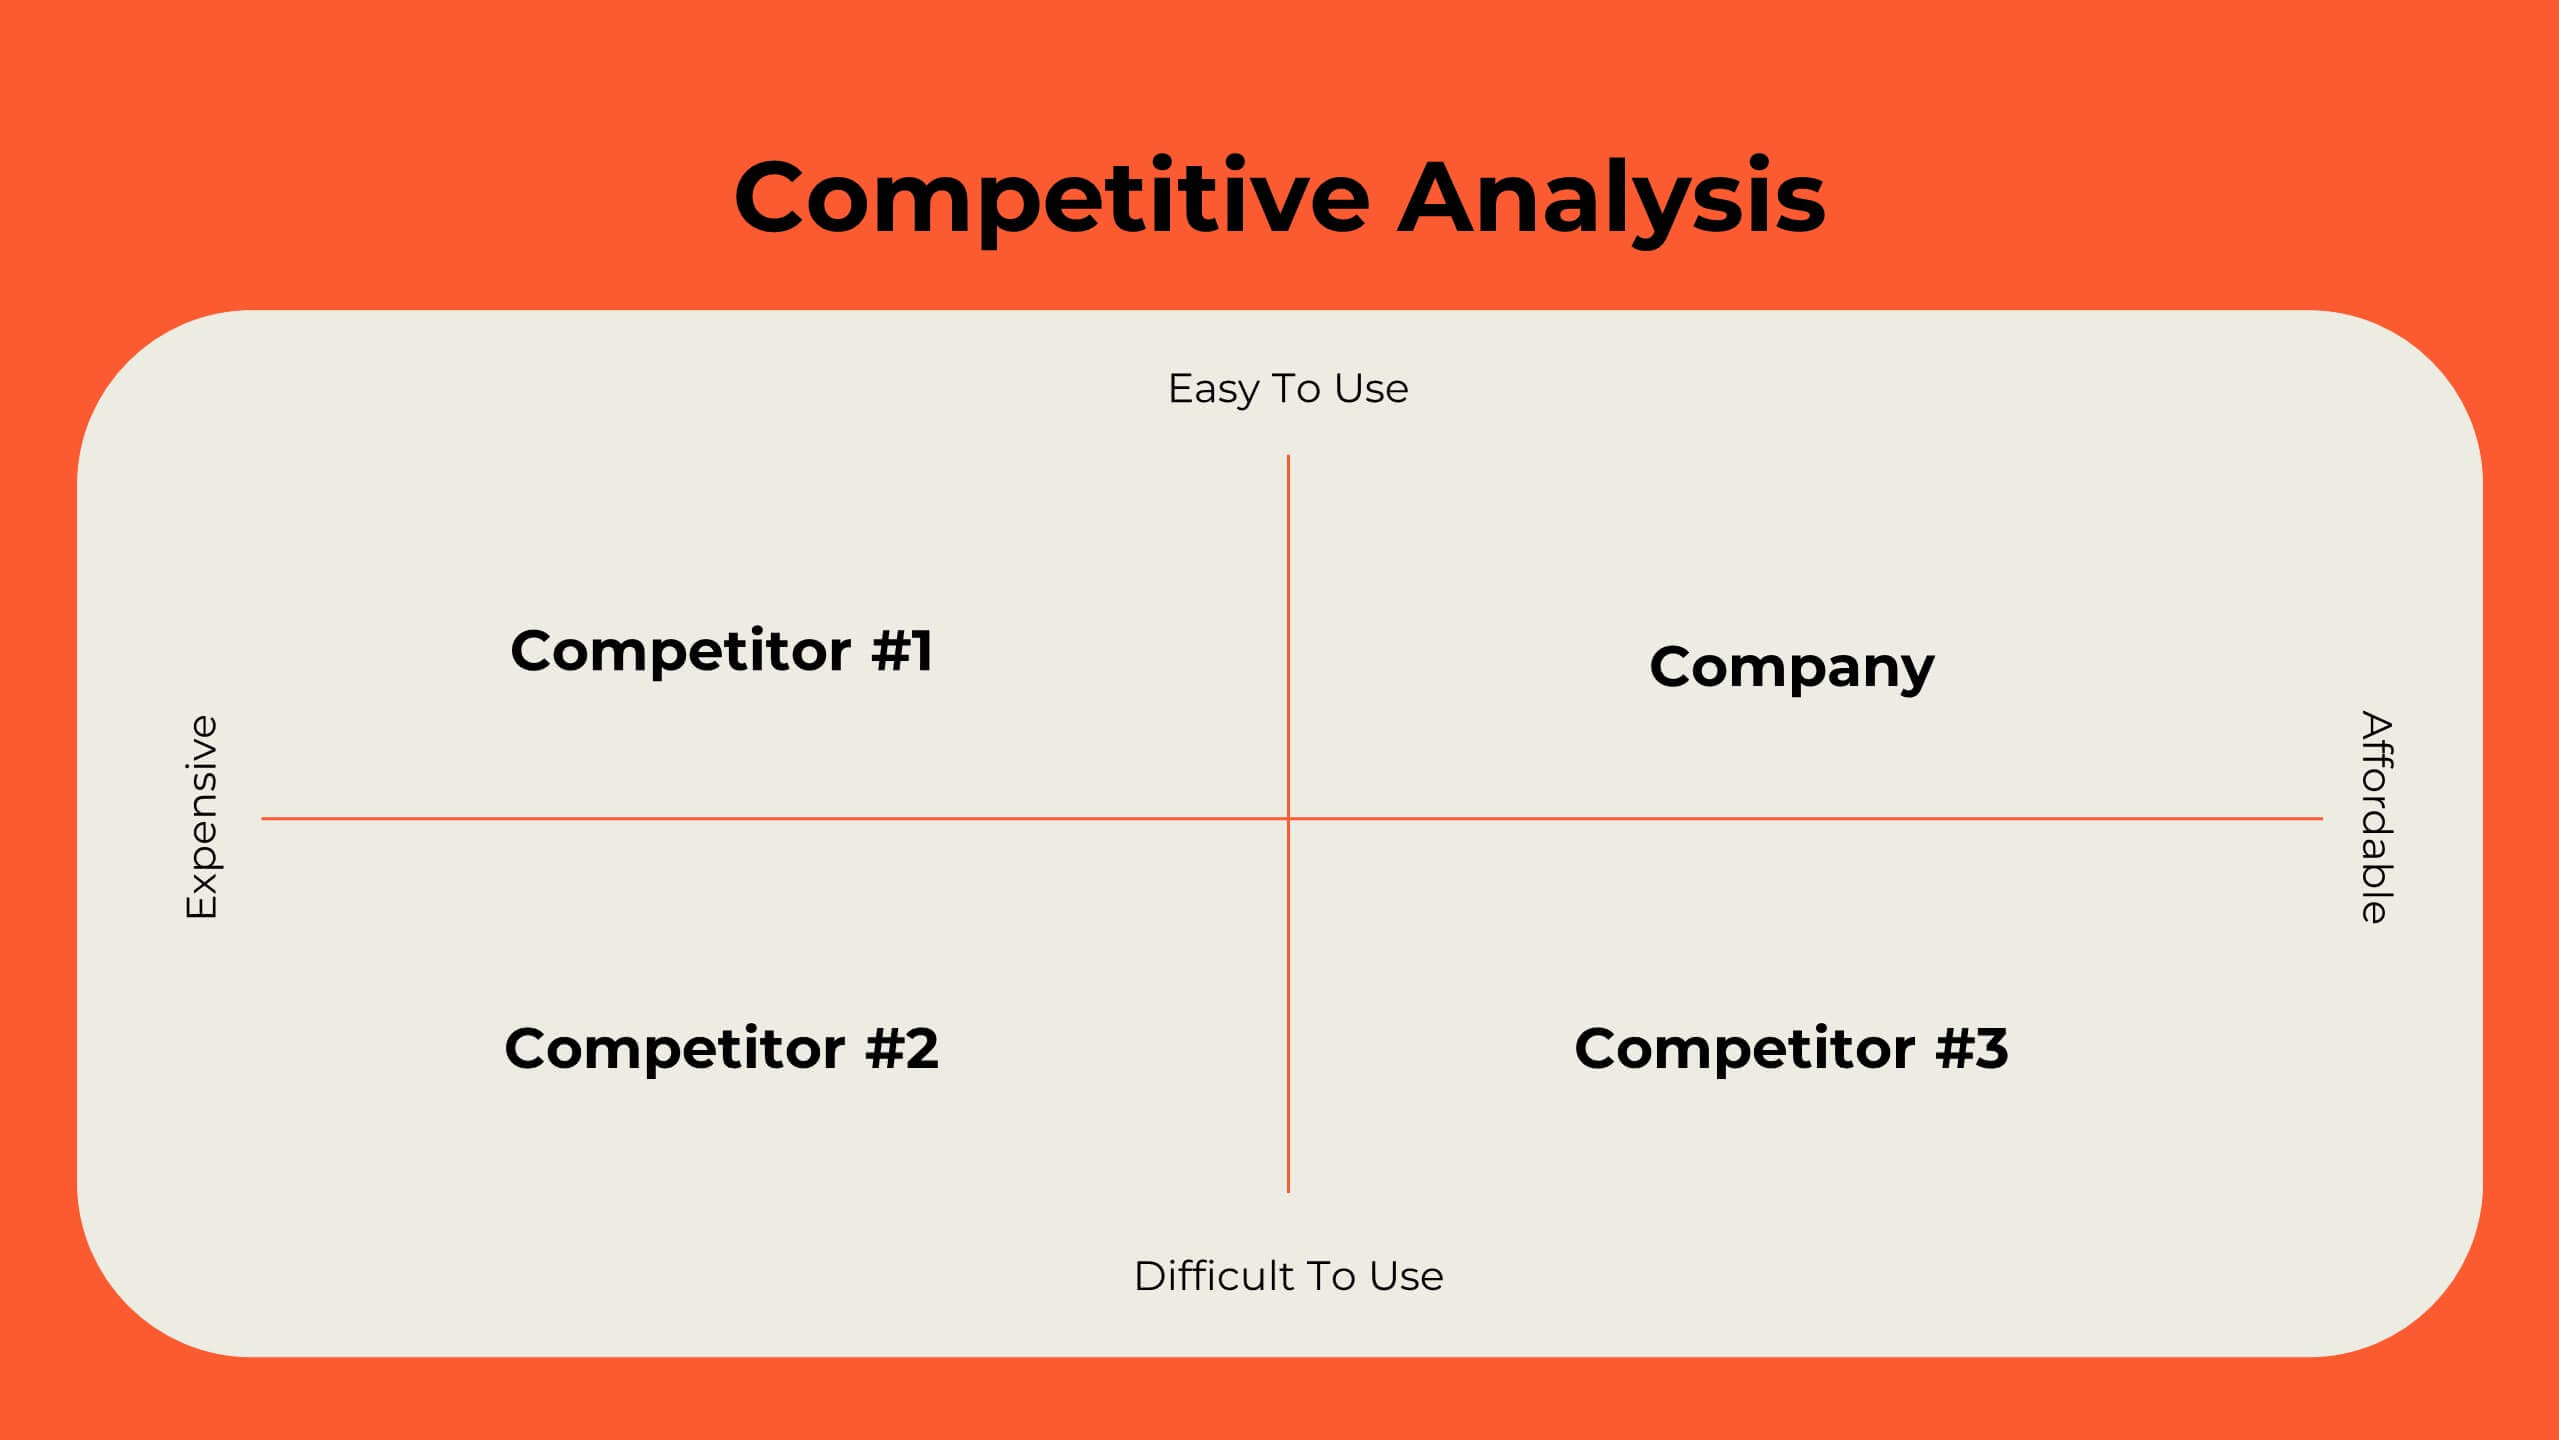
Mirage Digital Strategy Presentation
Revitalize your marketing efforts with this dynamic strategy plan template! Perfect for outlining objectives, competitive analysis, and target audience identification, it includes slides for SWOT analysis, resource allocation, and implementation plans. Engage stakeholders with vibrant visuals and comprehensive content. Compatible with PowerPoint, Keynote, and Google Slides for seamless presentations on any platform.


26 diapositivas
Hypnosia Brand Guidelines Proposal Presentation
This Brand Guidelines Proposal Template provides a sleek, professional layout to showcase key branding elements like vision, values, identity, and strategy. Perfect for businesses and agencies, it ensures brand consistency. Fully customizable and compatible with PowerPoint, Keynote, and Google Slides for seamless adaptation to your brand’s style.


5 diapositivas
Operational Planning in 5 Key Steps Presentation
Present your operational roadmap with this dynamic 5-step arrow diagram. Each line represents a strategic input streamlined toward a unified goal. Ideal for workflows, business processes, or implementation plans. Fully editable in PowerPoint, Keynote, and Google Slides—perfect for team planning, operations meetings, and project execution strategies.


2 diapositivas
Pink Ribbon Event Slide Deck Presentation
Bring awareness and compassion to your presentation with a bold ribbon design that symbolizes unity and support. Perfect for health campaigns, charity events, or educational talks, this layout helps you share key messages with clarity and impact. Fully compatible with PowerPoint, Keynote, and Google Slides for easy customization.


5 diapositivas
Product Development and Innovation Presentation
Showcase your Product Development and Innovation process with this structured and visually appealing infographic. Designed with interconnected gears and a step-by-step approach, this template is ideal for illustrating stages of product design, research, and launch. Fully customizable and compatible with PowerPoint, Keynote, and Google Slides.