


Características


¿Tienes alguna pregunta?
Recomendar


6 diapositivas
Funding and Return on Investment Overview Presentation
Showcase your funding strategy and ROI journey with this growth-themed infographic. The plant-inspired design visually represents financial progress across six stages, making it perfect for startups, business proposals, or investor updates. Fully editable in PowerPoint, Google Slides, and Keynote for seamless customization and a polished, professional presentation experience.


26 diapositivas
Kasra Presentation Template
Fitness is an important part of good health. It improves your quality of life and may keep you from getting sick by helping to strengthen your immune system, prevent heart disease and reduce the risk of diabetes and much more. The Kasra template will help you deliver your message with an impact. Whether you're selling your product, promoting an event, or creating a landing page, this template features the necessary components to capture your audience's attention. This provides you with a powerful platform to engage others, illustrate key messages and demonstrate deep insight into an issue.


26 diapositivas
Arana Presentation Template
Arana is a minimal and stylish template to create stunning presentations. This template is perfect for training your business staff or team on how to use various services or products. It's easy to use, resulting in high quality presentations that look great to your clients or customers. Its slide designs can be used with each other to make more elaborate presentations complete with charts, images and text boxes. Arana simple yet stylish design makes it easy for anyone to use. With the large amount of information included, your presentation will look lighter, appealing, and easy to understand.


6 diapositivas
Business Network Diagram Presentation
Bring your digital ecosystem to life with this modern presentation design. Ideal for showcasing system connections, IT workflows, or organizational networks, it helps visualize how key components interact seamlessly. Clean, structured, and fully customizable—compatible with PowerPoint, Keynote, and Google Slides for a professional and cohesive presentation every time.


6 diapositivas
Porter's Five Forces Strategy Presentation
Give your competitive analysis a bold, intuitive flow with a clean layout that visually breaks down each force in a simple, strategic way. This presentation helps you highlight market pressures, evaluate risks, and support smarter decision-making with clarity and confidence. Fully editable and compatible with PowerPoint, Keynote, and Google Slides.


4 diapositivas
Business Challenge Overview Presentation
Kick off your message with a dynamic overview that makes complex challenges feel clear, visual, and manageable. This presentation helps you break down obstacles, compare factors, and guide teams toward smarter decisions with an organized, flowing layout. Fully compatible with PowerPoint, Keynote, and Google Slides.


21 diapositivas
Runewood Marketing Proposal Template Presentation
The Marketing Proposal Presentation Template provides 21 slides covering core aspects like market presence, growth strategies, and financial highlights. Perfect for agencies and businesses to showcase their marketing strategies effectively. Fully customizable and compatible with PowerPoint, Keynote, and Google Slides.


20 diapositivas
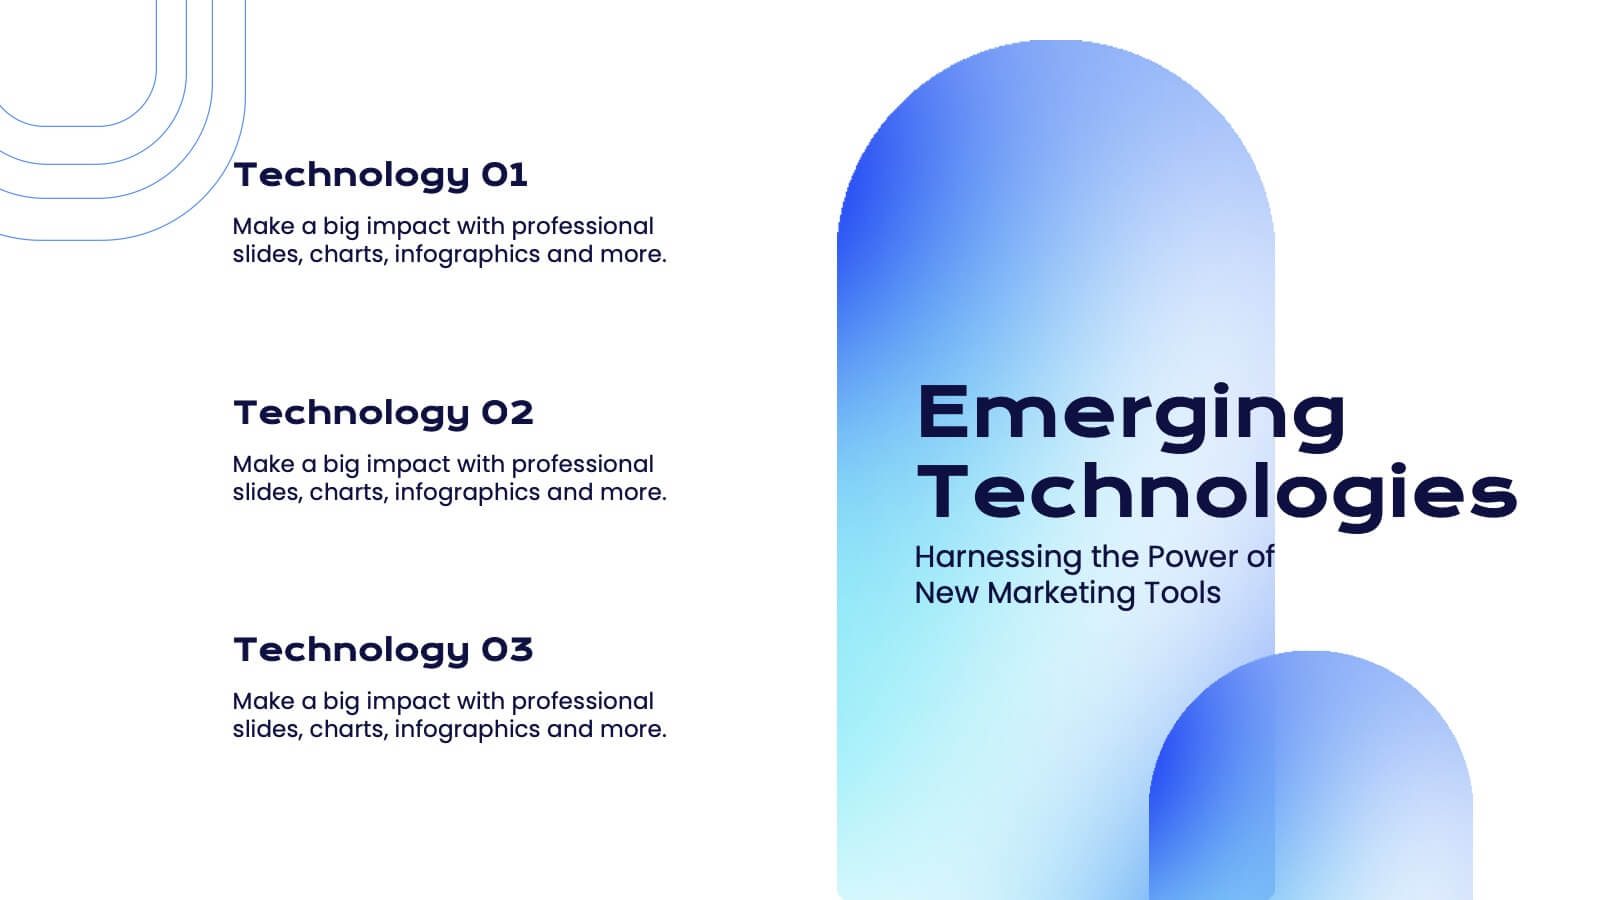
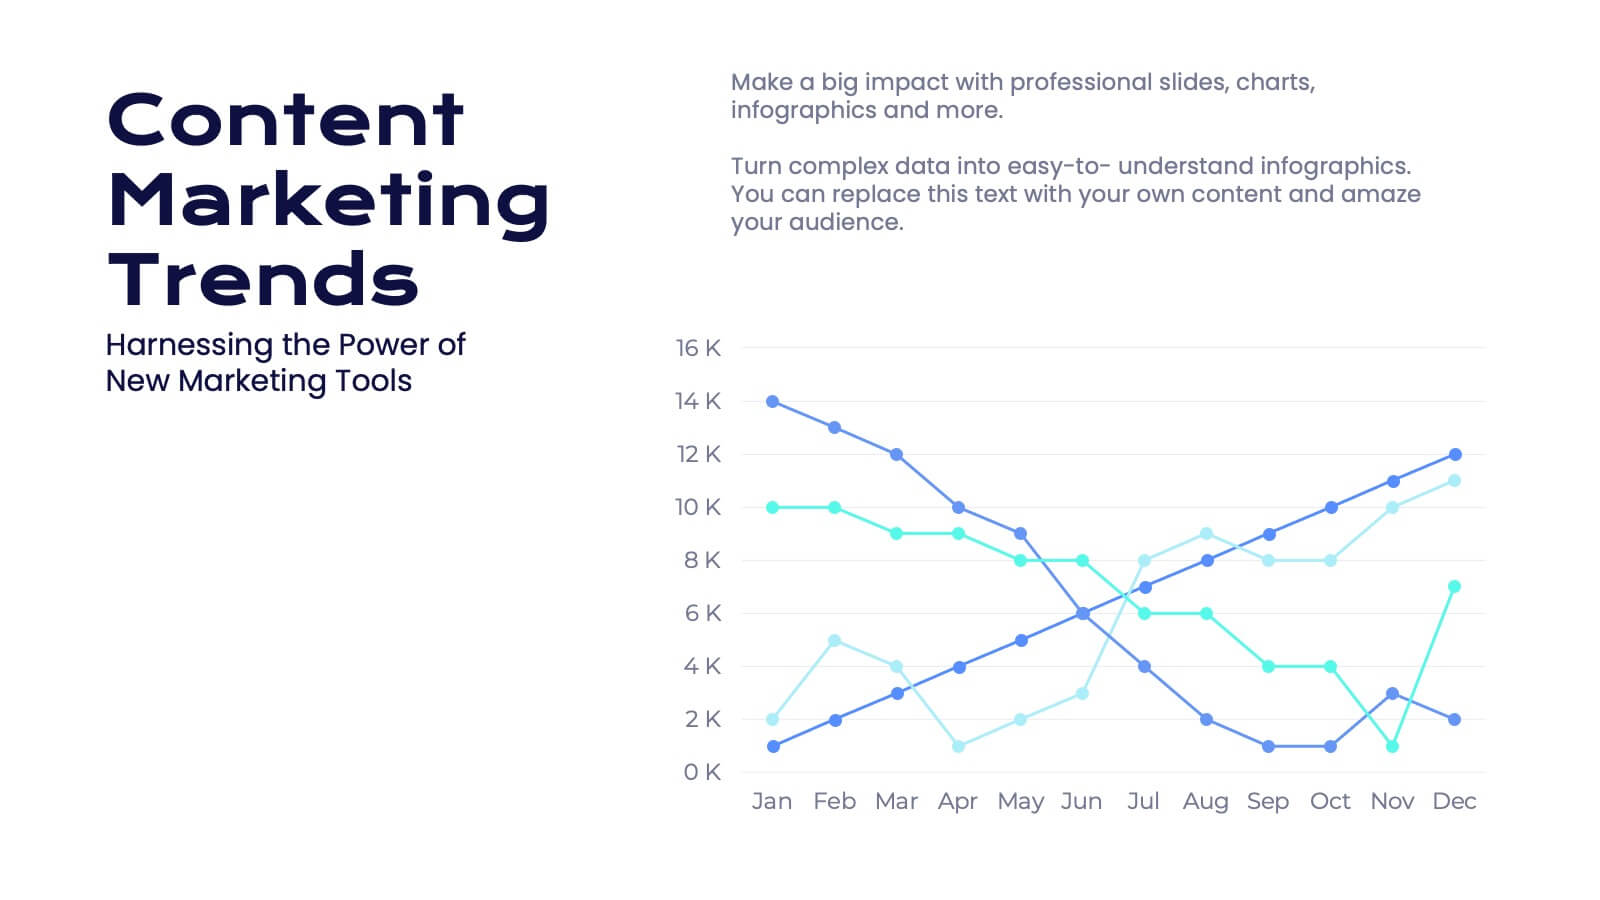
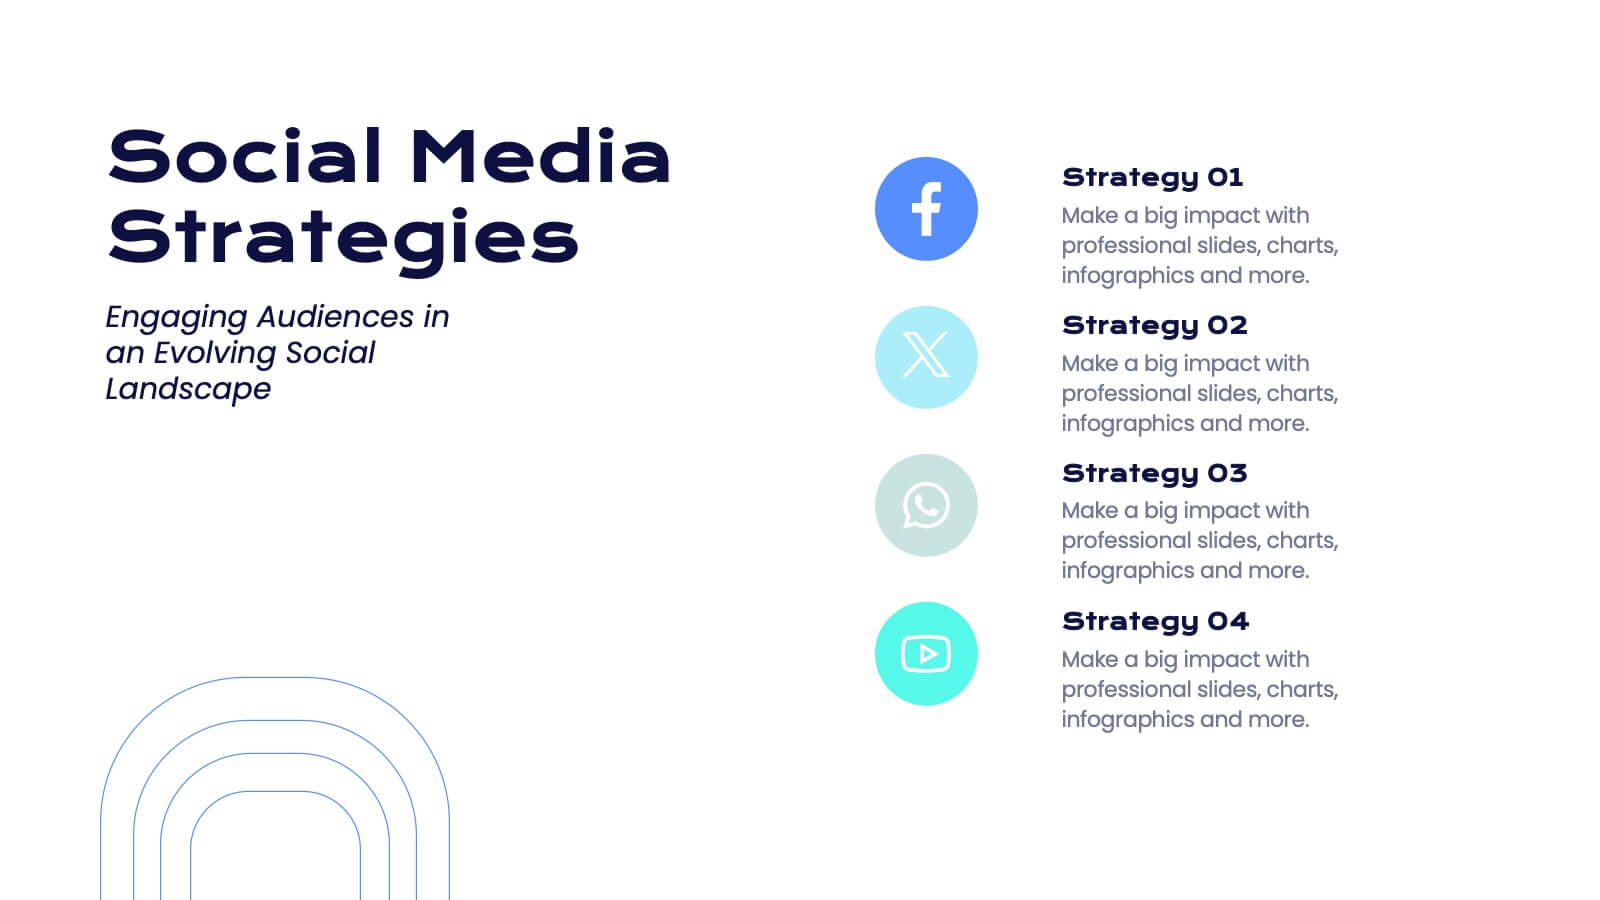
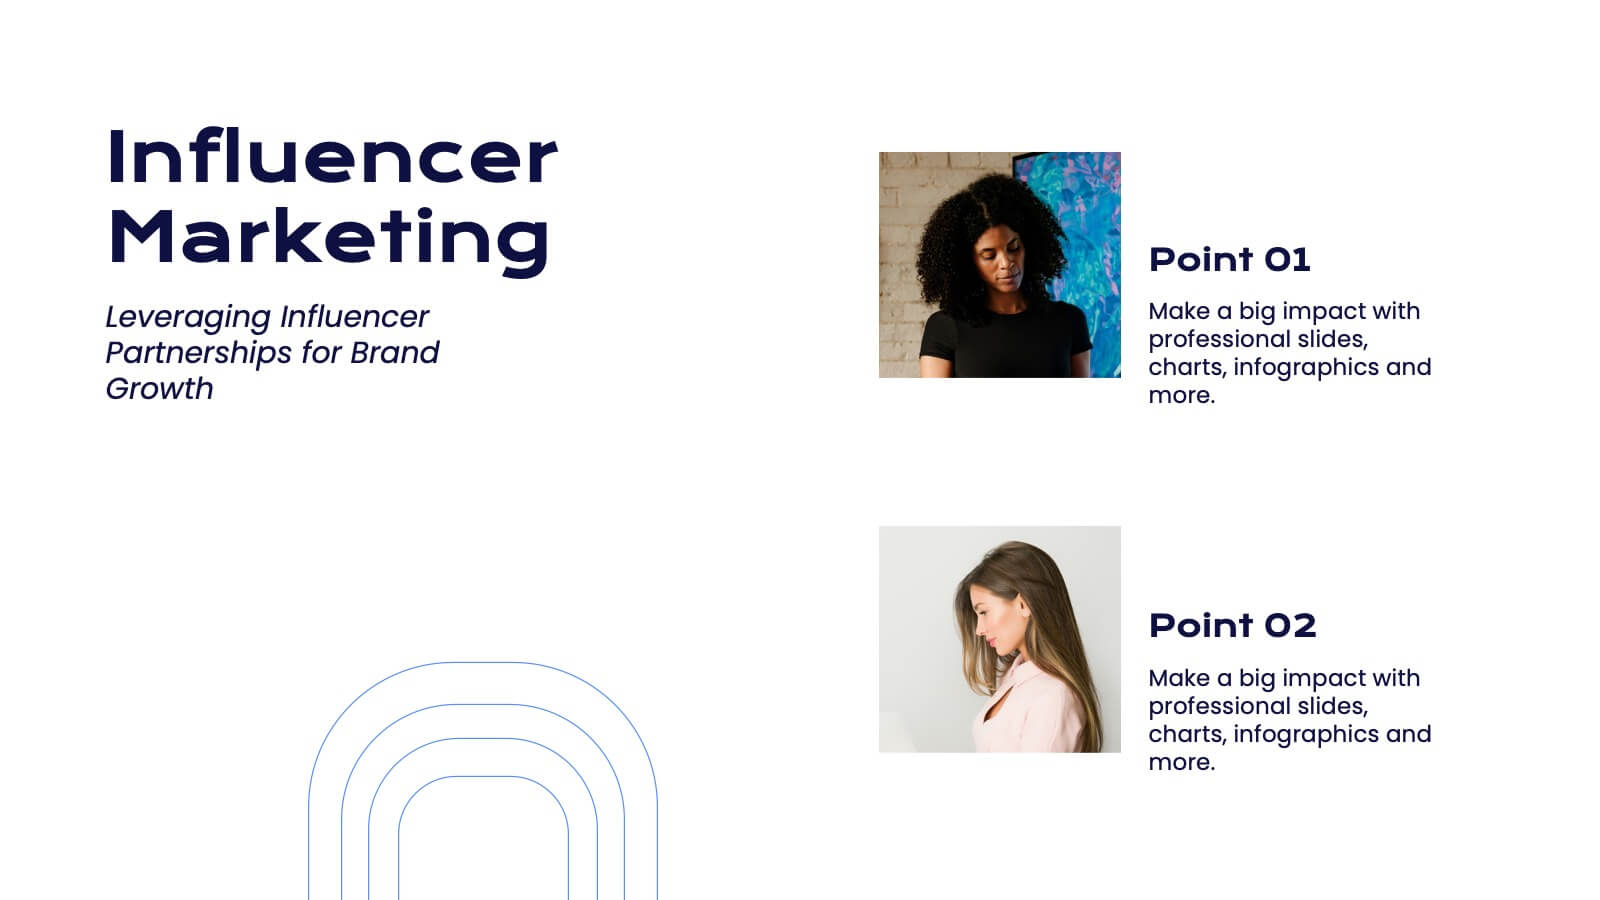
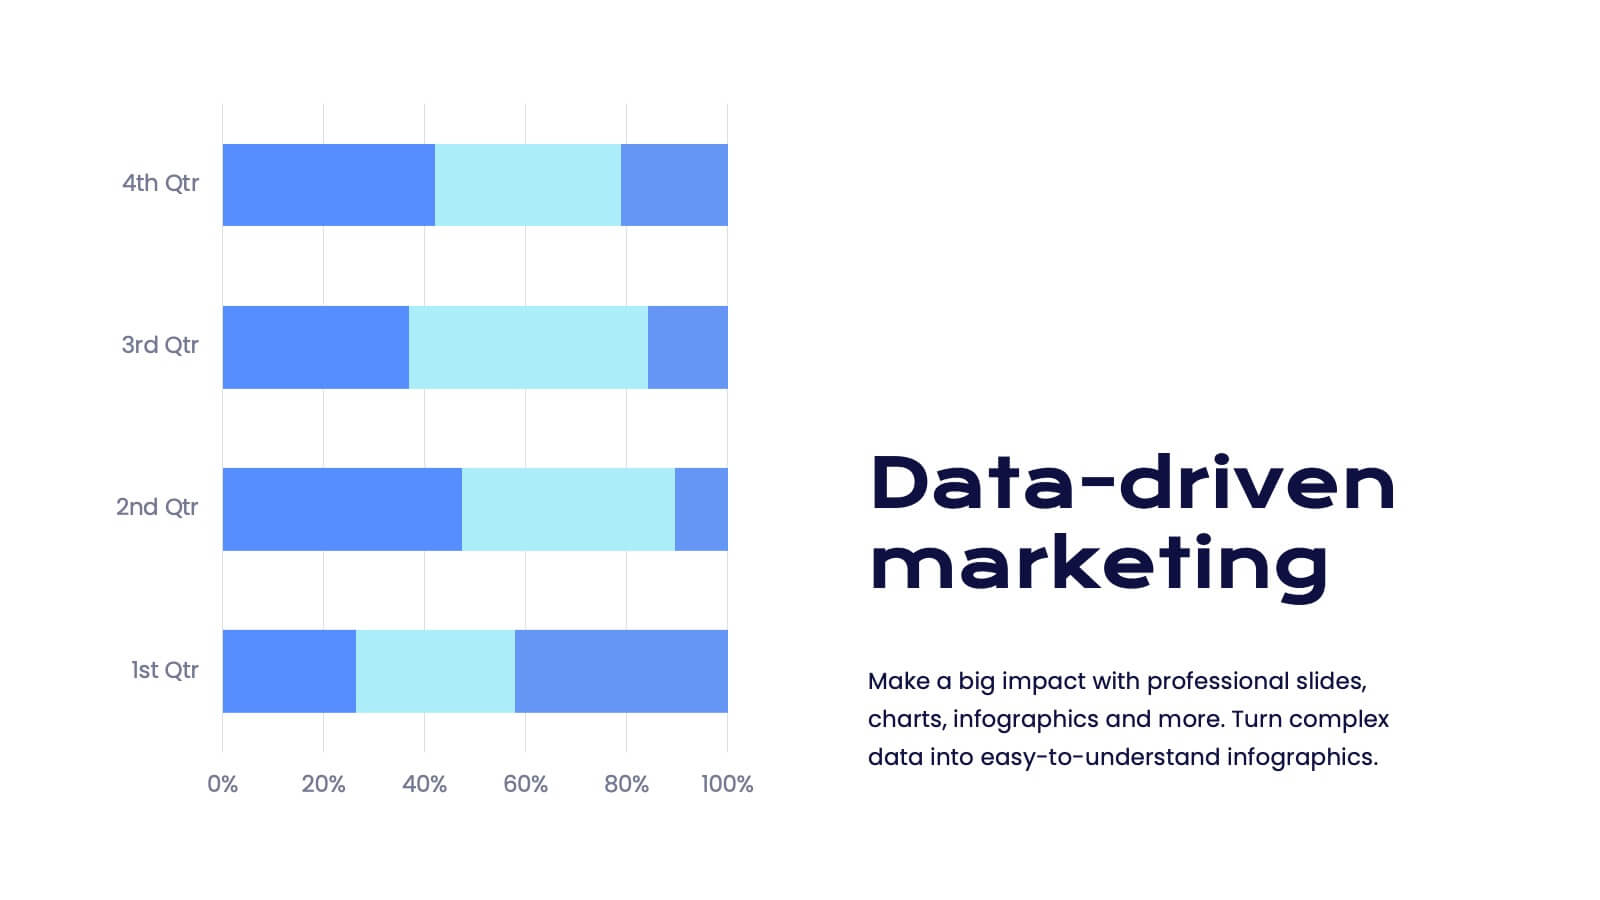
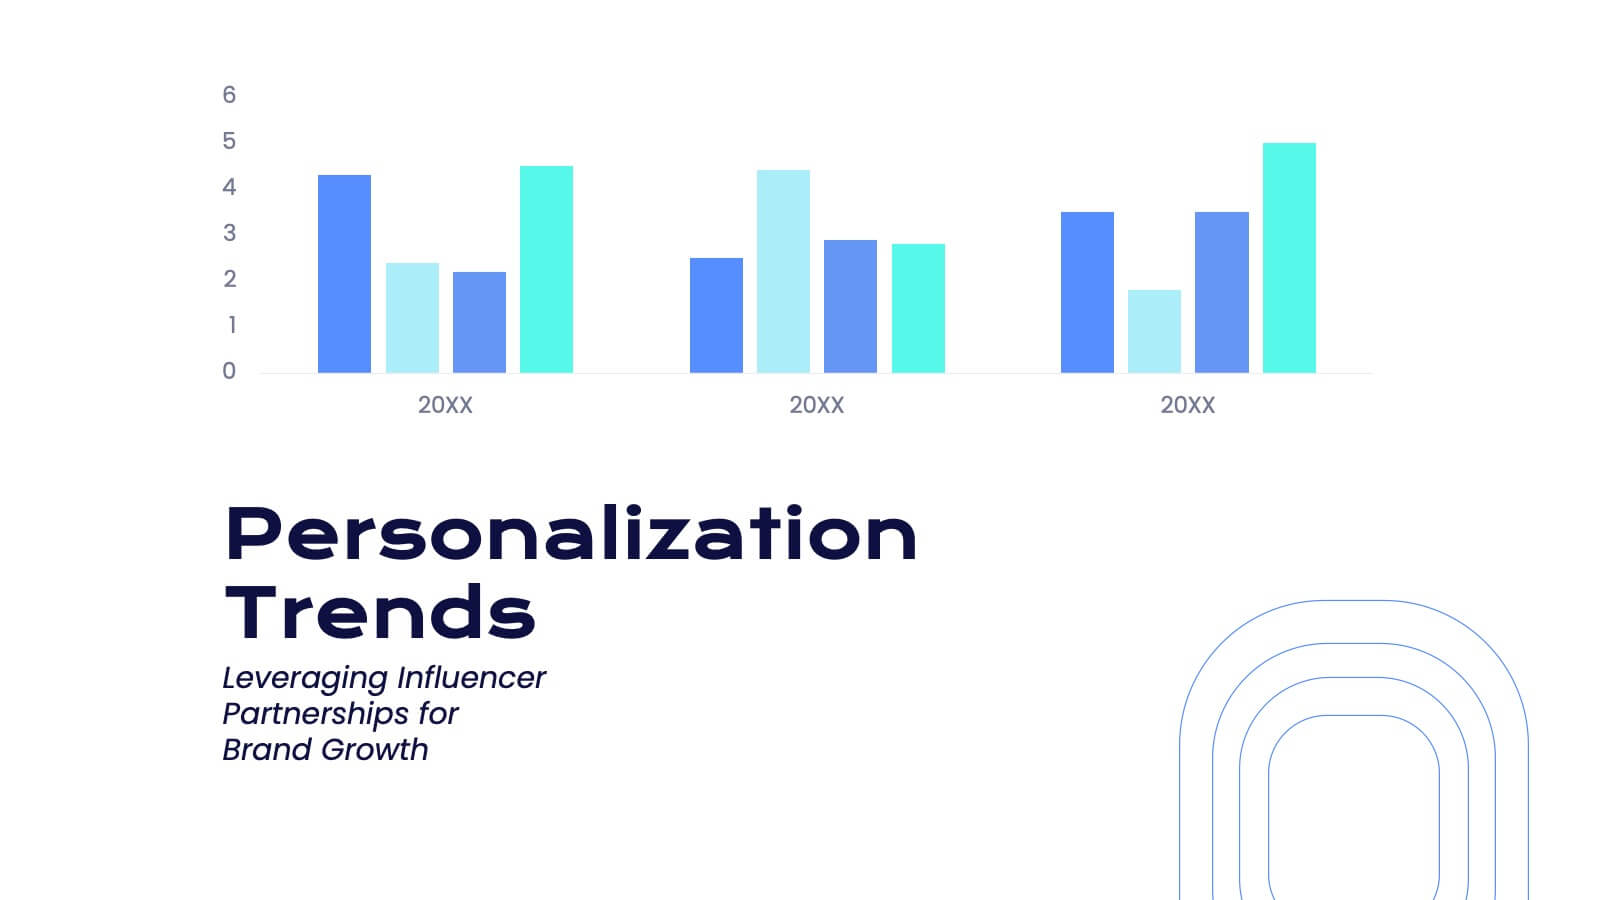
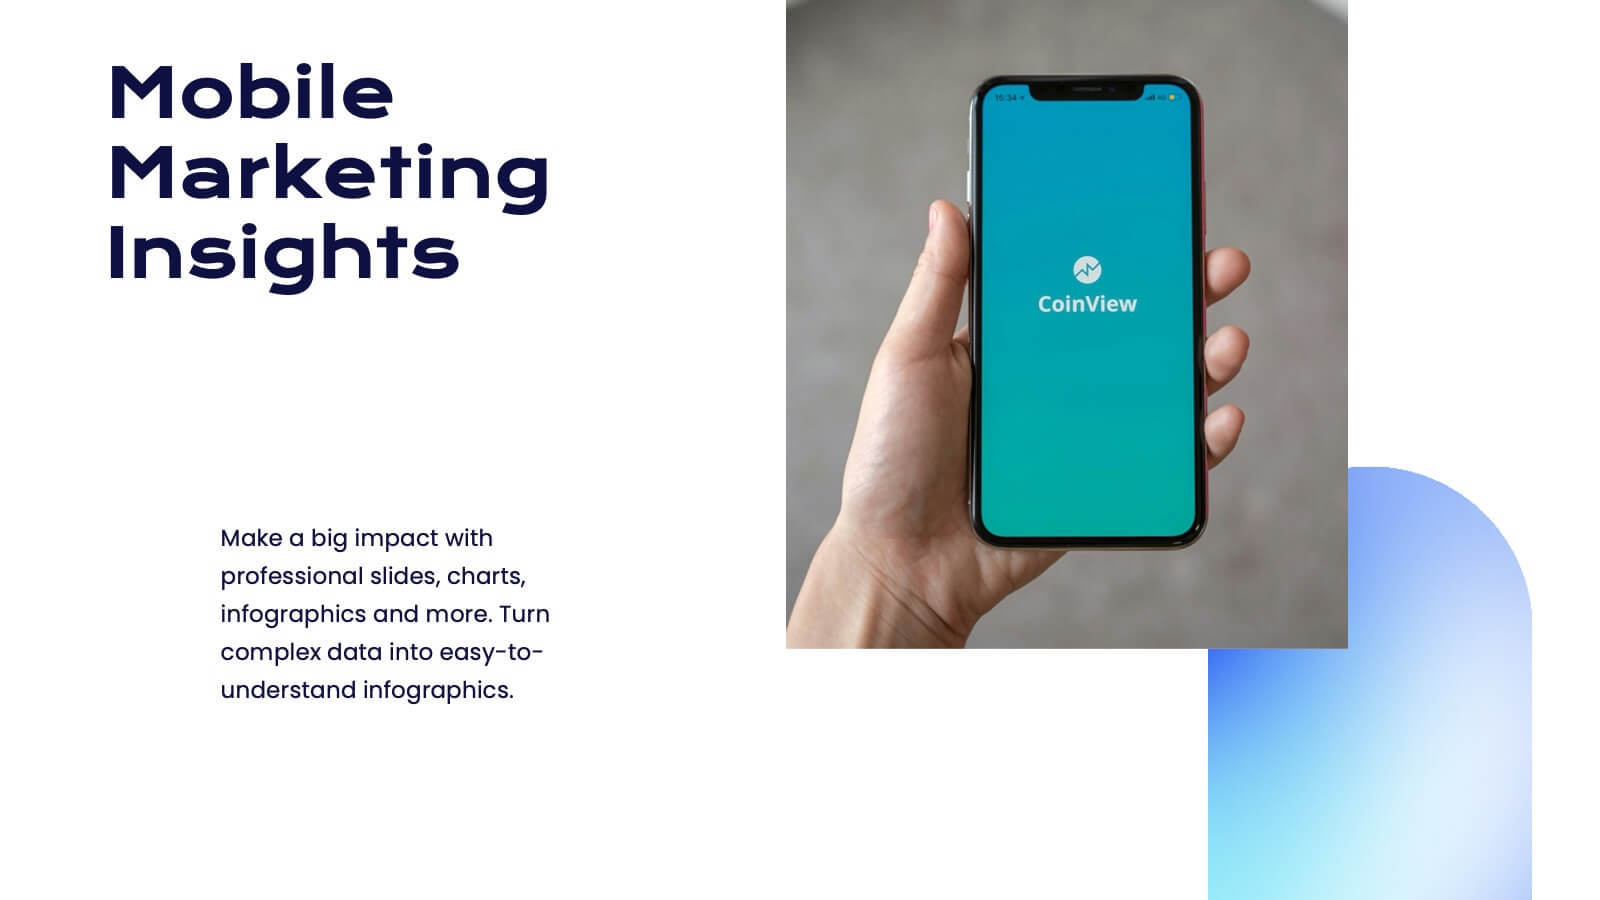
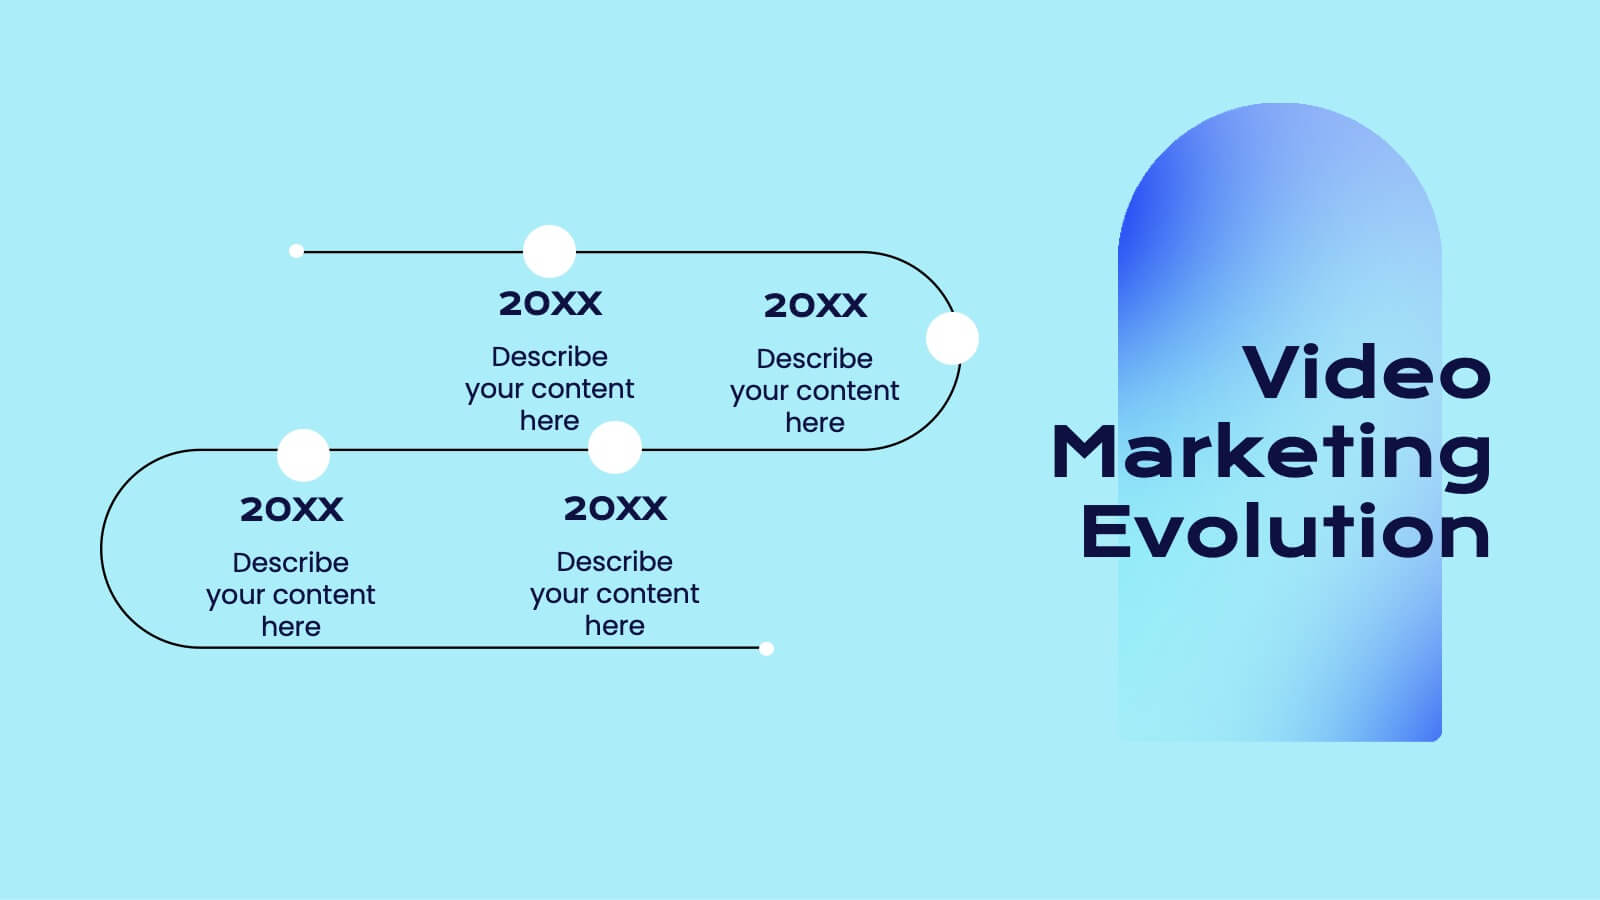
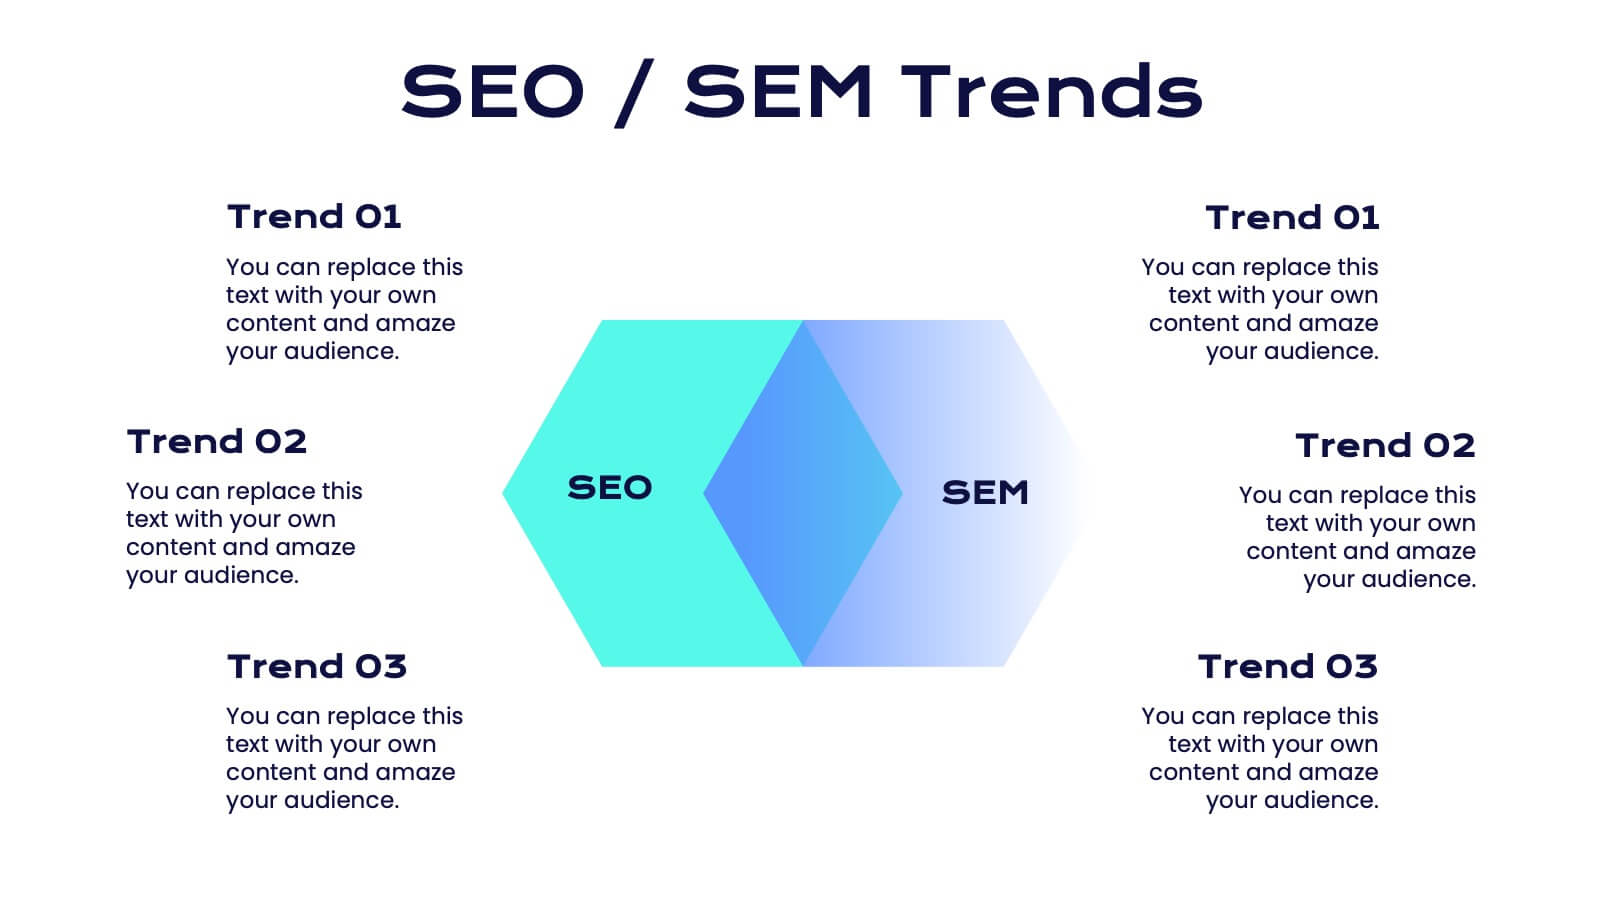
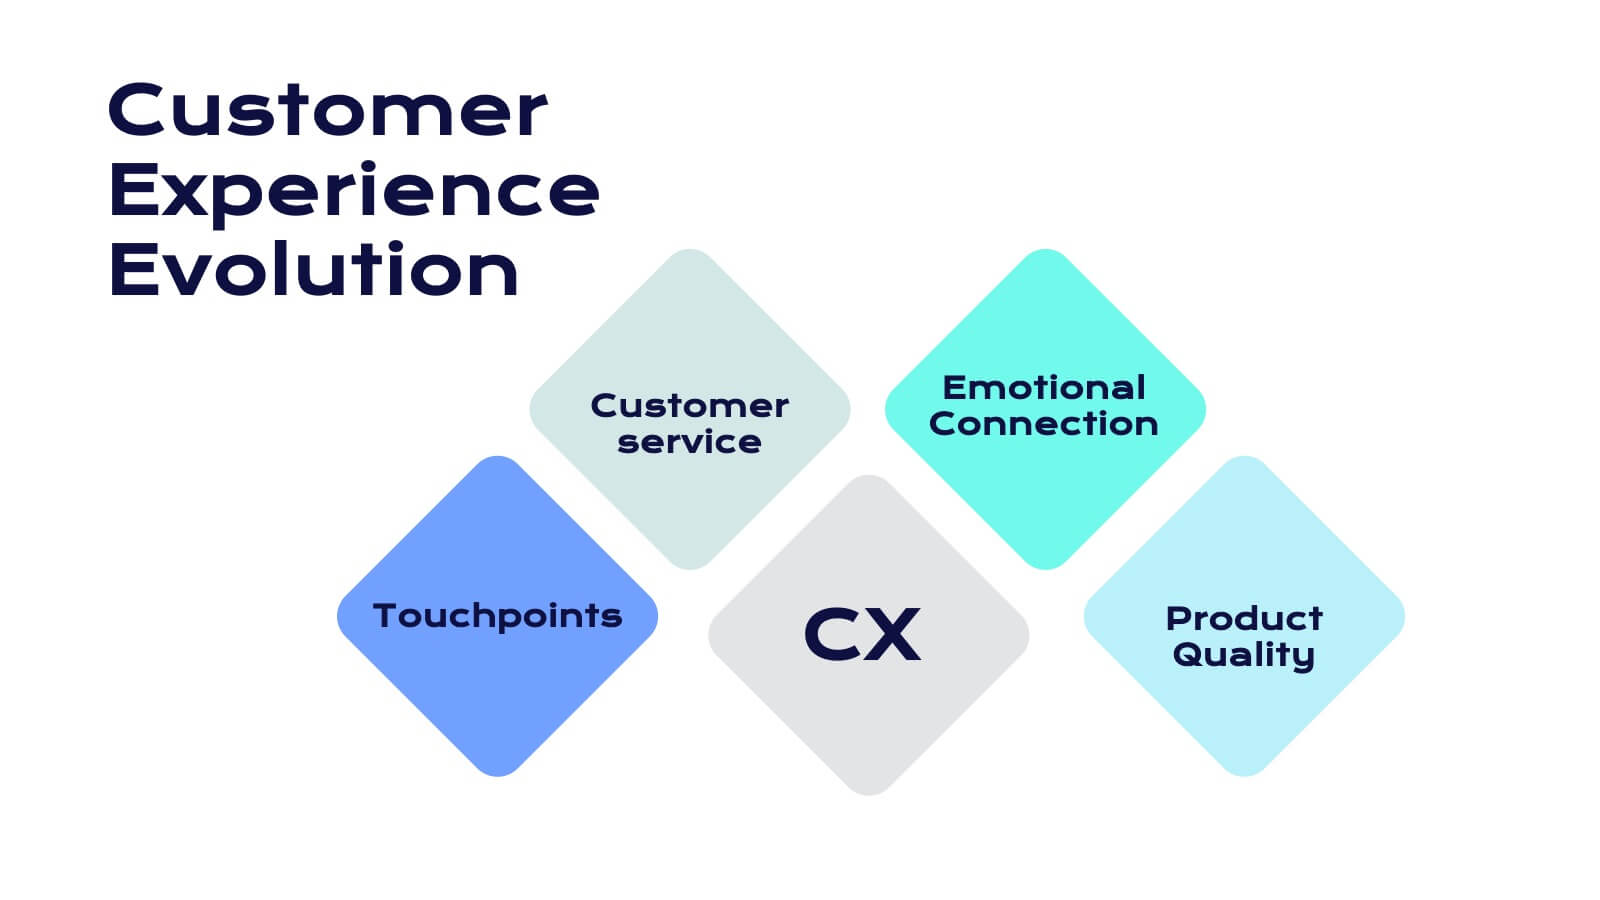
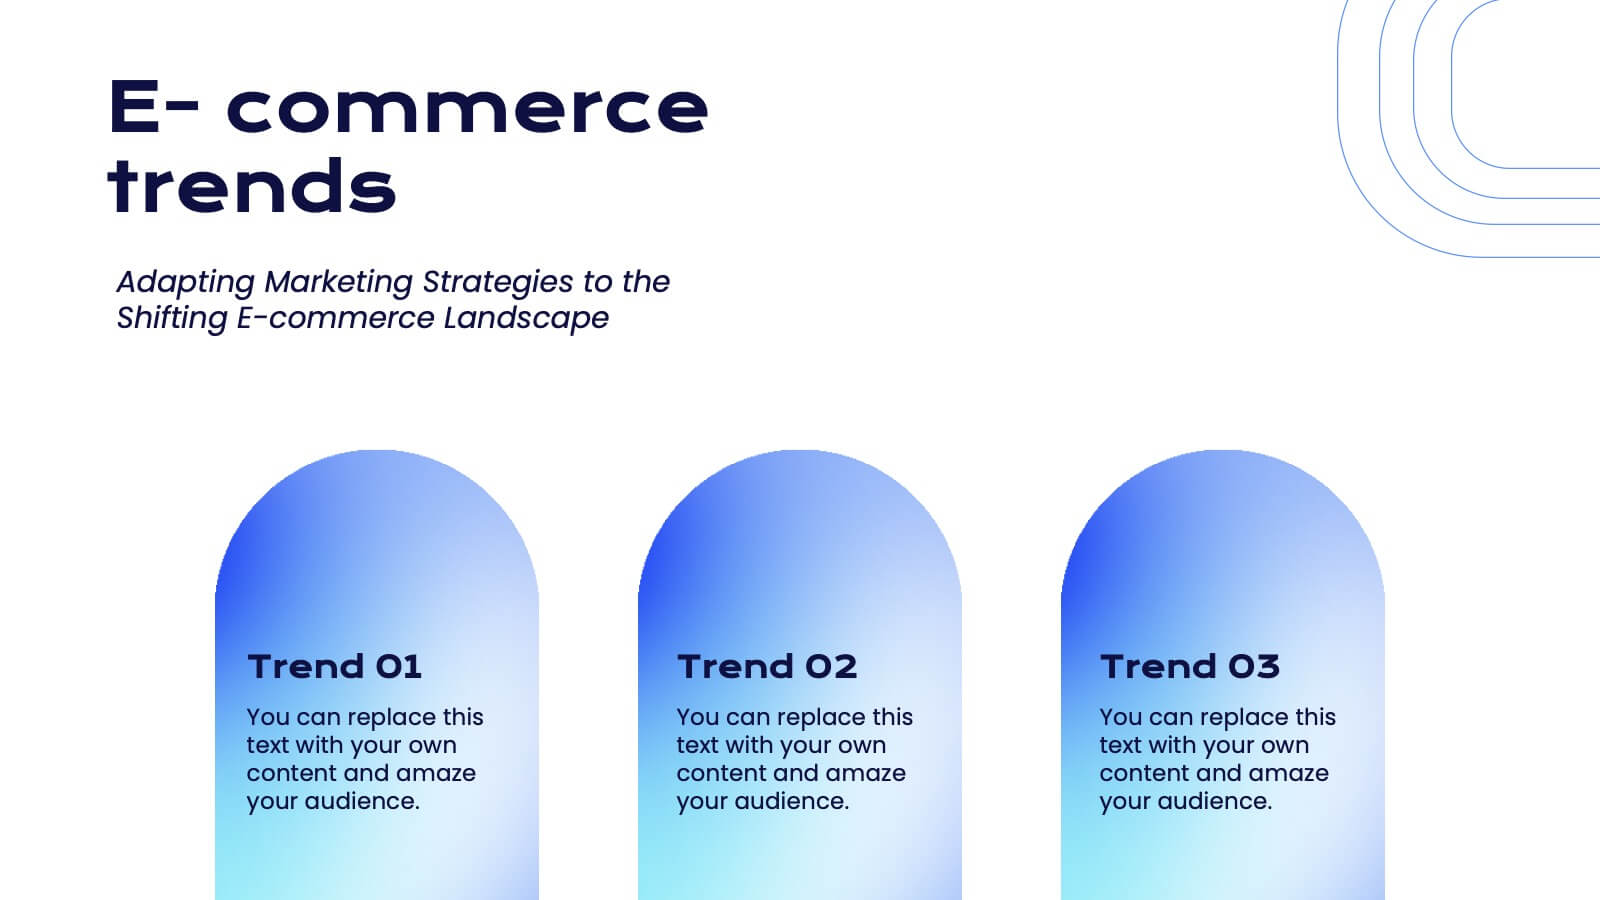
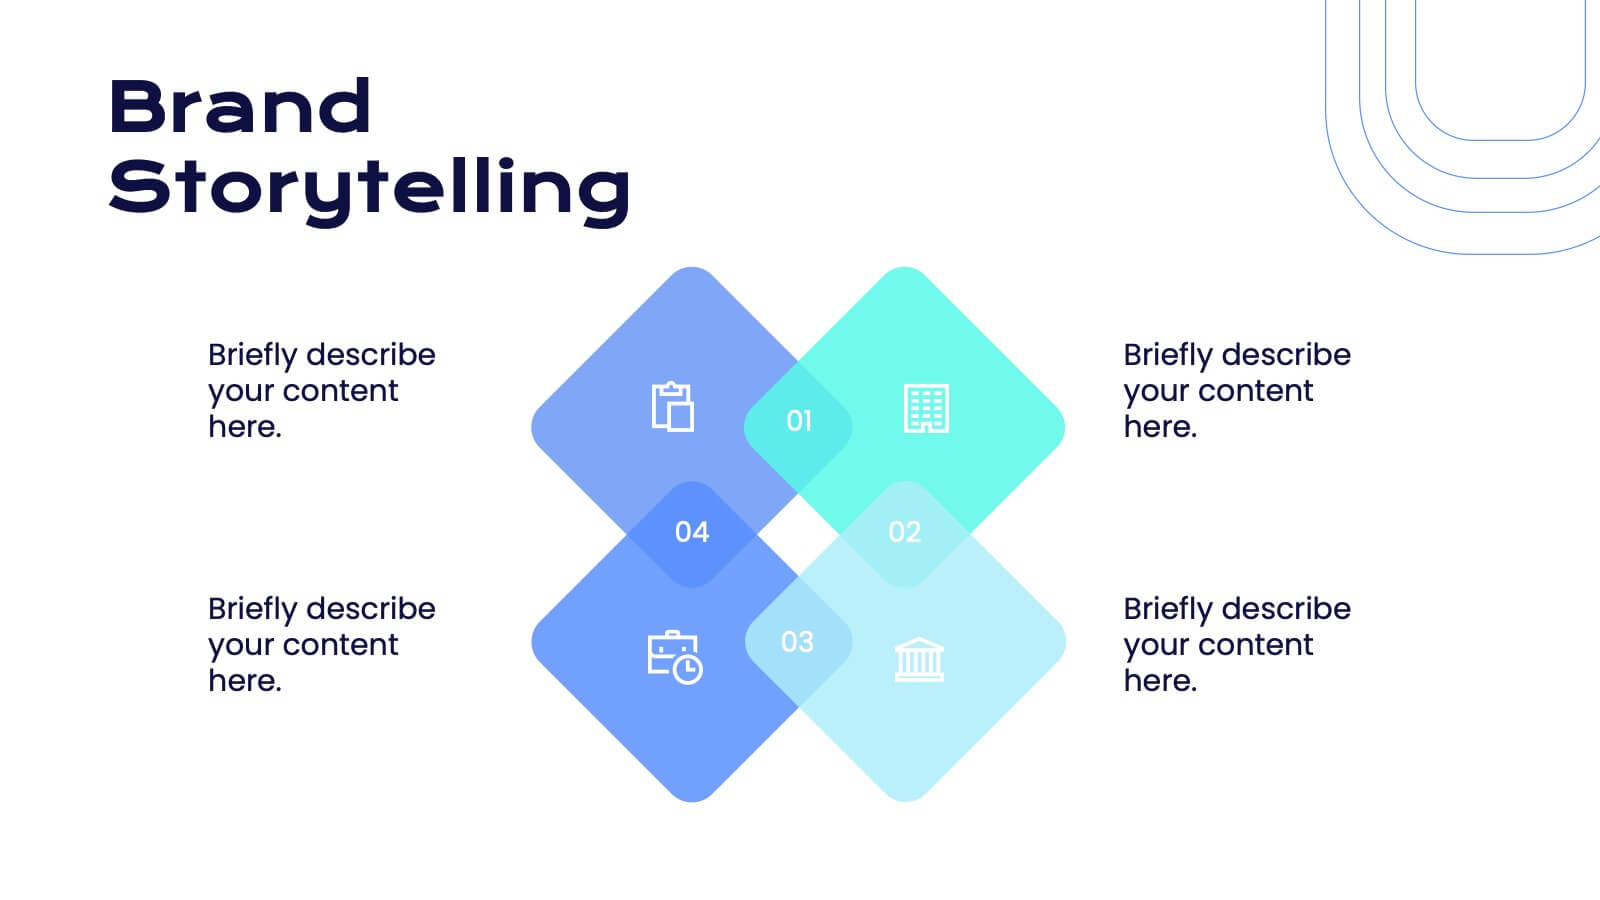
Trend Report Presentation
Navigate the latest market developments with this Trend Report presentation template. Perfect for displaying current marketing trends, consumer behavior, and future predictions, this vibrant template includes slides for social media strategies, influencer marketing, and more. Fully compatible with PowerPoint, Keynote, and Google Slides, it’s ideal for professionals looking to stay ahead in dynamic industries.


10 diapositivas
Marketing Wheels Strategy Presentation
Turn your marketing process into a powerful visual story with this dynamic circular design. Each stage connects seamlessly to highlight planning, execution, and performance insights. Perfect for illustrating campaigns, workflows, or business strategies. Fully customizable and compatible with PowerPoint, Keynote, and Google Slides for effortless editing and presentation.


6 diapositivas
School Goals and Administration Presentation
Visualize key academic priorities with this notebook-style layout, perfect for school administrators and teachers. Featuring colorful pushpin markers and a two-page spread, this template is great for outlining goals, responsibilities, or class guidelines. Fully editable in PowerPoint, Keynote, and Google Slides for customized, classroom-ready presentations.


5 diapositivas
Strategic Decision-Making Techniques Presentation
Communicate key business insights with clarity using this structured four-step layout. Each segment is aligned with an icon and space for concise text, making it ideal for presenting executive strategies, project evaluations, or decision pathways. The centered character adds a professional and engaging touch. Fully customizable in PowerPoint, Keynote, and Google Slides.


10 diapositivas
Financial Investment Strategy Presentation
Bring your financial ideas together with a clean, puzzle-style layout that instantly makes complex strategies feel organized and actionable. This presentation helps you explain key components, compare performance drivers, and present investment plans with clarity and confidence. Easy to edit and fully compatible with PowerPoint, Keynote, and Google Slides.

20 diapositivas
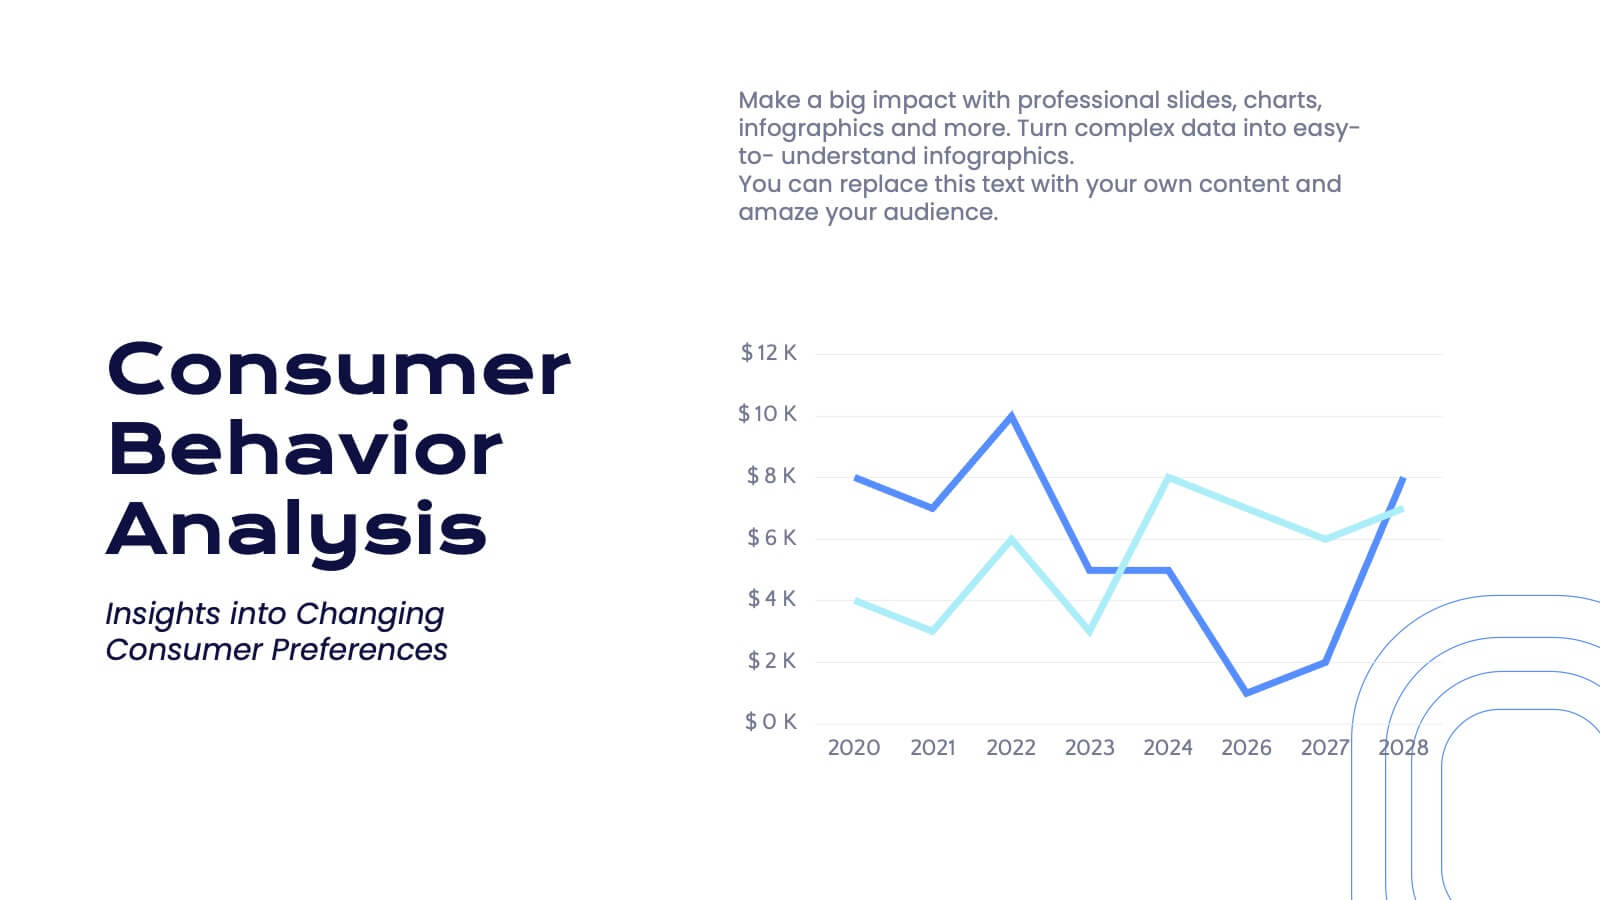
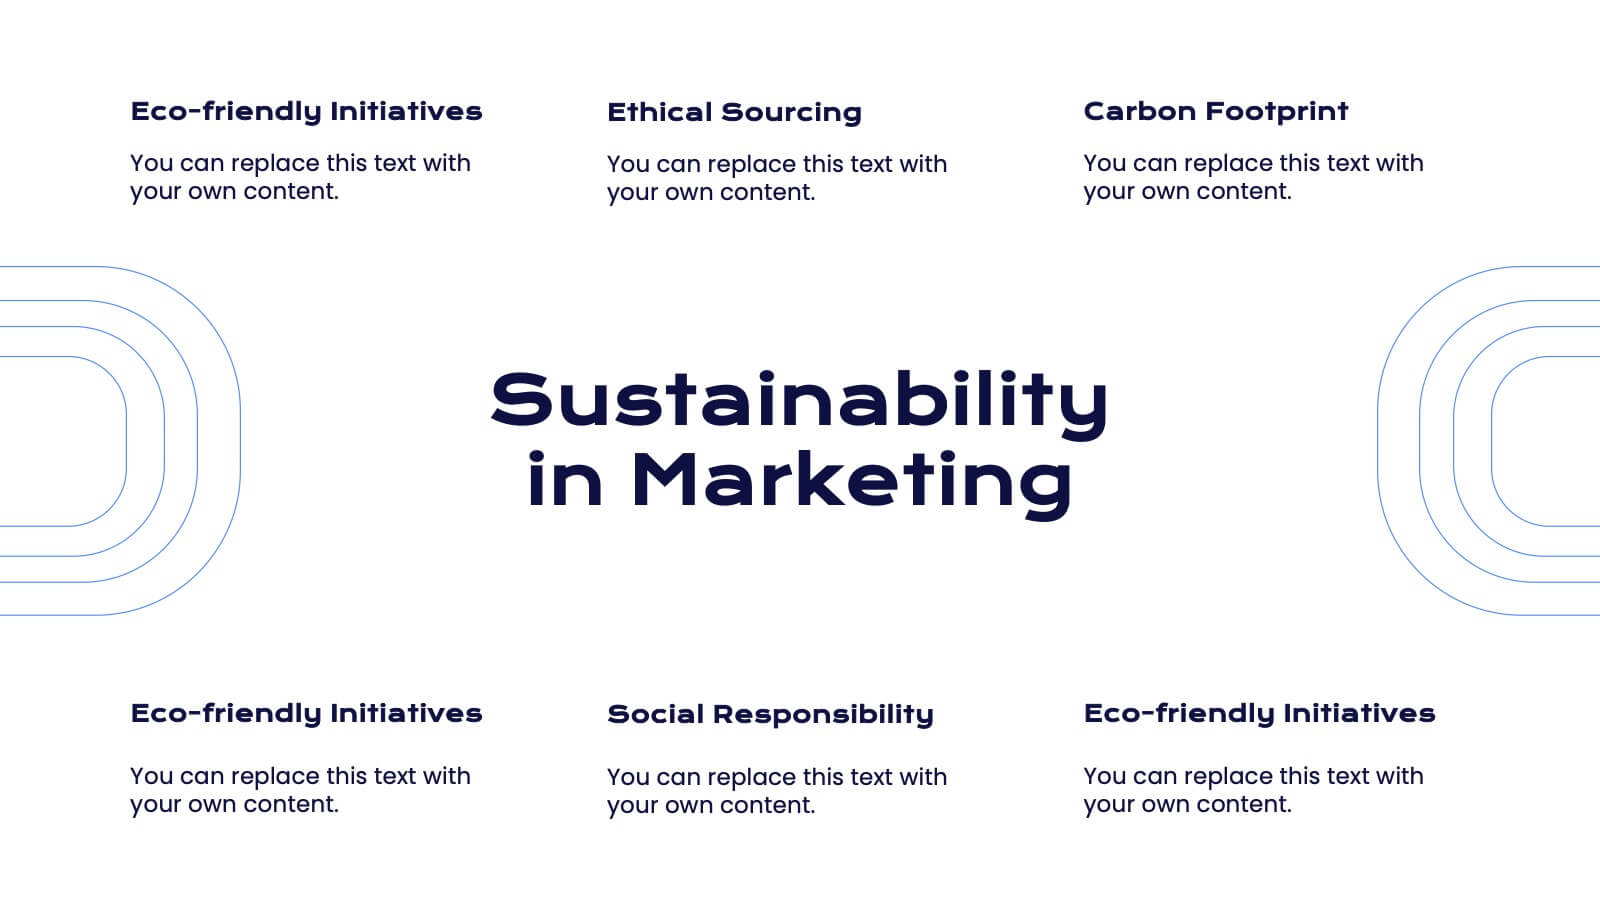
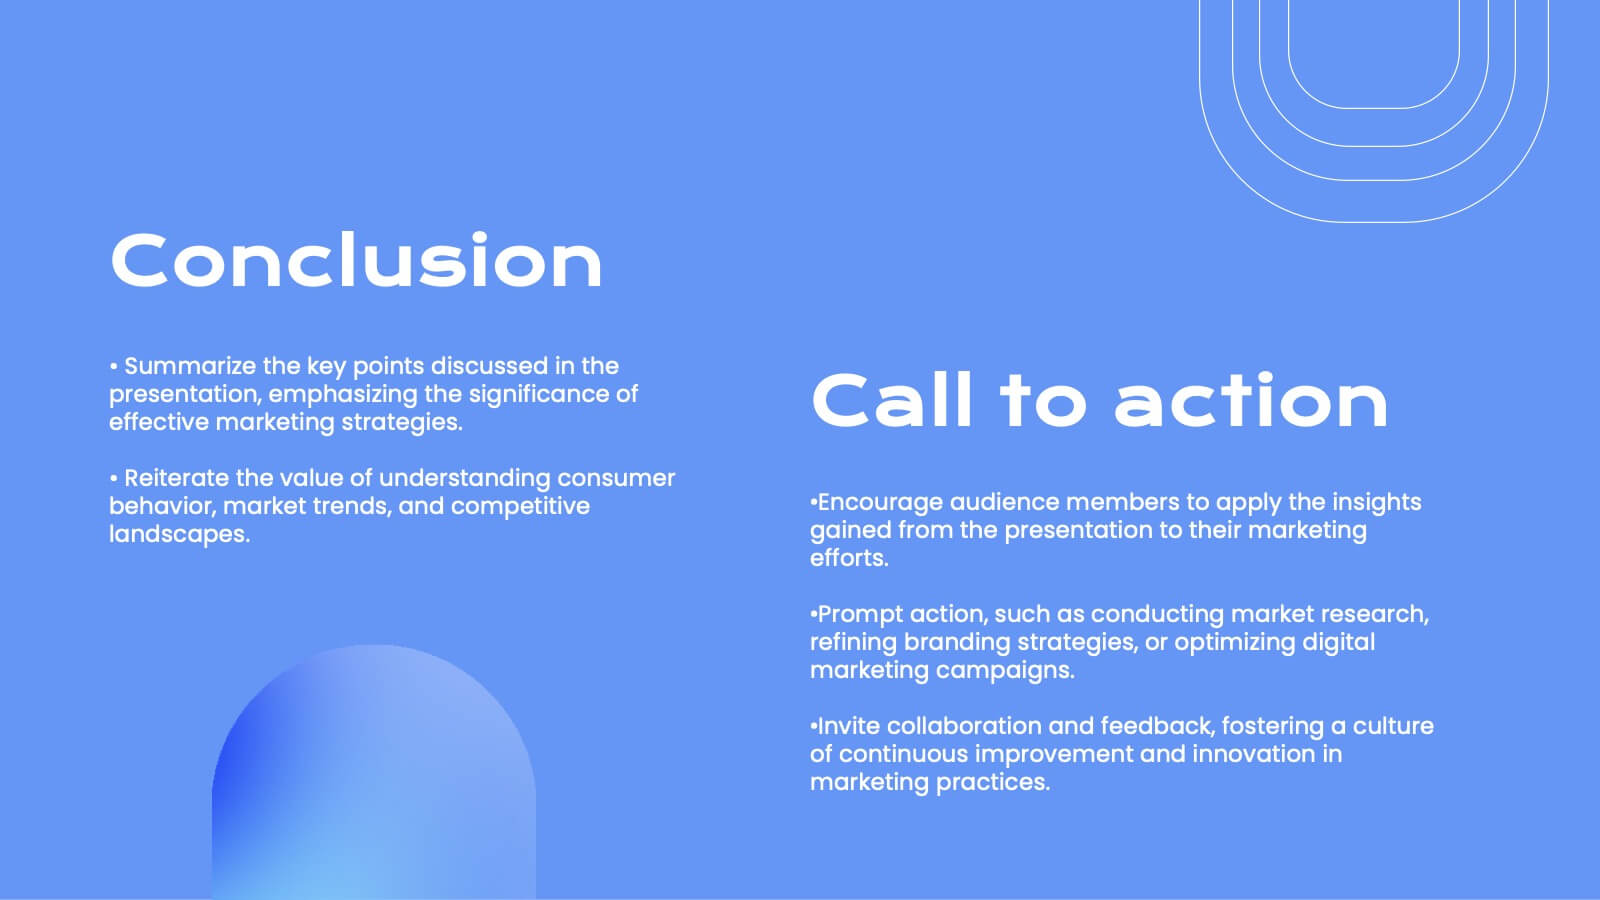
Faerie Digital Marketing Strategy Plan Presentation
Create a compelling marketing strategy with this sleek, modern template! It covers key topics like consumer behavior, social media strategies, and emerging trends. Perfect for showcasing insights in a clear, data-driven format. Fully customizable, it works seamlessly with PowerPoint, Keynote, and Google Slides for effective presentations.


5 diapositivas
Tech Stack and IT Infrastructure Presentation
Visualize your systems with this Tech Stack and IT Infrastructure Presentation. Featuring a vertical ribbon layout with five clearly defined segments, it's perfect for illustrating architecture layers, development pipelines, or infrastructure components. Easily editable in Canva, PowerPoint, or Google Slides to match your brand and IT strategy.


4 diapositivas
Preventive Health Services Layout Presentation
Make health data more human with this modern infographic layout for service-based reporting. This preventive health slide design clearly maps wellness categories to body parts, making it easy to communicate medical insights and early intervention strategies. Fully editable and compatible with PowerPoint, Keynote, and Google Slides for smooth integration into any deck.


6 diapositivas
Business Flow Chart Design Presentation
Bring clarity and momentum to your process with a clean, visual layout that turns complex steps into an easy-to-follow flow. This presentation helps teams map stages, responsibilities, and progress with confidence, making it perfect for planning, strategy, and operations. Fully compatible with PowerPoint, Keynote, and Google Slides.
22 diapositivas
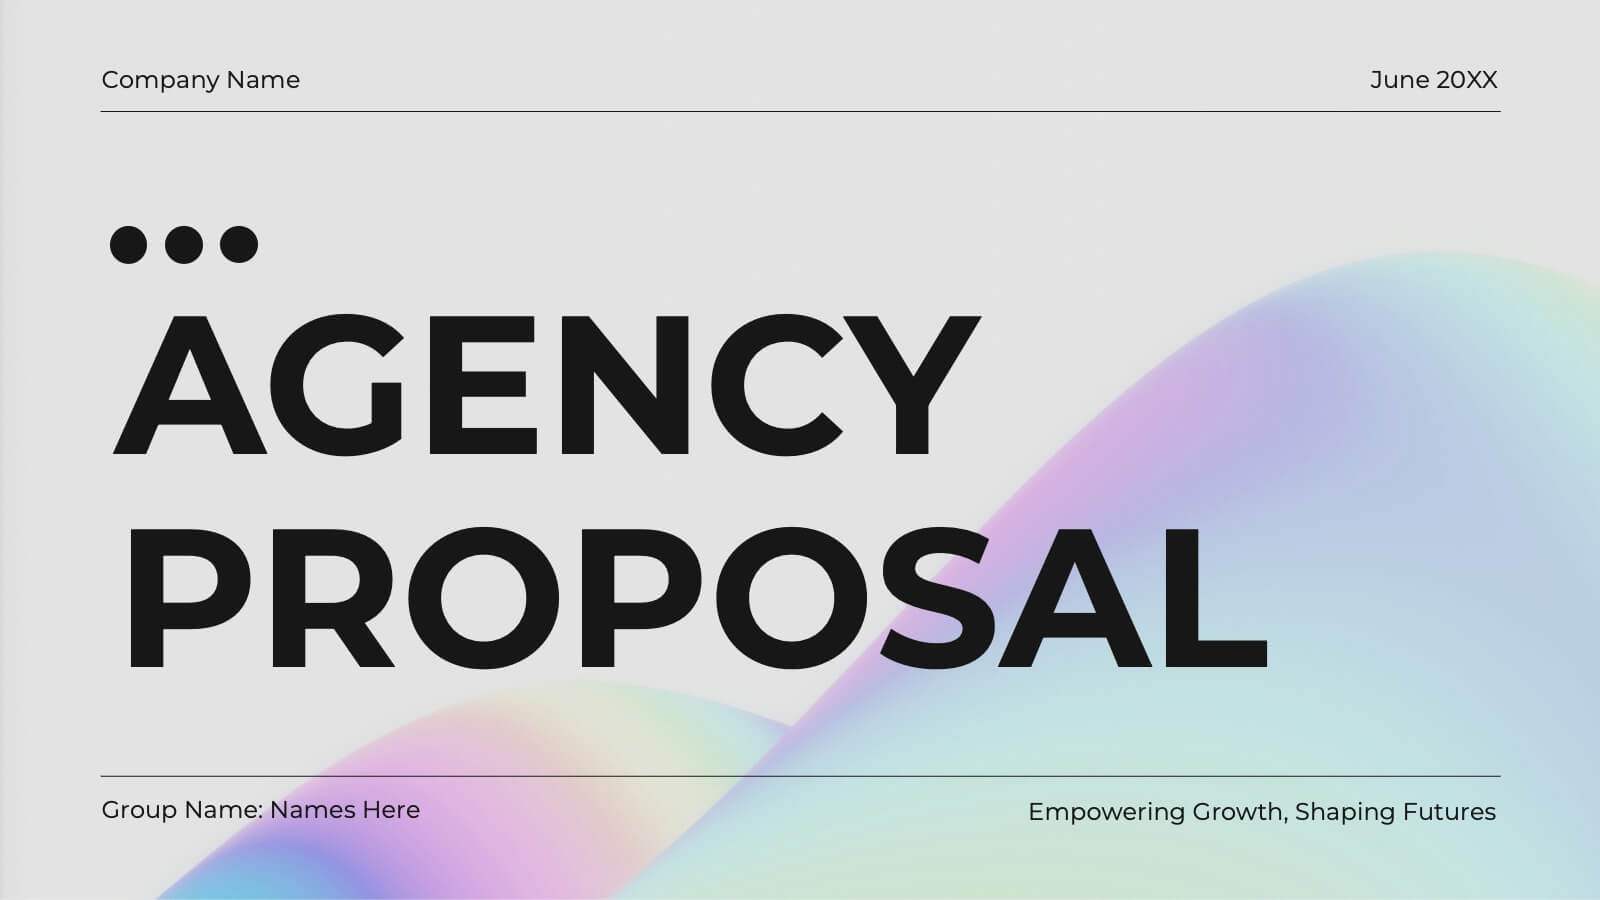
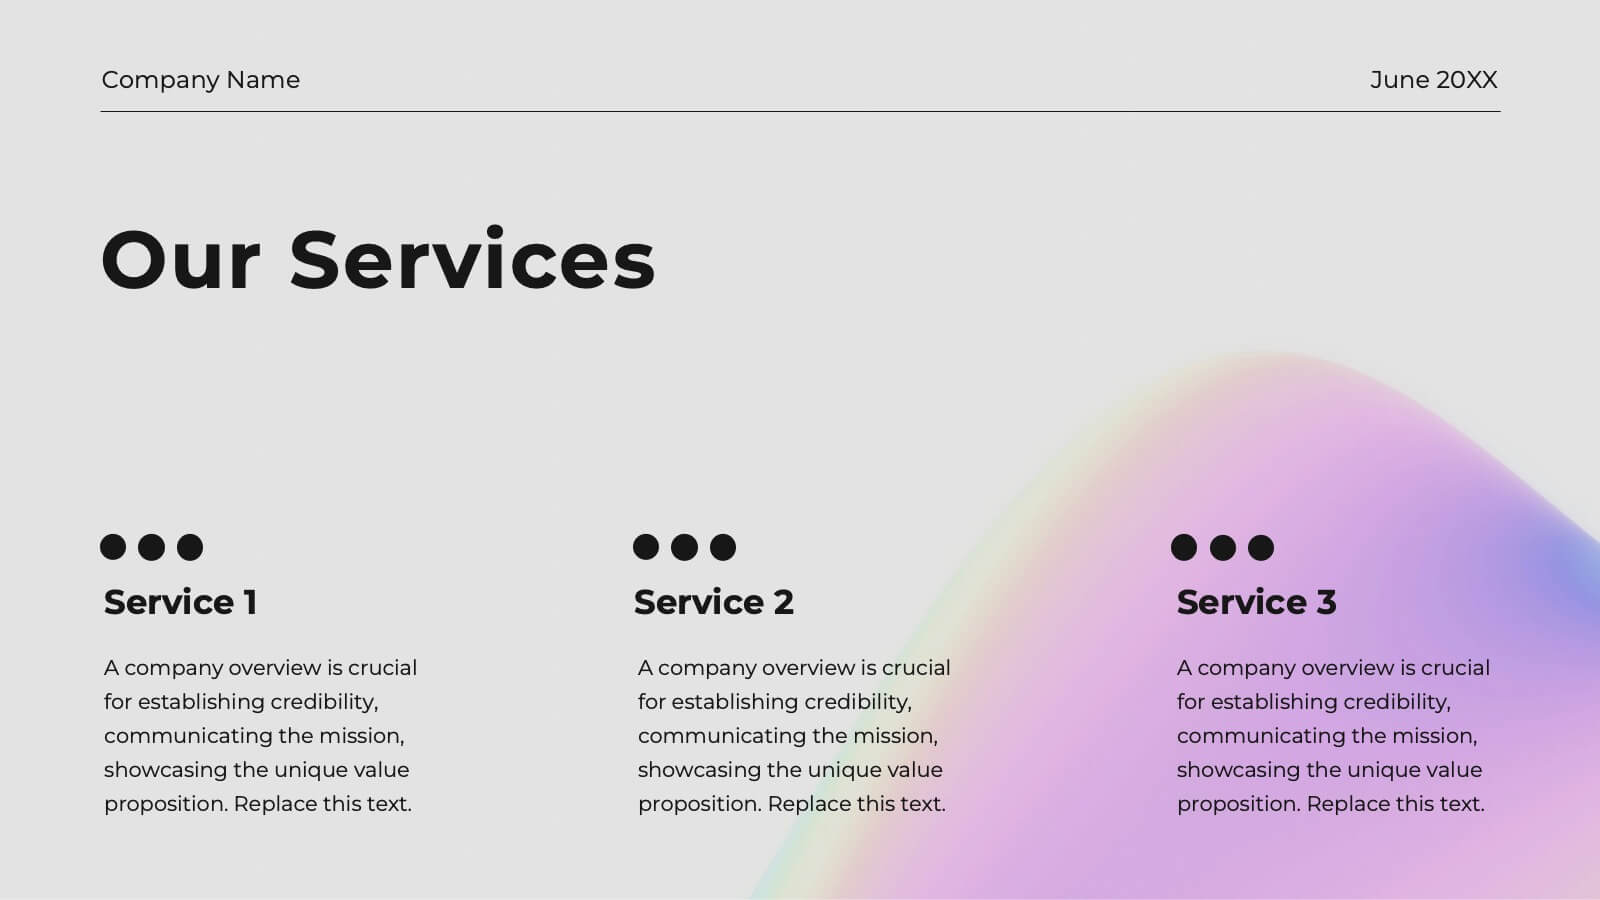
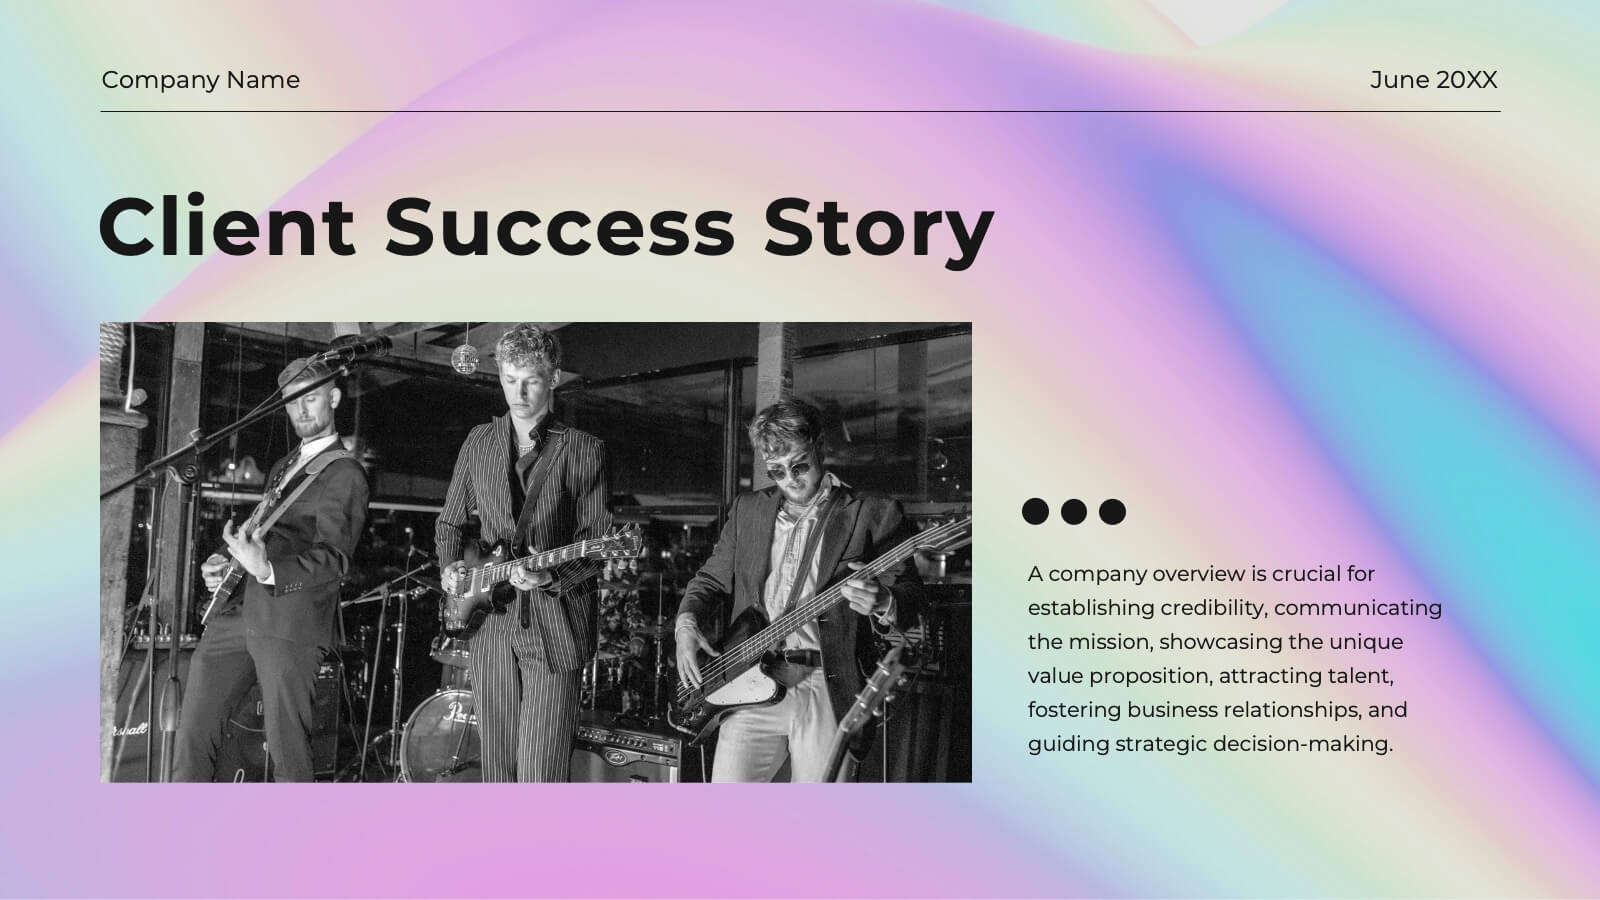
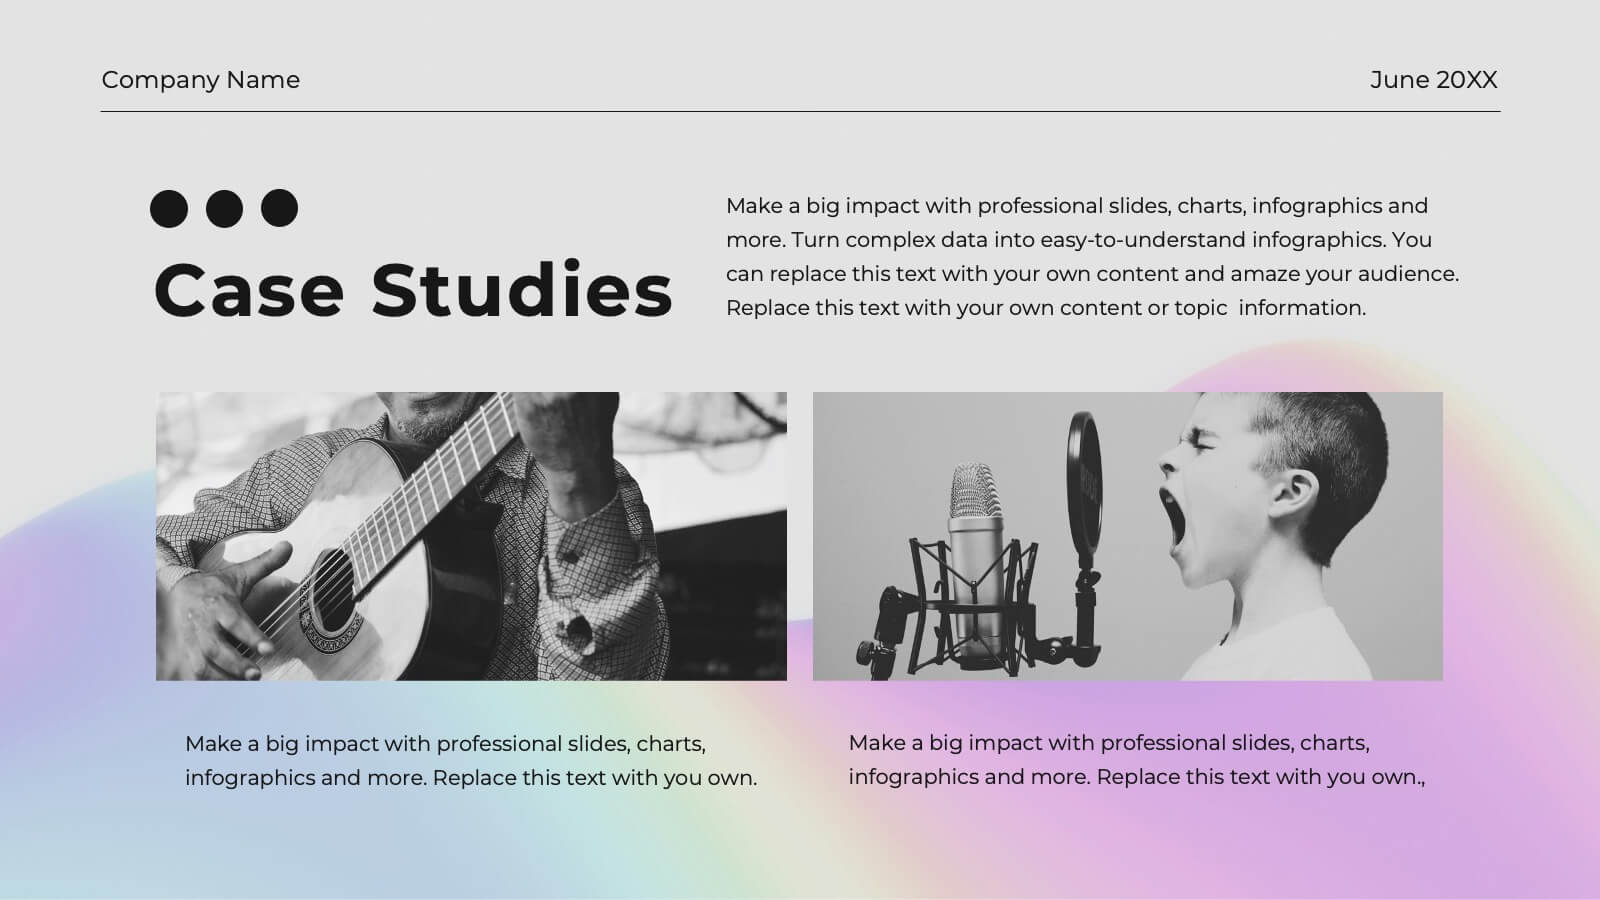
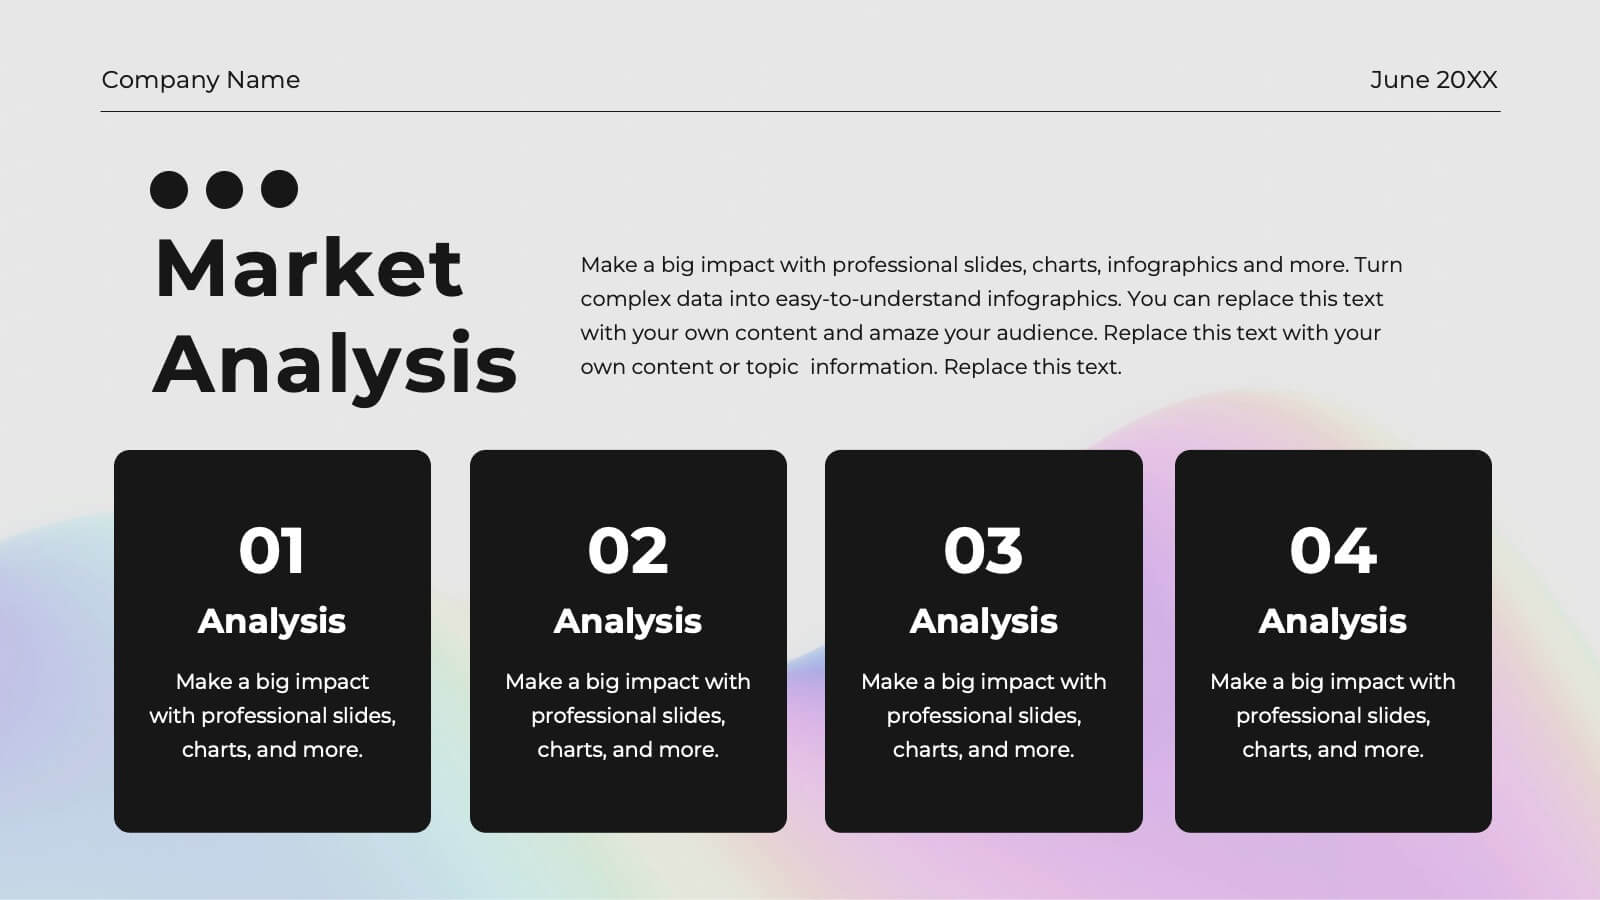
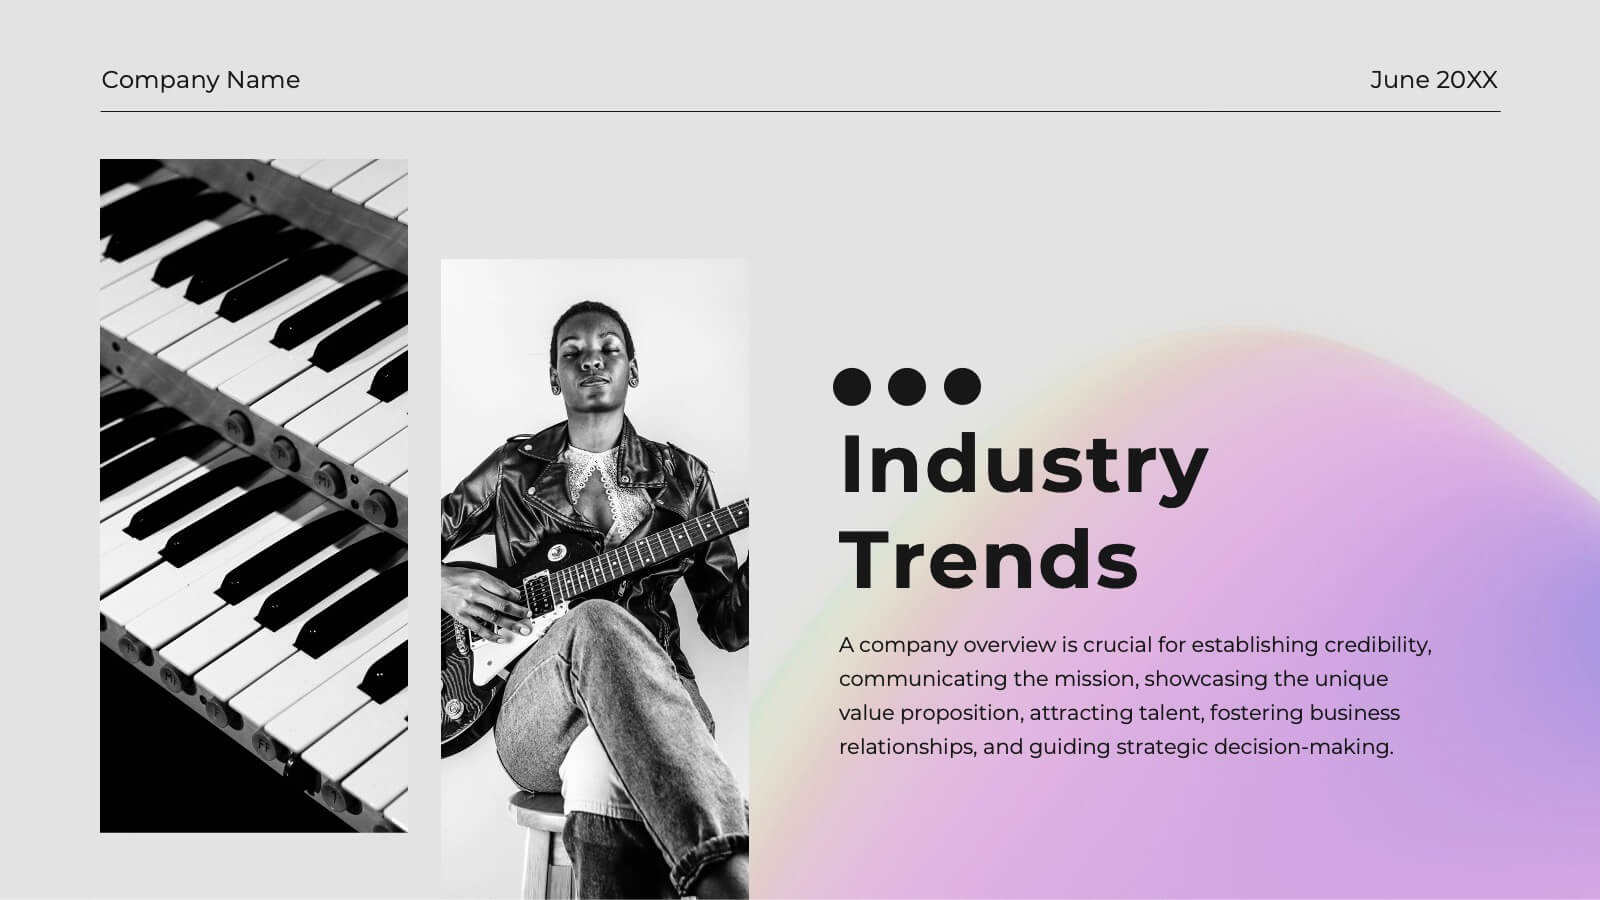
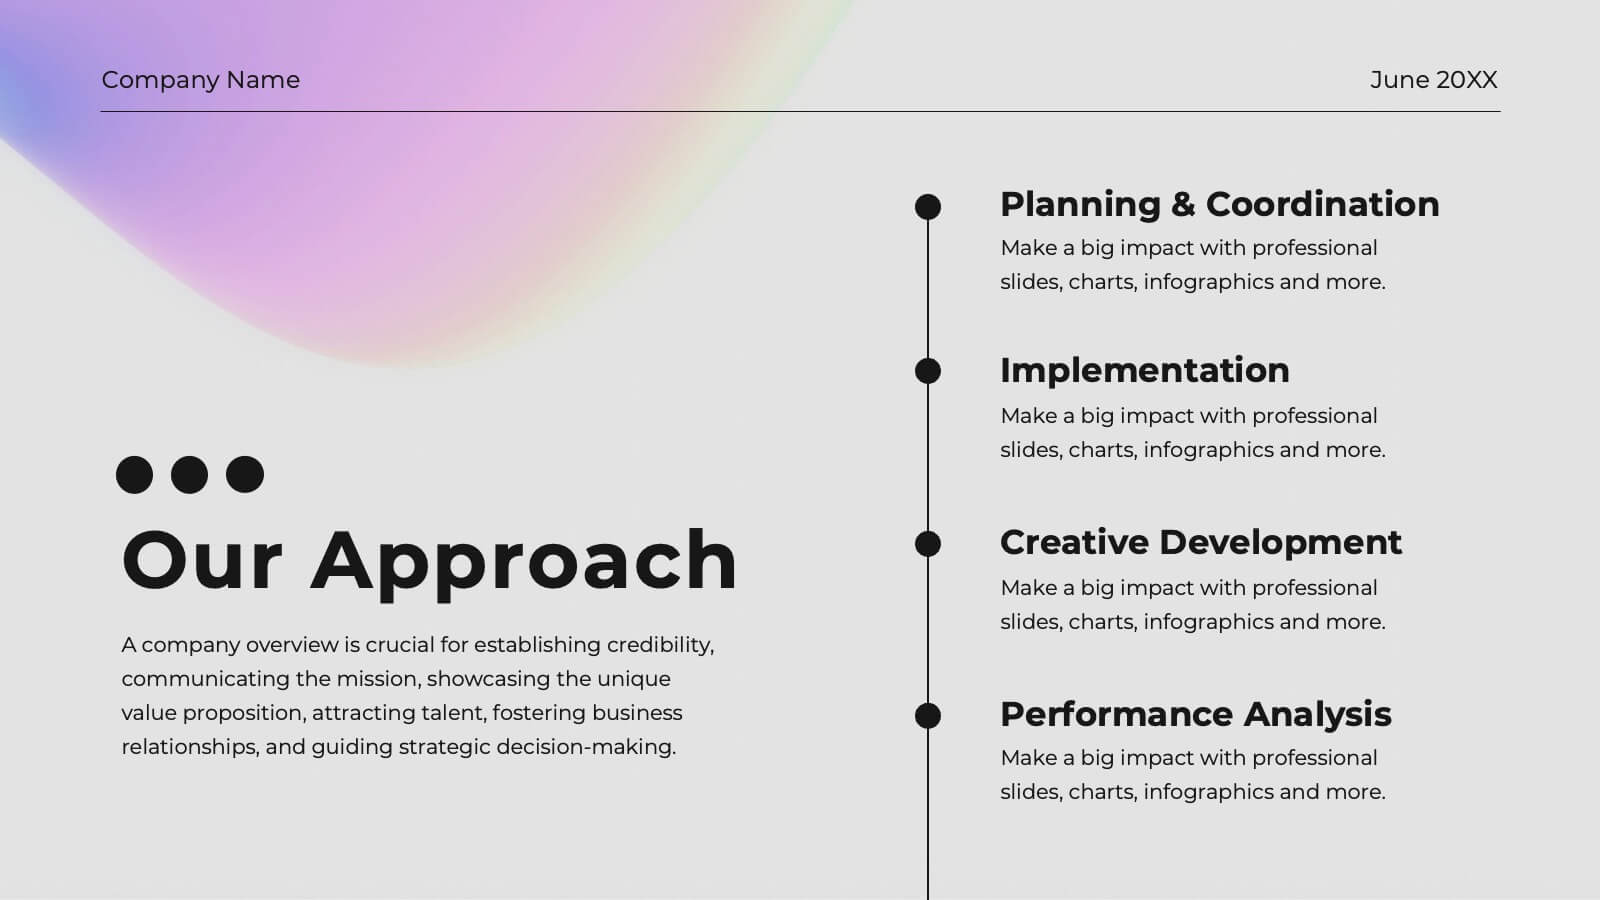
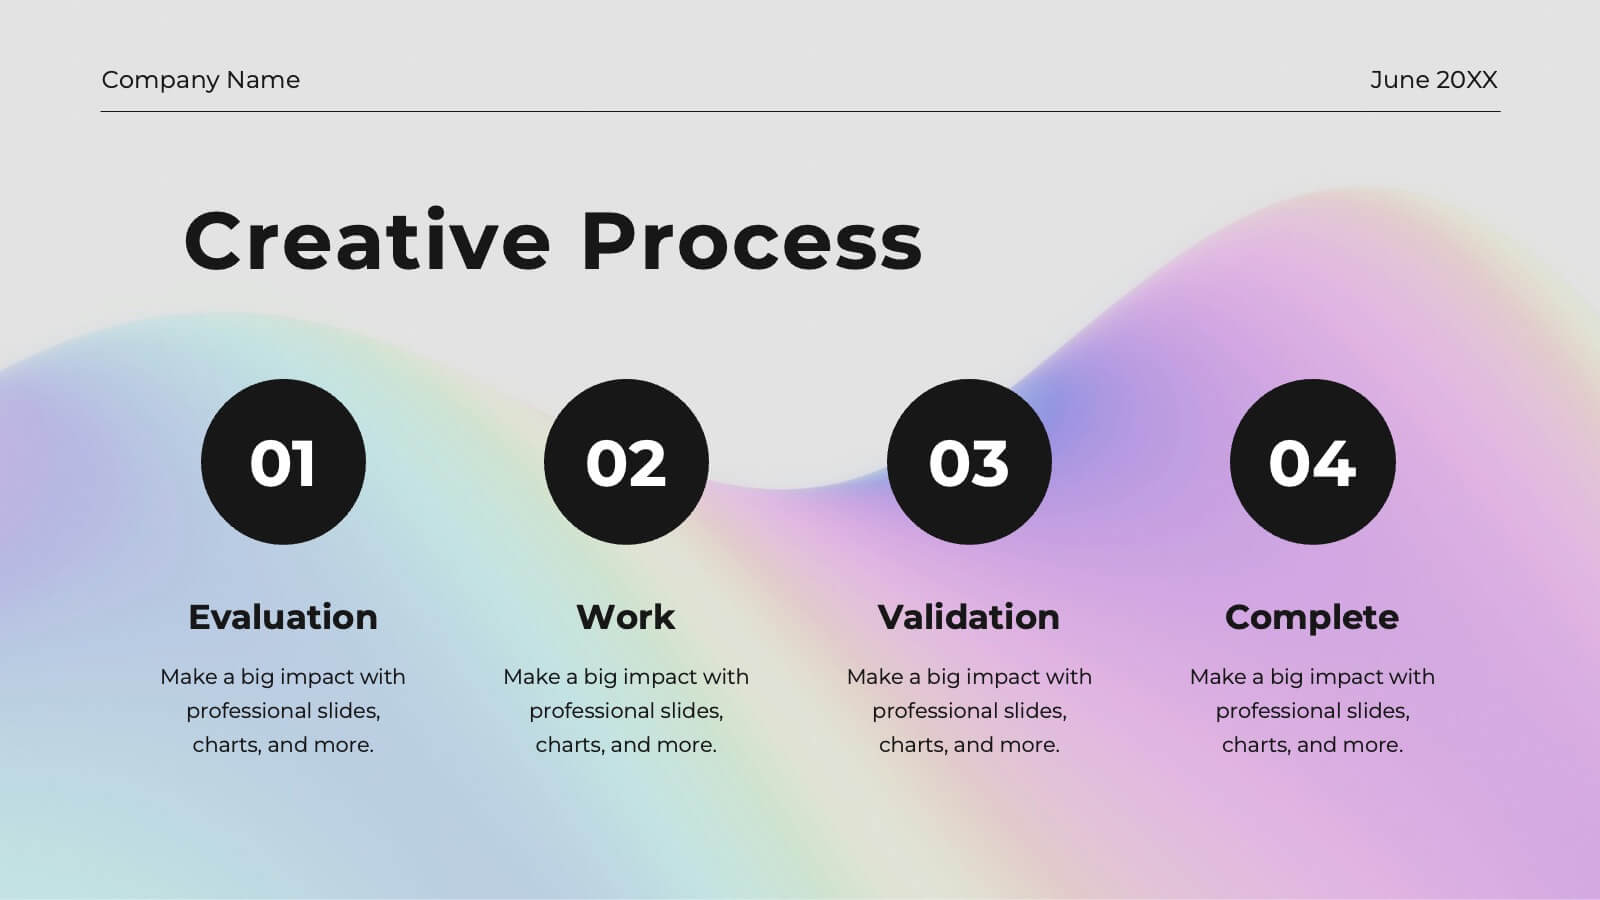
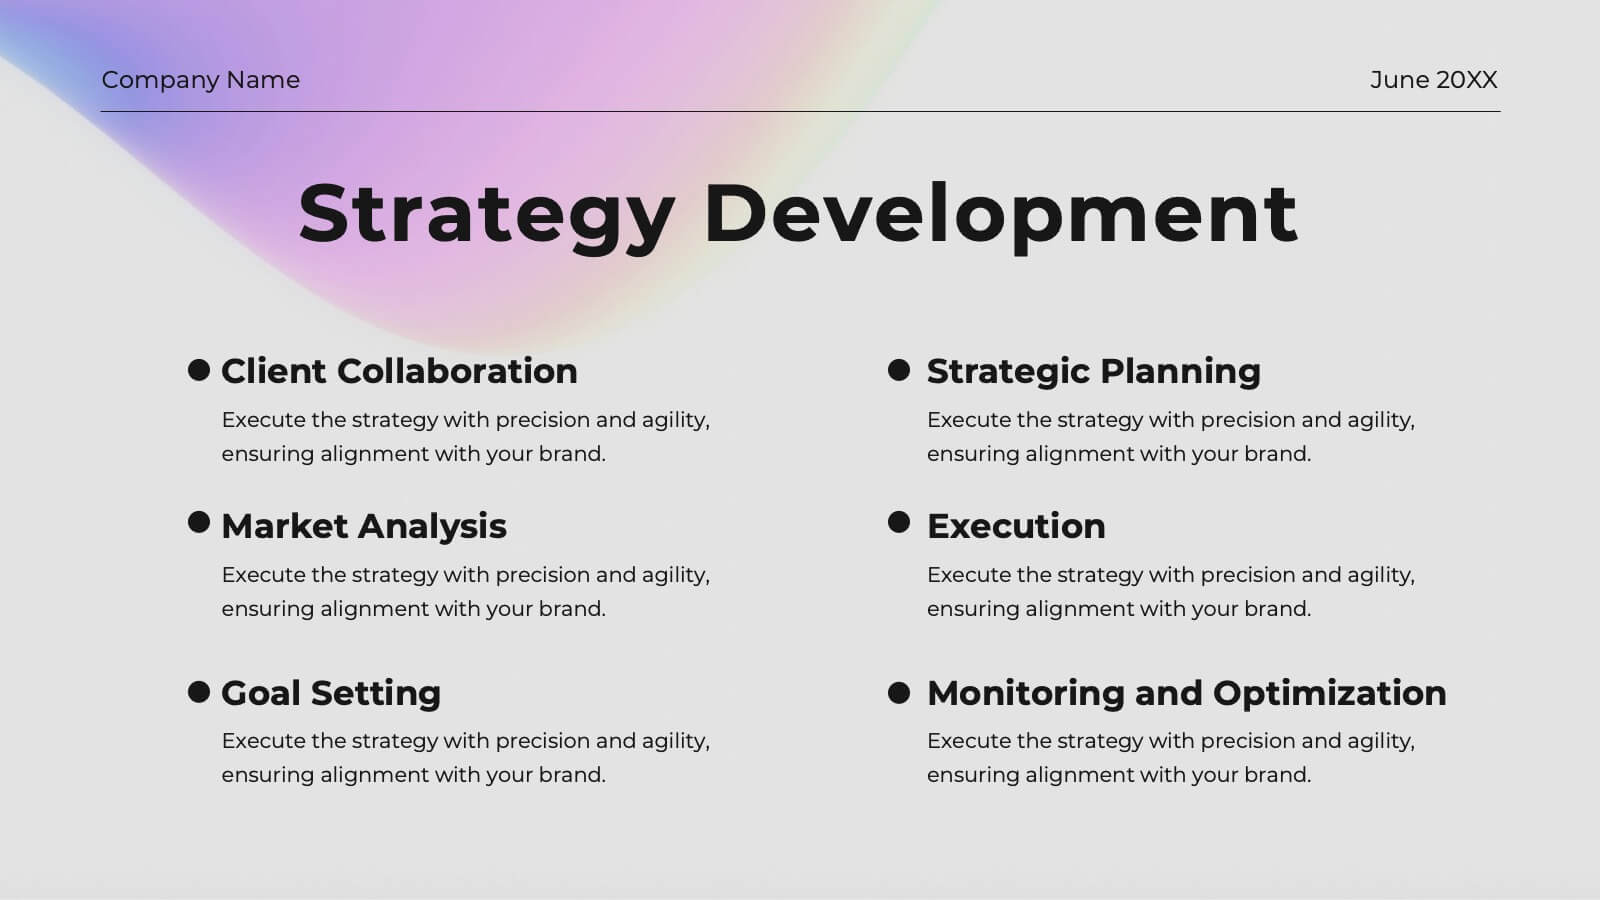
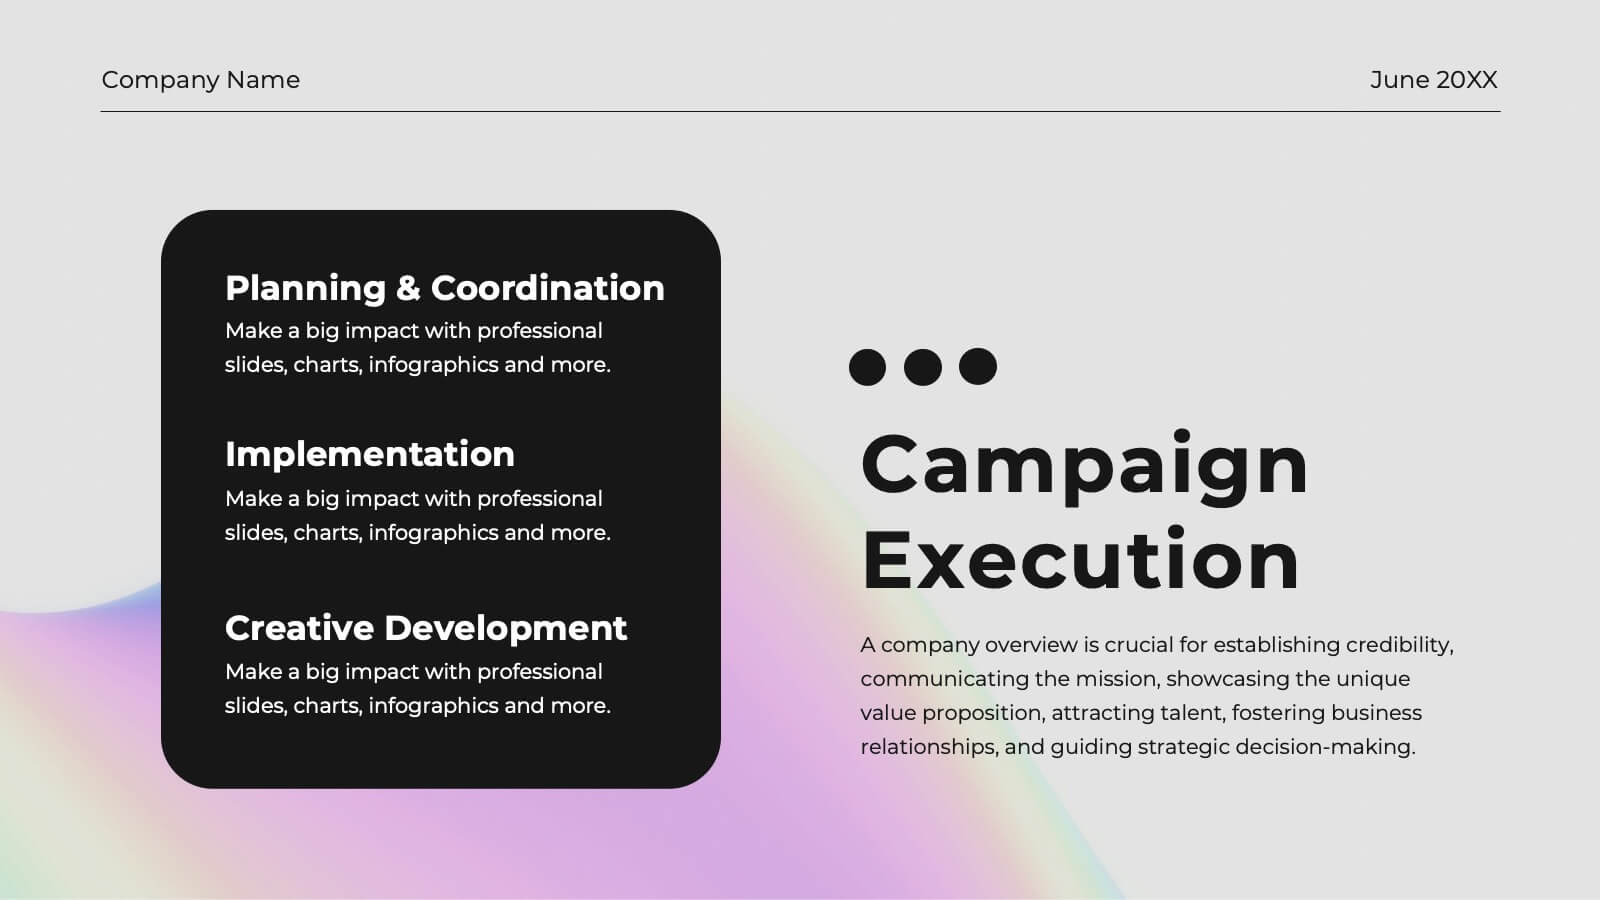
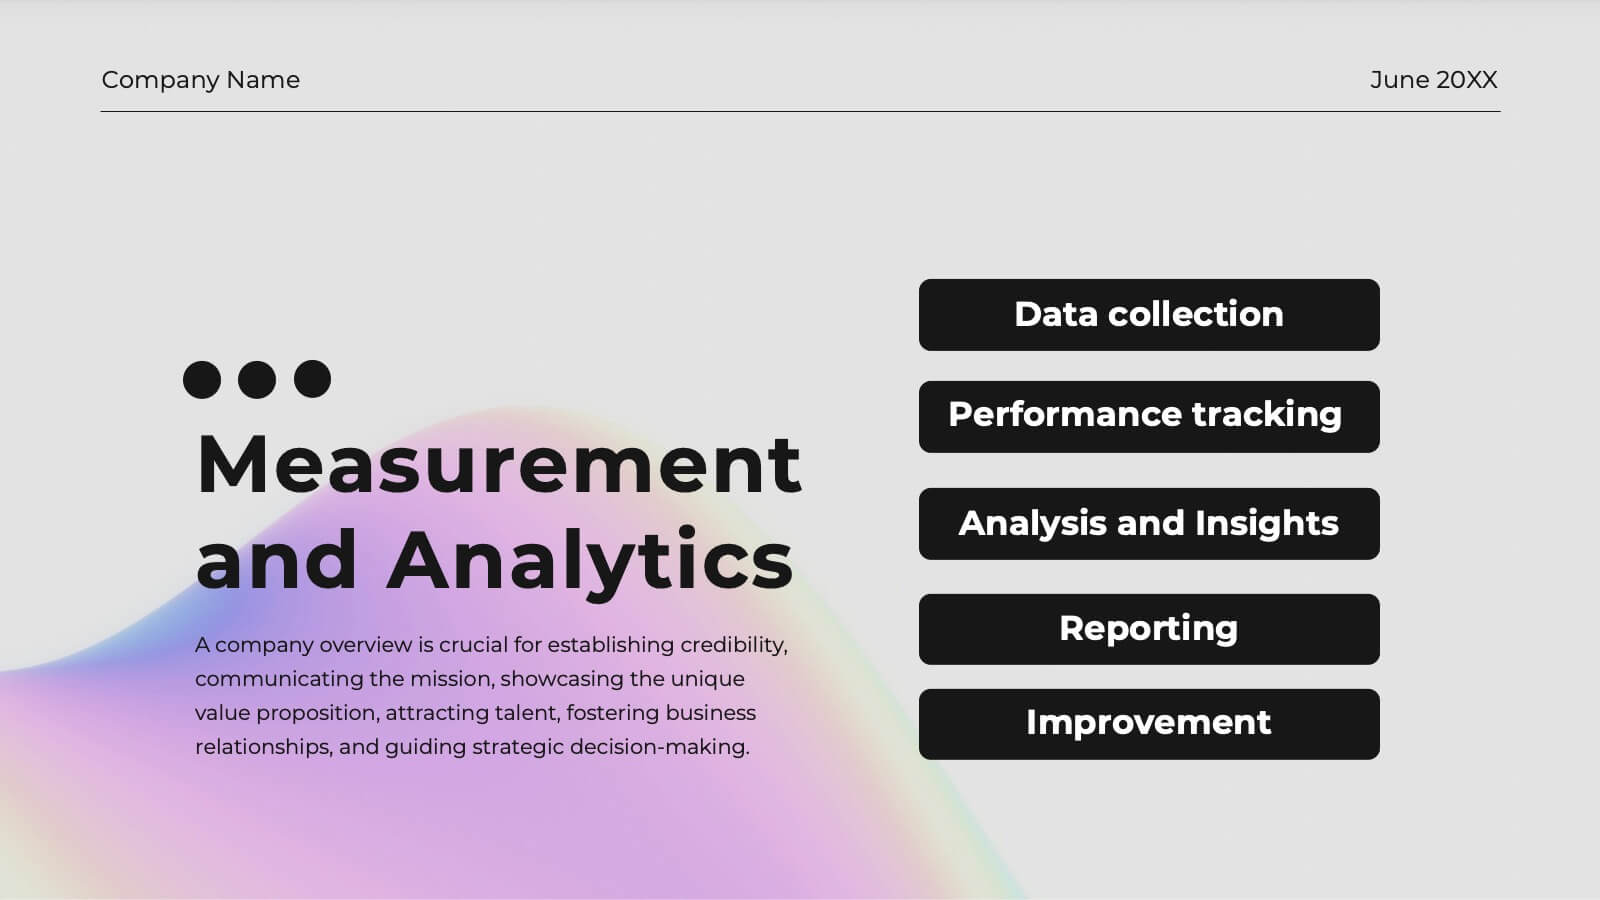
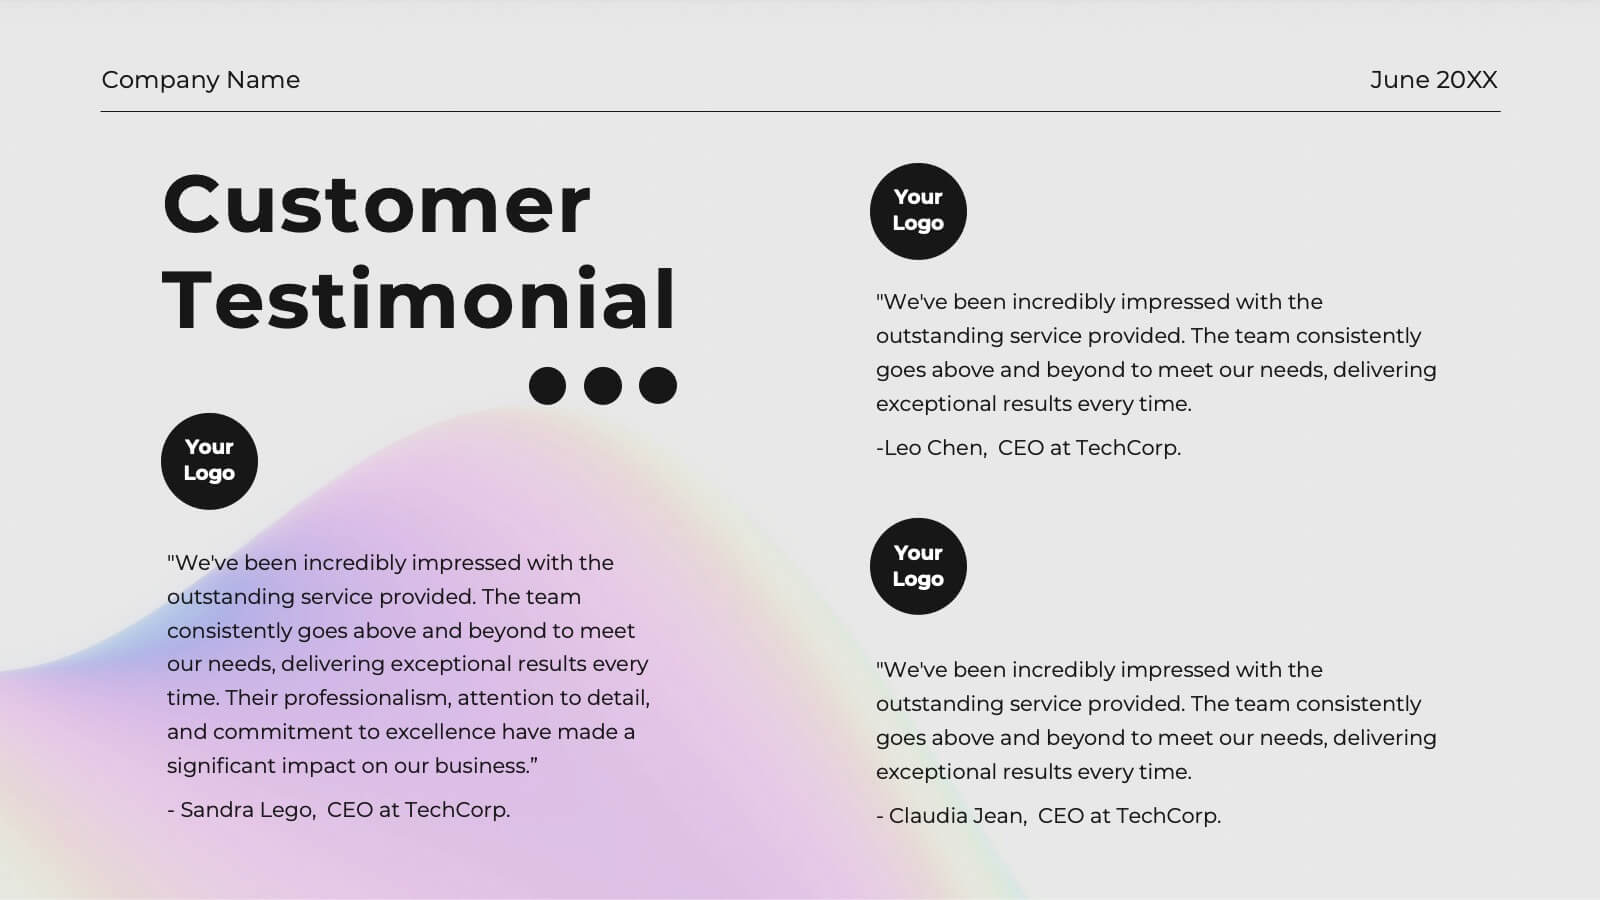
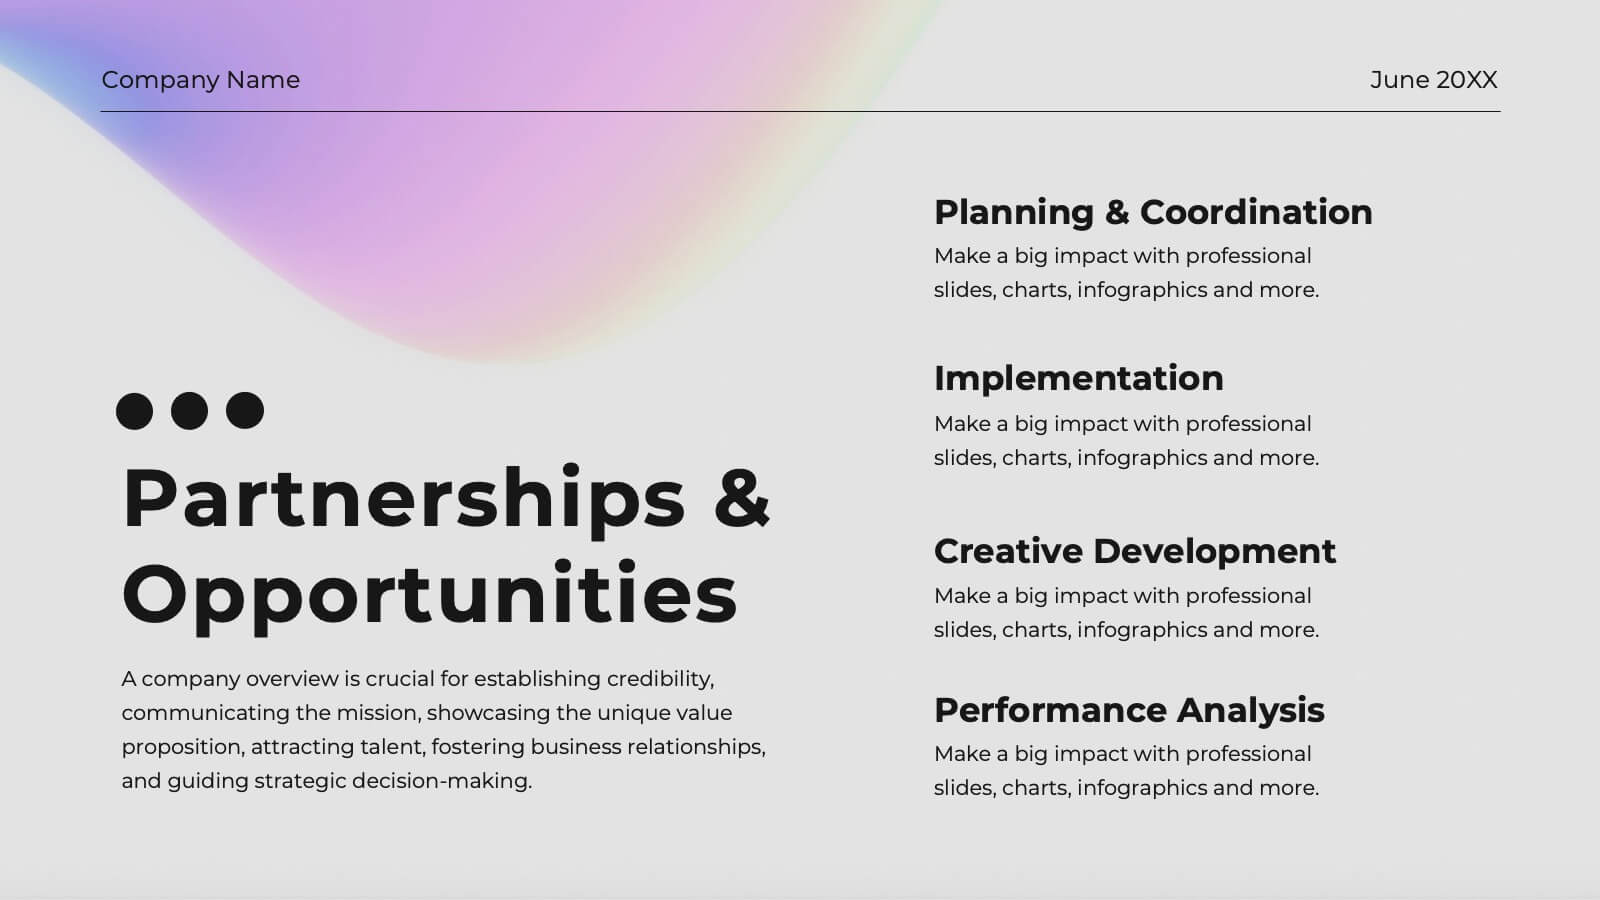
Frost Advertising Agency Proposal Presentation
Dazzle your clients with this radiant agency proposal template! Perfect for presenting your mission, services, and market analysis, it includes slides for case studies, strategy development, and campaign execution. Impress stakeholders with vibrant visuals and detailed content. Compatible with PowerPoint, Keynote, and Google Slides for seamless presentations on any platform.