


Características


¿Tienes alguna pregunta?
Recomendar


26 diapositivas
Jacob Free Powerpoint Template
Are you looking for a classy designer template? Then the Jacob is for you. The Jacob template is a chic, beautiful, modern and easy to use template. It's suitable for all types of businesses, from small business accounts, to large corporate companies and even personal use. It has a very hip aesthetic, with pink tones giving it a very fresh appealing look. The pictures and charts are easy to understand as well as easy to read without too much confusion on reading informative content. Easy to use high quality charts and graphs makes this template best for all types of businesses.


6 diapositivas
Data Analysis Methods Infographics
This Data Analysis Methods Infographic is an excellent tool for professionals and students alike to present statistical findings and patterns. Designed for seamless integration with PowerPoint, Google Slides, and Keynote. The infographics are ideal for illustrating trends, and summarizing large amounts of data in an easily digestible format. With a variety of chart styles, including bar graphs, line charts, and icon arrays, the template allows for versatile data representation. Make your data speak volumes with this crisp and informative infographic, ensuring your audience grasps the insights at a glance. Perfect for market research, academic research, and business performance presentations.


7 diapositivas
Vacations Travel Infographic
Are you ready to embark on a journey around the world? Our Vacations Travel Infographic is your ultimate guide to thrilling destinations, exotic experiences, and memorable adventures. Whether you're a passionate traveler seeking new horizons or an explorer at heart, this infographic is designed to ignite your wanderlust and set your vacation dreams on fire. Compatible with Powerpoint, Keynote, and Google Slides. Dive into the world of travel with this vivid infographic that sparks excitement and eagerness to discover what lies beyond. This template is not just a visual delight, it's a roadmap to your dream vacation!


4 diapositivas
Statistical Analysis Charts Presentation
Present your data with clarity using this Statistical Analysis Charts Presentation Template. Designed with overlapping bubble visuals and percentage indicators, it’s ideal for displaying survey results, statistical breakdowns, or demographic segments. Clean, modern, and fully editable in PowerPoint, Keynote, and Google Slides.


7 diapositivas
Population United States Map Infographic Presentation
The United States is located in North America and is comprised of 50 states and the District of Columbia. This template is a stylish and attractive way to showcase your data on a map. It is compatible with Powerpoint, Keynote and Google Slides, making it easily customized and adjusted according to your needs, and for different presentations or reports. This United States Map is the perfect visual for presentations on geography, history, and political science! There are various icons where you can input your data, and statistics. This template can be used for your next map project!


4 diapositivas
Differentiation through Blue Ocean Framework Presentation
Make waves with this bold, eye-catching layout built to show what sets your strategy apart. This presentation template explores how to stand out in untapped markets using a simple comparison framework, perfect for teams shifting from competition to innovation. Easily editable and ready for PowerPoint, Keynote, and Google Slides.


21 diapositivas
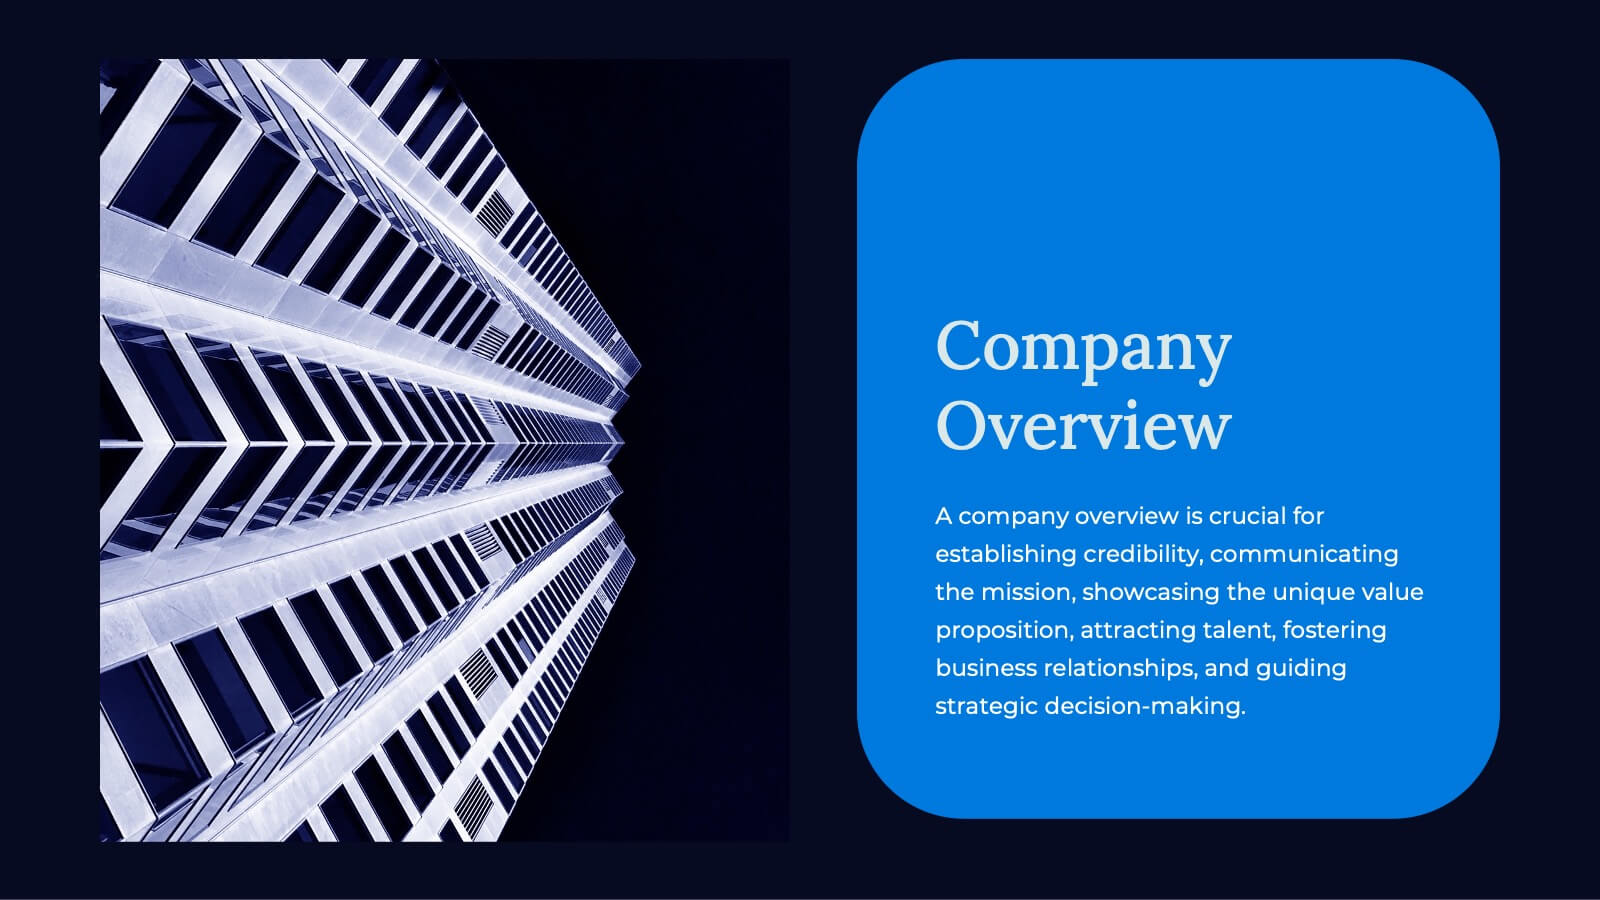
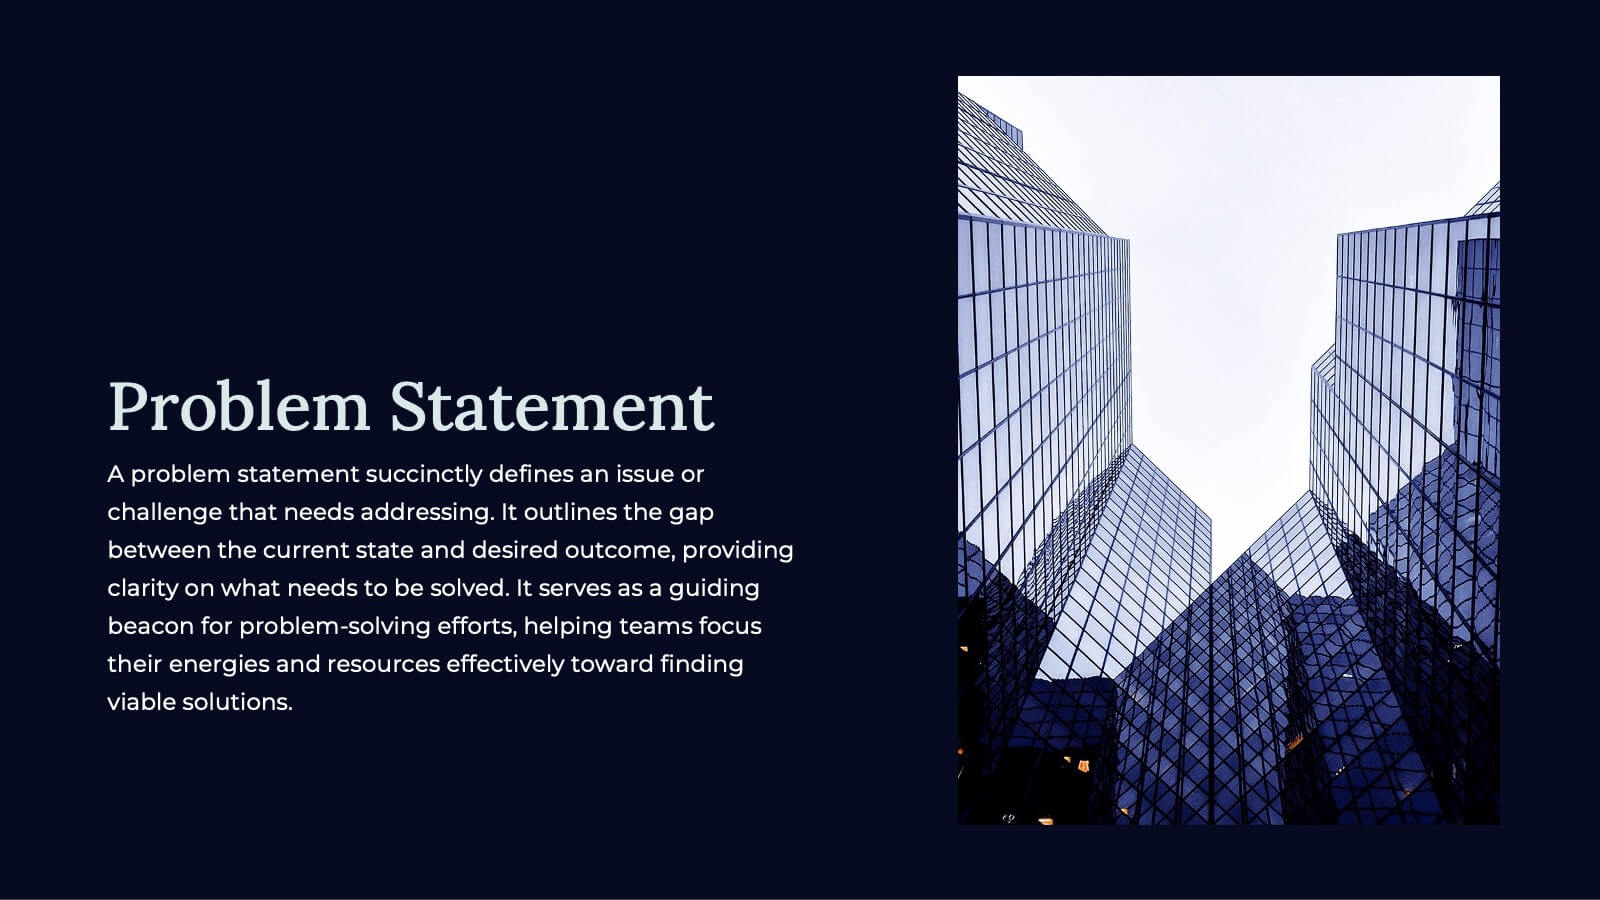
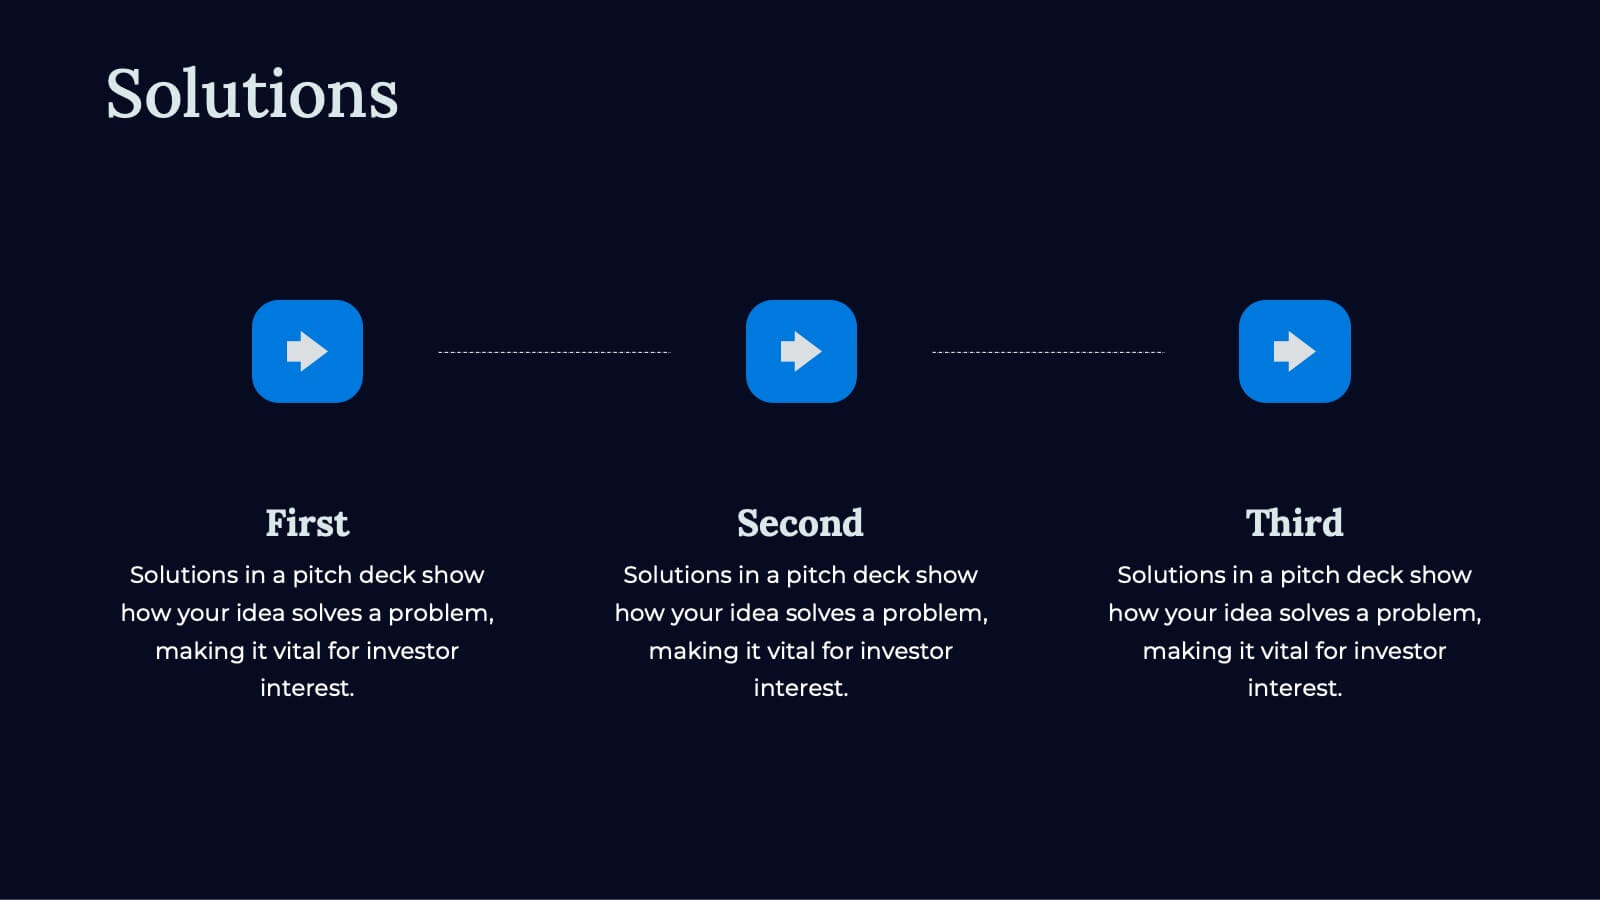
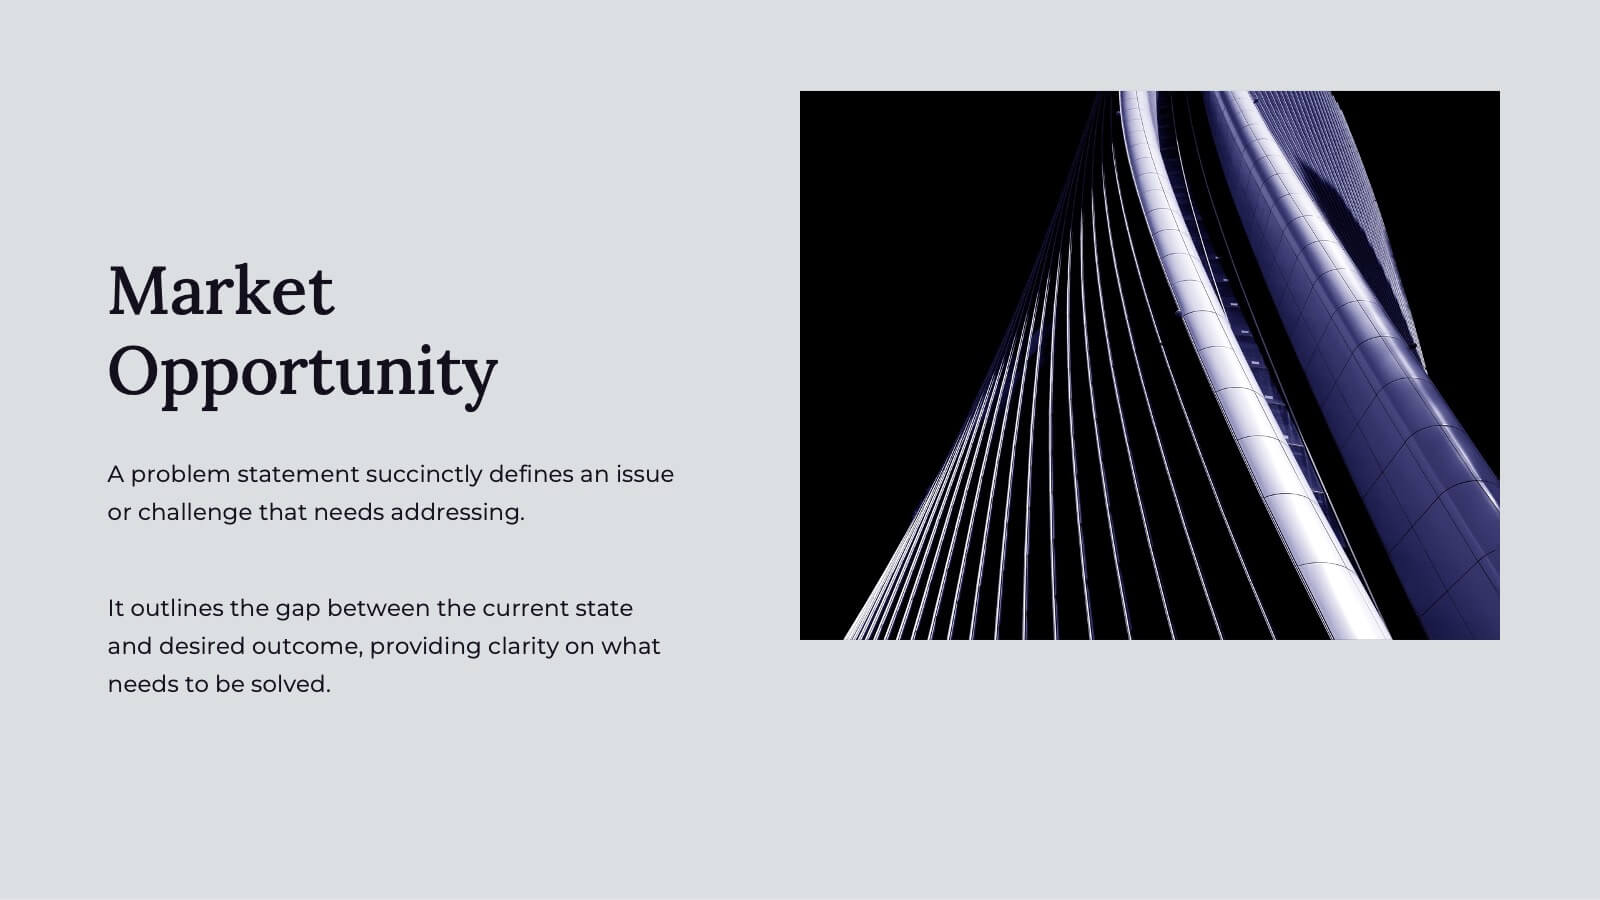
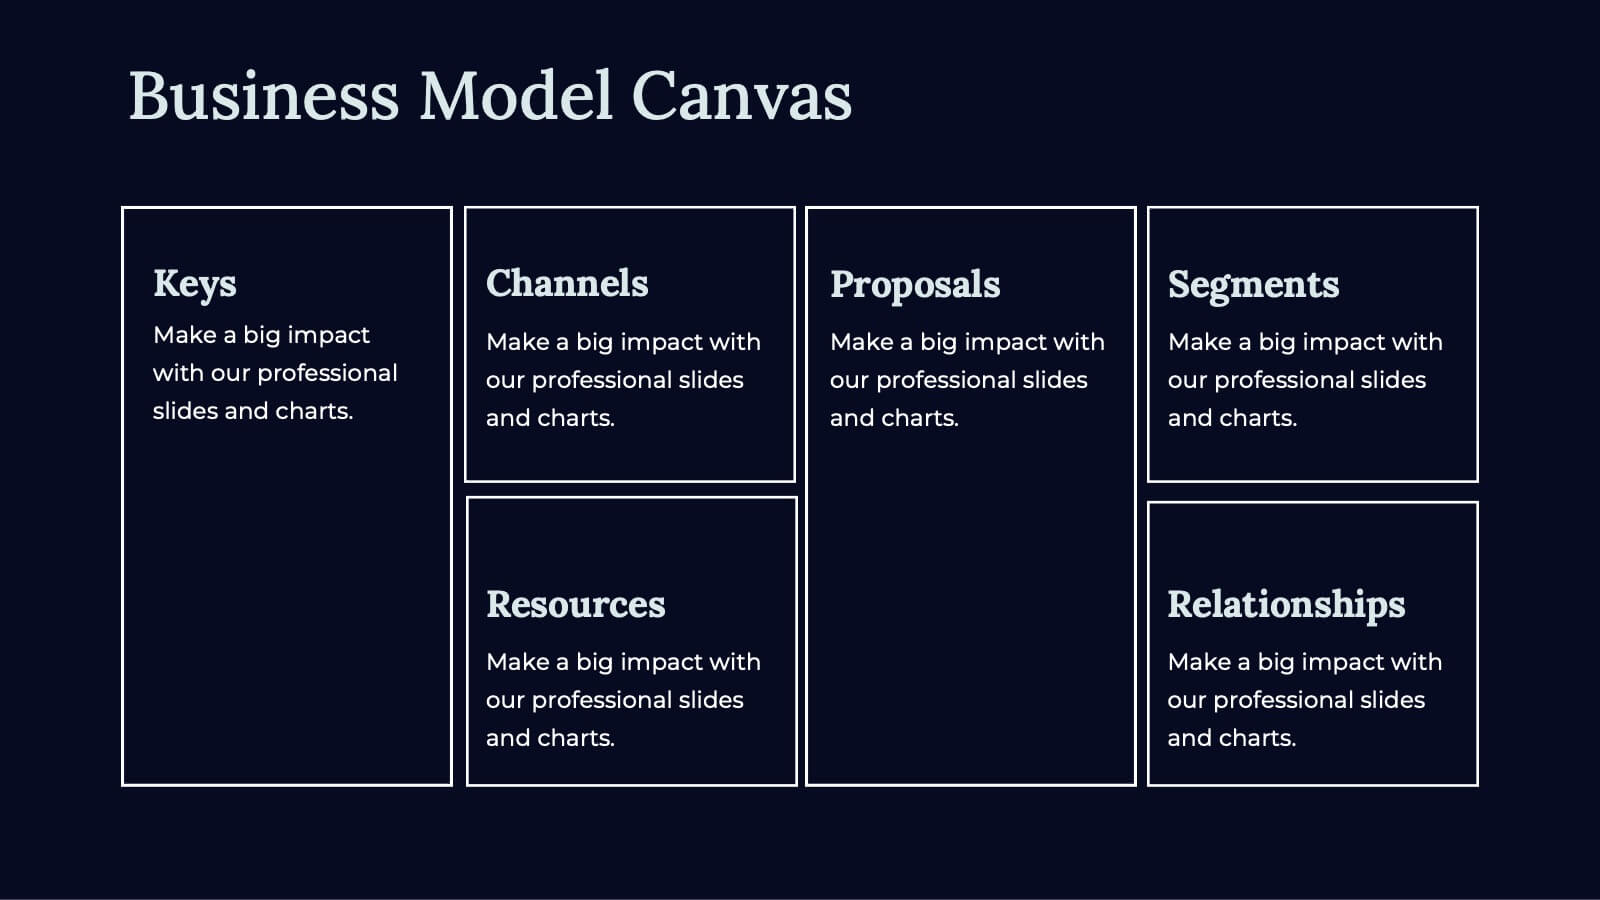
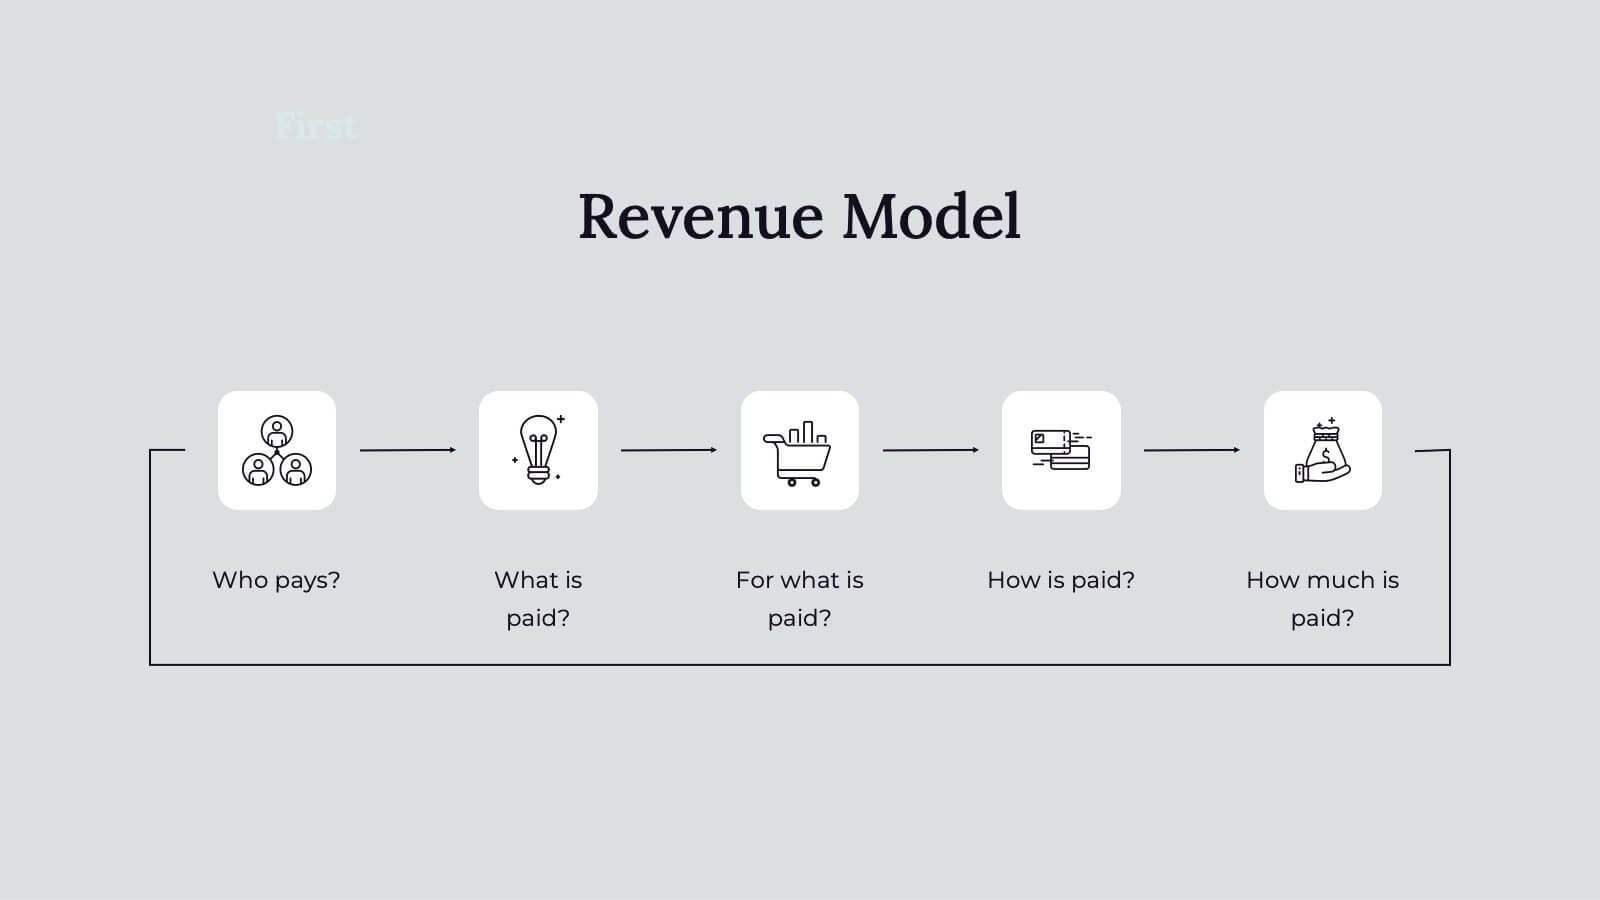
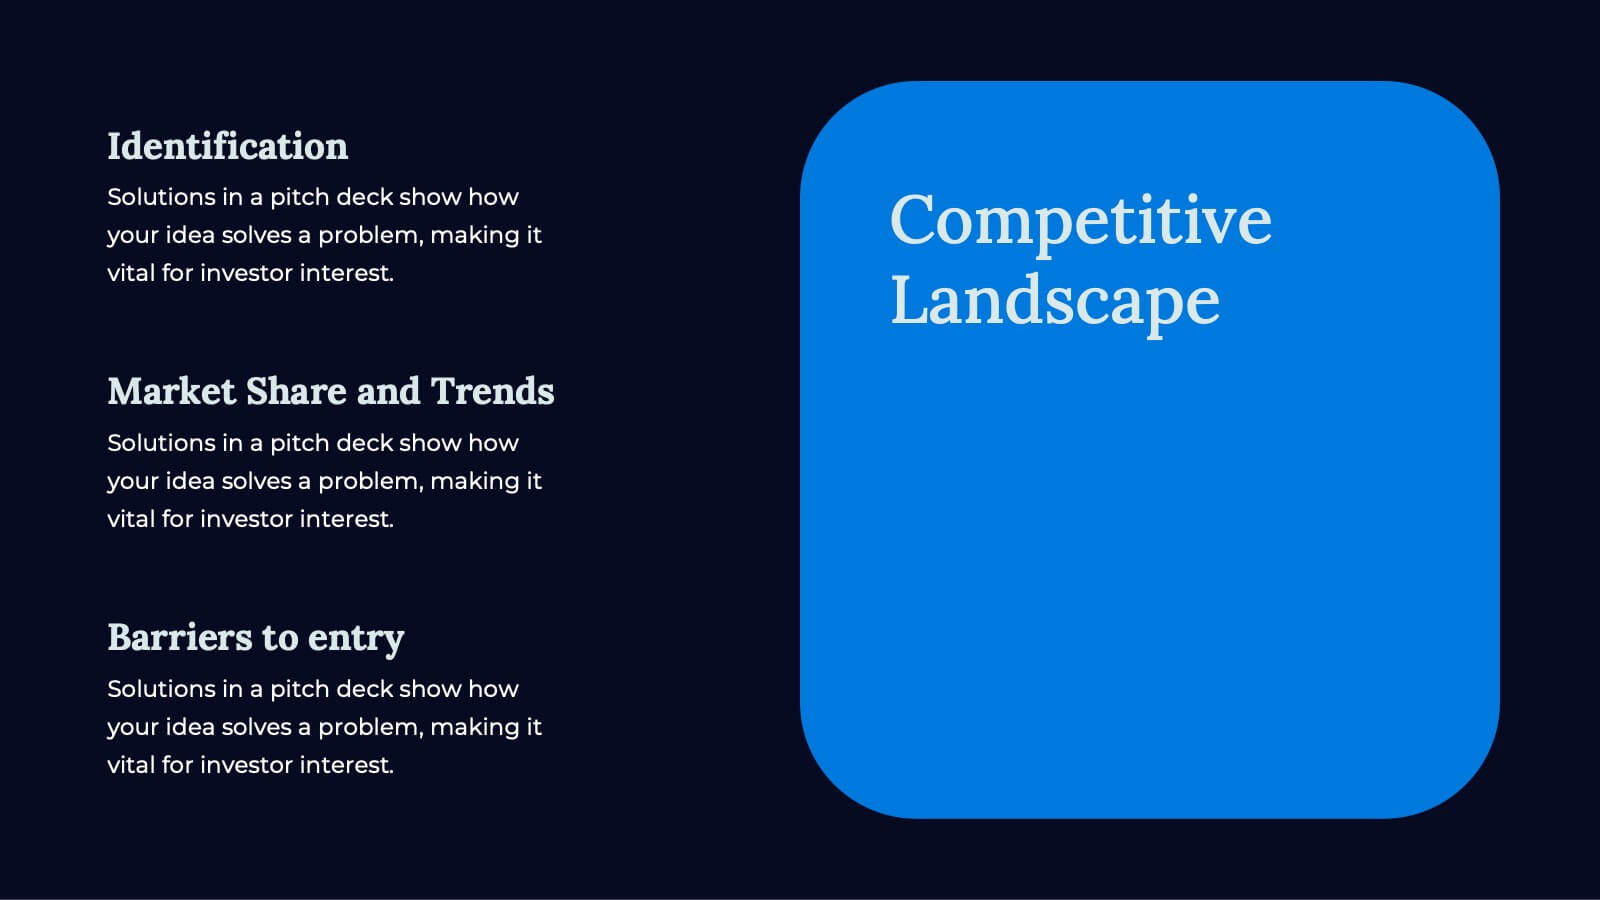
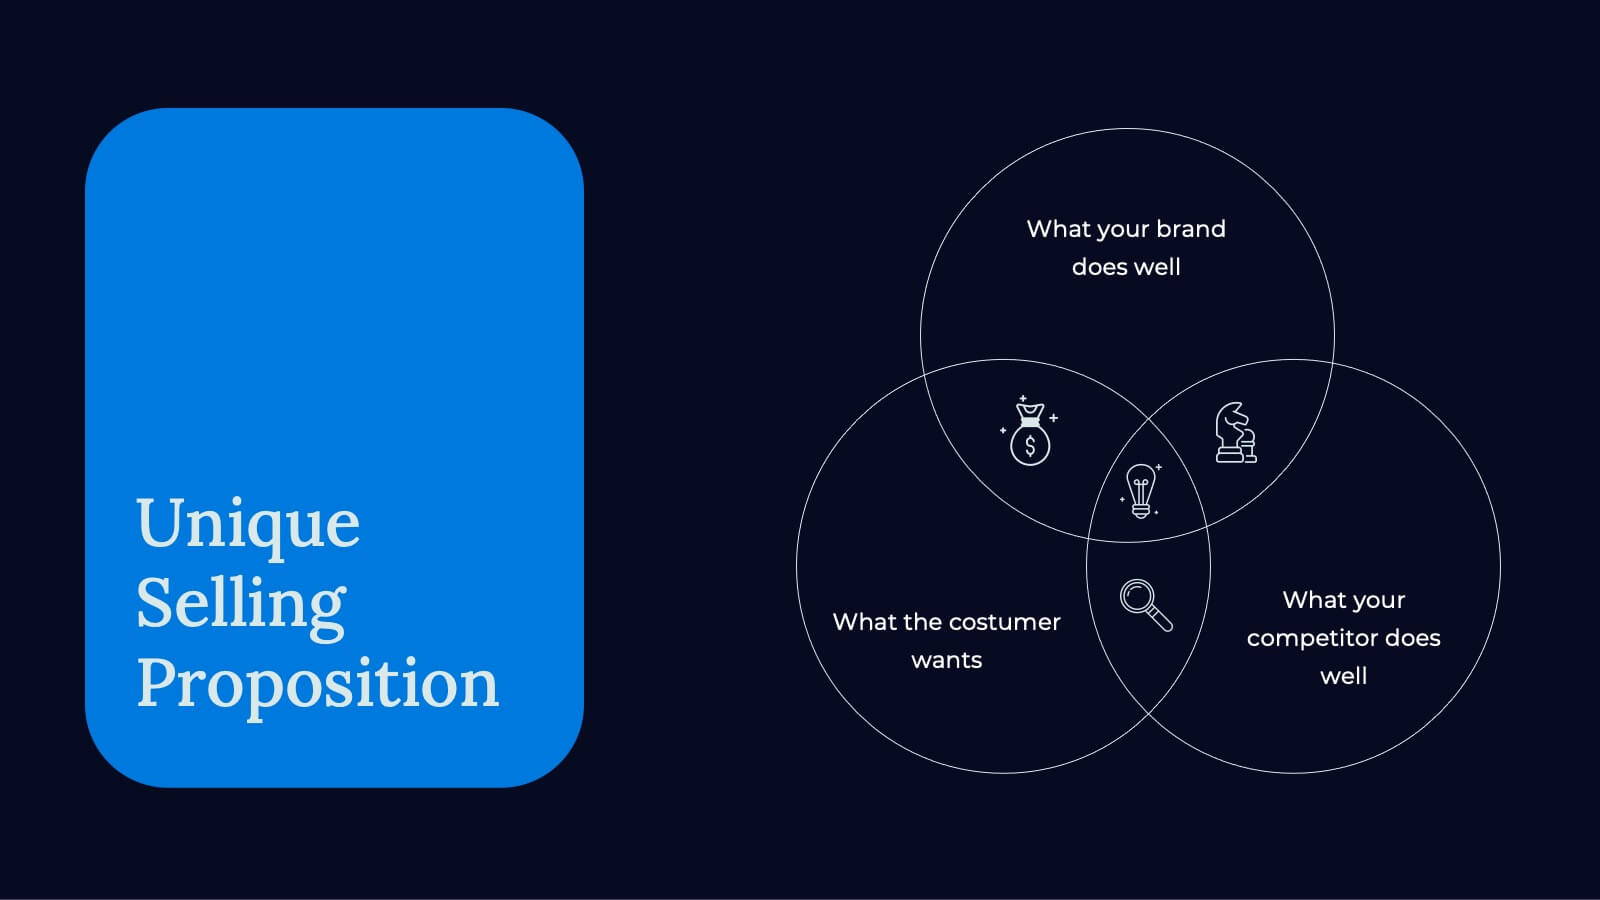
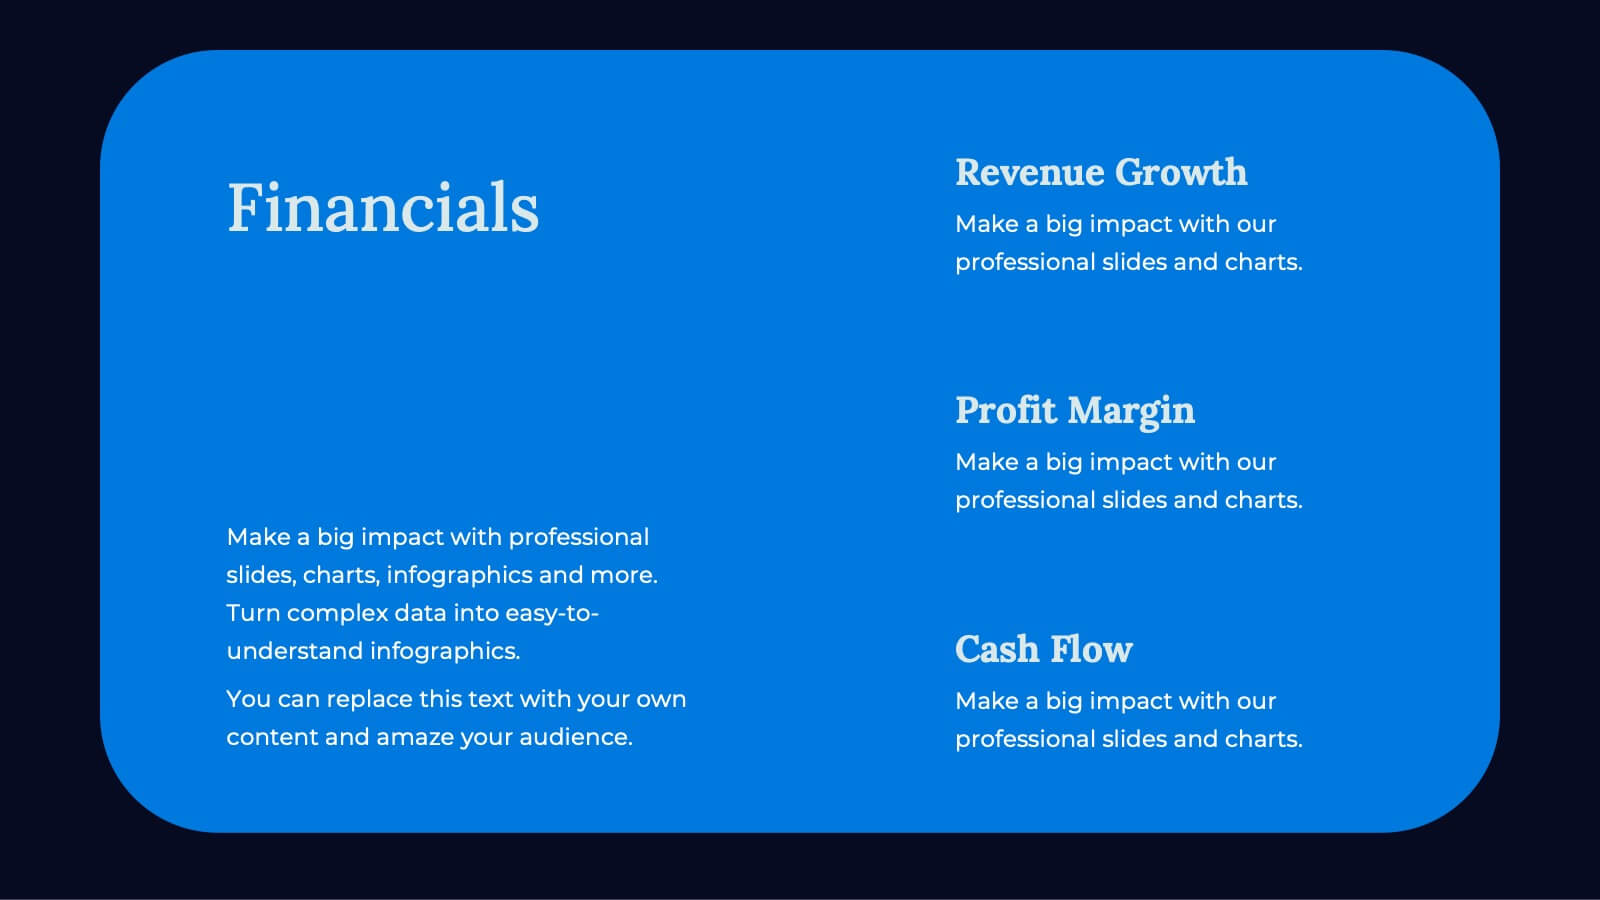
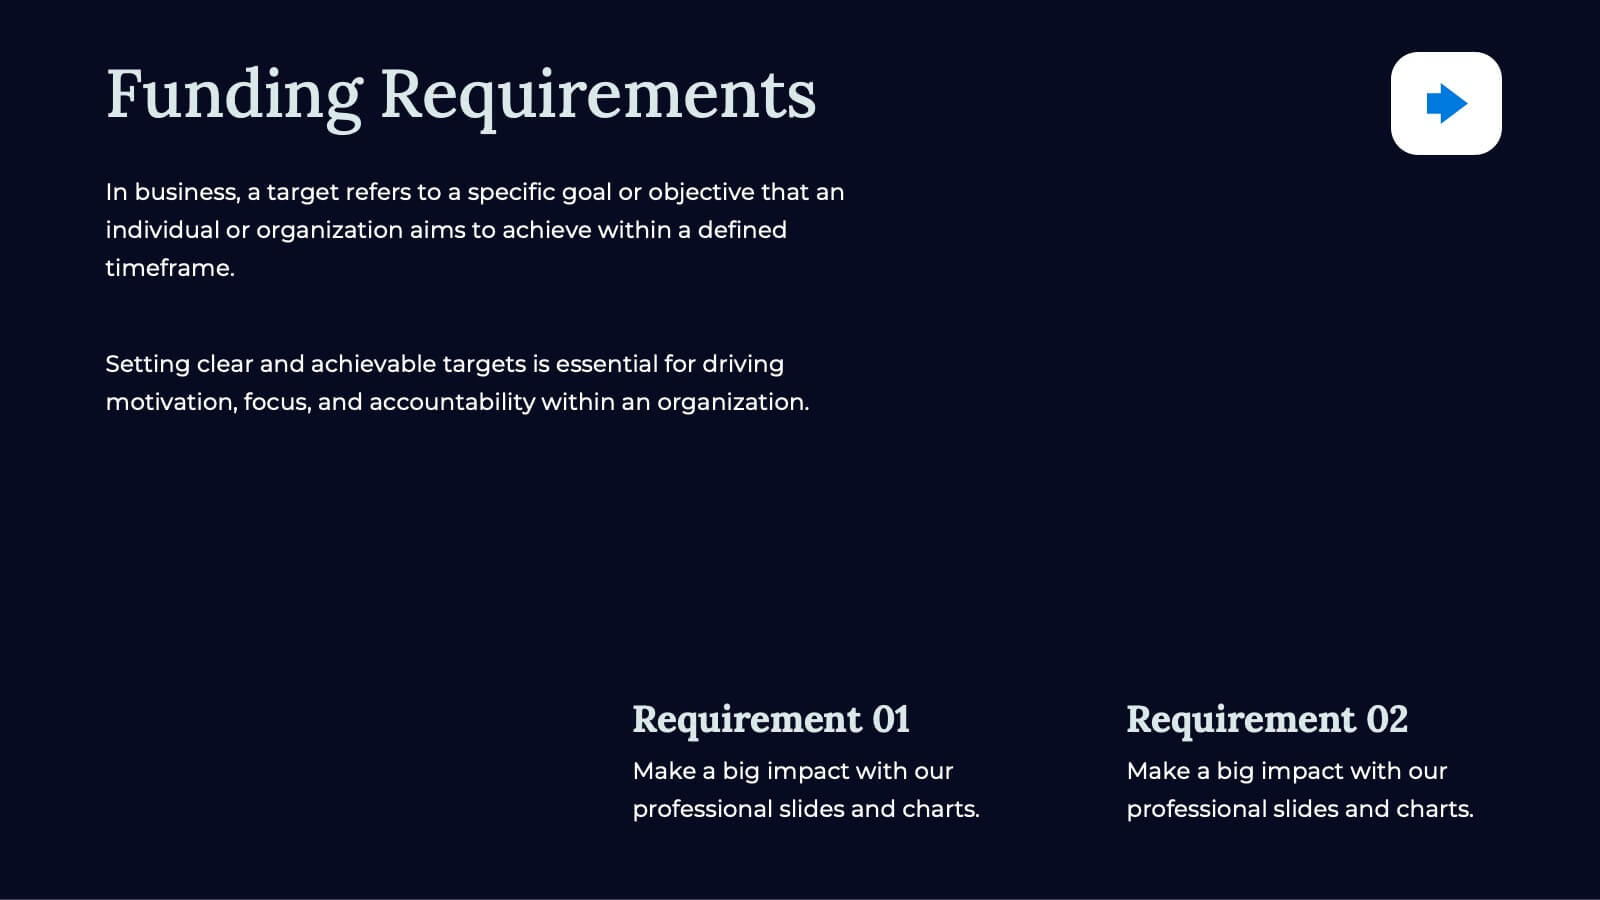
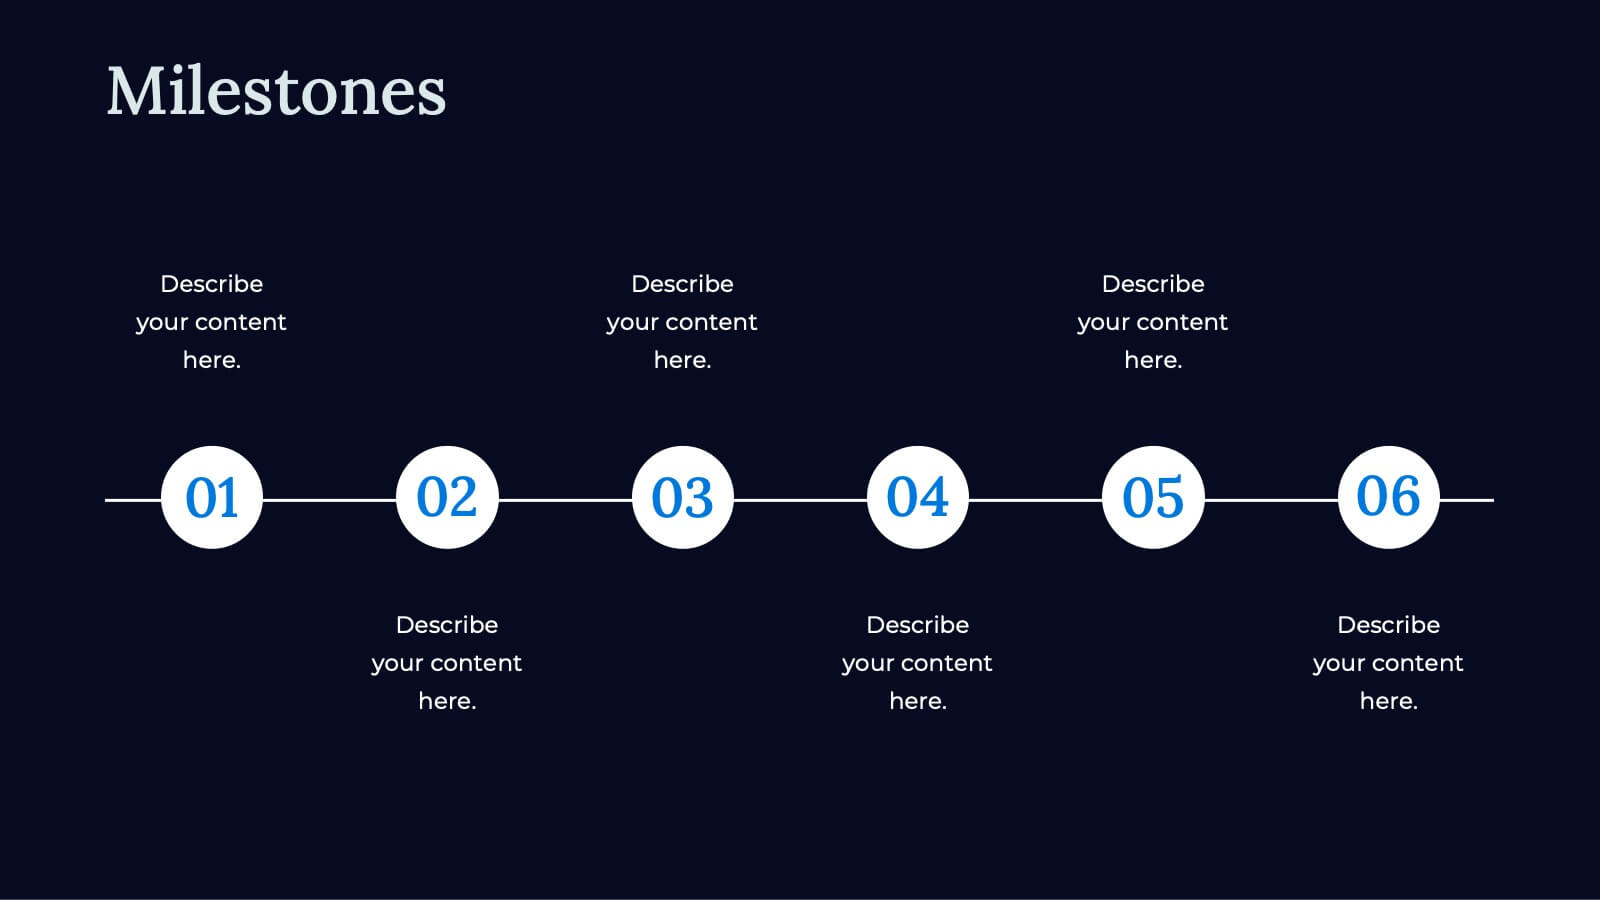
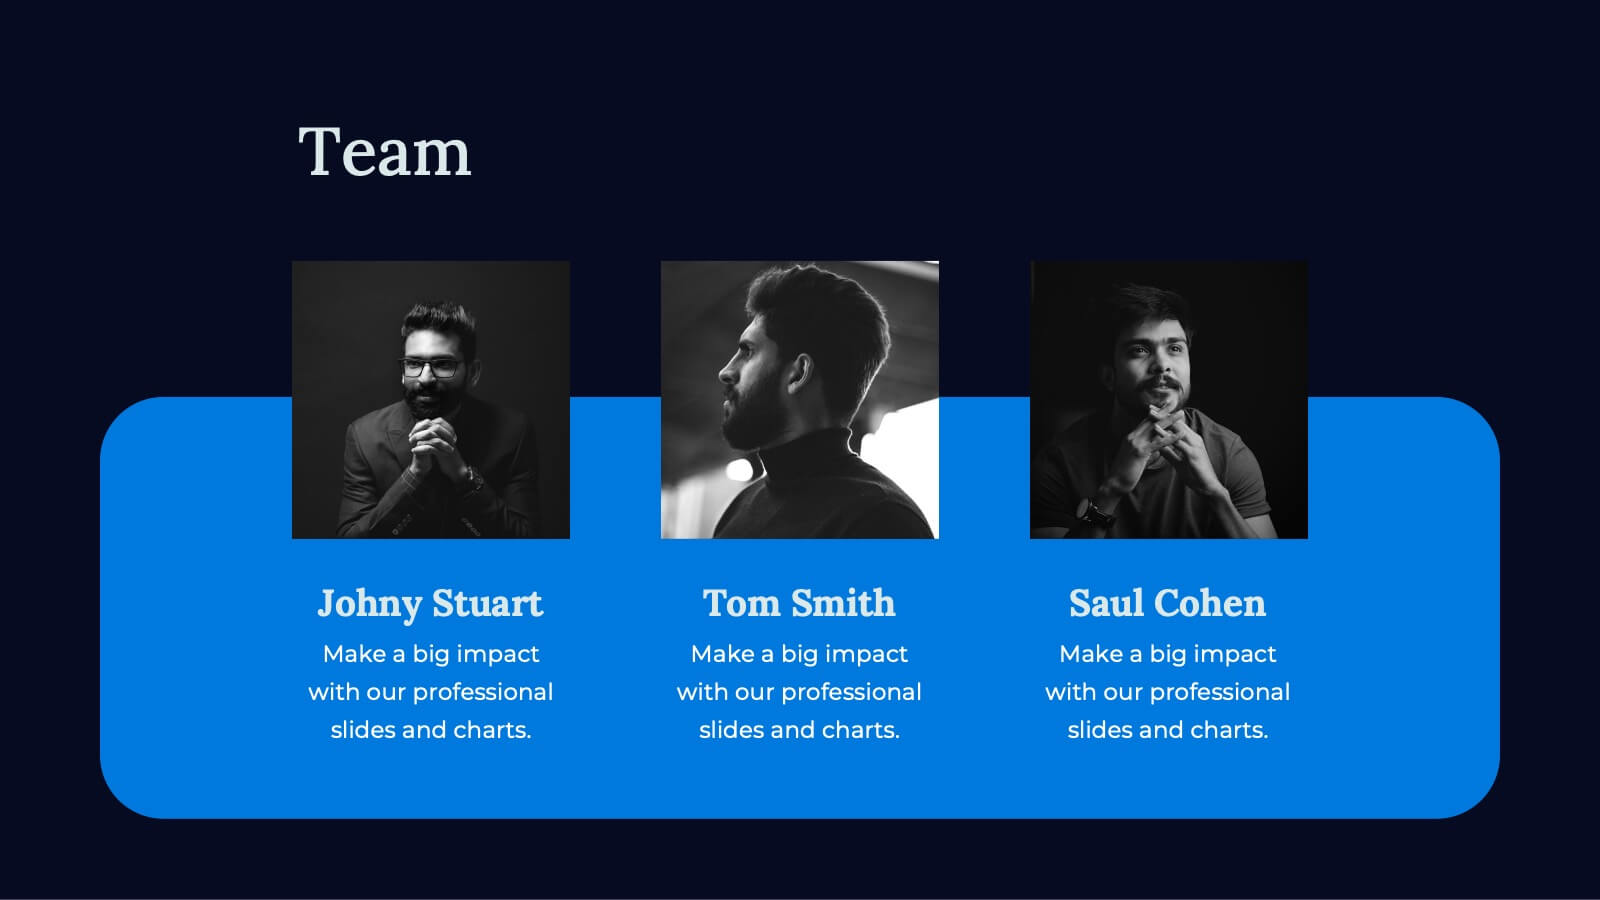
Apex Business Idea Pitch Deck Presentation
Craft powerful business pitch decks with this sleek template. Present your company overview, problem statement, solutions, and market opportunity. Showcase your business model, revenue model, competitive landscape, and unique selling proposition. Perfect for highlighting financials, growth projections, and funding requirements. Compatible with PowerPoint, Keynote, and Google Slides. Impress investors and stakeholders with clear, concise, and visually appealing presentations.


4 diapositivas
Human Anatomy Infographic
Visualize internal body systems with clarity using this editable human anatomy slide. Ideal for educational, medical, or health-related topics, this layout helps present organs and body functions with precision. Fully customizable in PowerPoint, Keynote, and Google Slides—adjust labels, icons, and colors to fit your needs.


6 diapositivas
Framework Diagram Layout Presentation
Bring structure to your ideas with this sleek and modern presentation layout designed for clarity and flow. Perfect for visualizing systems, workflows, and strategic processes, it helps audiences grasp relationships between concepts effortlessly. Fully editable and compatible with PowerPoint, Keynote, and Google Slides for smooth customization and professional results.


7 diapositivas
Mission Statement Infographic
Present your organization's core values and goals with clarity using this collection of professionally designed slide templates. Each one is crafted to communicate key elements of your strategic vision effectively, combining aesthetic appeal with functional design to ensure your message resonates. Featuring a clean and professional layout, these slides emphasize the importance of your foundational principles. The balanced use of images and text is ideal for enhancing corporate presentations, stakeholder meetings, or team workshops. With various designs available, you can select the layout that best aligns with your branding and organizational ethos. These templates are fully customizable, allowing for adjustments in color, font, and imagery to perfectly articulate your core messages. They are an excellent tool for motivating your team, impressing stakeholders, and conveying the driving purpose behind your initiatives.


6 diapositivas
Organizational Objectives and Key Results Presentation
Showcase your strategic goals and measurable outcomes with the Organizational Objectives and Key Results template. Designed with a sleek radial key layout, it’s ideal for mapping priorities and tracking progress. Fully editable in Canva, PowerPoint, and Google Slides, allowing easy customization of colors, icons, and text to fit your objectives.


6 diapositivas
Value Delivery Framework Presentation
Turn your strategy into action with a clear, layered design that highlights how value flows through every stage of your process. Perfect for explaining organizational efficiency, performance models, or delivery systems. Fully editable and compatible with PowerPoint, Keynote, and Google Slides for easy, professional customization.


5 diapositivas
Pet Clinic Business Strategy Presentation
Enhance your pet clinic's approach with our Pet Clinic Business Strategy presentation template. This layout is expertly designed to outline your clinic’s key strategies and enhance your operational excellence, making it perfect for meetings, stakeholder presentations, and strategic workshops.


21 diapositivas
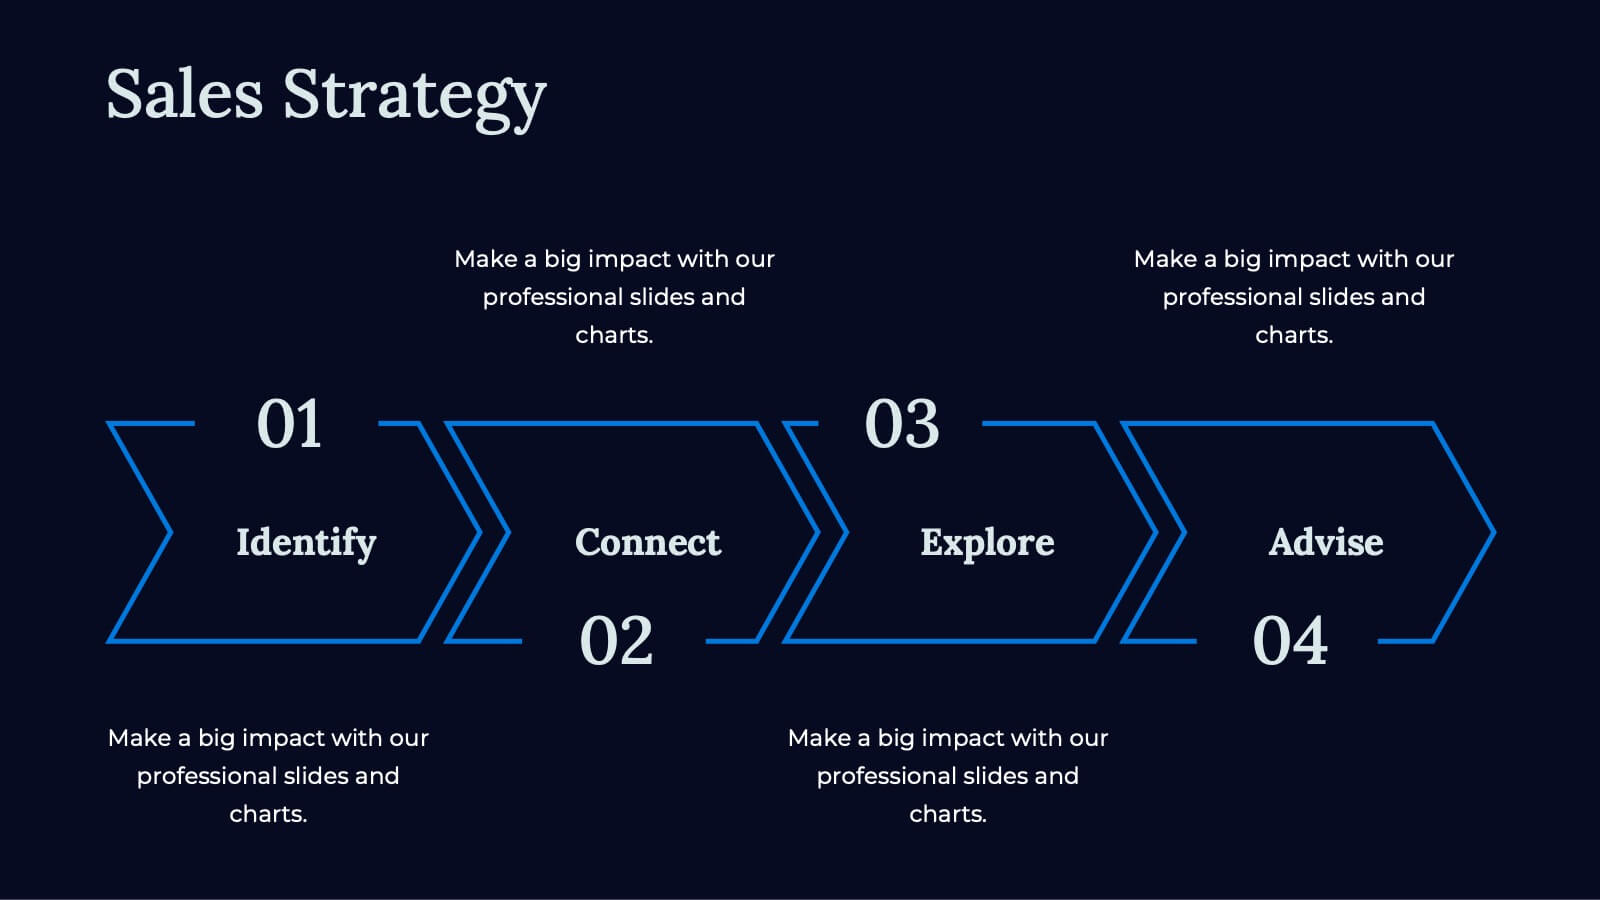
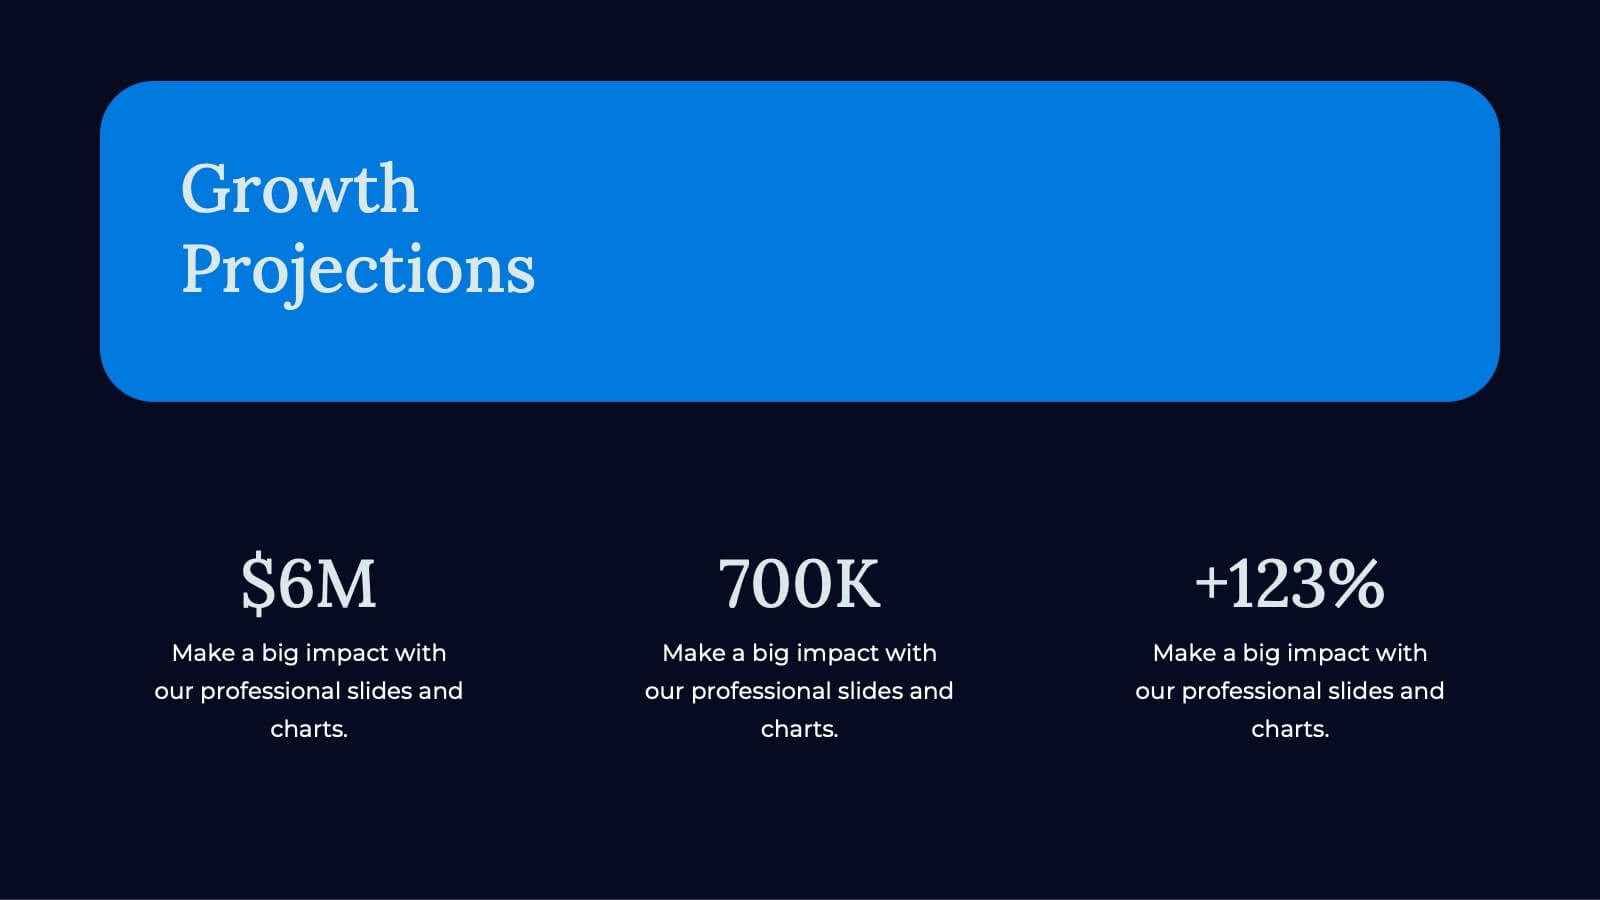
Cascade Marketing Proposal Template Presentation
Ignite your creativity with our dazzling Cascade Marketing Proposal Template Presentation! This captivating design brings your ideas to life, ensuring your presentation stands out. The sleek, dark theme is punctuated by electric blue accents, adding a modern, professional touch. Each slide is meticulously crafted, offering a perfect blend of visuals and content that keeps your audience engaged from start to finish. From the Company Overview to Growth Projections, every aspect of your pitch is highlighted with style and clarity. The template is fully customizable, allowing you to tailor it to your brand's identity effortlessly. Whether you're pitching to investors or presenting internally, this template has everything you need to make a lasting impression. Compatible with PowerPoint, Keynote, and Google Slides, it’s versatile and easy to use. Get ready to electrify your next presentation and leave your audience in awe!


22 diapositivas
Mistgrove Digital Agency Strategy Plan Presentation
Craft an impactful strategy for your digital agency with this sleek and professional presentation template. Highlight your agency's mission, vision, and services while showcasing success stories through client testimonials and case studies. Dive into essential sections like market analysis, industry trends, and competitive positioning to communicate a forward-thinking strategy effectively. This template includes dedicated slides for creative processes, strategy development, and campaign execution, ensuring you present your approach clearly and confidently. With options for measurement and analytics, future outlooks, and social impact initiatives, it empowers you to convey the value and growth potential of your strategies. Fully compatible with PowerPoint, Google Slides, and Keynote, this template offers seamless customization to align with your agency's unique brand identity and goals.


6 diapositivas
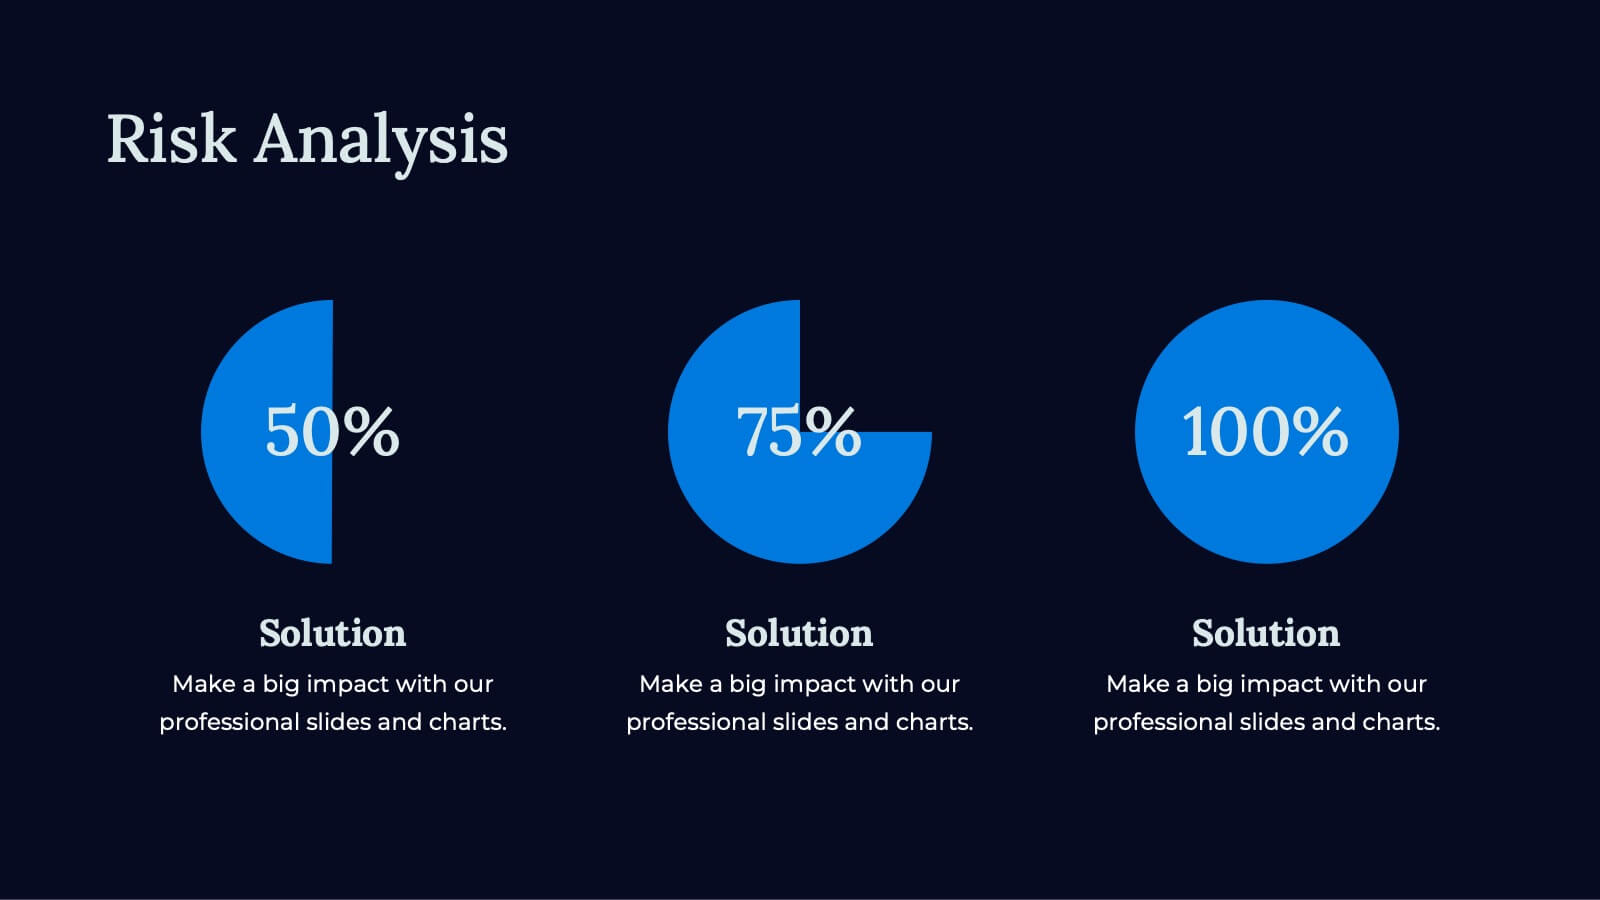
Information Security Risk Analysis Presentation
Identify weak points before they become real threats. This information security risk analysis template makes it easy to present cybersecurity vulnerabilities, data protection gaps, and action plans in a visual and professional way. Ideal for IT audits or strategy meetings. Fully editable in PowerPoint, Keynote, and Google Slides.


21 diapositivas
Flamelore Agile Project Plan Presentation
Organize and deliver your Agile Project Plan seamlessly with this dynamic presentation template. Designed to align with Agile principles, it features a comprehensive structure covering objectives, scope of work, and key deliverables. The template helps you outline a detailed project timeline and budget breakdown to keep stakeholders informed. Illustrate complex information with visual aids such as pyramids, charts, and process diagrams, making data interpretation effortless. Highlight team members, their roles, and responsibilities to foster transparency and accountability. With slides dedicated to risk assessment and evaluation criteria, you can confidently navigate potential challenges. This fully editable template works across PowerPoint, Google Slides, and Keynote, providing flexibility and a polished design for project managers, teams, and business professionals. Whether you're pitching to stakeholders or aligning your team, this Agile framework ensures clear communication and actionable steps.