


Características


¿Tienes alguna pregunta?
Recomendar


6 diapositivas
Performance Metrics and Review
Visualize your progress and business insights clearly with this metrics-driven presentation. Featuring 3D-style chart visuals and structured text layouts, this template is perfect for KPI reports, project reviews, and quarterly updates. Fully editable in PowerPoint, Keynote, and Google Slides for seamless customization.


6 diapositivas
Adapting to Change in Business Presentation
Effectively illustrate business adaptability with this dynamic domino-effect slide. Designed to visually represent cause-and-effect relationships, this template is ideal for change management, business strategy, and risk assessment presentations. The falling blocks symbolize challenges, interventions, and strategic adjustments to drive impactful decision-making. Fully editable—customize colors, text, and layout to match your needs. Compatible with PowerPoint, Keynote, and Google Slides for seamless use.


10 diapositivas
Corporate Sustainability Goals Planning
Drive environmental impact with clarity using the Corporate Sustainability Goals Planning Presentation. This clean, circular infographic helps communicate sustainability initiatives, eco-objectives, and long-term strategy with ease. Perfect for ESG reports, internal goal tracking, or stakeholder updates. Fully editable in PowerPoint, Keynote, and Google Slides.


4 diapositivas
Professional Business Meeting Agenda Presentation
Efficiently structure your next corporate gathering with the "Professional Business Meeting Agenda" presentation template. Its geometrically appealing layout organizes discussion points in a visually captivating manner, encouraging effective communication and engagement. Perfect for strategizing sessions, this template ensures that every item on your agenda is highlighted with clarity. Compatible across PowerPoint, Keynote, and Google Slides, it’s designed to make every meeting more productive.


5 diapositivas
Business Influence Stakeholder Analysis
Highlight influence and interest with this layered stakeholder analysis pyramid. Designed for strategic presentations, this layout categorizes engagement levels—Pull Communications, Push Communications, Consultant, Participation, and Partnership—across a 3D stacked model. Ideal for stakeholder mapping, influence management, and communication strategy planning. Fully editable in PowerPoint, Keynote, and Google Slides.


6 diapositivas
Competitive Research and Strategy Review Presentation
Present your market insights with clarity using the Competitive Research and Strategy Review Presentation. This puzzle-style layout is ideal for showing strategic steps or comparing research points in sequence. Fully editable in Canva, PowerPoint, Keynote, and Google Slides, it’s perfect for marketing teams, business analysts, and strategy consultants.


4 diapositivas
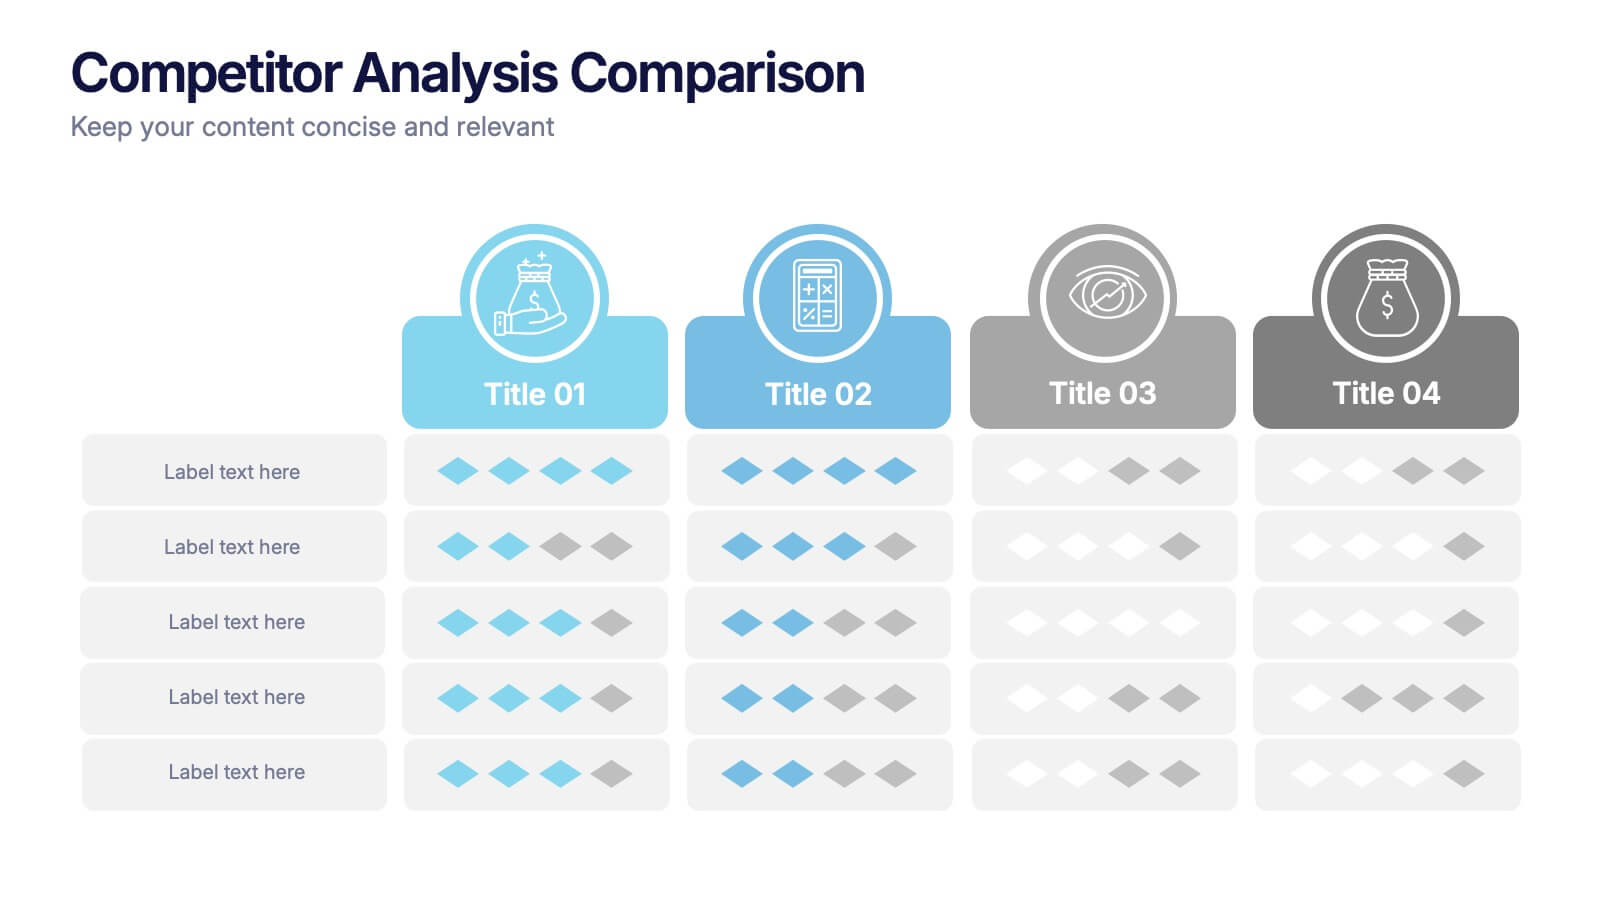
Competitor Analysis Comparison Presentation
Quickly evaluate strengths and weaknesses across your market landscape with this Competitor Analysis Comparison Presentation. Featuring clean tables, icons, and rating visuals, it's ideal for highlighting where your brand stands out. Fully editable in PowerPoint, Keynote, and Google Slides.


5 diapositivas
Cryptocurrency Market Infographic
Cryptocurrency Infographics can help explain the benefits and risks of investing in cryptocurrency, as well as provide valuable information about different types of crypto and their market trends. You can use this infographic to cover a range of topics related to cryptocurrencies, such as its history, how they work, the different types of crypto, the advantages and disadvantages, and the potential risks and challenges associated with investing. This fully customizable template feature eye catching color schemes along with icons and diagrams to illustrate complex concepts related to cryptocurrencies.


6 diapositivas
Organizational Goals and SMART Objectives Presentation
Align your business vision with clarity using this Organizational Goals and SMART Objectives slide. Designed to visually represent each SMART component—Specific, Measurable, Achievable, Relevant, and Time-bound—it helps communicate strategic goals in a simple and effective format. Fully editable in Canva, PowerPoint, and Google Slides for maximum flexibility.


21 diapositivas
Karma Design Portfolio Presentation
Step into the spotlight with this bold and contemporary design portfolio! It presents your creative work in a sleek, visually striking format. From featured projects to your creative process and collaborations, this portfolio will leave a lasting impression. Perfect for showcasing your design style on PowerPoint, Keynote, or Google Slides!


10 diapositivas
Business Expansion and Growth Path Presentation
Illustrate your company’s strategic milestones with the Business Expansion and Growth Path Presentation. This step-by-step layout is perfect for showcasing phases of development, scaling goals, or startup growth trajectories. Fully customizable in PowerPoint, Keynote, and Google Slides—ideal for business plans, pitch decks, and strategic reviews.


5 diapositivas
Marijuana Cultivation Infographics
Marijuana cultivation refers to the process of growing and cultivating marijuana plants for various purposes, primarily for medicinal or recreational use. These vertical infographics are designed to provide essential information about the cultivation of marijuana. It offers an in-depth overview of the cultivation process, growing techniques, equipment, and best practices. The template outlines the step-by-step cultivation process of marijuana, starting from seed germination to harvesting and drying. It includes visuals and icons to illustrate each stage, making it easy to understand for beginners and everyone.


7 diapositivas
Business Networking Strategy Presentation
Build strong business connections with this Business Networking Strategy template. Featuring a circular segmented diagram, this slide helps illustrate key networking approaches, strategic partnerships, and relationship-building techniques in an easy-to-understand format. Ideal for entrepreneurs, business developers, and corporate leaders, this fully editable slide is compatible with PowerPoint, Keynote, and Google Slides.


4 diapositivas
Buyer Persona Research and Profile Map Presentation
Make your audience feel like they already know your ideal customer. This creative template helps you visually map out key buyer persona data, such as demographics, goals, behavior, and pain points. Perfect for marketing strategy and customer research presentations. Fully compatible with PowerPoint, Keynote, and Google Slides for seamless editing.


3 diapositivas
Business Ethics and Legal Guidelines Presentation
Navigate the complexities of corporate governance with the "Business Ethics and Legal Guidelines" template, designed to simplify and clarify the presentation of legal standards and ethical expectations in business environments.This visually engaging layout helps emphasize the progression and importance of each principle, ensuring clarity in communication. Ideal for training modules, compliance meetings, or strategic planning sessions, it's compatible with PowerPoint, Keynote, and Google Slides.


4 diapositivas
Root Cause Analysis Fishbone Presentation
Pinpoint problems efficiently with this Root Cause Analysis Fishbone template. Designed to help you identify and visualize causes clearly, it’s perfect for process improvement and team brainstorming. Fully editable and easy to use in PowerPoint, Keynote, and Google Slides for maximum flexibility across your workflow.


7 diapositivas
Construction Jobs Infographic
Construction jobs refer to various roles and professions within the construction industry involved in planning, designing, building, and maintaining structures such as buildings, roads, bridges, dams, and other infrastructures. This infographic template sheds light on various career opportunities within the construction industry, offering a roadmap for aspiring professionals. Compatible with Powerpoint, Keynote, and Google Slides. With this infographic you're not just exploring careers; you're navigating a landscape of opportunities, ready to build a successful career in the dynamic world of construction.