


Características


¿Tienes alguna pregunta?
Recomendar


23 diapositivas
Ethelin Digital Strategy Presentation
The digital strategy presentation template is designed to showcase your company's goals, market analysis, and strategic initiatives. Featuring slides for SWOT analysis, performance metrics, and action plans, it’s perfect for business planning and stakeholder engagement. Fully customizable and compatible with PowerPoint, Keynote, and Google Slides.


7 diapositivas
Urban Ecology Illustrated Infographics
Ecology is the scientific study of the interactions between organisms and their environment. This ecology template will help you explain the science behind our world. This is great for anyone who is presenting information about ecology, environment, or sustainability. You can use this infographic as is or customize it by changing the colors and fonts of each slide. You can also add your own images, and text by downloading in Powerpoint, Keynote, or Google Slides. This Template comes with a wealth of key facts and figures on eco-friendly living and presents them in an infographic style.


8 diapositivas
RACI Matrix Role Assignment Presentation
The "RACI Matrix Role Assignment" presentation template is designed to clarify role responsibilities in project management contexts. Each slide presents a clear visual breakdown of who is responsible, accountable, consulted, and informed (RACI) for each task within a project. This approach helps in preventing overlap and ensuring all team members are clear about their roles and responsibilities, promoting more effective communication and project management.


5 diapositivas
Artificial Intelligence Tools Infographics
Artificial Intelligence has advanced rapidly in recent years, leading to the development of various tools and technologies that leverage AI algorithms and techniques. These vertical infographics highlight various tools and technologies used in the field of AI. This template provides an engaging way to showcase different AI tools and their functionalities. This features a sleek and contemporary design that captures attention. The combination of vibrant colors, high-quality icons, and visuals adds a modern touch to the infographics. The template offers multiple slides that provide an overview of AI and its technologies.
26 diapositivas
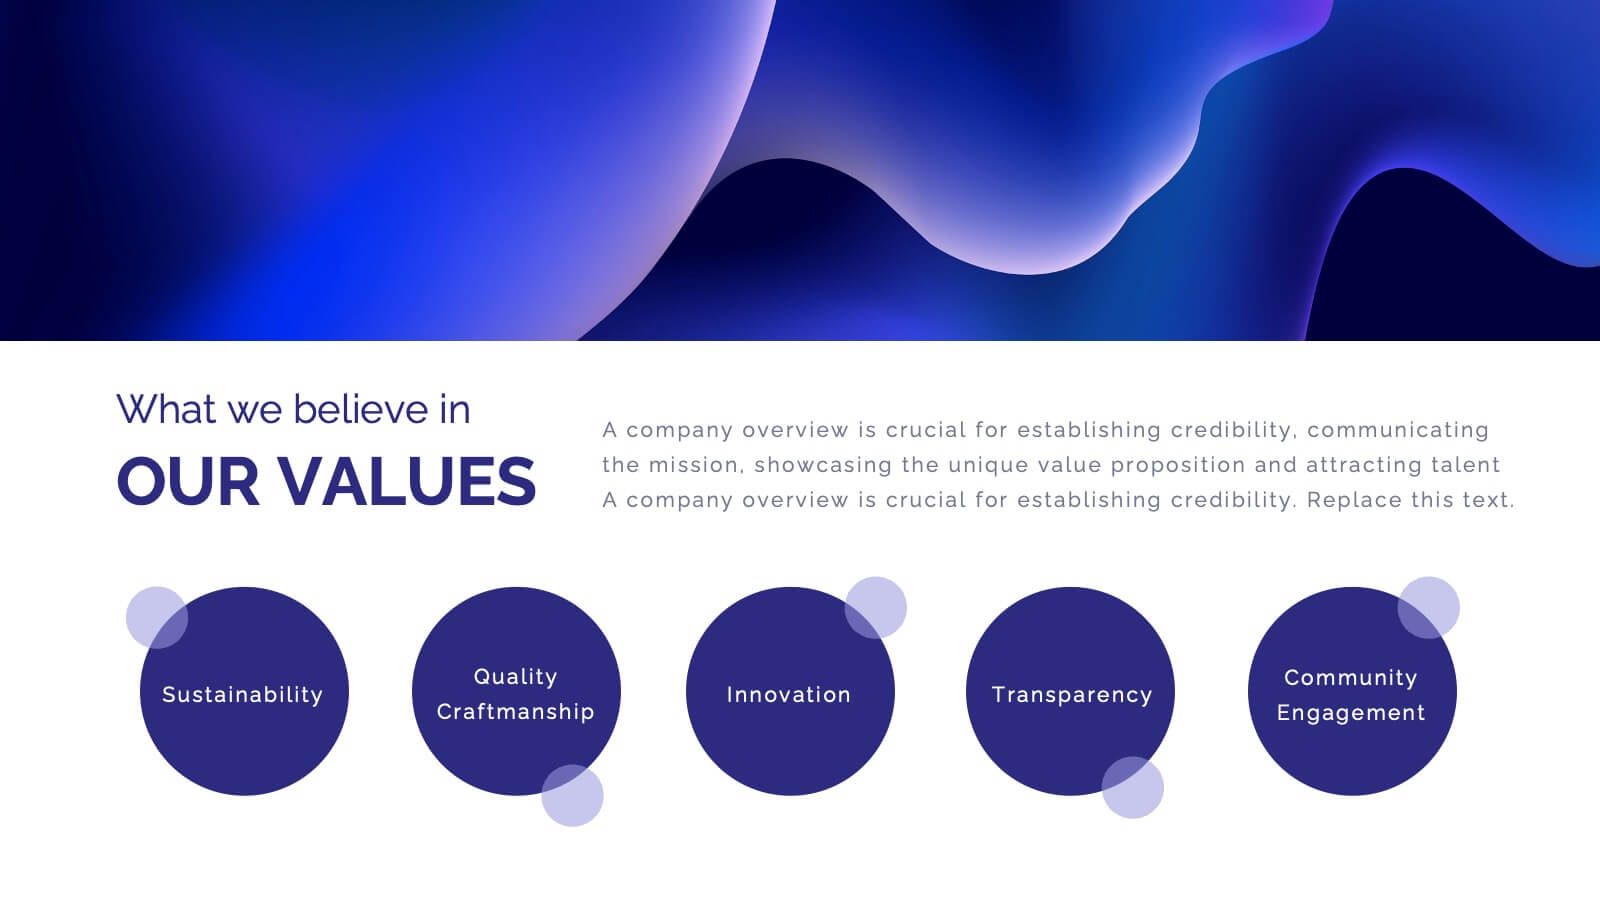
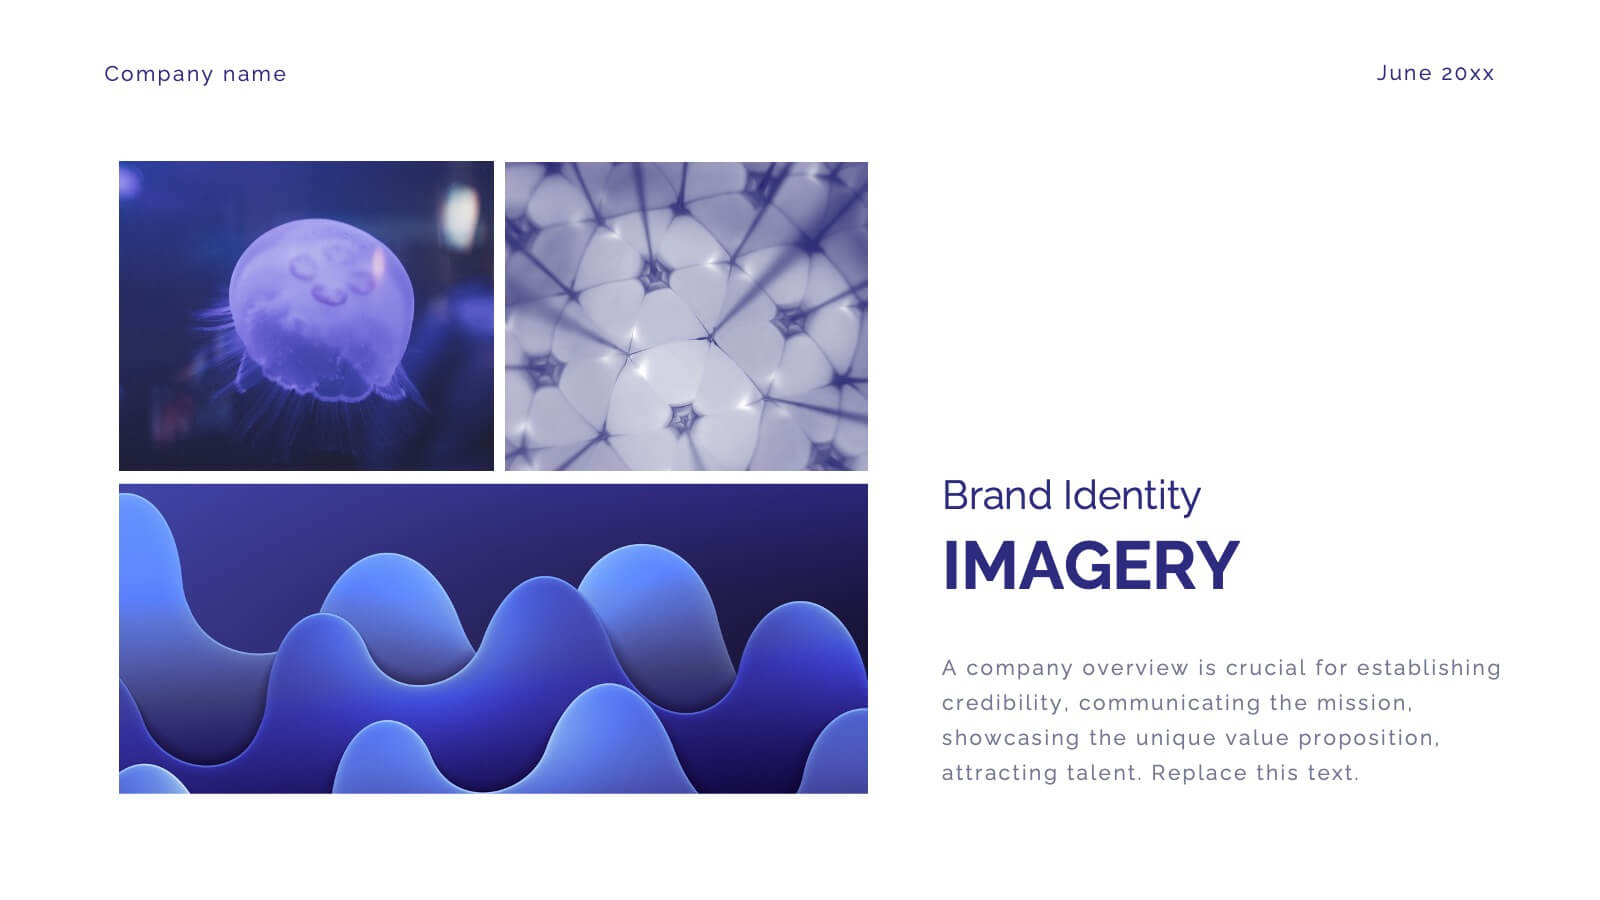
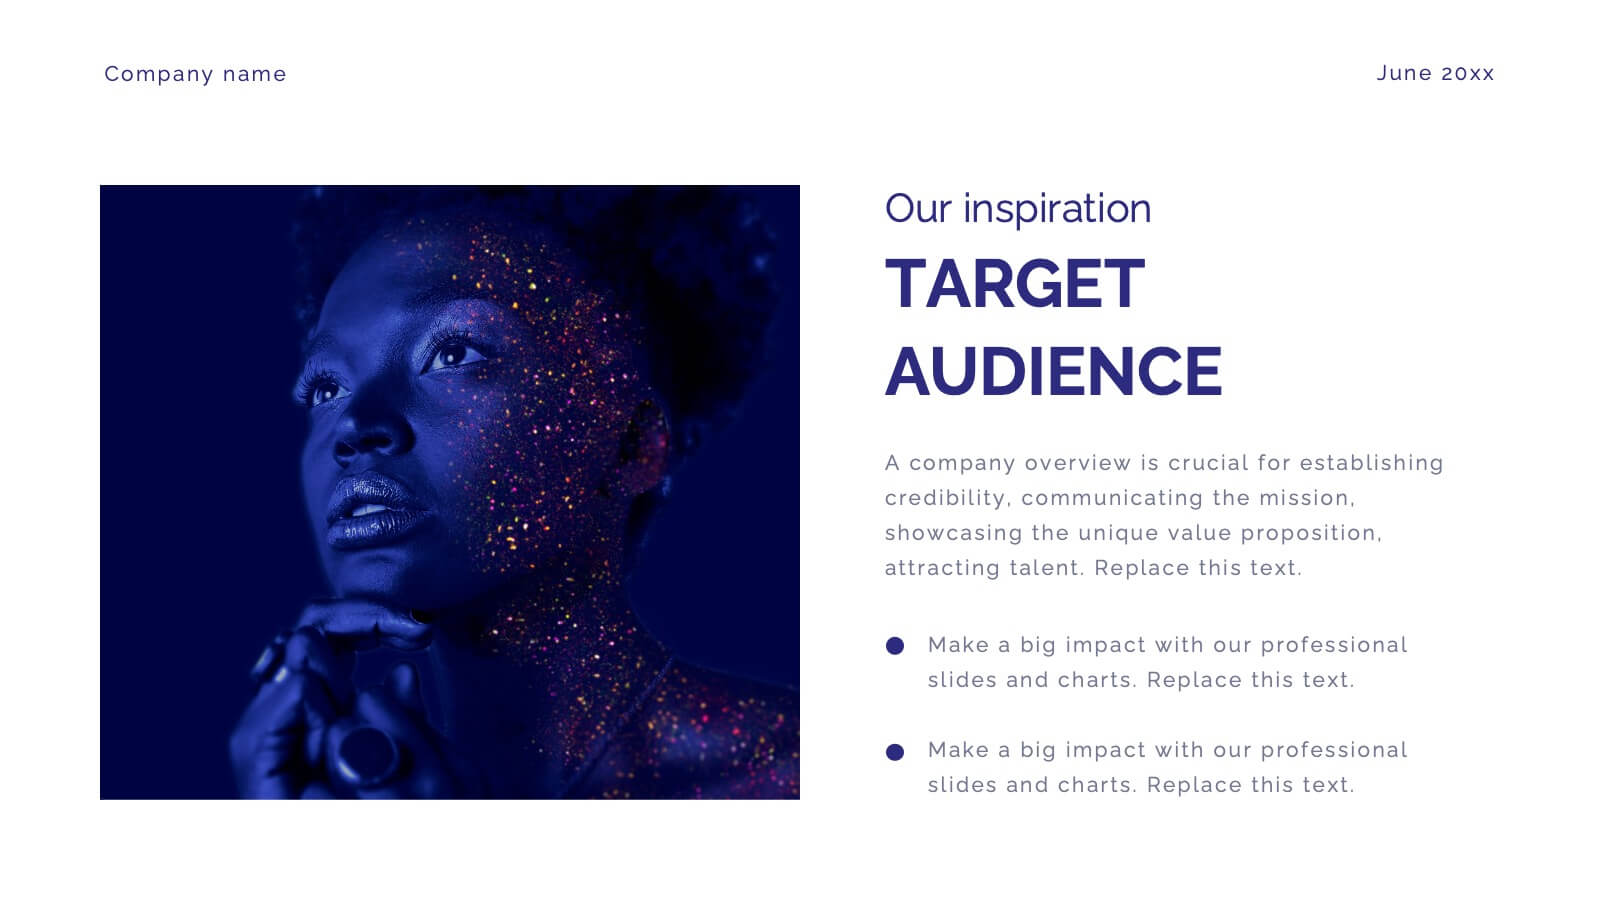
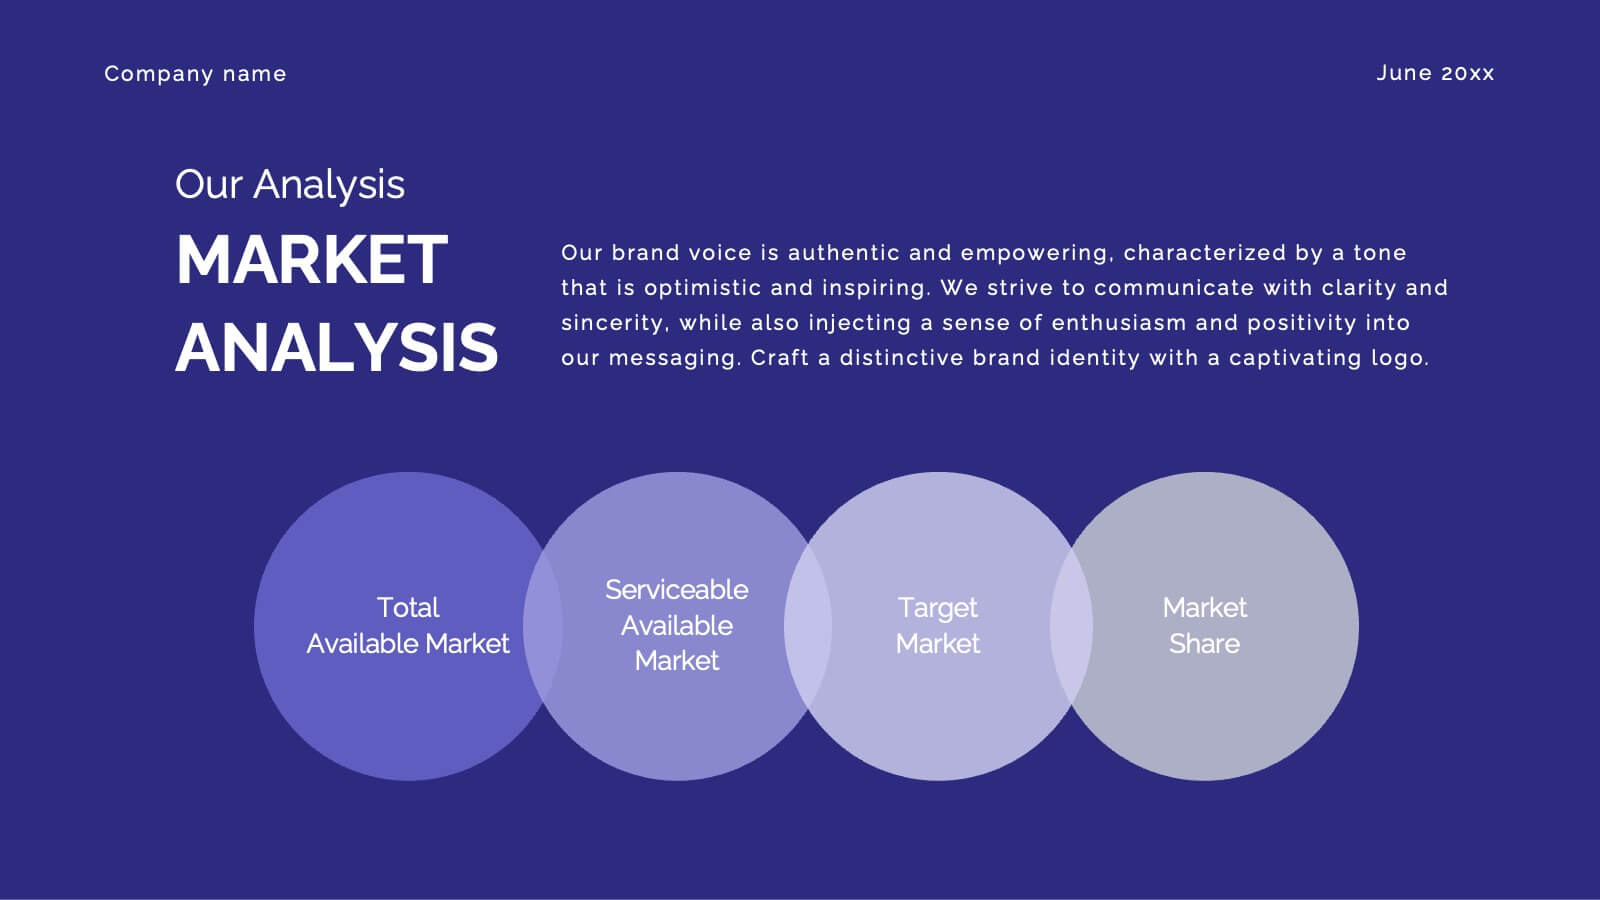
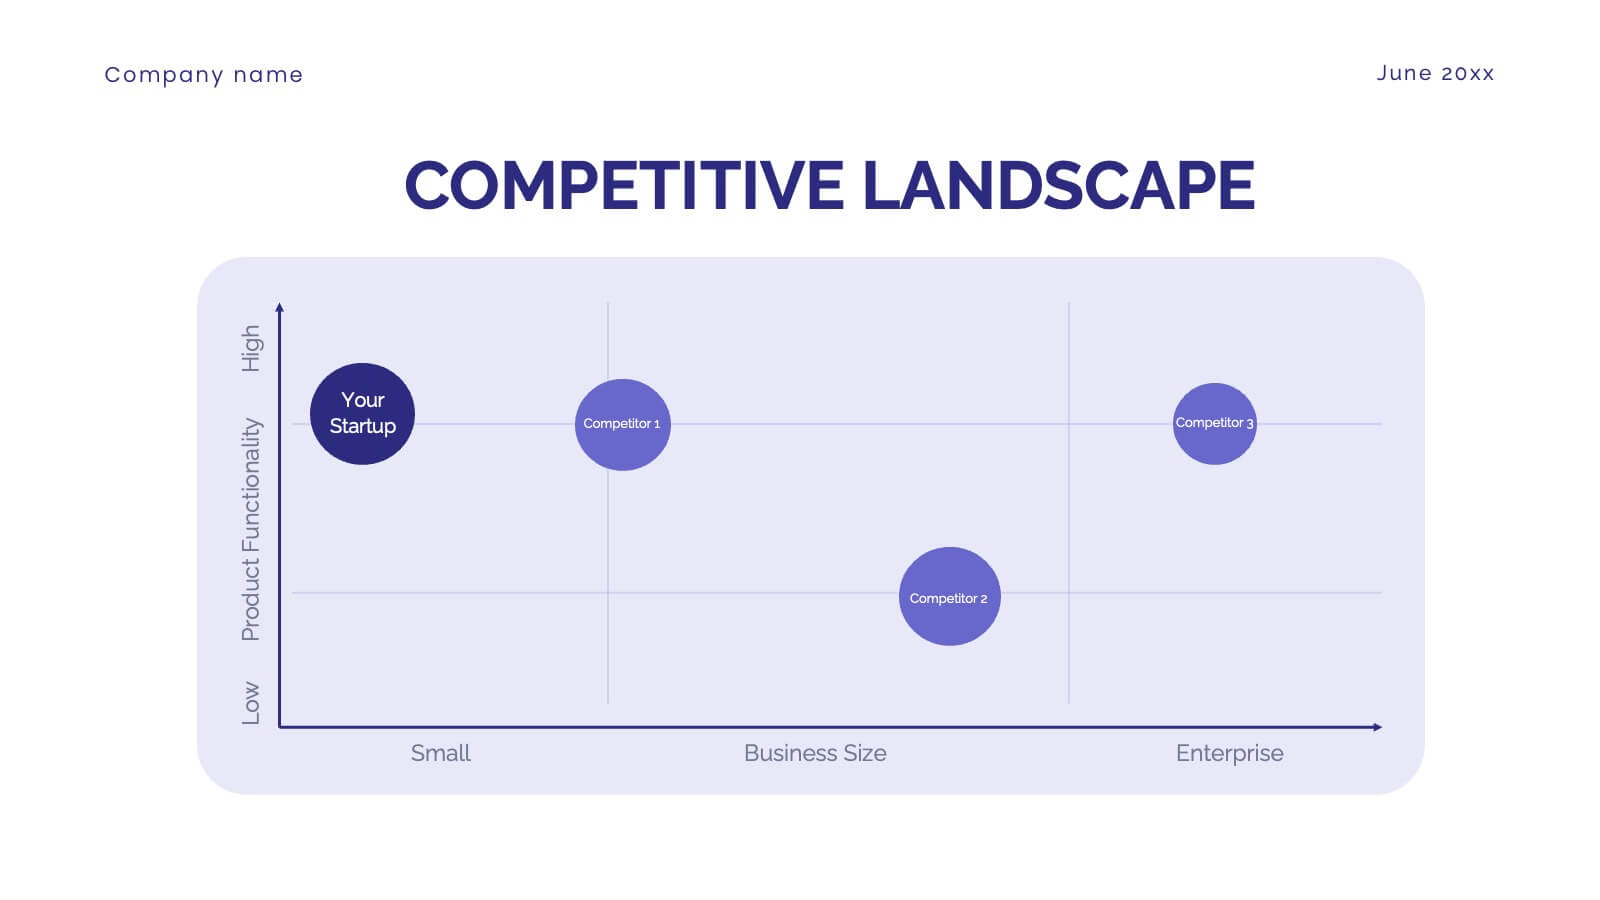
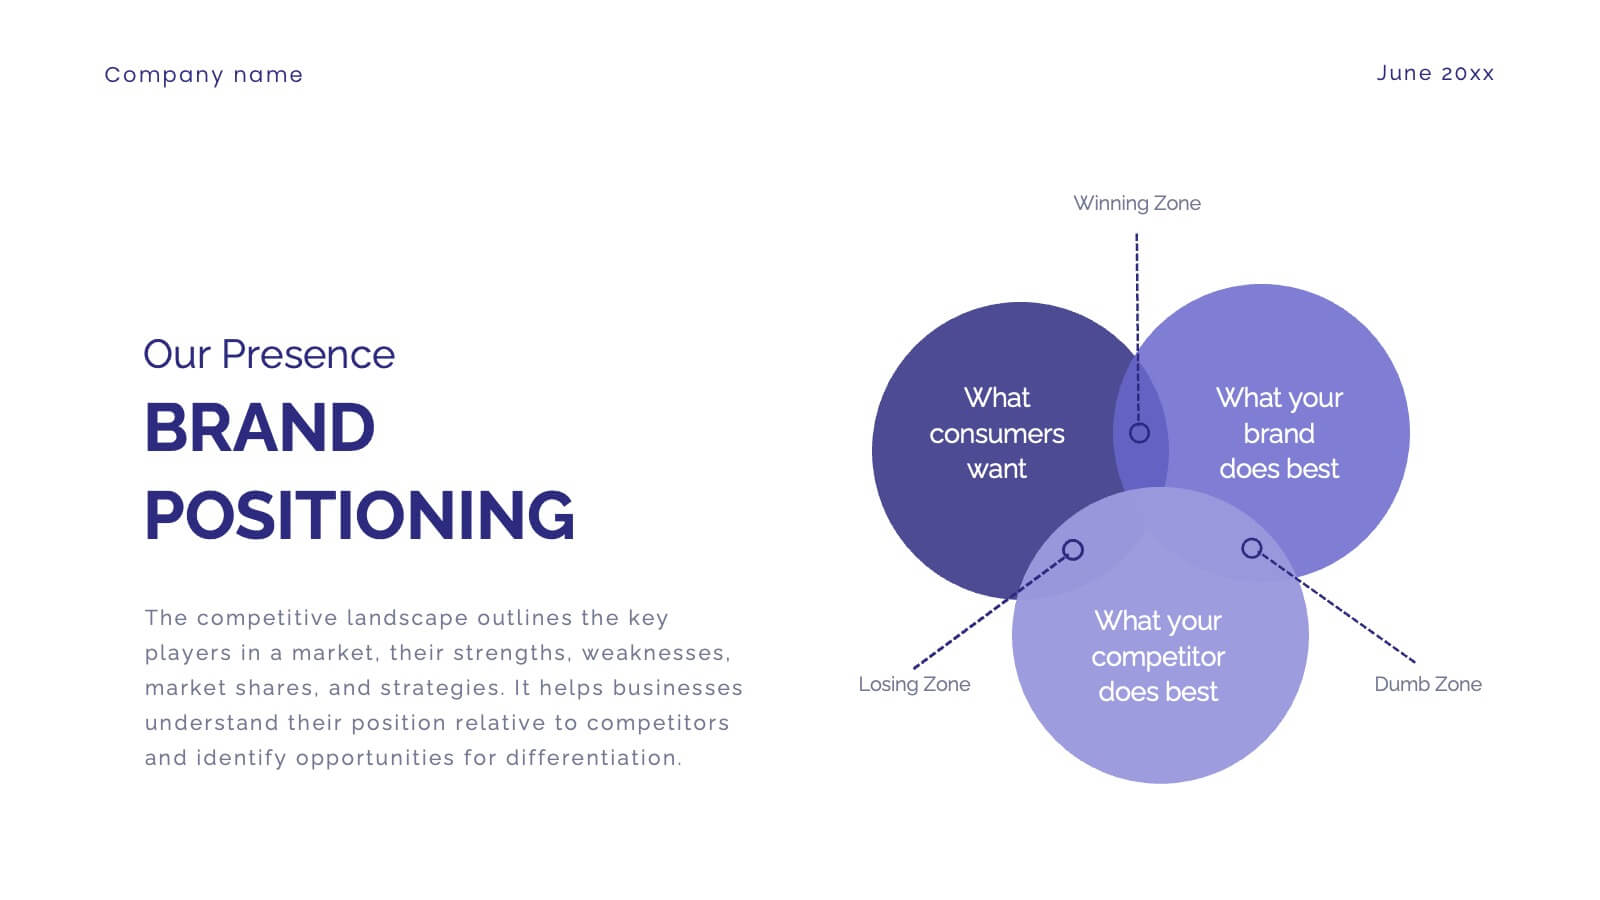
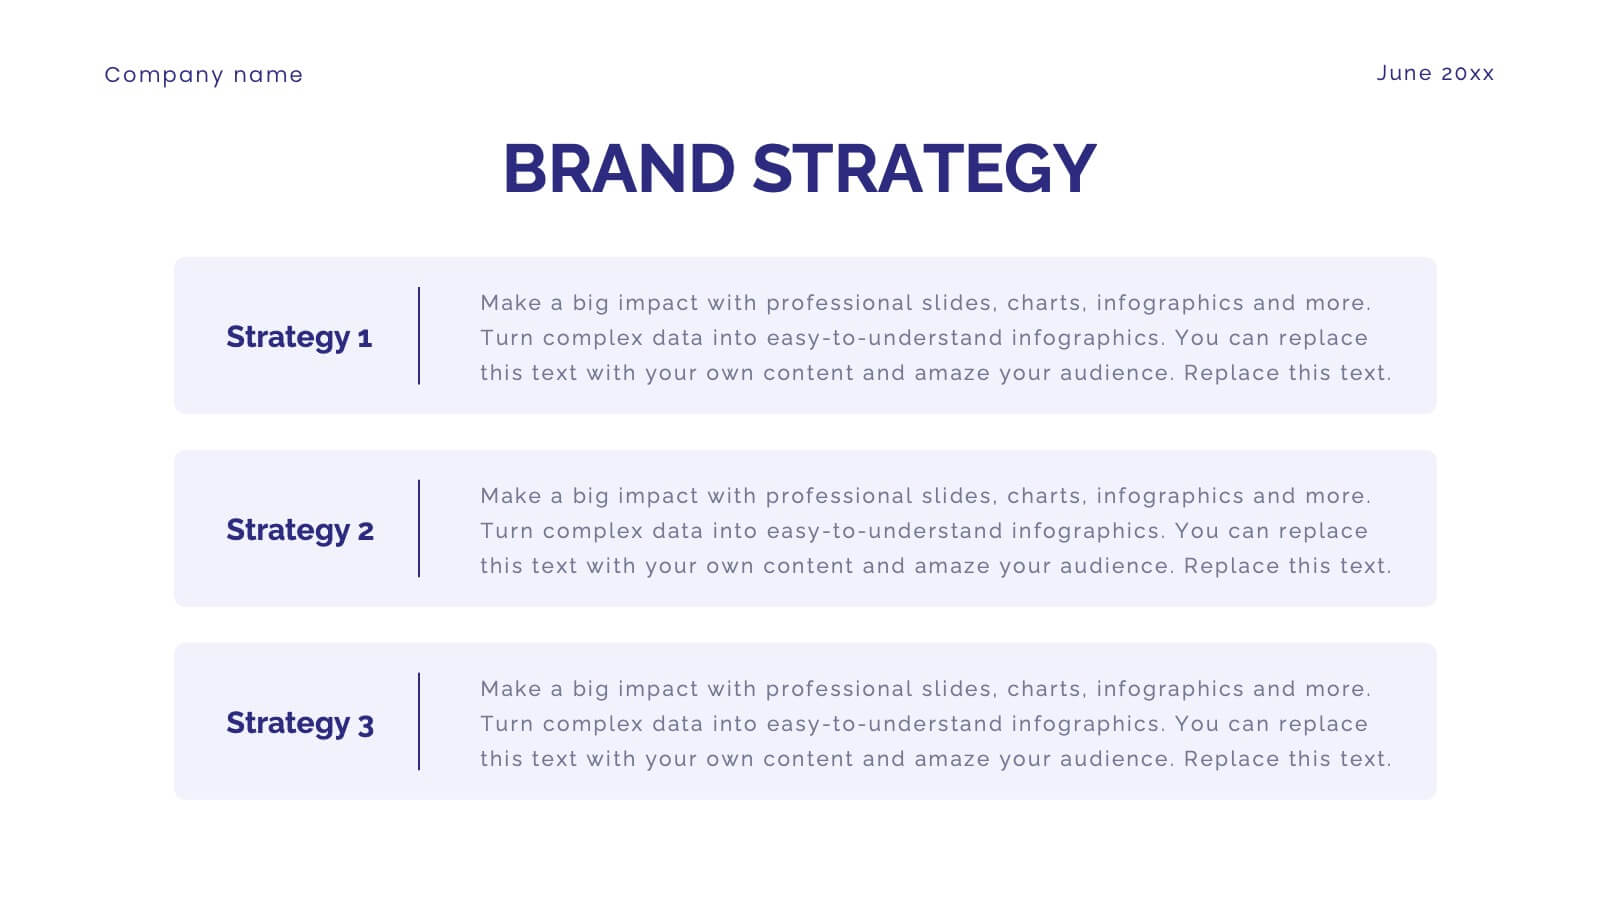
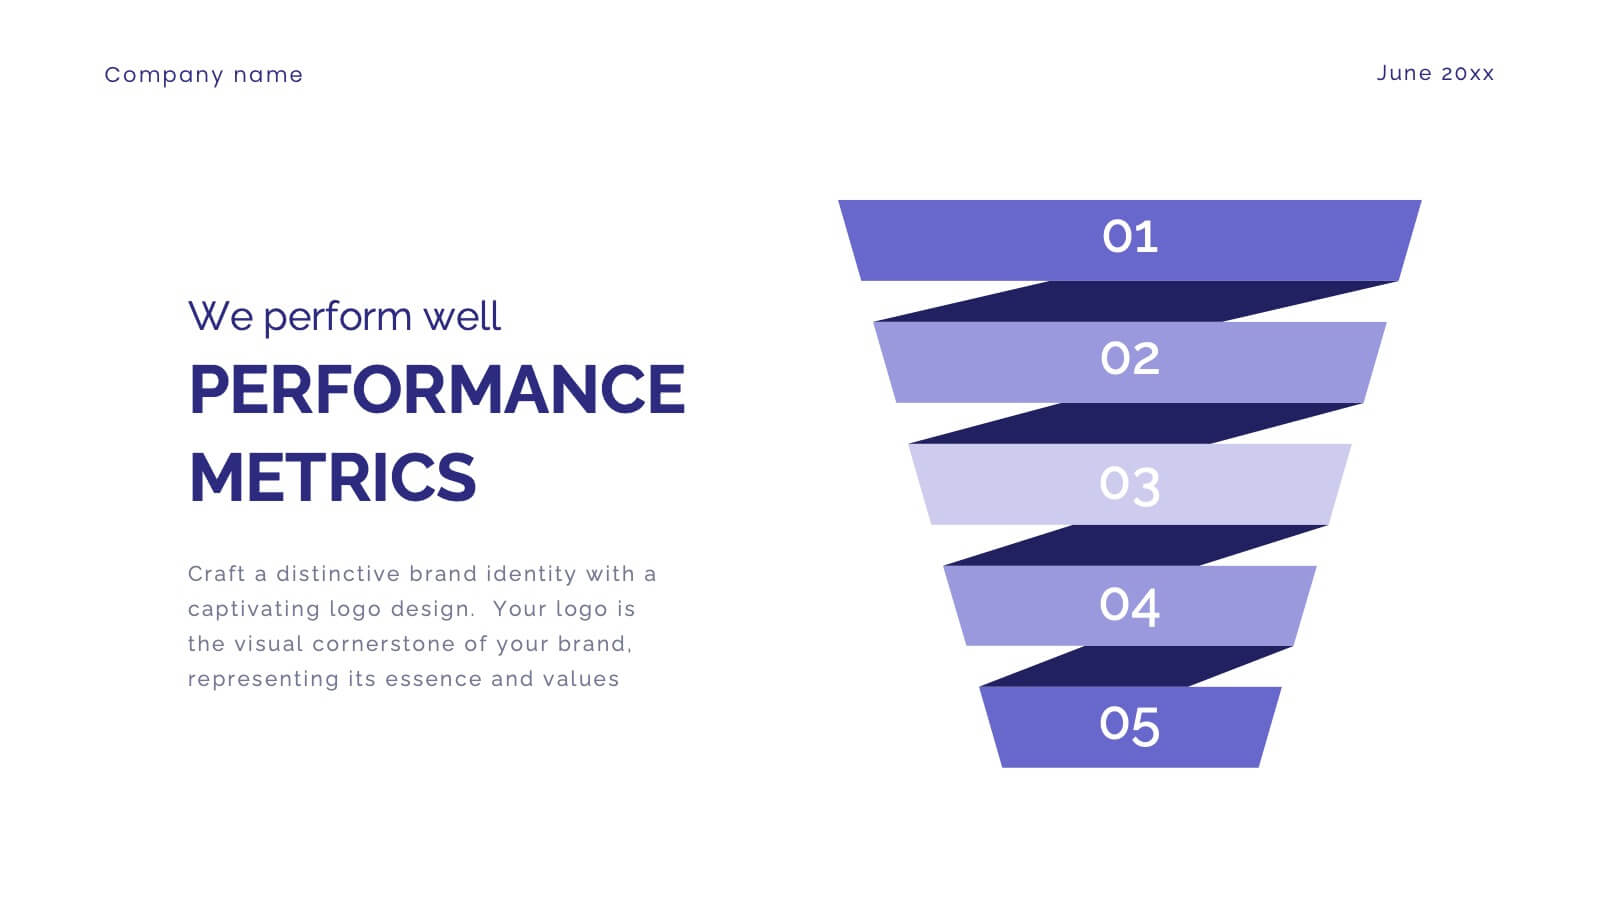
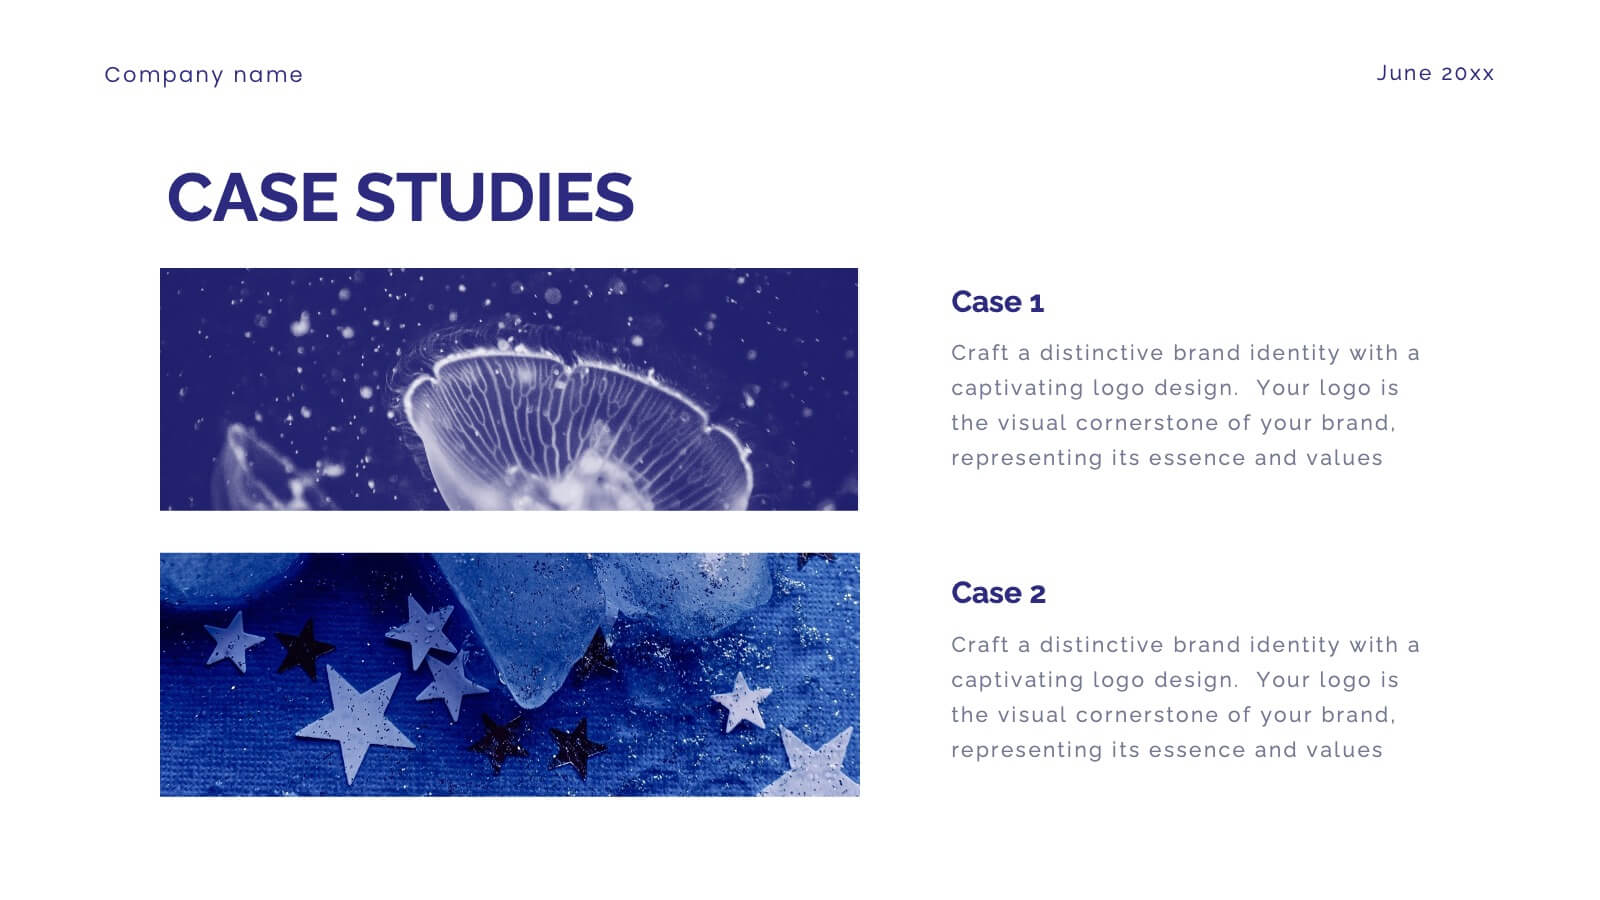
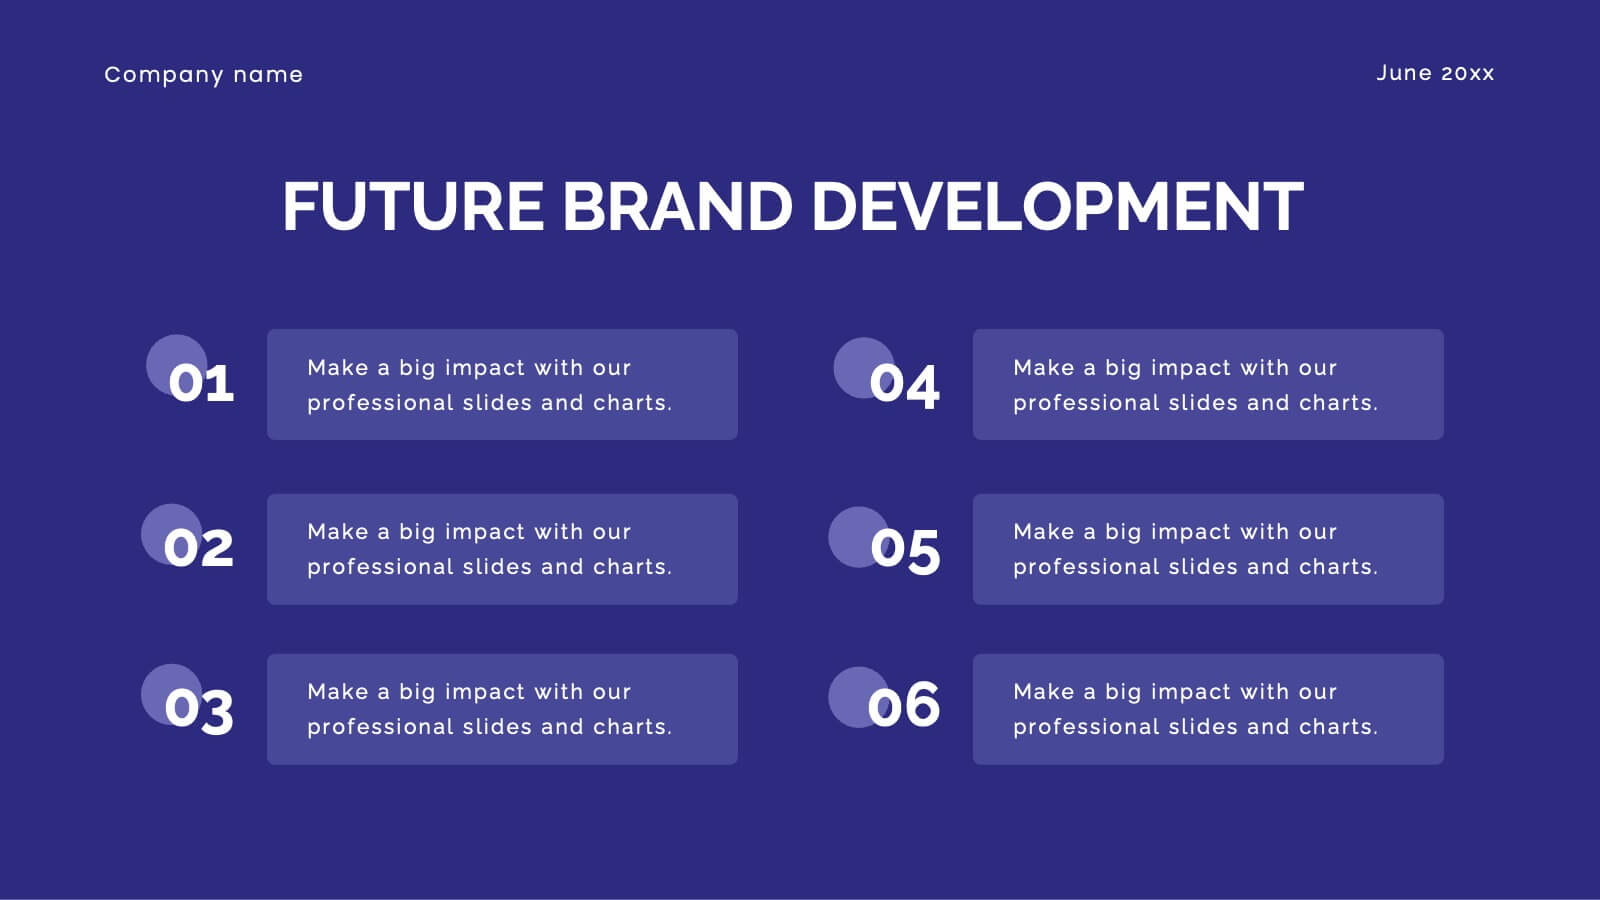
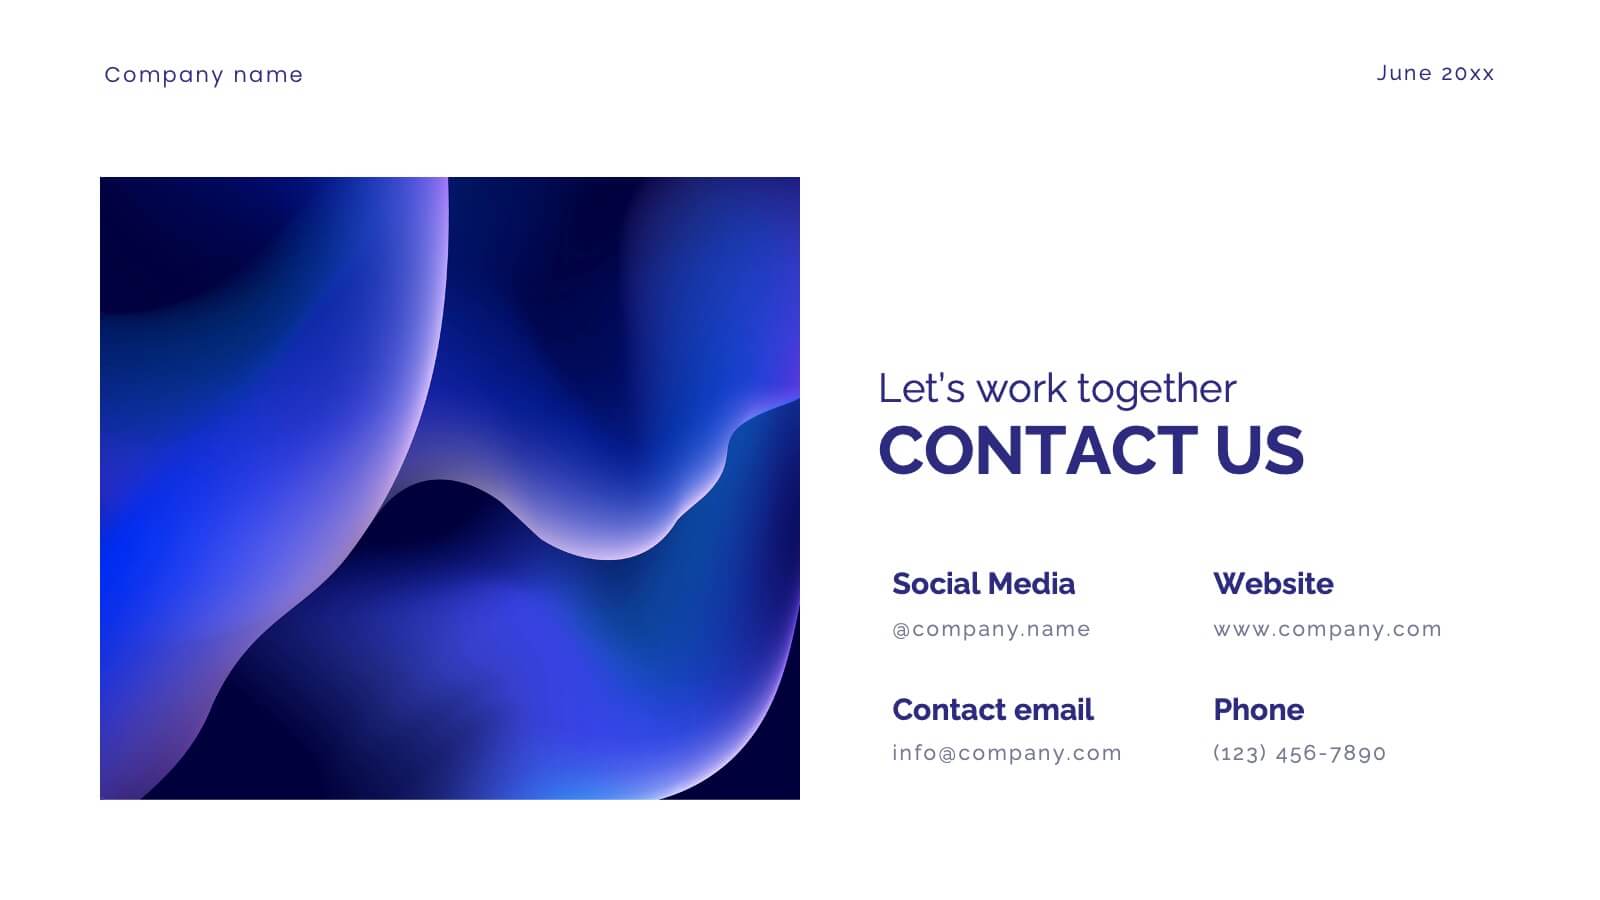
Glimmer Brand Development Pitch Deck Presentation
Elevate your brand with this comprehensive rebranding presentation template! Perfect for detailing your logo, color scheme, and market analysis, it includes slides for brand positioning, competitive landscape, and performance metrics. Engage your audience with clear visuals and structured content. Compatible with PowerPoint, Keynote, and Google Slides for seamless presentations on any platform.


6 diapositivas
Modern 3D Infographic Presentation
Add a fresh, dimensional twist to your data storytelling with this clean and modern pyramid layout. Ideal for showcasing layered structures, hierarchical information, or process stages, it’s designed to make your visuals pop. Fully editable and compatible with PowerPoint, Keynote, and Google Slides for easy customization.


4 diapositivas
Harvey Ball Ratings Presentation
Make your evaluations stand out with this sleek and intuitive presentation design. Perfect for rating performance, comparing metrics, or visualizing customer feedback, it brings clarity and visual balance to your data. Easily editable and fully compatible with PowerPoint, Keynote, and Google Slides for a smooth, professional presentation experience.


7 diapositivas
Africa Colonization Map Infographic
Embark on a historical exploration with our meticulously designed Africa colonization map infographic. Colored with the earthy green, the profound blue, the intense red, and the radiant yellow, our template serves as a vivid chronicle of Africa's colonial past. Detailed with sharp infographics, emblematic icons, and region-specific image placeholders, it provides a comprehensive overview of colonial footprints across the continent. Expertly adapted for Powerpoint, Keynote, or Google Slides. An invaluable tool for historians, educators, or anyone delving into the complex colonial history of Africa. Traverse with understanding; let each slide unveil a chapter of Africa's storied past.


3 diapositivas
Business Report Summary Slides Presentation
Kick off your report with a slide that feels clean, modern, and effortlessly clear. This presentation helps you summarize key insights, highlight performance updates, and present essential findings in a structured, visual format. It’s ideal for monthly reviews, strategy reports, and stakeholder updates. Fully compatible with PowerPoint, Keynote, and Google Slides.


26 diapositivas
Warm Tones Real Estate Presentation
Create an engaging and inviting Warm Tone Real Estate presentation with this easy to use template. The color scheme of this welcoming template features warm tones to set the mood for a peaceful, natural environment. The cover slide features emerald green and brown, while the next two slides use warmer brown, tan shades, keeping the same theme going. Fully customizable, this template is ready to help you sell and promote properties quickly and easily. This layout is perfect for showcasing properties with a premium feel that’ll inspire confidence in both buyers and sellers alike.


7 diapositivas
Marketing Funnel Infographic
Chart your customers' journey with our marketing funnel infographic. Set on a pristine white canvas, enriched with the zest of orange, the insight of purple, the trust of blue, and the growth of green, this template vividly illustrates the stages of a customer's progression towards a purchase. Adorned with clear infographics, emblematic icons, and tailored image placeholders, it offers a panoramic view of conversion pathways. Expertly devised for Powerpoint, Keynote, or Google Slides. A prized possession for marketing professionals, digital strategists, business consultants, or any brand striving for conversion optimization.


26 diapositivas
Navigating the Creative Industry Presentation
Unlock the secrets to success in the creative industry with this dynamic and visually engaging presentation. Covering essential topics like career pathways, industry trends, collaboration strategies, and personal branding, this template helps you present insights with clarity and impact. Fully customizable and compatible with PowerPoint, Keynote, and Google Slides for a seamless experience.


4 diapositivas
Organizational Mission Strategy Presentation
Stand tall with this mountain-themed layout—perfect for showcasing the pillars of your organizational mission strategy. Each peak represents a strategic objective or core value, guiding your team toward a shared goal. Fully compatible with PowerPoint, Keynote, and Google Slides.


12 diapositivas
SMART Goal Setting Presentation
Achieve clarity and focus with this SMART Goal Setting Presentation template. Featuring a visually engaging target and color-coded SMART framework, this slide helps break down objectives into Specific, Measurable, Attainable, Relevant, and Timely components. Perfect for business planning, project management, and personal development. Compatible with PowerPoint, Keynote, and Google Slides.


5 diapositivas
Business Strategy Infographic
A Business Strategy Infographic is a visual representation of a company's plan for achieving its long-term objectives. This infographic template includes charts, graphs, icons, illustrations, and texts that can help people understand and grasp the key points of a business strategy presentation. The colors, fonts, and layout are fully customizable making it easy to stay consistent with your company branding and style guidelines. Use this to provide an overview of your organization's mission, goals, competitive advantage, target market, products or services, and the tactics used to achieve success.


7 diapositivas
Customer Thank You Infographic
Elevate your expressions of gratitude with this sophisticated collection, designed to blend elegance with heartfelt thanks. Each piece in this set is crafted with meticulous attention to detail, featuring a mix of subtle color palettes, elegant typography, and beautifully arranged visual elements to enhance the sincerity of your message. Choose from a variety of designs, ranging from minimalist to more richly layered compositions, each providing a unique way to communicate appreciation. These designs can be customized to suit any occasion, making them perfect for expressing professional thanks to clients, customers, or partners. Ideal for use across both digital and physical mediums, this collection helps ensure that your messages not only convey thanks but also resonate deeply with recipients, strengthening relationships and leaving a memorable impression.


6 diapositivas
Team Work Environment Infographic
A team work environment refers to the conditions and culture within a group of individuals who come together to work collaboratively on a common goal or project. This infographic template highlights the importance of teamwork and fosters a positive team-oriented workplace culture. The design emphasizes the key elements and benefits of a collaborative work environment, encouraging employees to work together effectively and efficiently. This infographic features illustrations that depict employees working together, collaborating, and supporting one another. This reinforces the idea of teamwork and unity within the organization.