


Características


¿Tienes alguna pregunta?
Recomendar

20 diapositivas
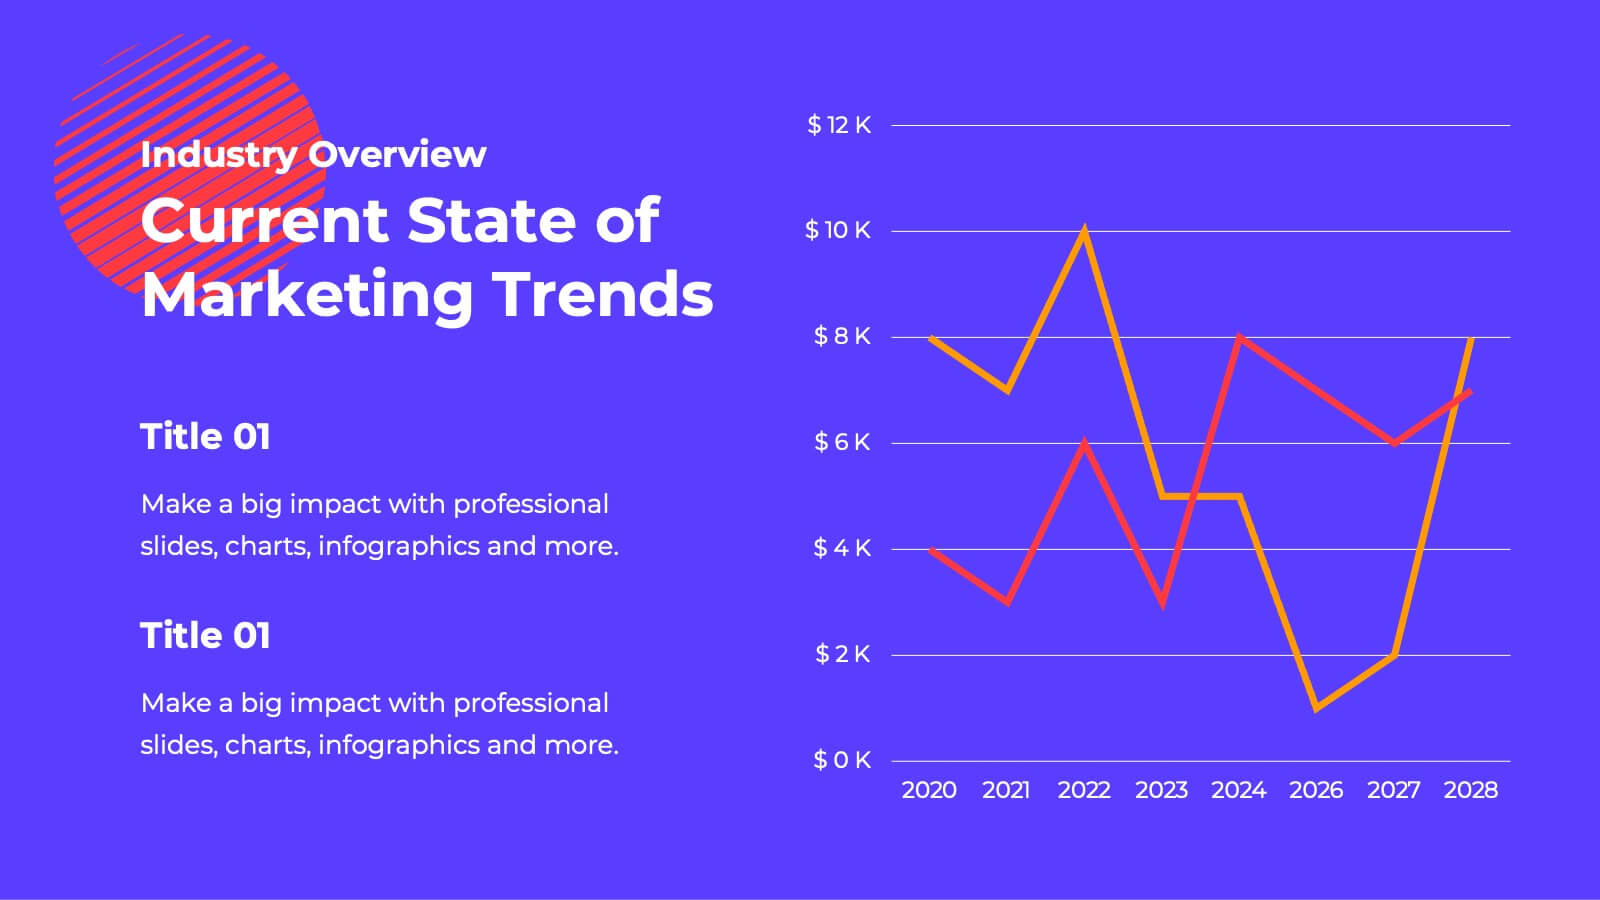
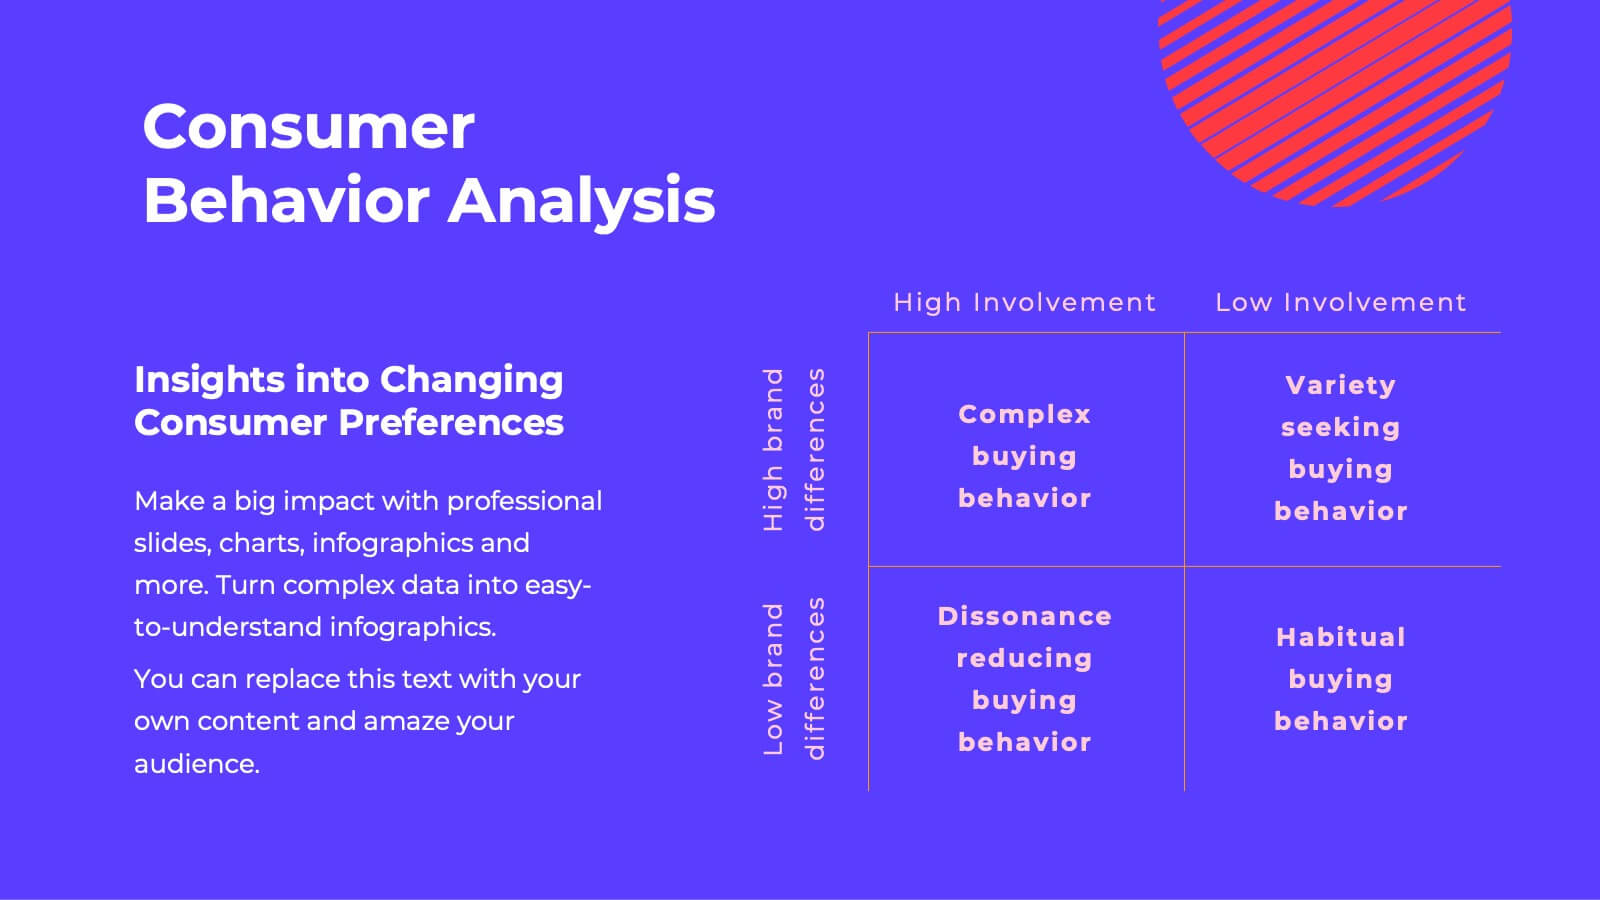
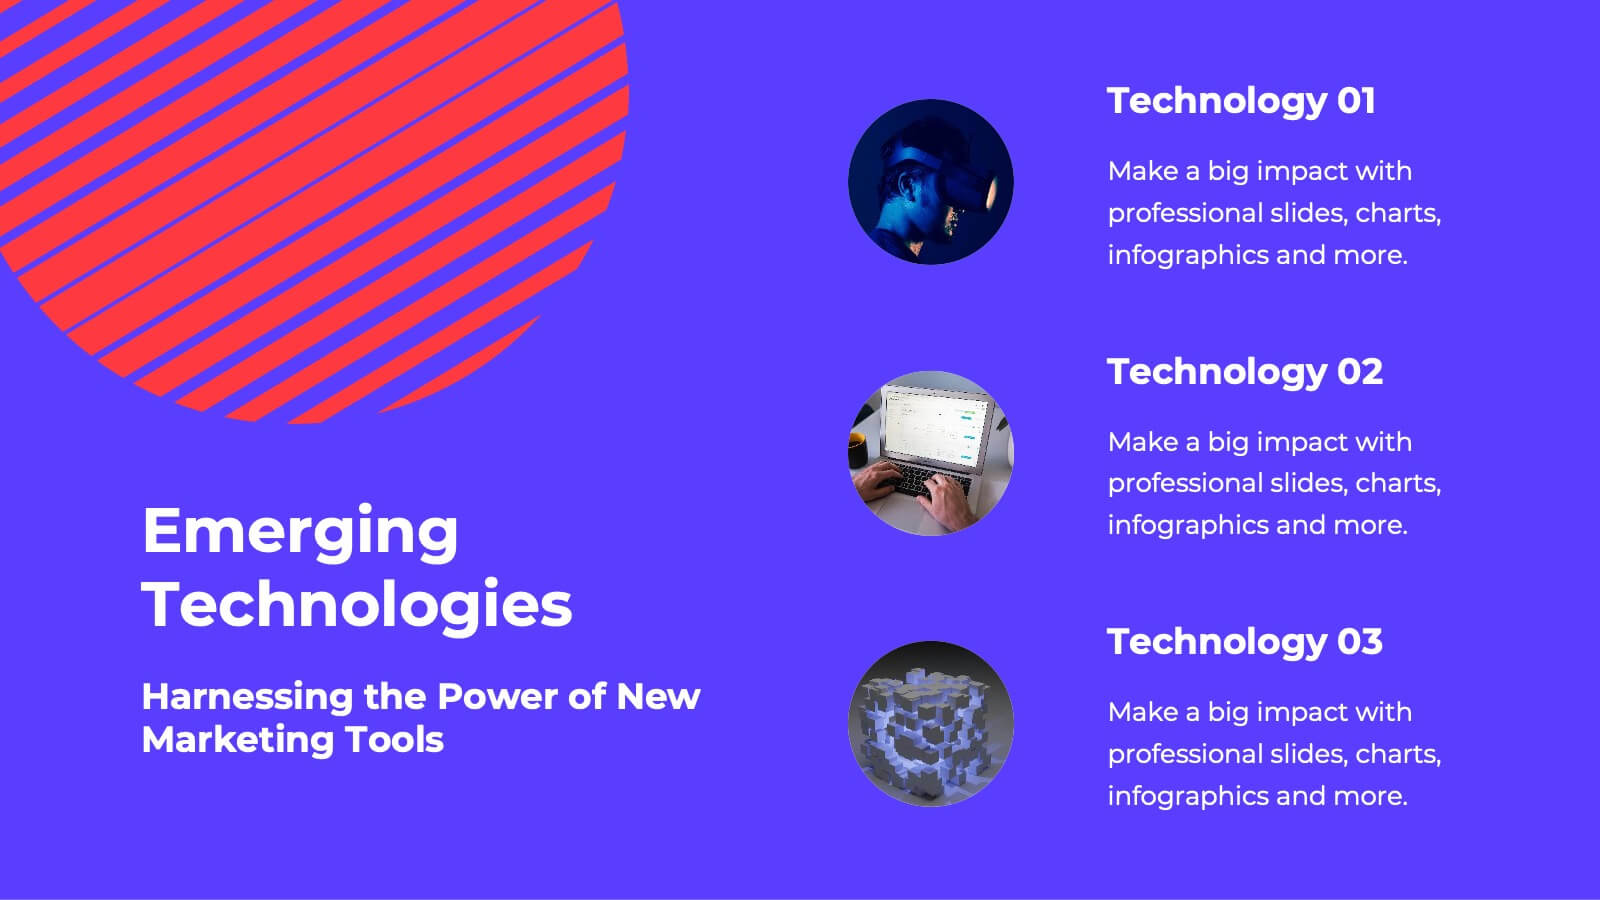
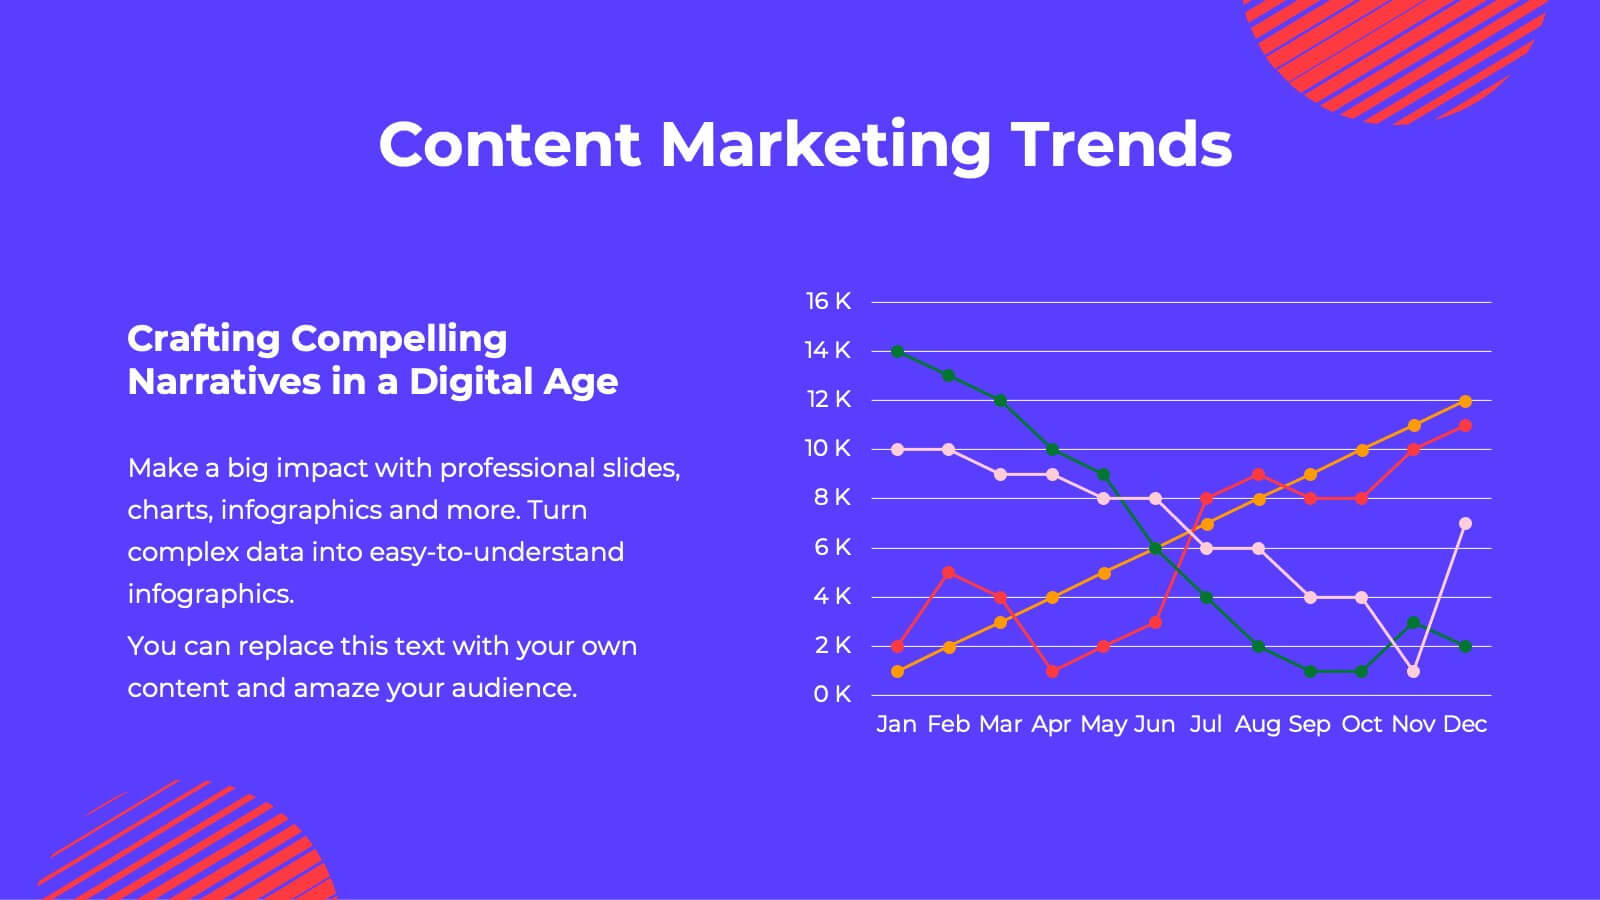
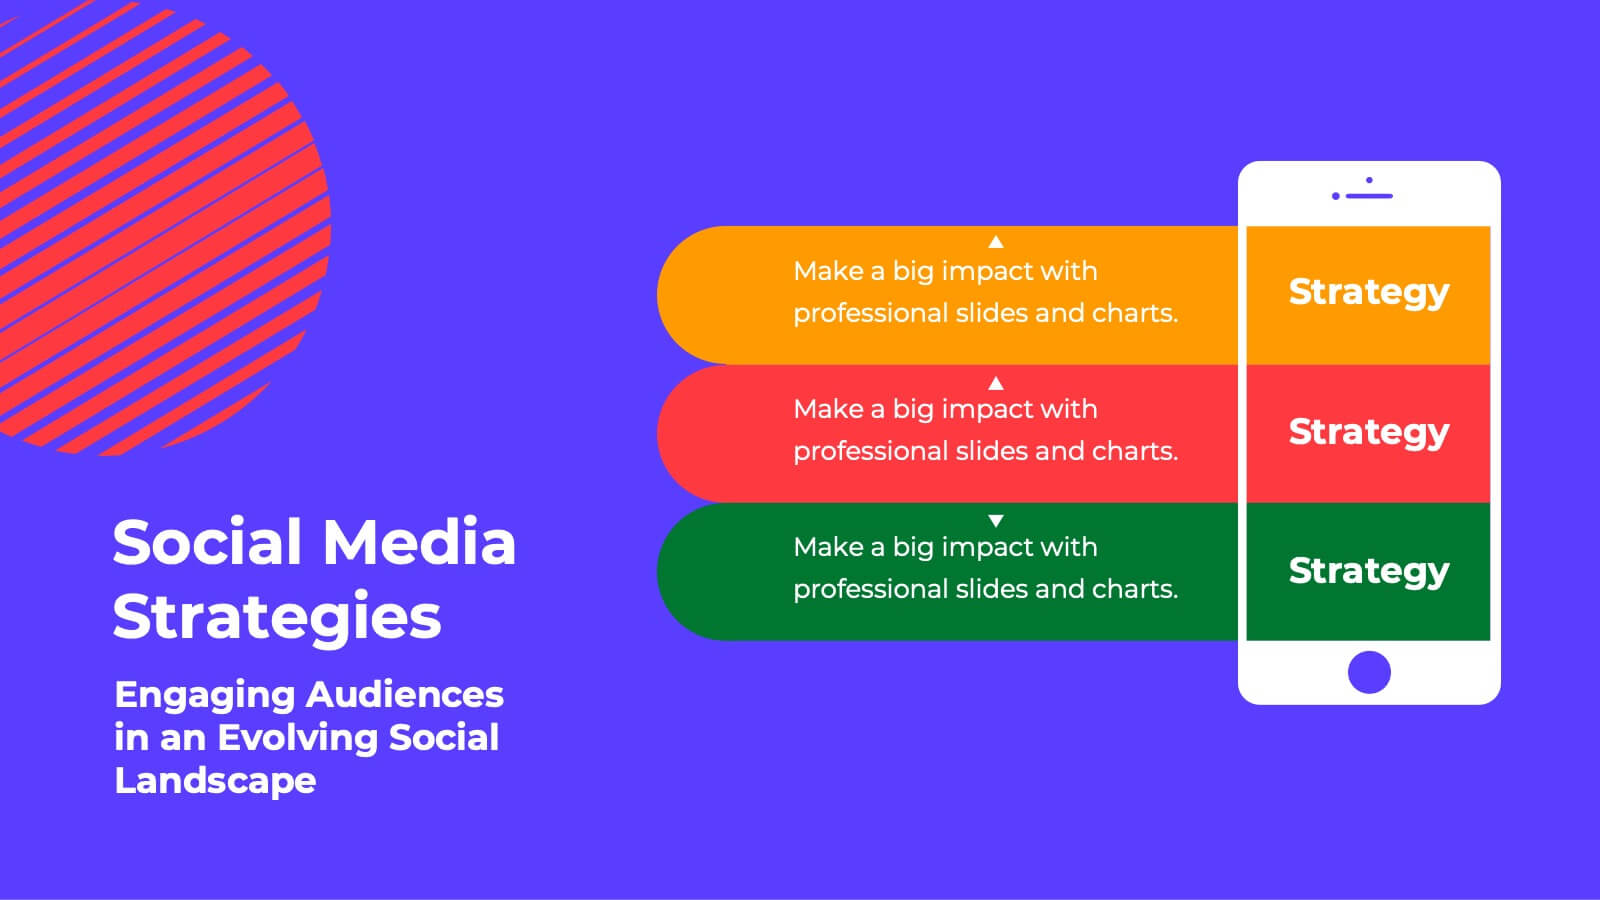
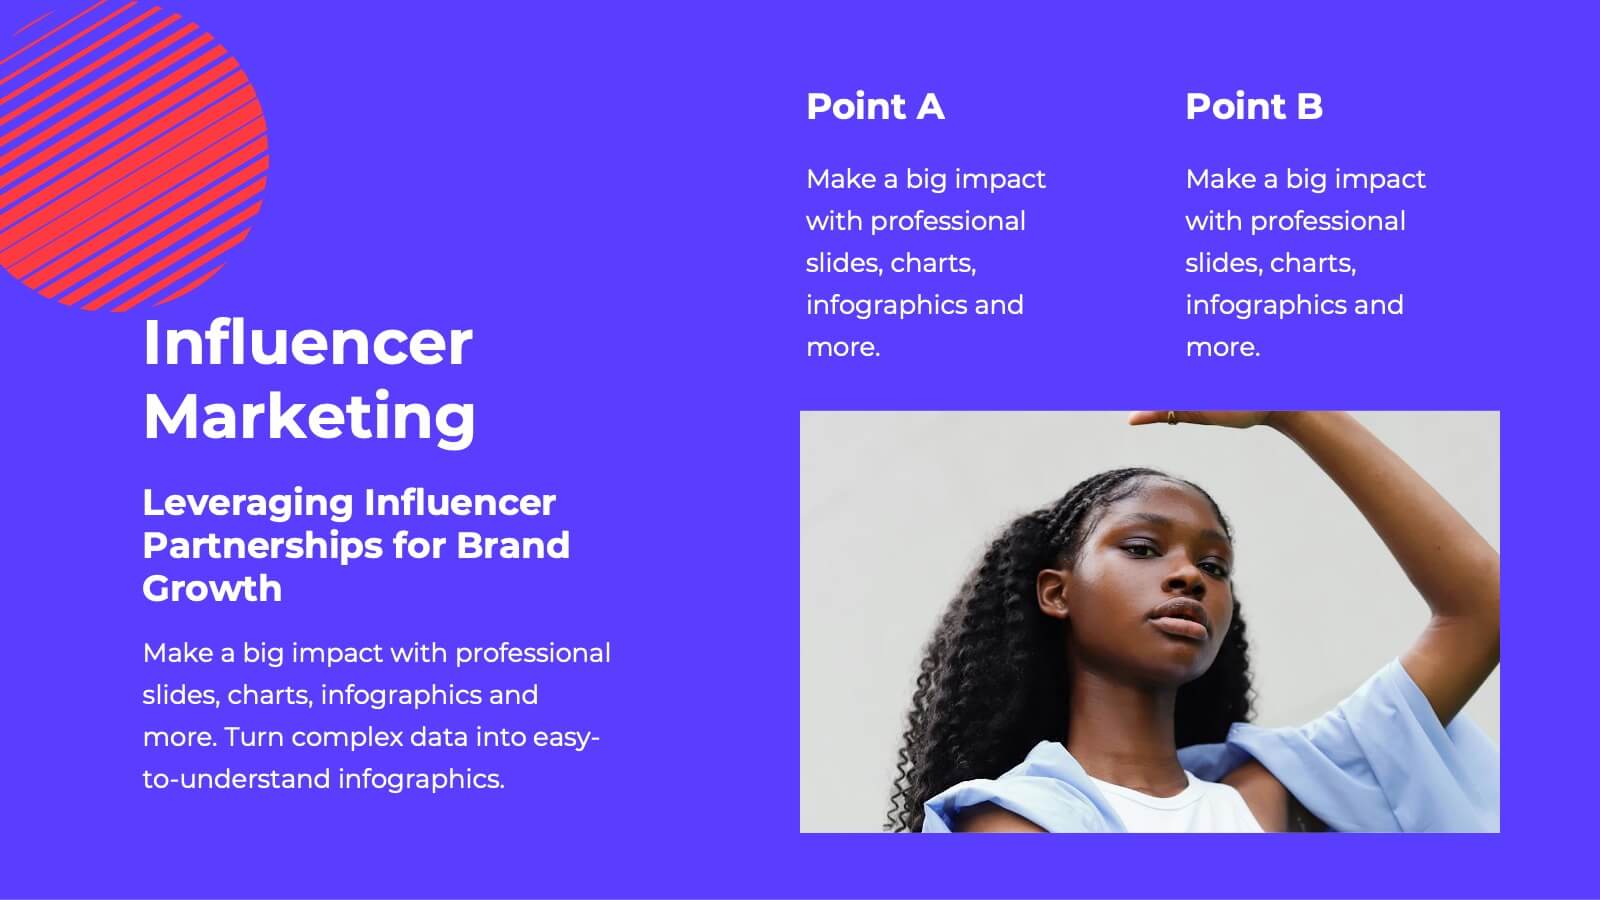
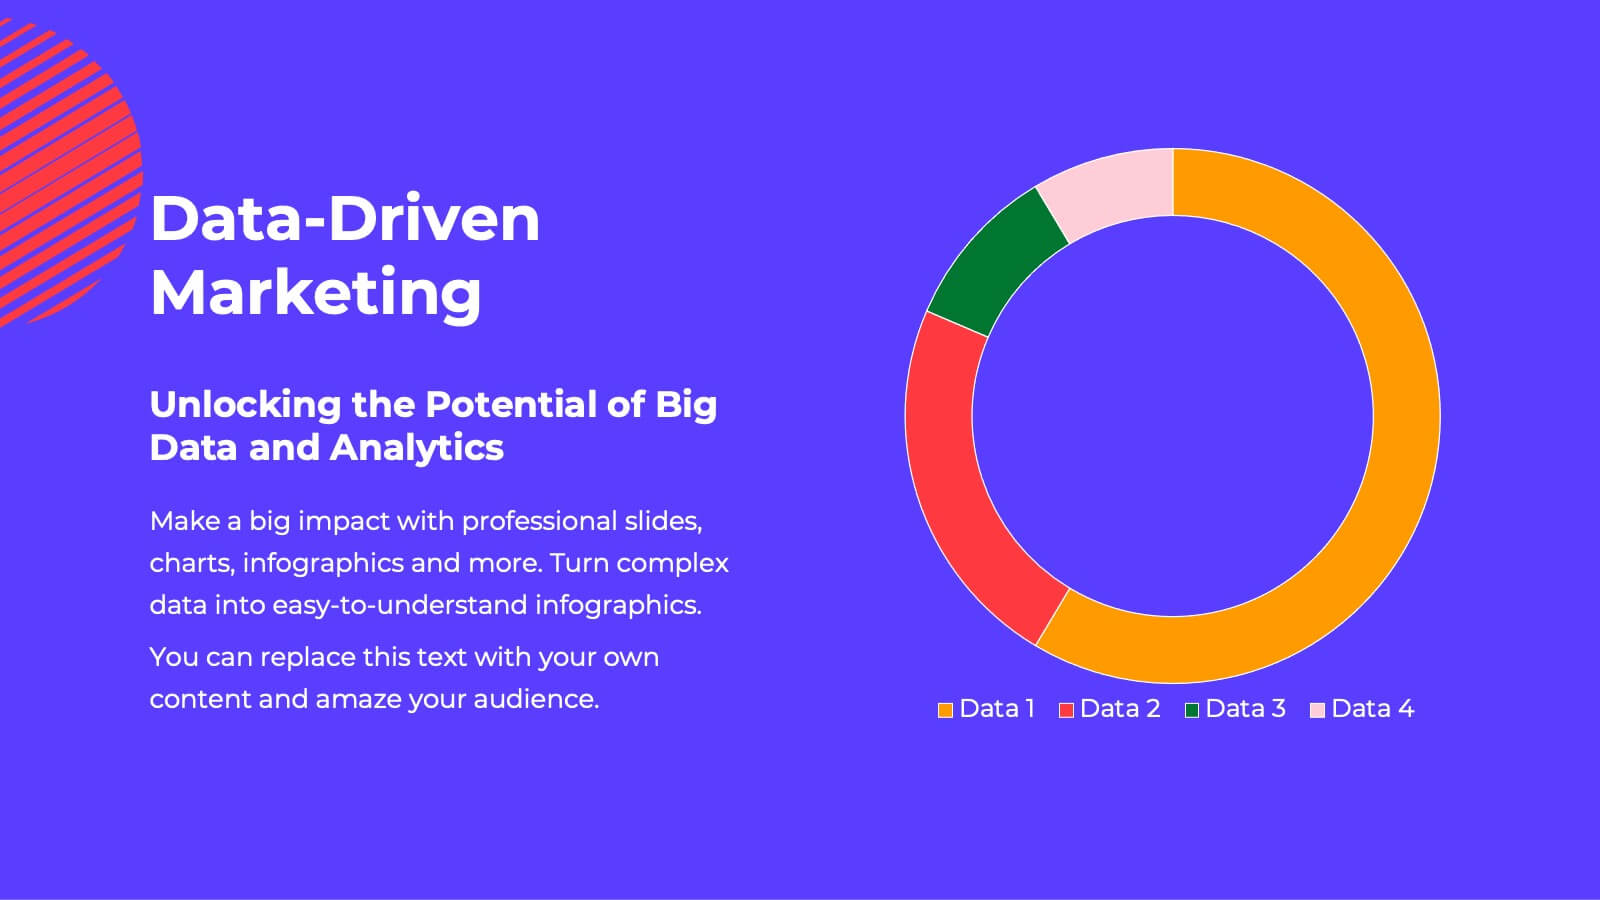
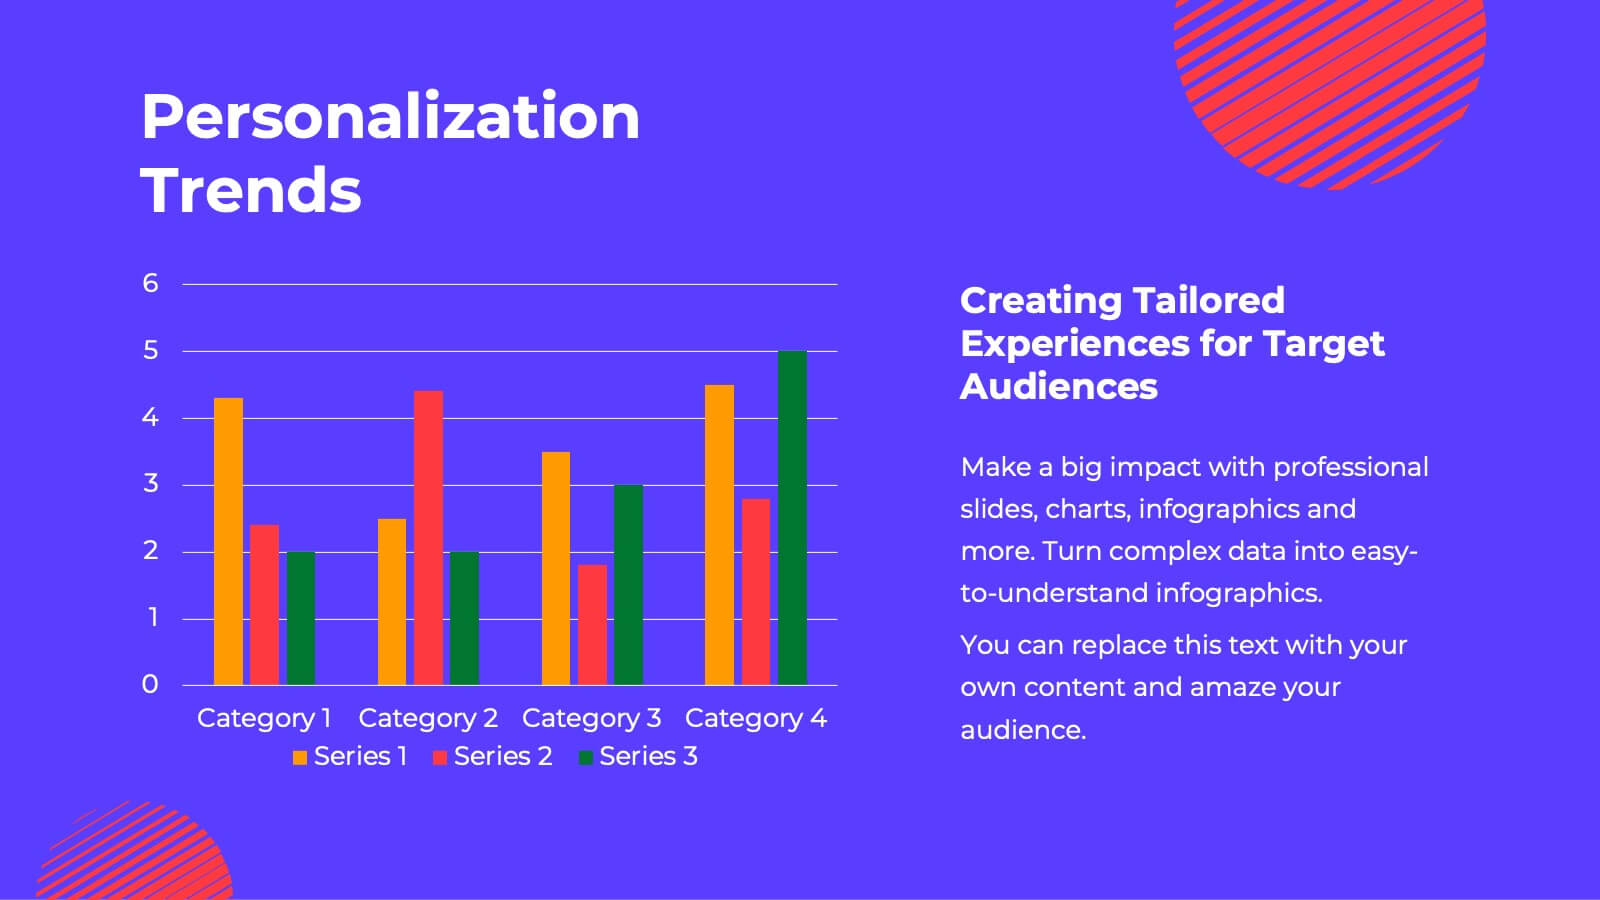
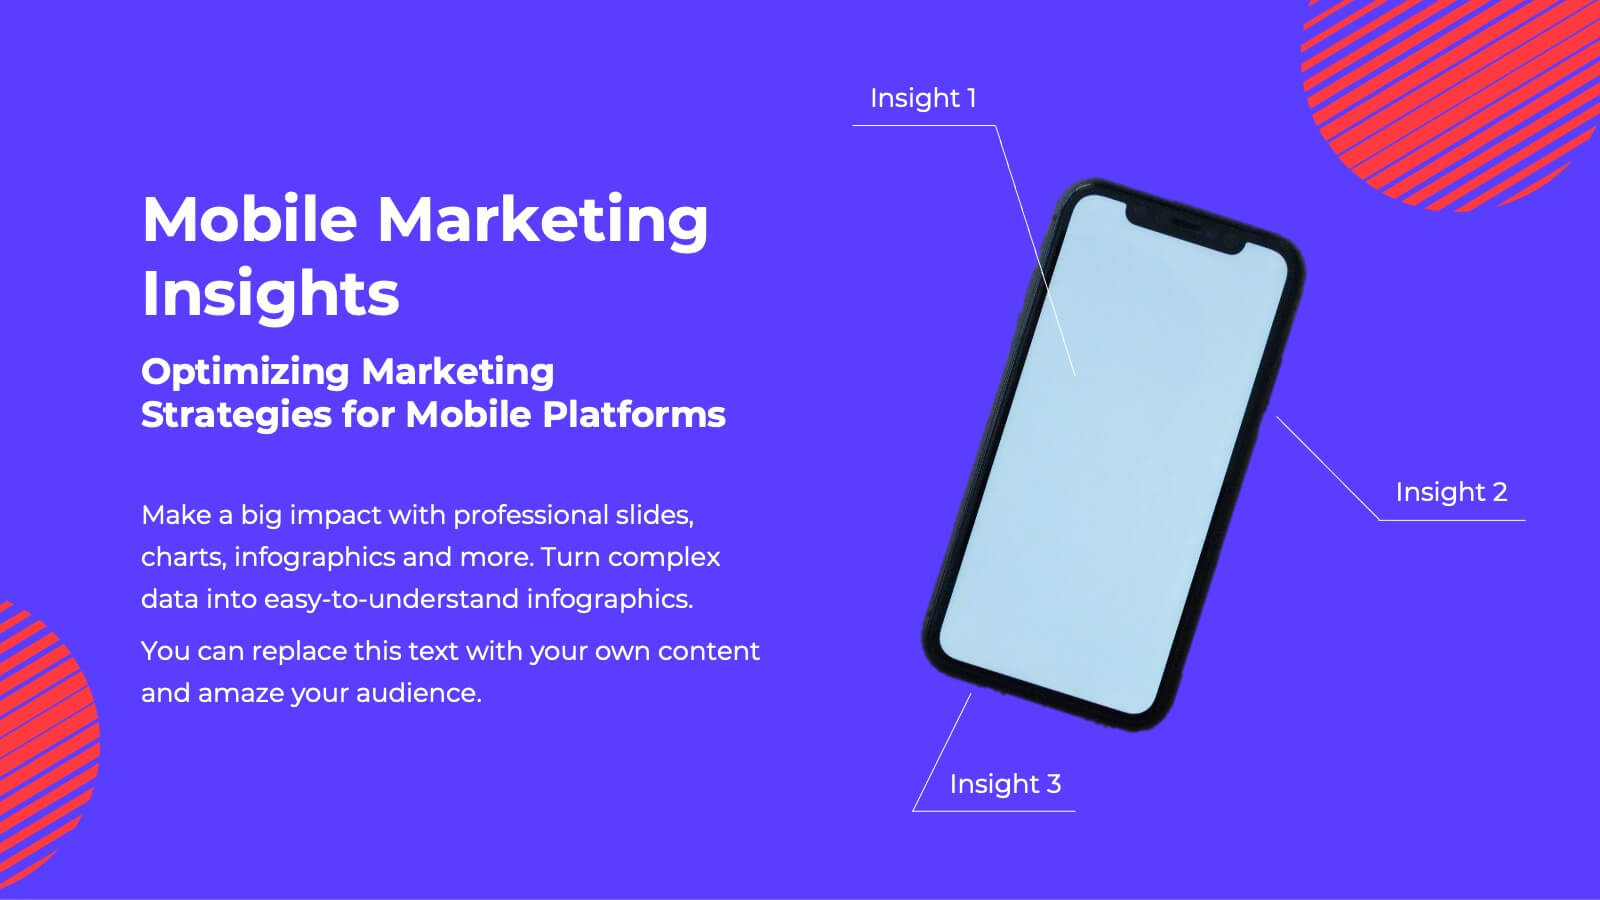
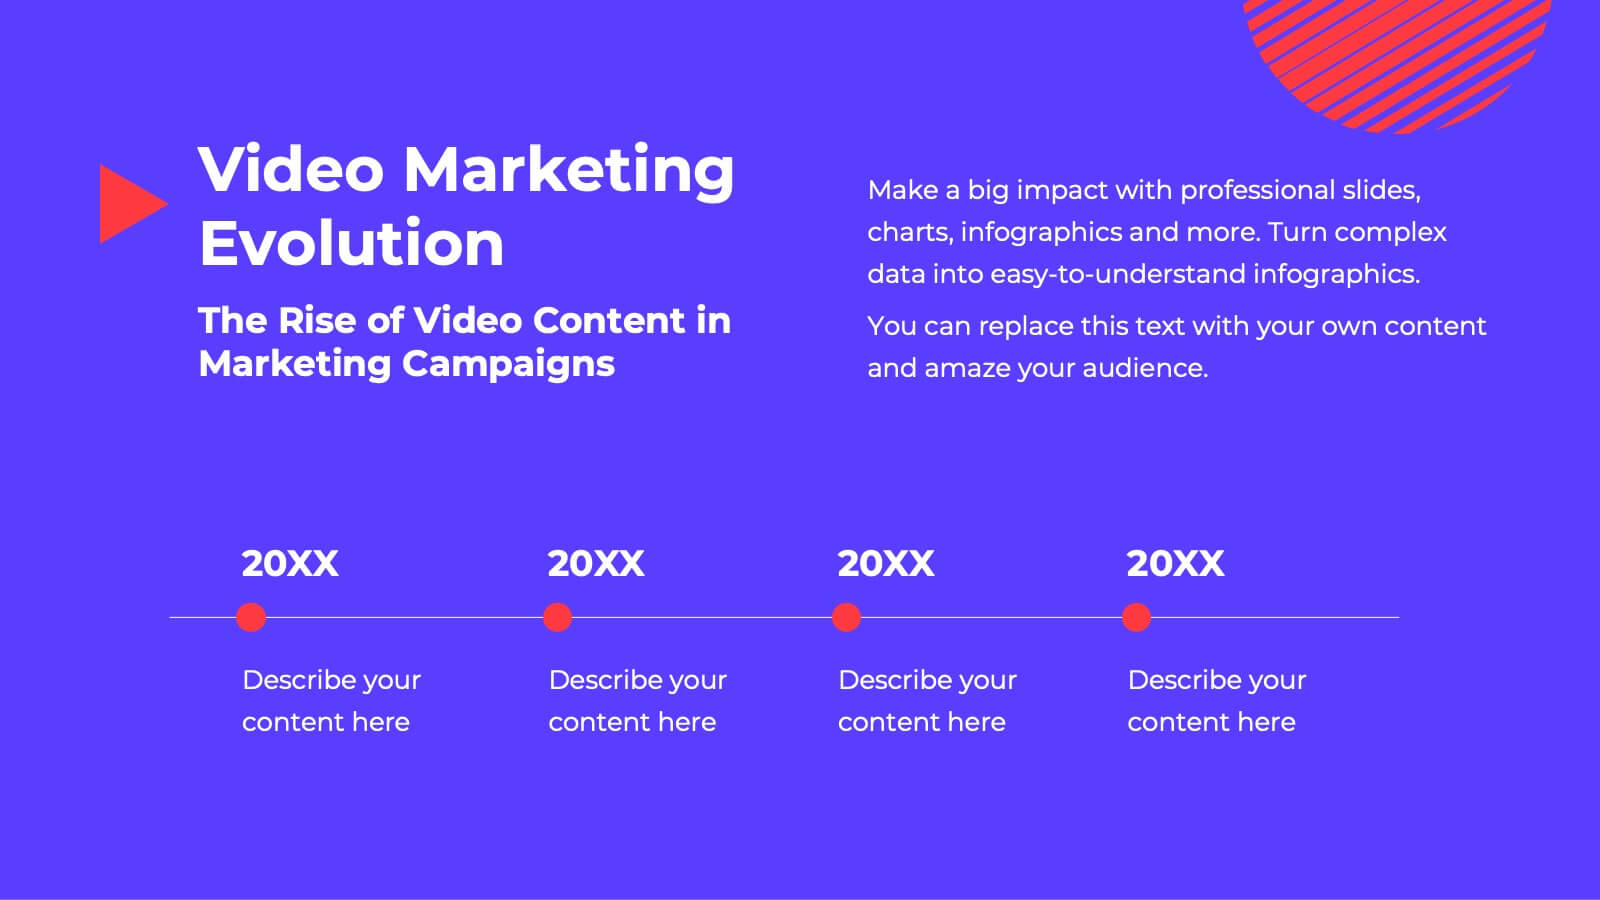
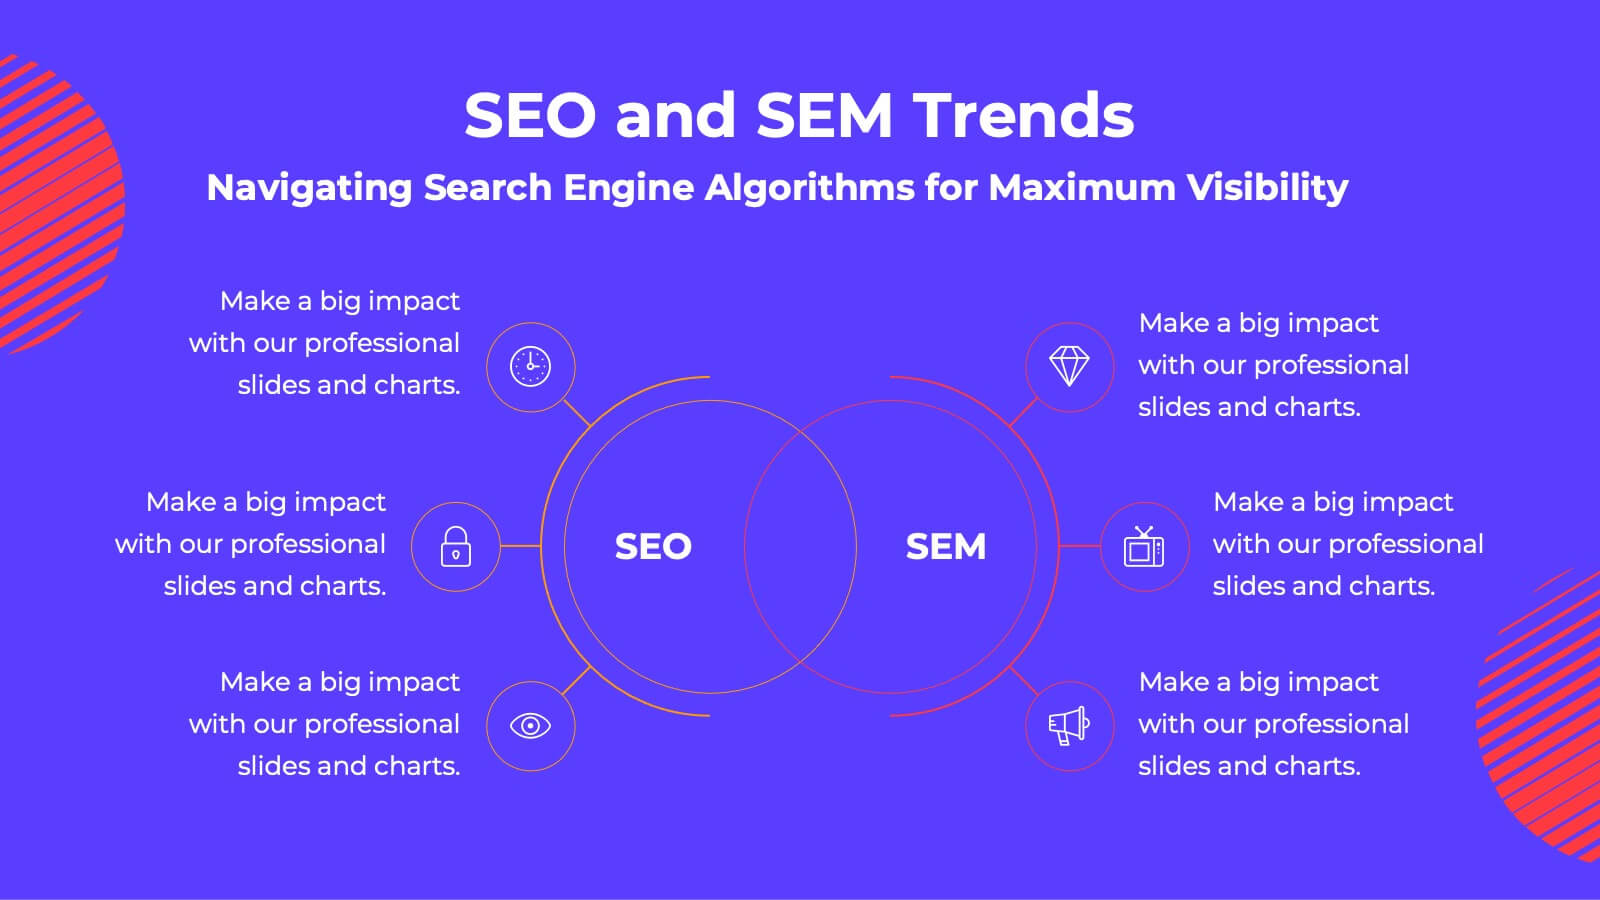
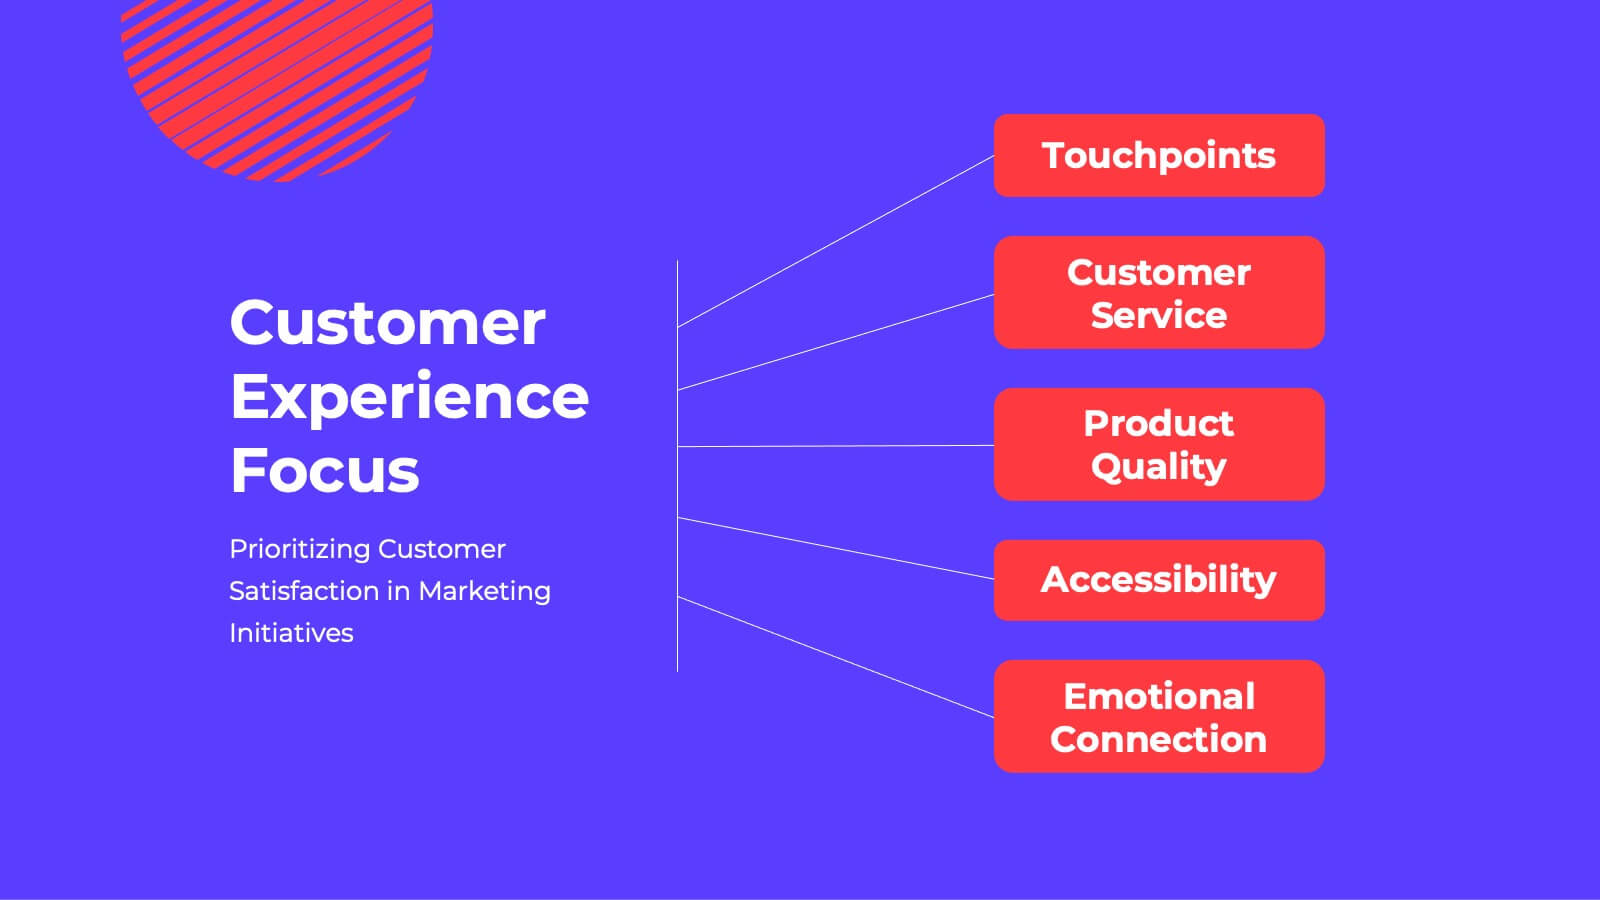
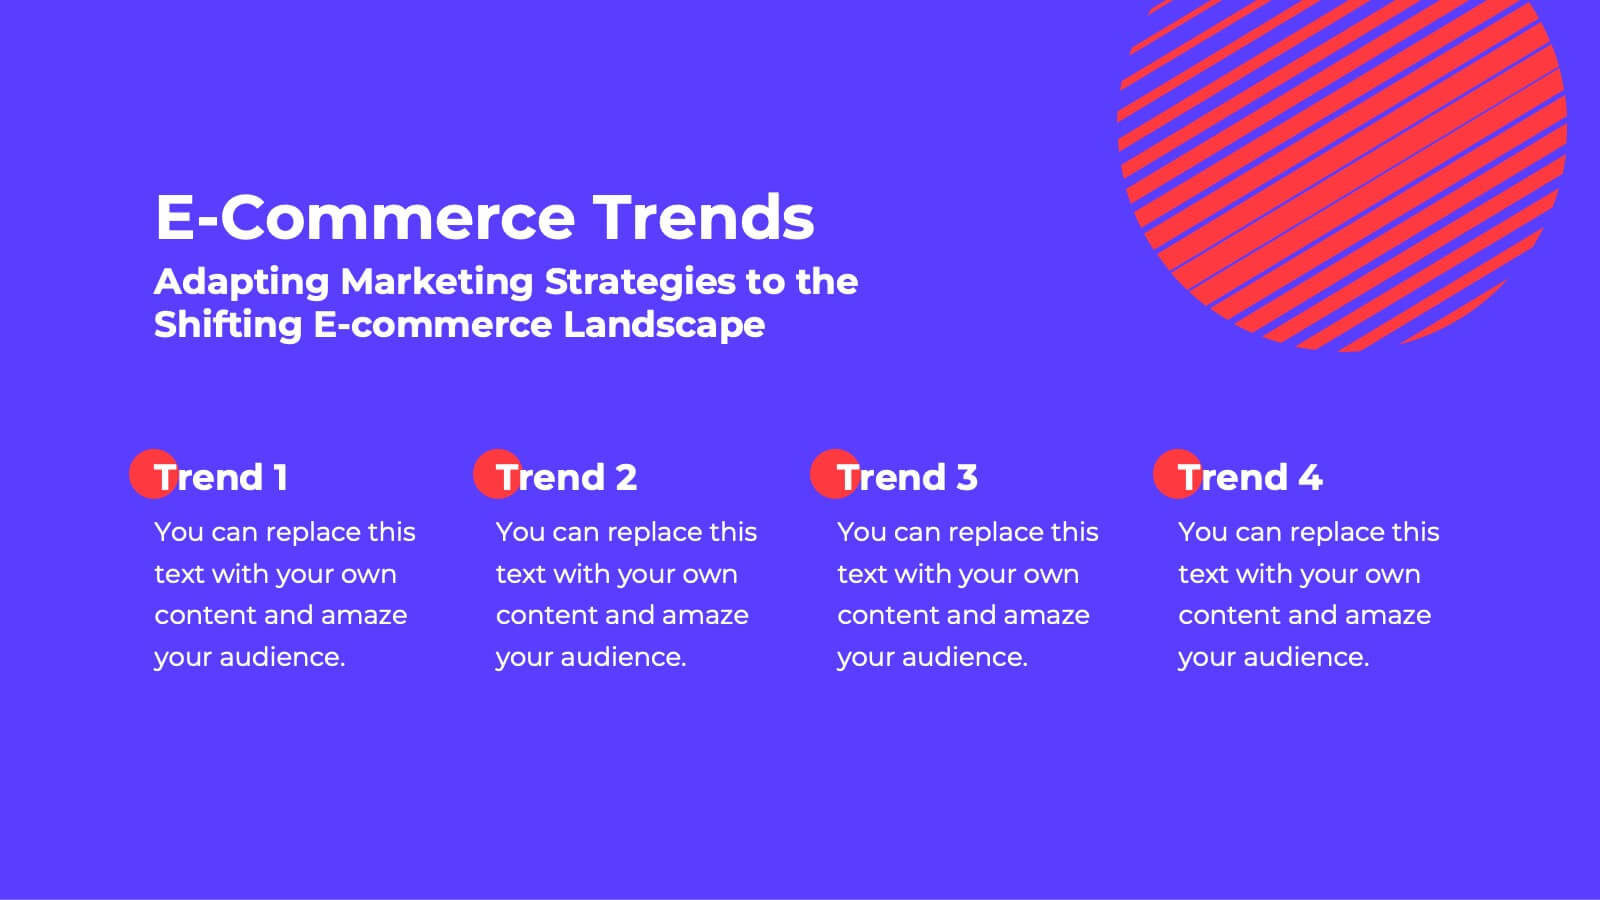
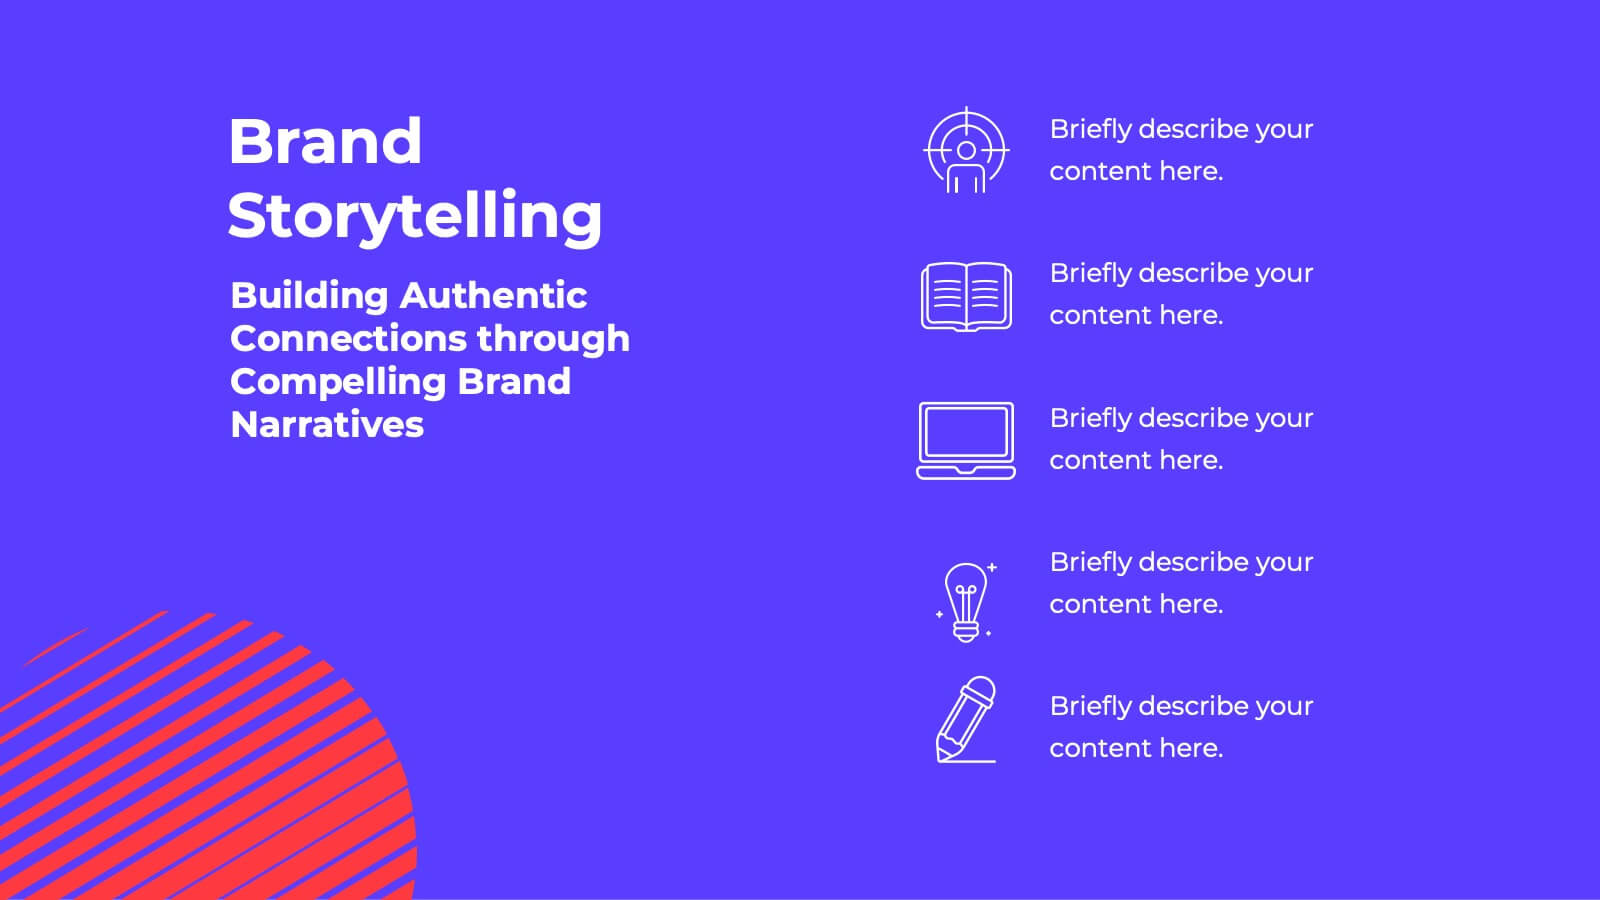
Fusion Marketing Campaign Presentation
Unleash the power of your marketing campaigns with this vibrant marketing campaign template! Dive into social media strategies, influencer marketing, data-driven insights, and more. Perfect for presenting to stakeholders and team members. Fully customizable and compatible with PowerPoint, Keynote, and Google Slides.


26 diapositivas
Corporate Social Responsibility (CSR) Presentation
Reinforce your commitment to positive impact with our Corporate Social Responsibility (CSR) presentation template, compatible with PowerPoint, Keynote, and Google Slides. This template is expertly crafted for businesses and organizations looking to present their CSR initiatives, environmental efforts, and community engagements. It features a professional yet inviting design with green accents to symbolize the commitment to sustainability. The template offers a variety of slide types to cover all aspects of your CSR strategy. Use 'process infographics' to outline your sustainable practices, 'mind map infographics' to explore the impact of your activities, and 'chart slides' to present your social and environmental achievements quantitatively. Our CSR template is not just for presentations; it's a statement of your organization's values and dedication to making a difference. Download it now to communicate your CSR goals and actions with clarity and inspire your stakeholders to join you in driving change for a better world.


5 diapositivas
Strategic Planning with Foundational Pillars Presentation
Define the structure behind your strategic vision with the Strategic Planning with Foundational Pillars presentation. This template showcases four strong pillars beneath a classical pediment, symbolizing the stability and balance of your business strategy. Each pillar represents a core principle—perfect for themes like leadership, values, operations, or goals. Clean, modern, and entirely editable in PowerPoint, Keynote, and Google Slides, this visual works great for executive briefings, annual plans, or business consulting pitches.


8 diapositivas
Achievements and Goals Milestone
Illustrate your team's journey with this visually engaging milestone roadmap. Featuring a step-by-step block design with space for five key accomplishments, it's perfect for goal tracking, progress reviews, or roadmap presentations. Fully editable in PowerPoint, Keynote, and Google Slides.


7 diapositivas
Leadership Qualities Infographic
Strengthen your leadership presentations with our Leadership Qualities infographic, fully compatible with Powerpoint, Keynote, and Google Slides. This infographic is meticulously designed for trainers, coaches, and management professionals keen on illustrating the core attributes that define effective leadership. Our Leadership Qualities infographic provides a vivid portrayal of essential leadership traits, from communication and decision-making to empathy and resilience. It's an excellent resource for workshops, seminars, and courses focused on leadership development. The visual elements are crafted to highlight the contrasts between various leadership styles and the impacts of different leadership behaviors on team dynamics. By using this infographic, you'll be able to foster a deeper understanding of what makes a great leader in the eyes of their team and organization. It's a powerful visual aid that can help initiate discussions on personal development and team-building strategies. Incorporate it into your educational materials to underscore the value of strong leadership in achieving organizational success.


2 diapositivas
Digital Mockup Screens for Apps Presentation
Showcase your app in action with the Digital Mockup Screens for Apps Presentation. This bold and modern slide layout centers your mobile UI on colorful abstract shapes, drawing attention to your product. Ideal for startup demos, app features, or UI/UX portfolios. Fully editable in PowerPoint, Keynote, Canva, and Google Slides.


7 diapositivas
Annual Report Infographics Presentation Template
Annual reports are comprehensive documents designed to provide readers with information about a company's performance in the preceding year with a focus on all major aspects of its operations. They help investors, competitors and other stakeholders understand how well a business is performing. This template is designed to help users produce annual reports for their company. Annual reports provide insights into the company's direction in the preceding year. This template includes many features to make your document as professional as possible and includes various charts and graphs.


21 diapositivas
Eidolon Digital Strategy Presentation
Craft a forward-thinking presentation with a dynamic template designed for digital strategies. Highlight key components such as current landscape analysis, market trends, and competitive insights to provide a comprehensive overview of your strategic vision. Use the SWOT analysis and key challenges slides to identify opportunities and areas of growth. Showcase your value proposition and strategic initiatives, backed by detailed plans for resource allocation, risk management, and implementation timelines. The template also includes sections for performance metrics, communication strategies, and team roles and responsibilities, ensuring every detail is covered. With its sleek and professional design, this template is fully editable and compatible with PowerPoint, Google Slides, and Keynote, making it an ideal choice for businesses, consultants, or agencies aiming to communicate their digital strategies with precision and impact.


5 diapositivas
Risks Assessment Matrix Presentation
Visualize risk like never before with a clear, color-coded grid that helps you evaluate impact, likelihood, and priority in seconds. Perfect for project planning, compliance reviews, or business strategy sessions, this presentation makes complex assessments simple. Fully compatible with PowerPoint, Keynote, and Google Slides for effortless editing.


5 diapositivas
Healthcare Industry Report
Deliver key medical insights with this modern, stethoscope-themed slide. Ideal for showcasing health metrics, clinical data, or medical updates, the layout includes four sections with health icons and clear callouts for easy readability. Fully customizable in PowerPoint, Keynote, and Google Slides.


4 diapositivas
Layered Strategy with Circular Focus Presentation
Highlight core initiatives and surrounding strategies with the Layered Strategy with Circular Focus Presentation. This template features a clean radial layout to emphasize a central goal supported by key components. Ideal for visualizing strategic alignment, organizational priorities, or team roles. Fully editable in PowerPoint, Keynote, and Google Slides.


7 diapositivas
Big Data Tools Infographic
Big Data refers to large volumes of data, both structured and unstructured, that inundate a business or organization on a day-to-day basis. This infographic template is designed to captivate, educate, and empower, providing a bold and clear representation of the sheer magnitude and impact of big data. Compatible with Powerpoint, Keynote, and Google Slides. This template involves processing and analyzing Big Data to extract meaningful insights, patterns, and trends. These insights can be used for business intelligence, decision-making, research, and various other applications across different domains and industries.


21 diapositivas
Duskflare Corporate Strategy Proposal Presentation
Present your corporate strategy effectively with this comprehensive template, featuring sections on market trends, SWOT analysis, strategic initiatives, and risk management. Designed for clarity and impact, it’s ideal for outlining high-level goals and action plans. Compatible with PowerPoint, Keynote, and Google Slides for seamless presentations.


8 diapositivas
Restaurant Menu Design Presentation
Showcase your menu items with style using this bold, modern restaurant menu infographic. Designed to highlight pricing, meal categories, and featured items, this layout is perfect for restaurant presentations, promotions, or digital signage. Includes editable text areas and food-themed icons. Works seamlessly in PowerPoint, Keynote, and Google Slides.


6 diapositivas
Agenda Network Infographic
Elevate your networking events with our sophisticated collection of agenda slide templates. These slides are crafted to structure and present the flow of activities at networking events, making them essential for coordinators who aim to foster professional connections among attendees. Each template is designed with clarity and style, featuring clean lines and modern graphics to outline key segments of your event, such as welcome remarks, networking sessions, panel discussions, and closing statements. The thoughtful layout includes designated spaces for time slots, session titles, and speaker details, ensuring that participants can easily follow the event's progression and plan their participation accordingly. These slides are fully customizable, allowing you to match the visual design with your event’s theme or corporate branding. The adaptable format makes it simple to insert or remove sections based on the specific needs of your event. Ideal for business conferences, industry meet-ups, or any professional gathering, these agenda slides help you manage and execute a seamless networking experience.


6 diapositivas
Business Project Proposal Template
Showcase your strategy with clarity and confidence using this sleek Business Project Proposal slide. Designed to highlight three core ideas or phases, it's perfect for pitching initiatives, presenting goals, or structuring deliverables. Compatible with PowerPoint, Google Slides, and Keynote for seamless editing and customization.


6 diapositivas
Stock Market Investment Infographics
Explore the world of Stock Market Investment with our customizable infographic template. This template is fully compatible with popular presentation software like PowerPoint, Keynote, and Google Slides, allowing you to easily customize it to illustrate and communicate various aspects of stock market investing. The Stock Market Investment infographic template offers a visually engaging platform to outline the key principles, strategies, and considerations for successful investing in stocks. Whether you're an investor, financial advisor, educator, or simply interested in building wealth through the stock market, this template provides a user-friendly canvas to create informative presentations and educational materials. Enhance your knowledge of Stock Market Investment with this SEO-optimized infographic template, thoughtfully designed for clarity and ease of use. Customize it to showcase investment strategies, risk management techniques, market analysis, and the importance of diversification, ensuring that your audience gains valuable insights into this dynamic field. Start crafting your personalized infographic today to embark on your stock market investment journey with confidence.