


Características


¿Tienes alguna pregunta?
Recomendar


5 diapositivas
Corporate Risk Assessment Slide Presentation
Streamline complex evaluations with a clean, step-by-step visual that guides your audience through key business risks and mitigation strategies. Ideal for planning sessions or executive reports, this modern design helps simplify communication and enhance decision-making. Fully compatible with PowerPoint, Keynote, and Google Slides for seamless editing and presentation.


4 diapositivas
Product Launch and Roadmap Milestones Presentation
Highlight every phase of your product journey with this Product Launch and Roadmap Milestones presentation. Designed with a winding roadmap layout and colorful milestone markers, this template is perfect for visualizing launch plans, key deliverables, and development stages. Fully editable in Canva, PowerPoint, and Google Slides for easy customization.


18 diapositivas
Business Data Analysis Dashboard Presentation
Track Business Performance Effectively! The Business Data Analysis Dashboard Presentation provides a structured and visually engaging way to showcase key metrics, trends, and insights. Featuring dynamic charts, graphs, and KPI indicators, this template is perfect for executive reports, financial reviews, and strategic planning. Fully customizable and compatible with PowerPoint, Keynote, and Google Slides for seamless presentation.


26 diapositivas
Spa and Wellness Company Profile Presentation
Embark on a journey to wellness and relaxation with our serene well spa & wellness company profile presentation. This template will Immerse your audience in a world of calmness, rejuvenation, and health. Present your company's mission and vision for promoting wellness. Compatible with Powerpoint, Keynote, and Google Slides. The soothing shades of pastels and soft hues create a peaceful atmosphere. This template integrates elements of nature like leaves, flowers, or waves to evoke serenity. This presentation is designed to captivate your audience and immerse them in the world of relaxation.


5 diapositivas
Real Estate Business Process Workflow Presentation
Streamline property operations with this real estate workflow template, designed to visualize each stage from acquisition to closing. Featuring a modern cityscape graphic and five-step layout, it’s perfect for showcasing processes, timelines, or strategies. Fully editable in Canva, PowerPoint, or Google Slides for professional, industry-specific presentations.


23 diapositivas
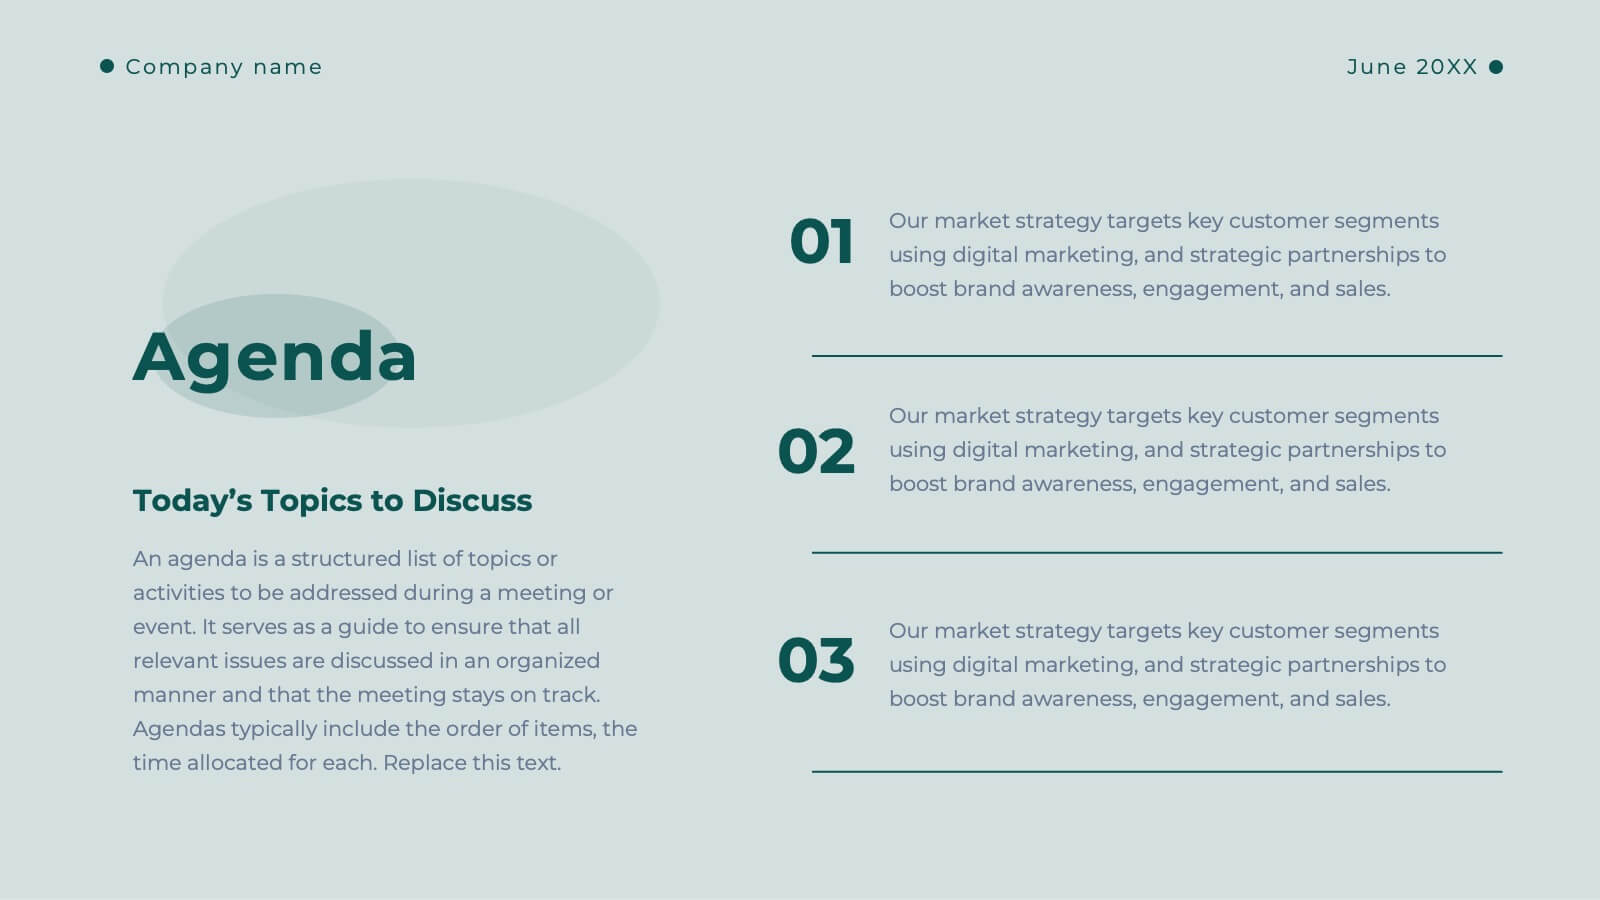
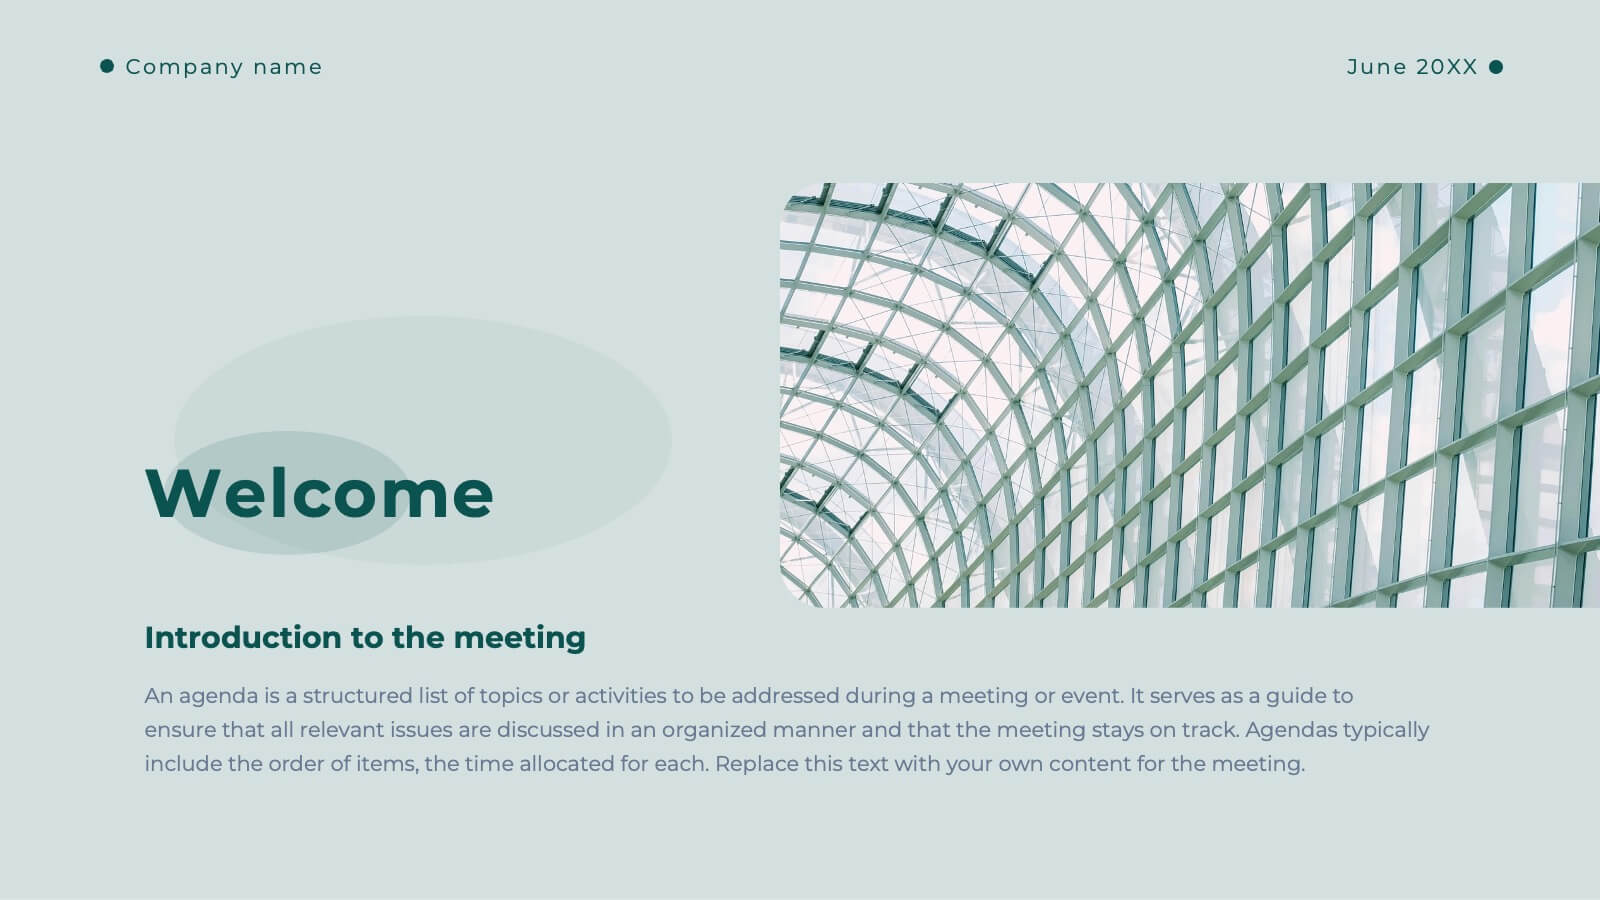
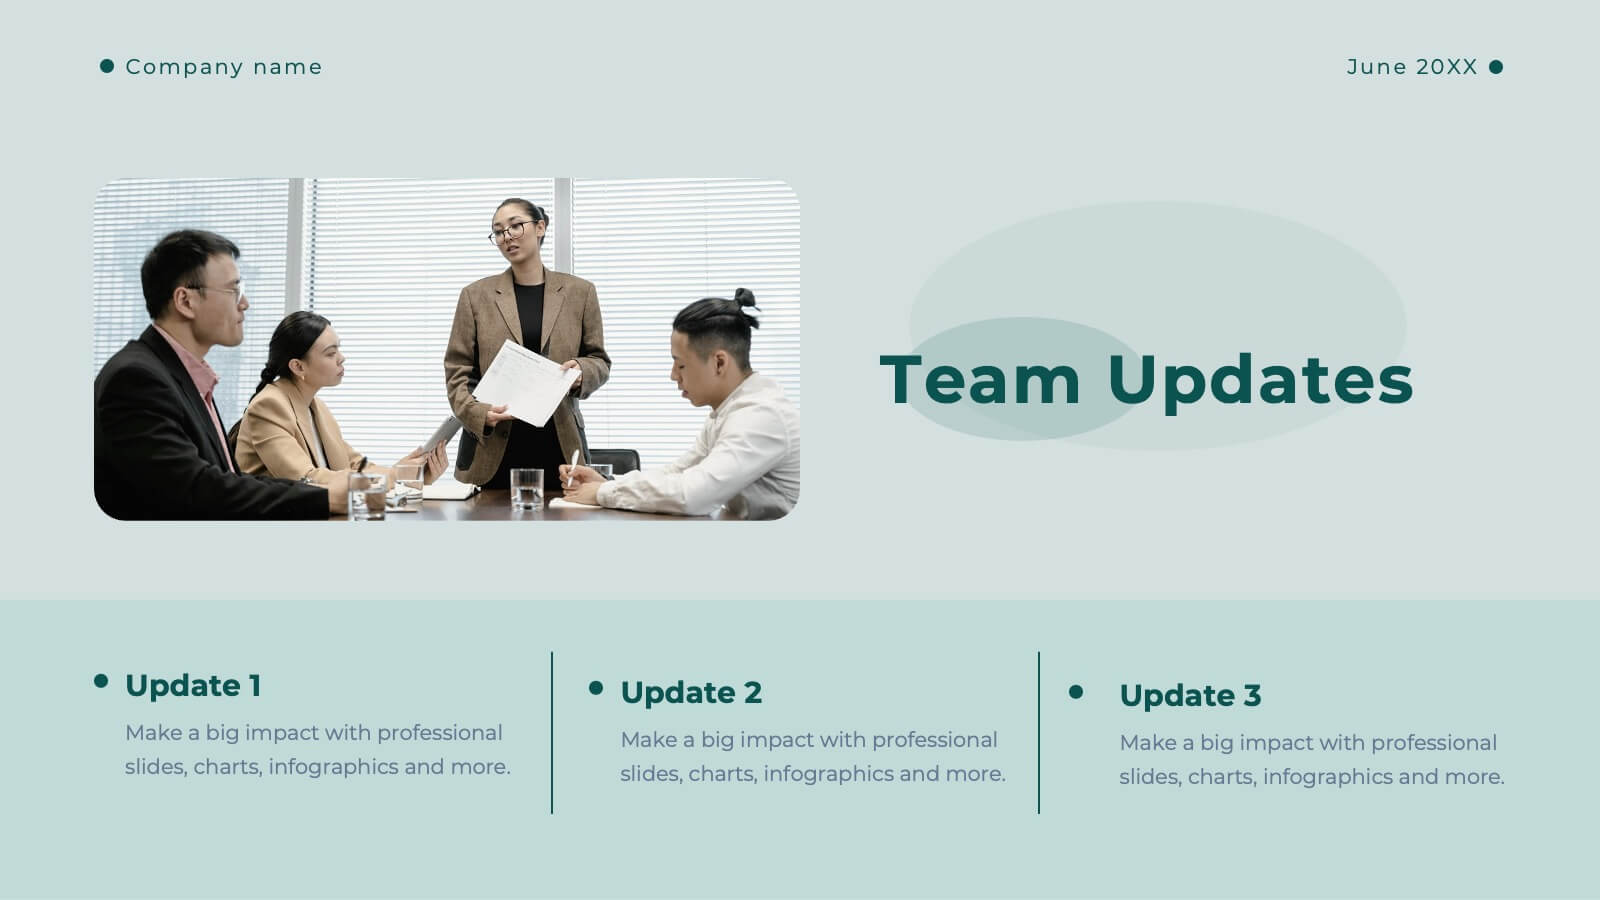
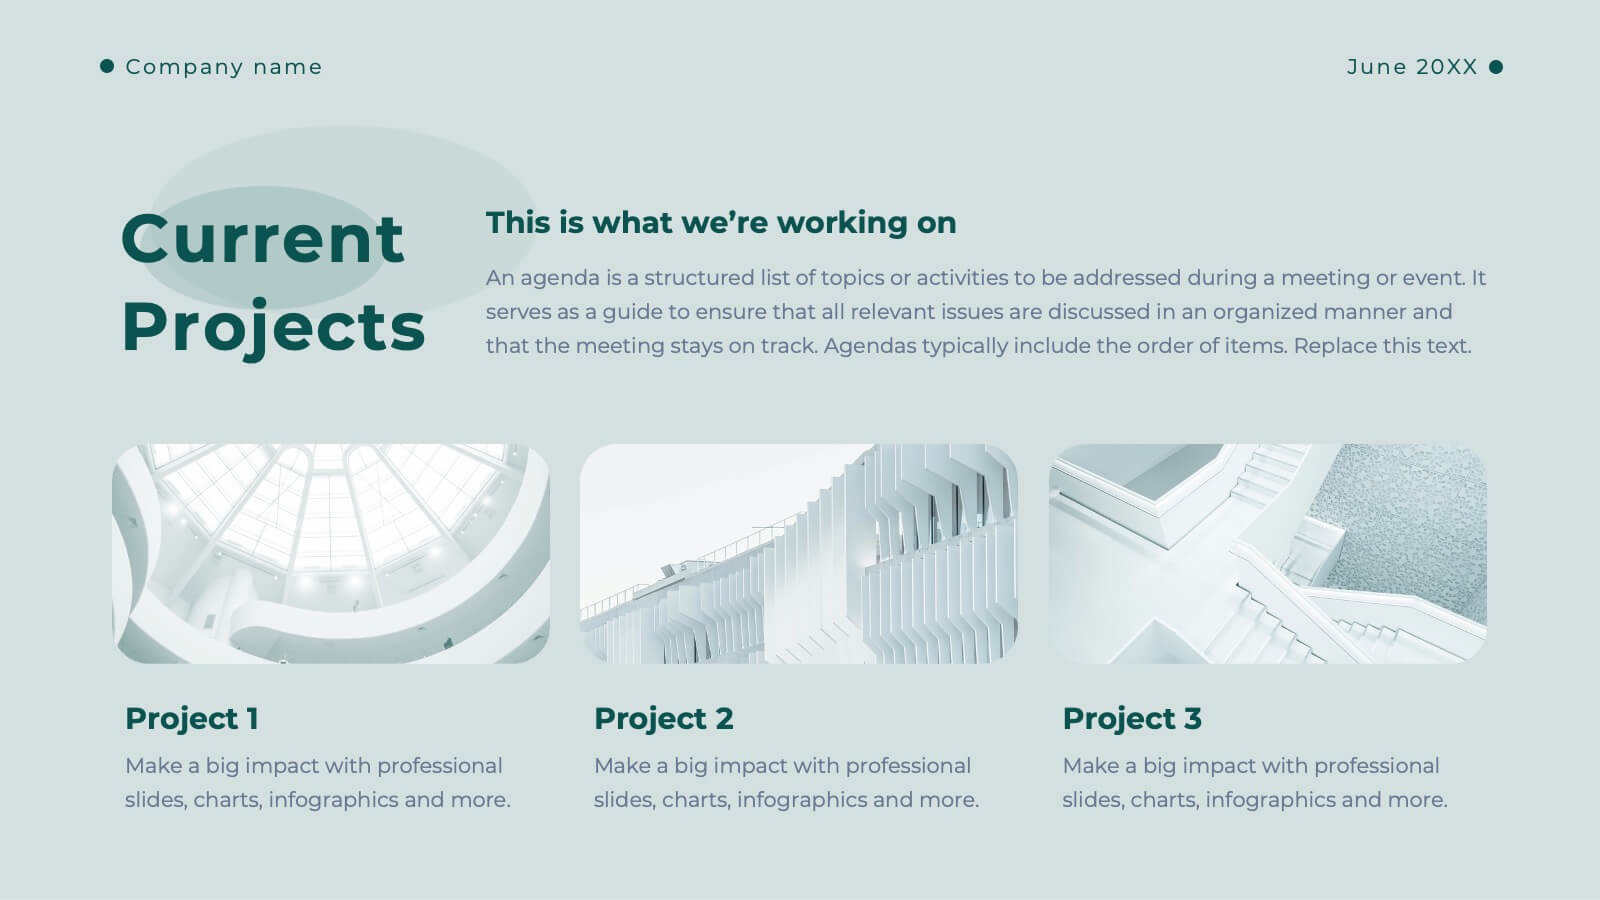
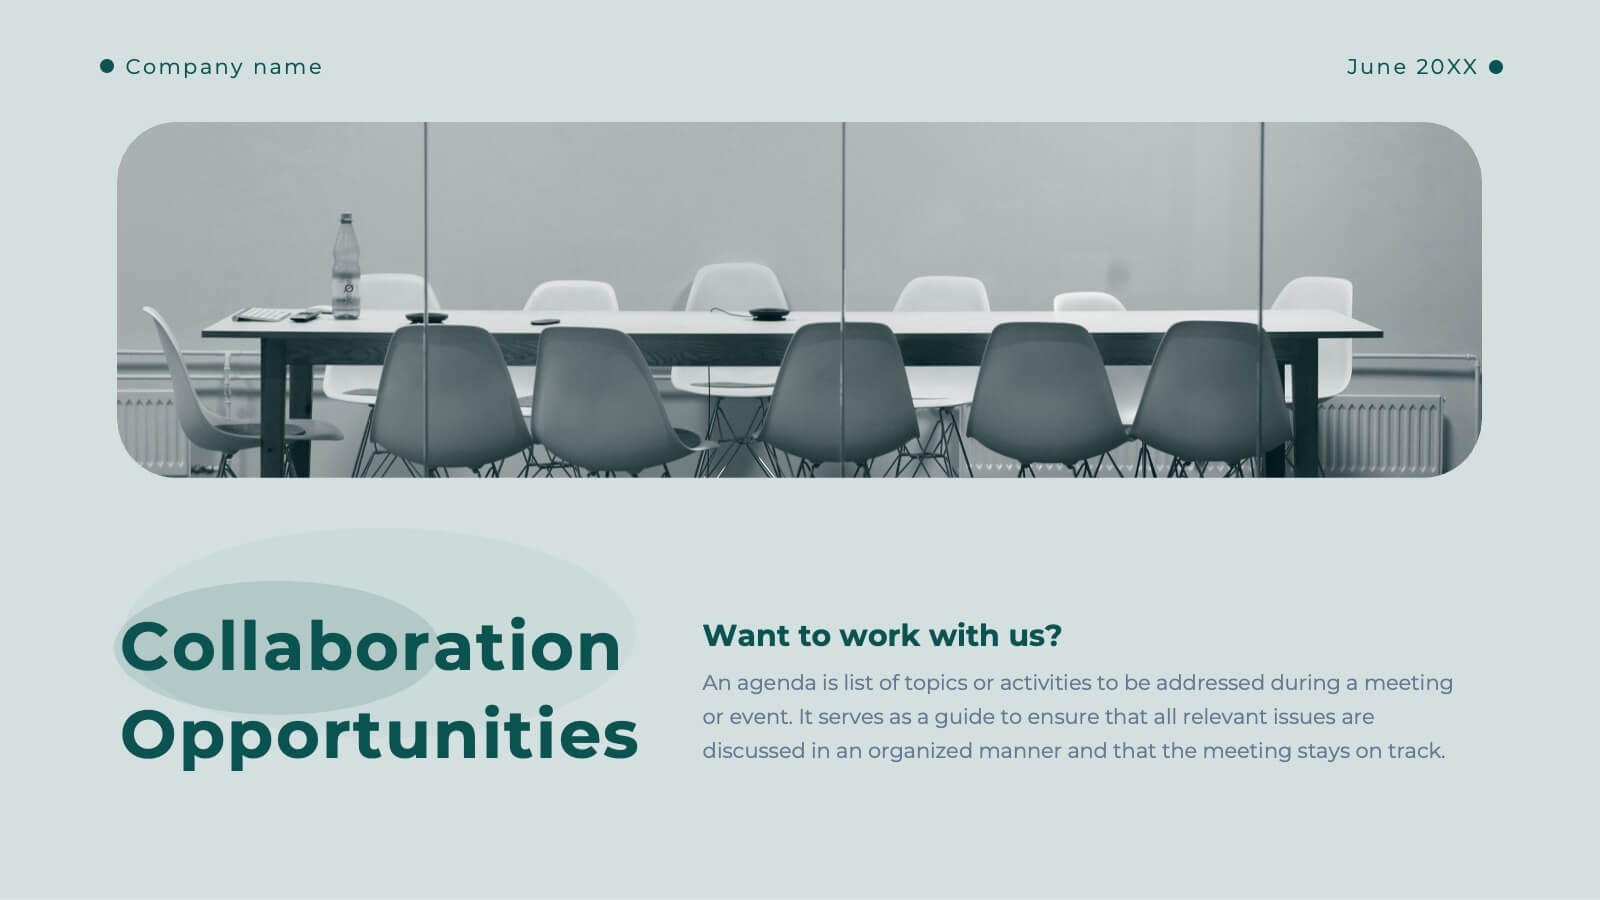
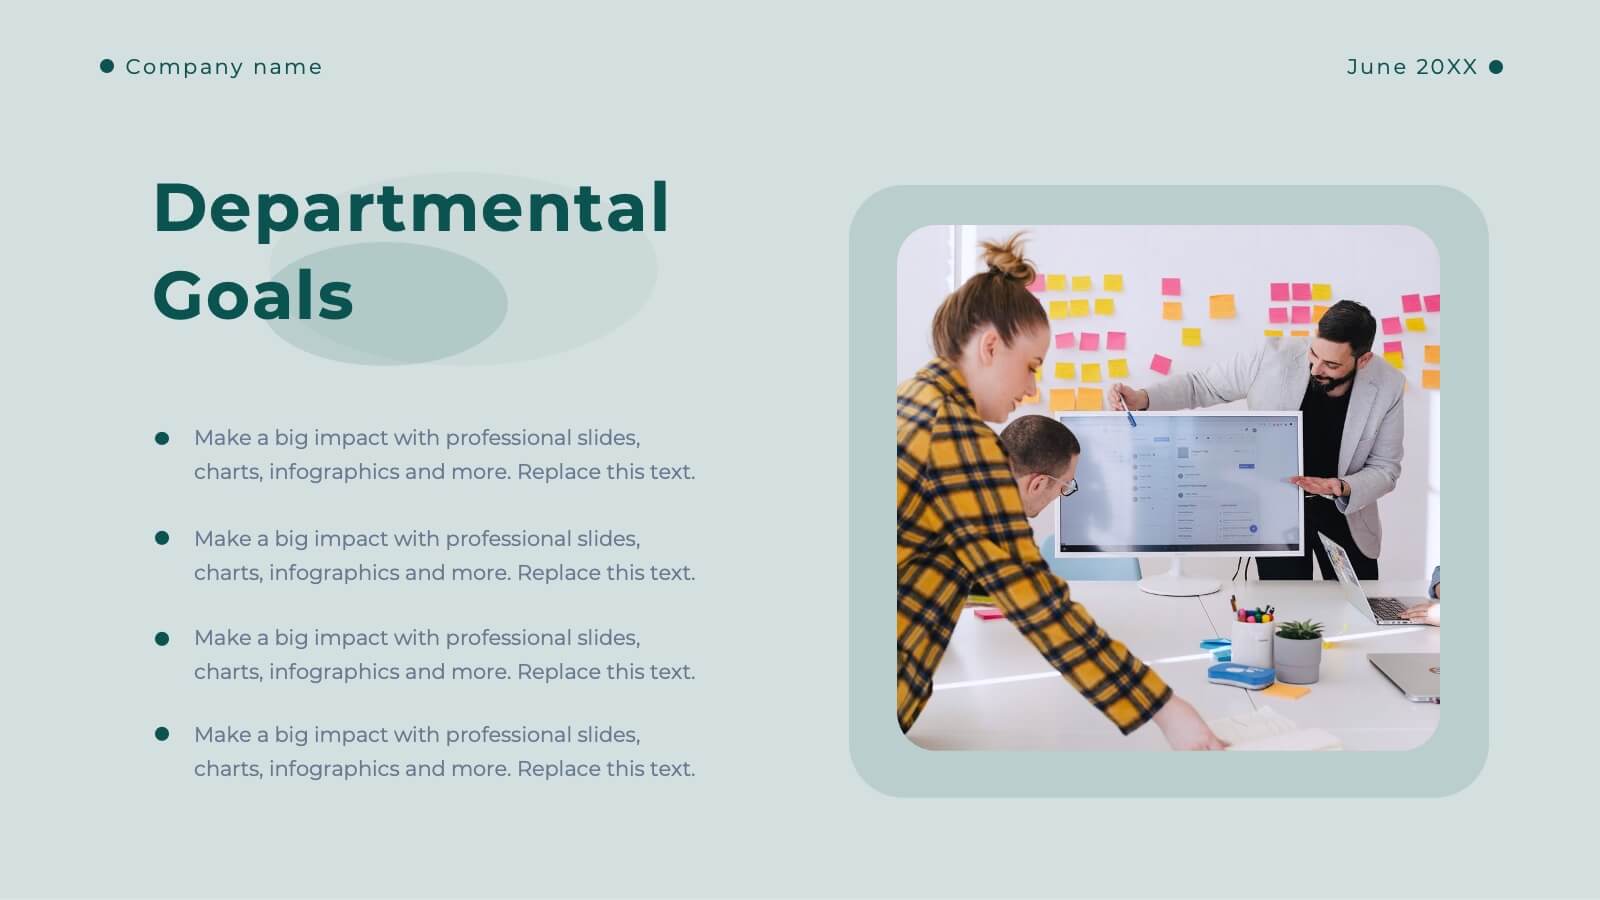
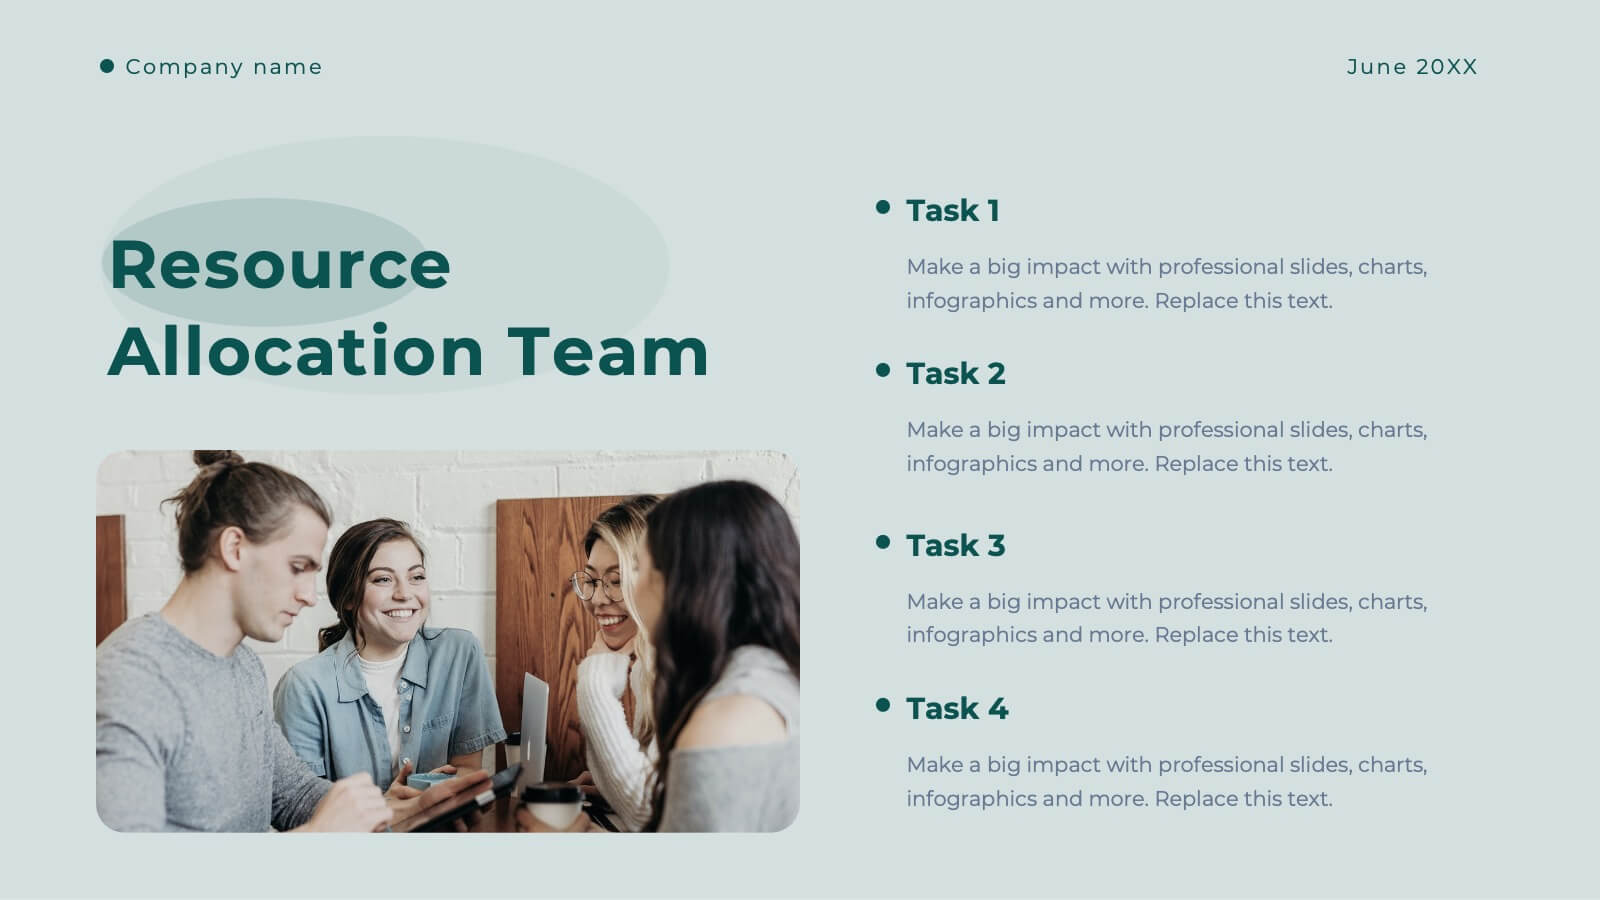
Clarity Business Operations Plan Presentation
Optimize your business operations with this sleek presentation template! Perfect for outlining team updates, key achievements, and performance metrics, it includes slides for departmental goals, process improvements, and upcoming events. Engage your team with clear visuals and detailed content. Compatible with PowerPoint, Keynote, and Google Slides for seamless presentations on any platform.


6 diapositivas
Business Decision Flow Model Presentation
Make smarter choices with this Business Decision Flow Model presentation. Clearly map out key decisions, steps, and potential outcomes using a structured, color-coded flow. Perfect for strategy reviews, team meetings, and executive briefings. Fully editable in Canva, PowerPoint, and Google Slides for seamless customization.


26 diapositivas
Navigating the Creative Industry Presentation
Unlock the secrets to success in the creative industry with this dynamic and visually engaging presentation. Covering essential topics like career pathways, industry trends, collaboration strategies, and personal branding, this template helps you present insights with clarity and impact. Fully customizable and compatible with PowerPoint, Keynote, and Google Slides for a seamless experience.


26 diapositivas
Cryptocurrency Technology Presentation
The foundation of cryptocurrency technology is the blockchain, cryptocurrency has the potential to transform the way we think about money and financial transactions, and it continues to evolve. With this template present the latest information on cryptocurrency and the emerging blockchain technologies. This features a variety of high-quality slides in many formats. Whether you want them to be edited on Keynote, PowerPoint, or google sheets this template has everything you need to make the most out of your presentation. Get creative and add your own style with this presentation template!


4 diapositivas
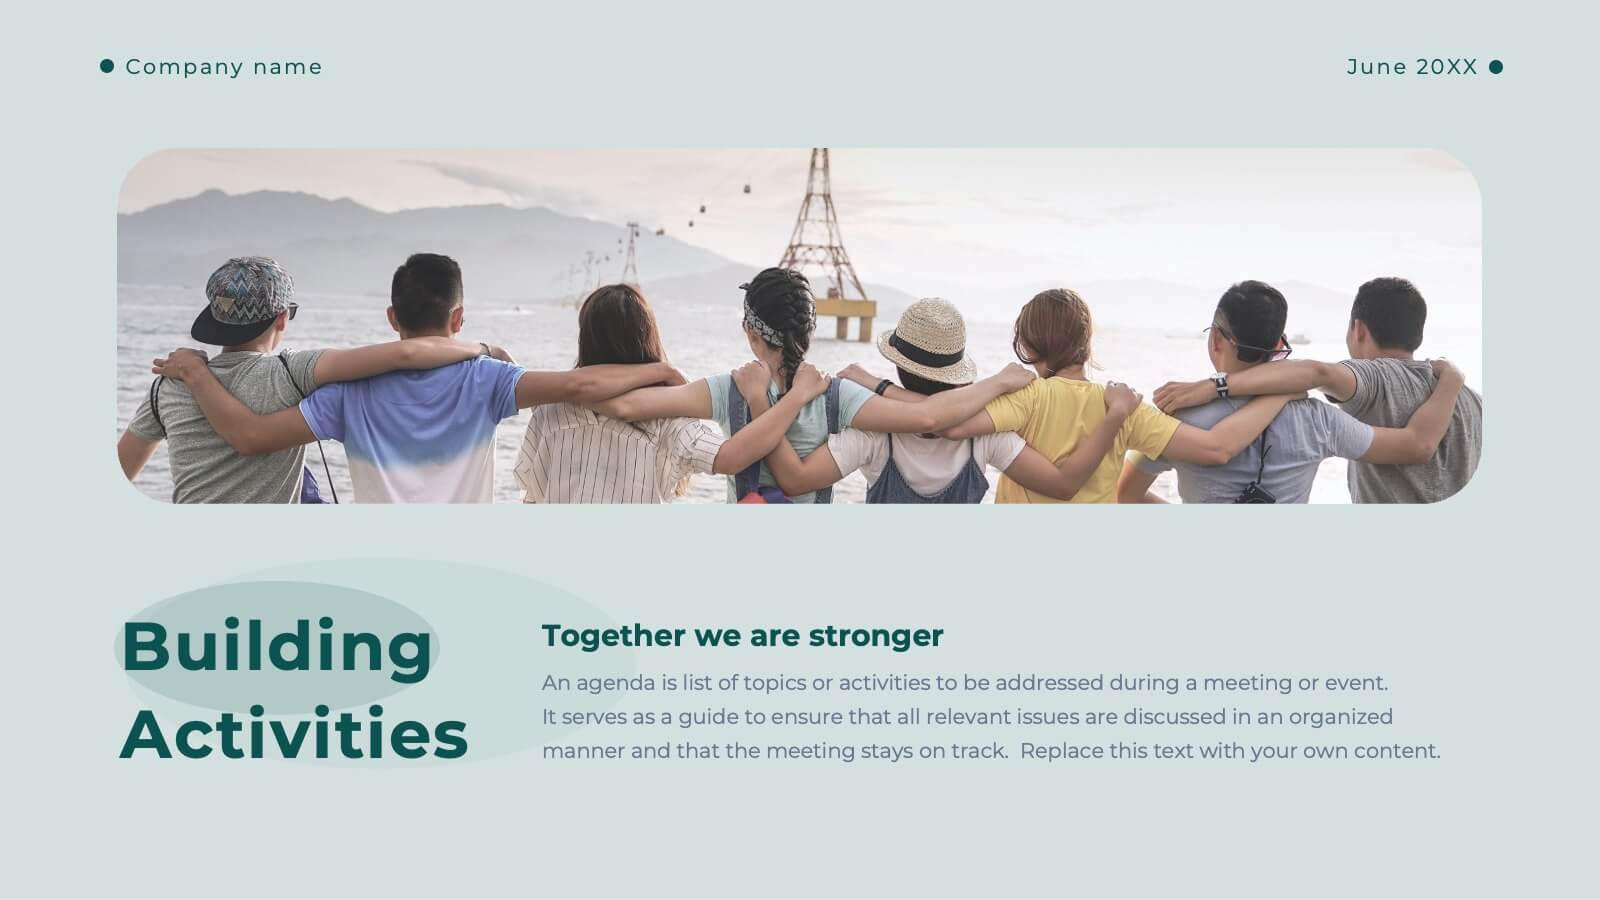
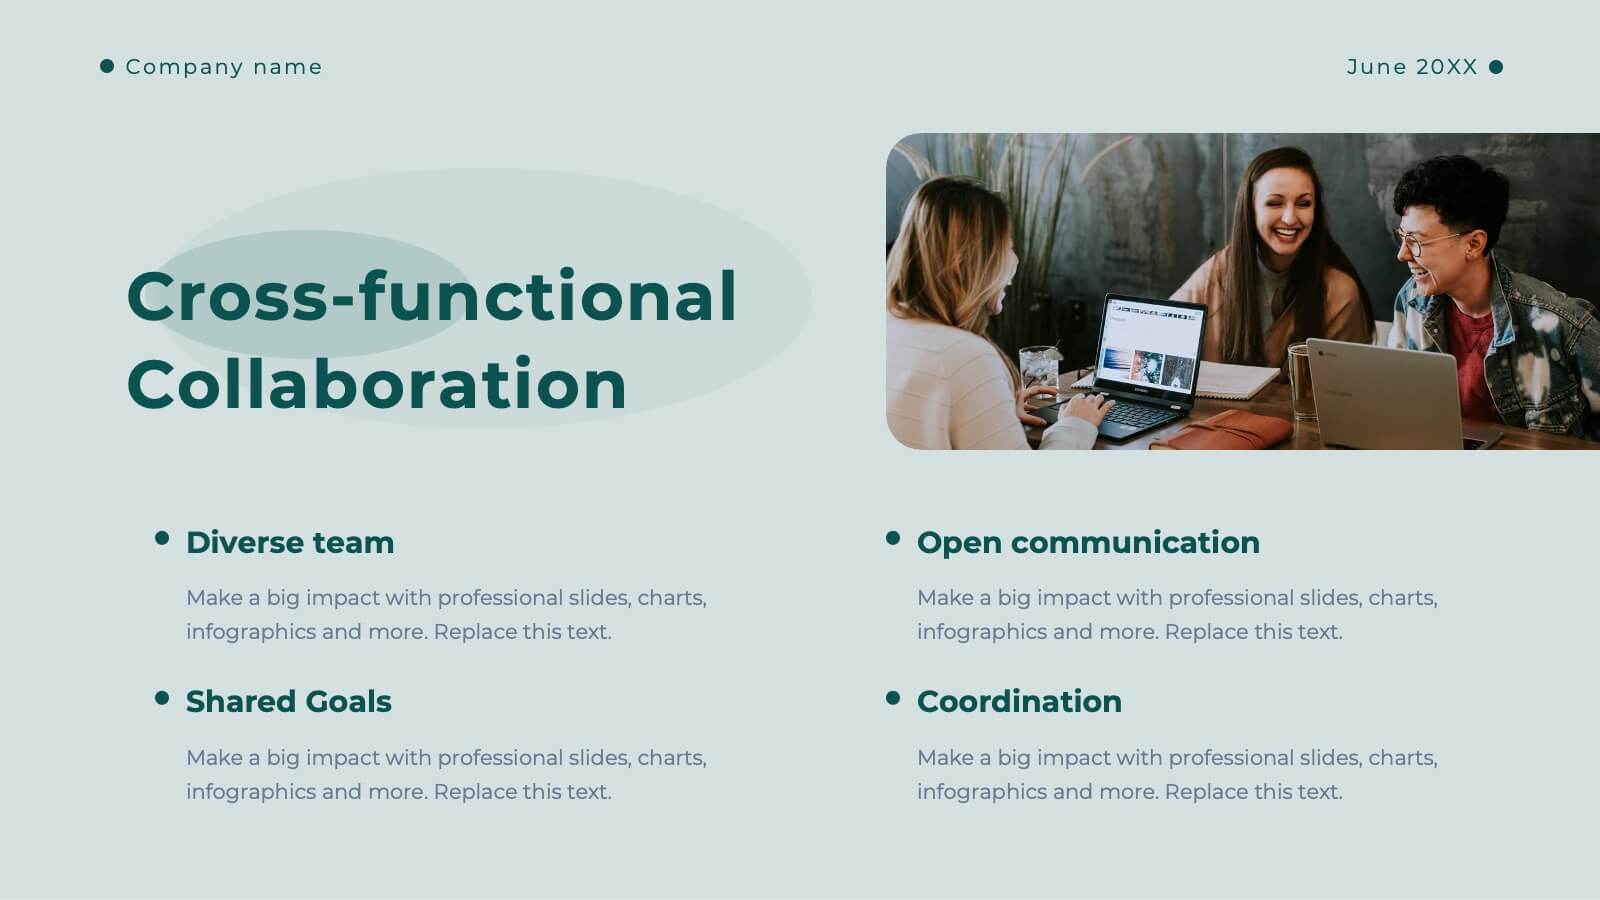
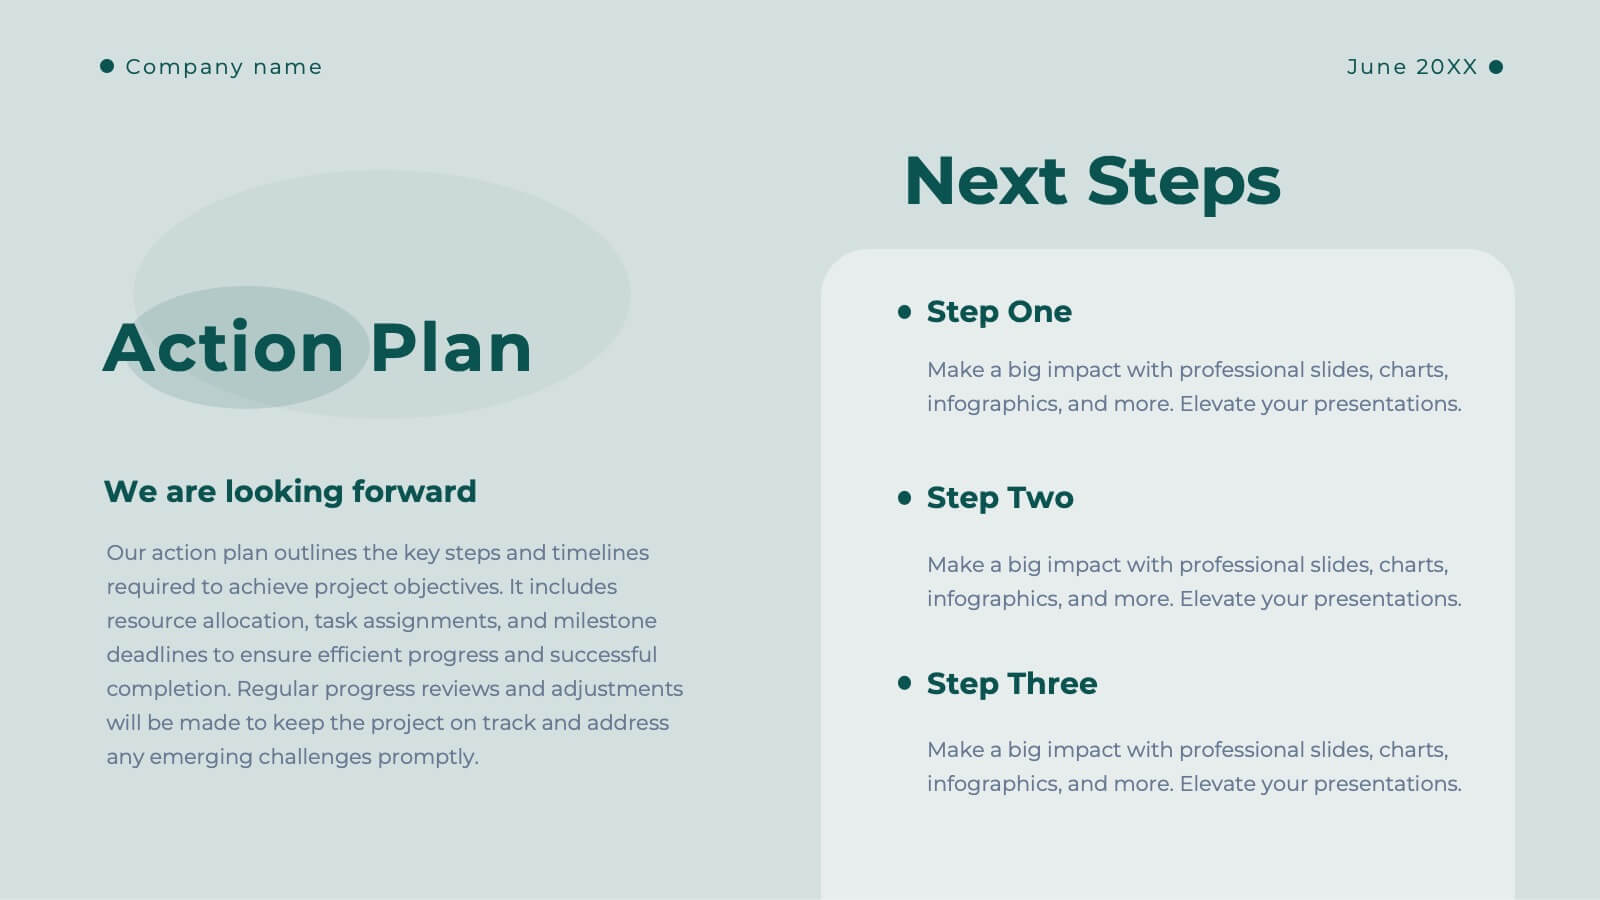
Boardroom Strategy Meeting Overview Presentation
Align leadership goals and present strategic priorities with the Boardroom Strategy Meeting Overview presentation. Featuring a clean visual of executive collaboration, this template helps organize key discussion points, initiatives, and responsibilities in a structured layout. Ideal for quarterly planning, leadership updates, and strategic alignment sessions. Fully editable in PowerPoint, Keynote, and Google Slides.


4 diapositivas
Customers Journey Map Presentation
Take your audience on a smooth, visual adventure that clearly outlines each stage of the customer experience. This presentation helps you map behaviors, highlight key interactions, and explain decision points with clarity and style. Designed for easy customization and fully compatible with PowerPoint, Keynote, and Google Slides.


7 diapositivas
One-Page Business Model Overview Presentation
Simplify your business strategy with this One-Page Business Model slide. Perfect for pitches or internal reviews, it maps out key elements like partners, activities, customers, and revenue on a single page. Clean, customizable blocks help communicate your vision clearly—ideal for startups, entrepreneurs, and teams needing quick business clarity.


22 diapositivas
Sky Drop Full-Service Agency Project Plan Presentation
Step into the world of strategic creativity with the Sky Drop Agency Project Plan template! Designed for modern agencies looking to impress clients and stakeholders, this template offers a sleek and professional design that highlights your agency's strengths, processes, and successes. With dedicated sections for mission and vision, team introduction, services, and client testimonials, this template provides a comprehensive overview of your agency's capabilities. It's perfect for showcasing case studies, market analysis, and future outlooks, helping you to build trust and establish credibility. Whether you're presenting a new project plan or updating clients on progress, this template ensures your information is communicated clearly and effectively. Fully customizable and compatible with PowerPoint, Keynote, and Google Slides, the Sky Drop template is your go-to for creating presentations that leave a lasting impact. Impress your audience and elevate your agency's brand with this powerful presentation tool!


21 diapositivas
Utopia Marketing Proposal Template Presentation
Unleash your marketing potential with this vibrant, modern presentation template. Perfect for presenting marketing proposals, industry overviews, and consumer behavior analysis, it features a colorful design that captures attention. Highlight key strategies like social media, influencer marketing, and SEO trends to engage your audience. Compatible with PowerPoint, Keynote, and Google Slides, it ensures seamless presentations on any platform.


20 diapositivas
Oceandra Sales Proposal Presentation
Present your sales strategy with precision and professionalism using this versatile proposal template. Designed to clearly communicate your problem statement, proposed solutions, and goals, it’s perfect for impressing potential clients and stakeholders. Walk your audience through the project scope, methodology, and deliverables with clean, visually appealing layouts. With sections for pricing structures, team expertise, and risk mitigation strategies, this template ensures your proposal is comprehensive and persuasive. The next steps and action plan slide helps solidify your commitment to achieving results. Fully compatible with PowerPoint, Google Slides, and Keynote, it’s customizable to meet any business or industry requirements. Ideal for turning prospects into partnerships!


6 diapositivas
Event and Meeting Schedule Calendar Presentation
Simplify your weekly planning with this modern and visually intuitive event calendar template. Featuring a clean grid layout, this presentation allows you to organize key meetings, deadlines, or project highlights across six weeks. Each week is color-coded for quick reference, and each event box is fully editable to include titles and custom notes. Ideal for team leaders, educators, corporate planners, and event organizers. Compatible with PowerPoint, Keynote, and Google Slides for effortless use.


6 diapositivas
Key Points Overview Presentation
Bring your message to life with a slide that makes every key point feel clear, organized, and easy to follow. This presentation helps you highlight essential ideas, compare insights, and simplify complex information for any audience. Perfect for meetings, reports, or strategy updates. Fully compatible with PowerPoint, Keynote, and Google Slides.