


Características


¿Tienes alguna pregunta?
Recomendar


4 diapositivas
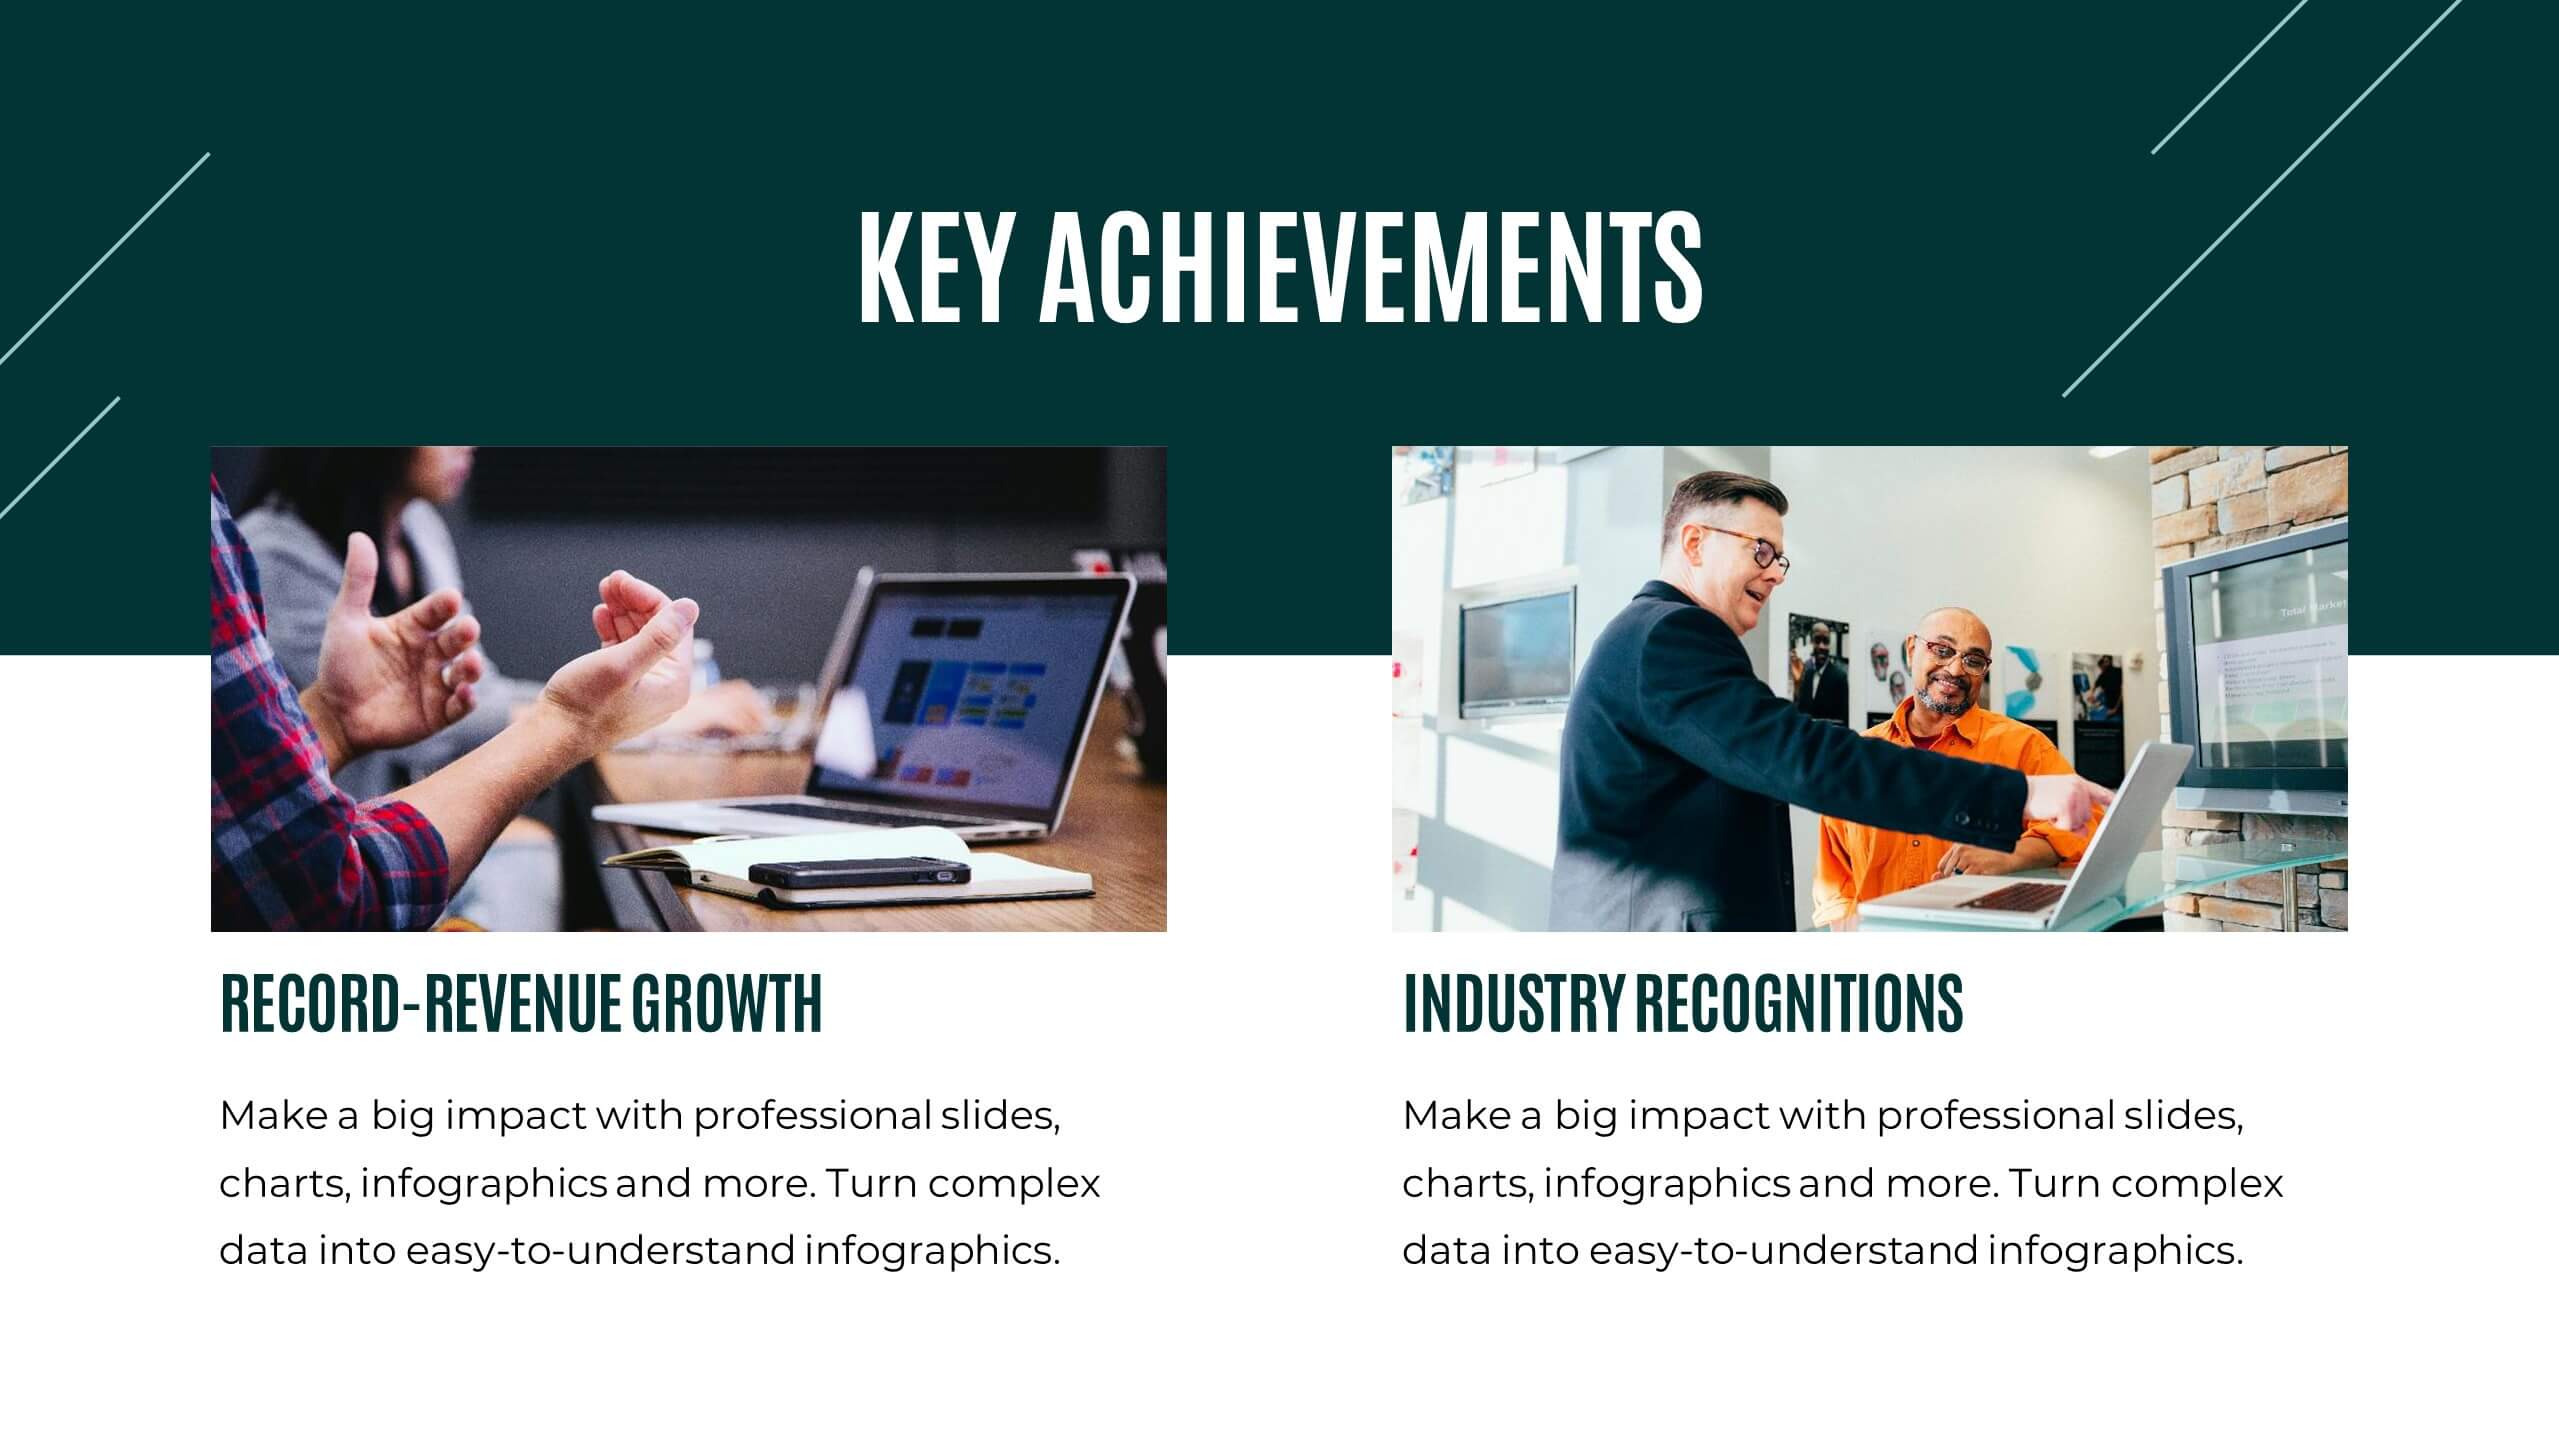
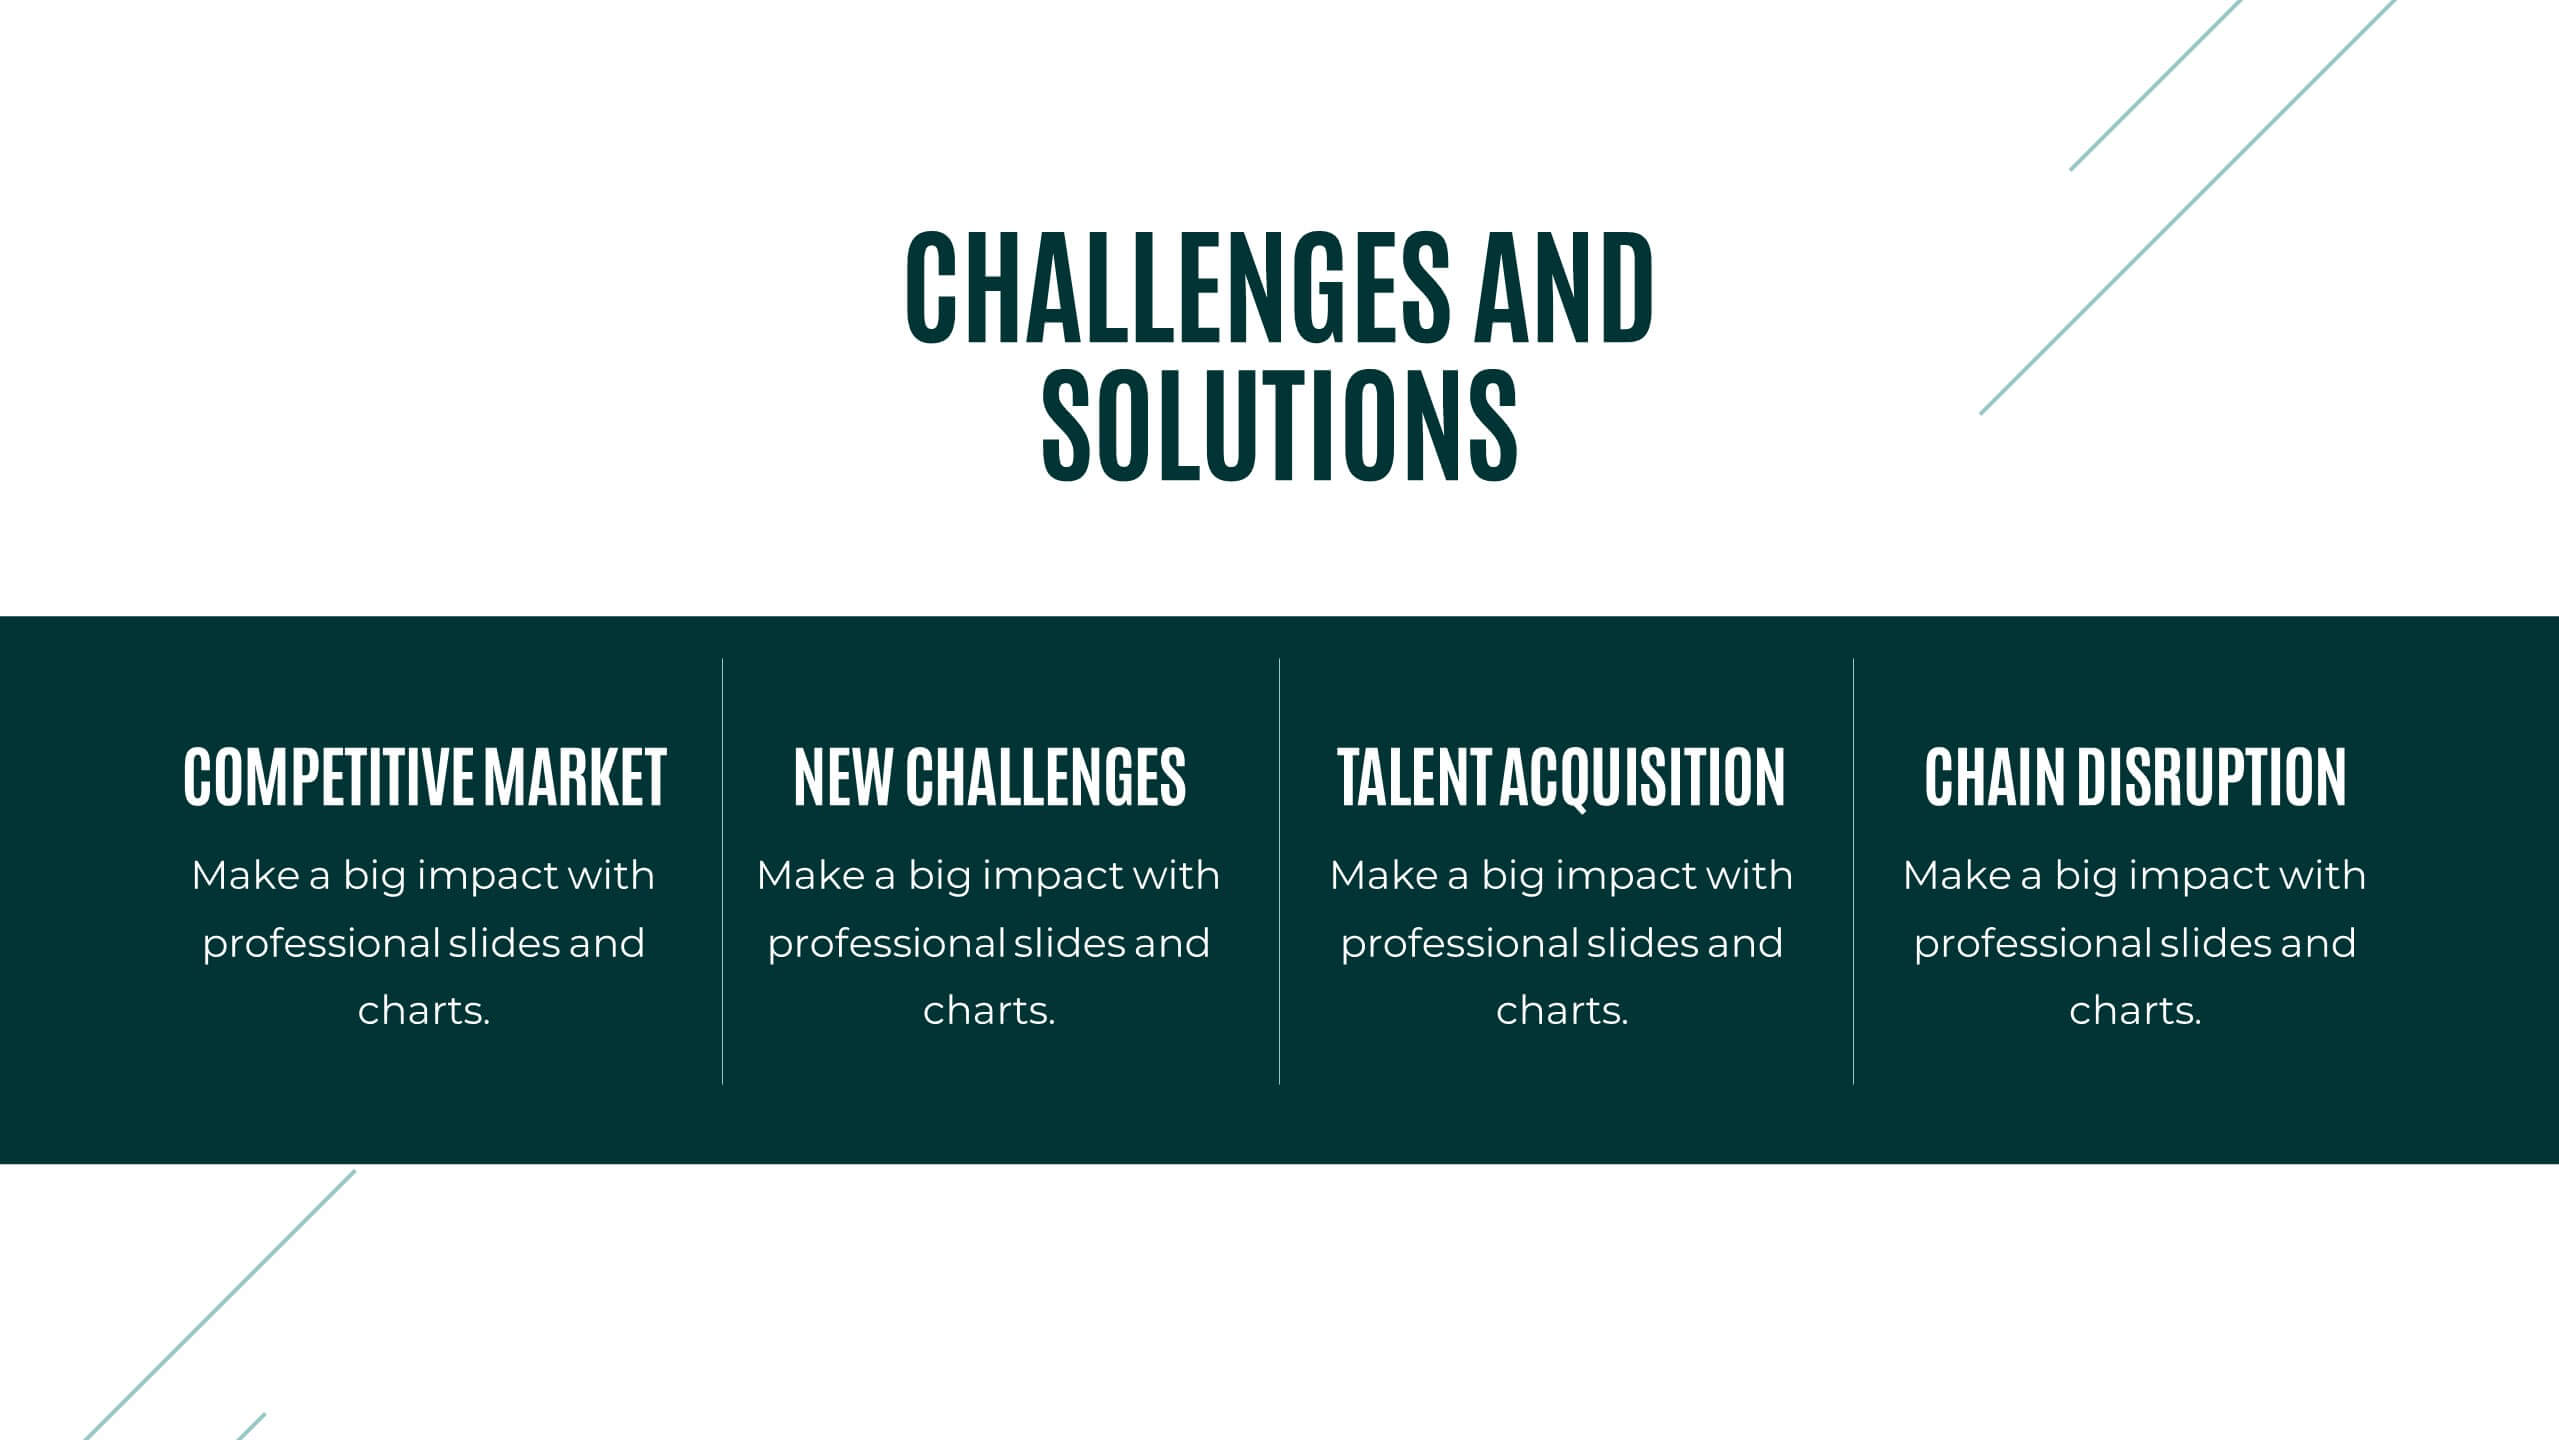
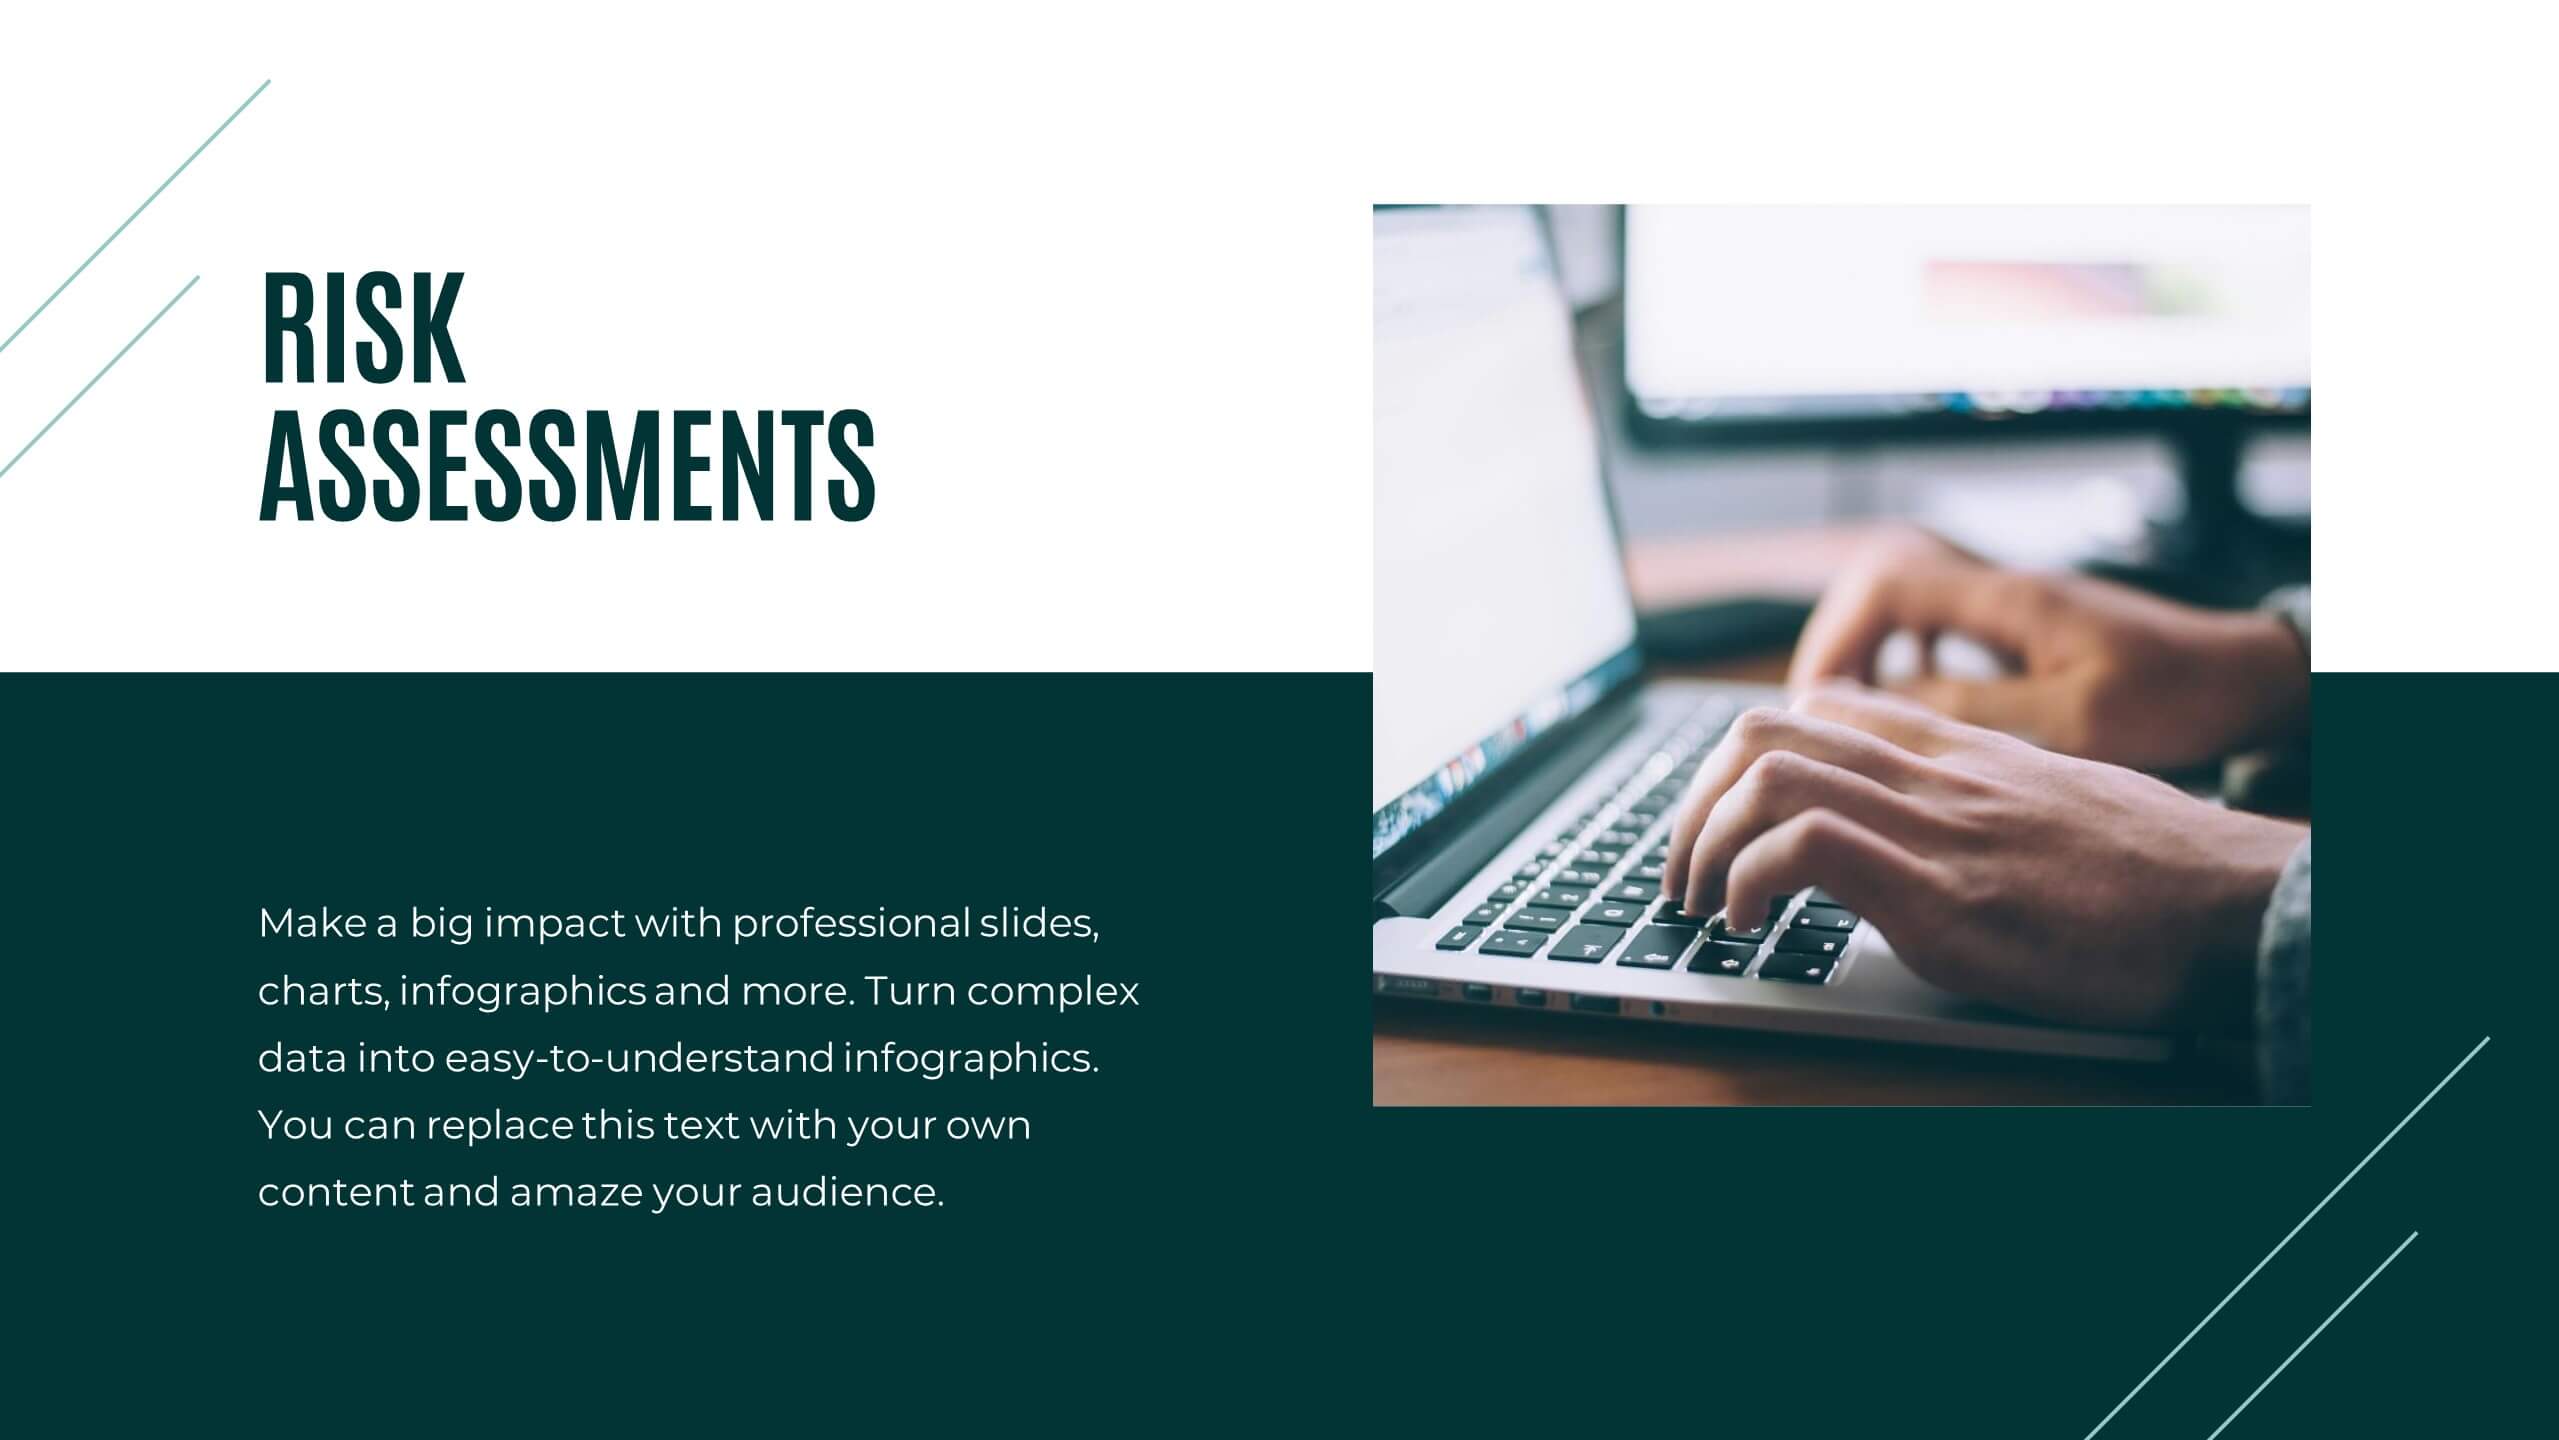
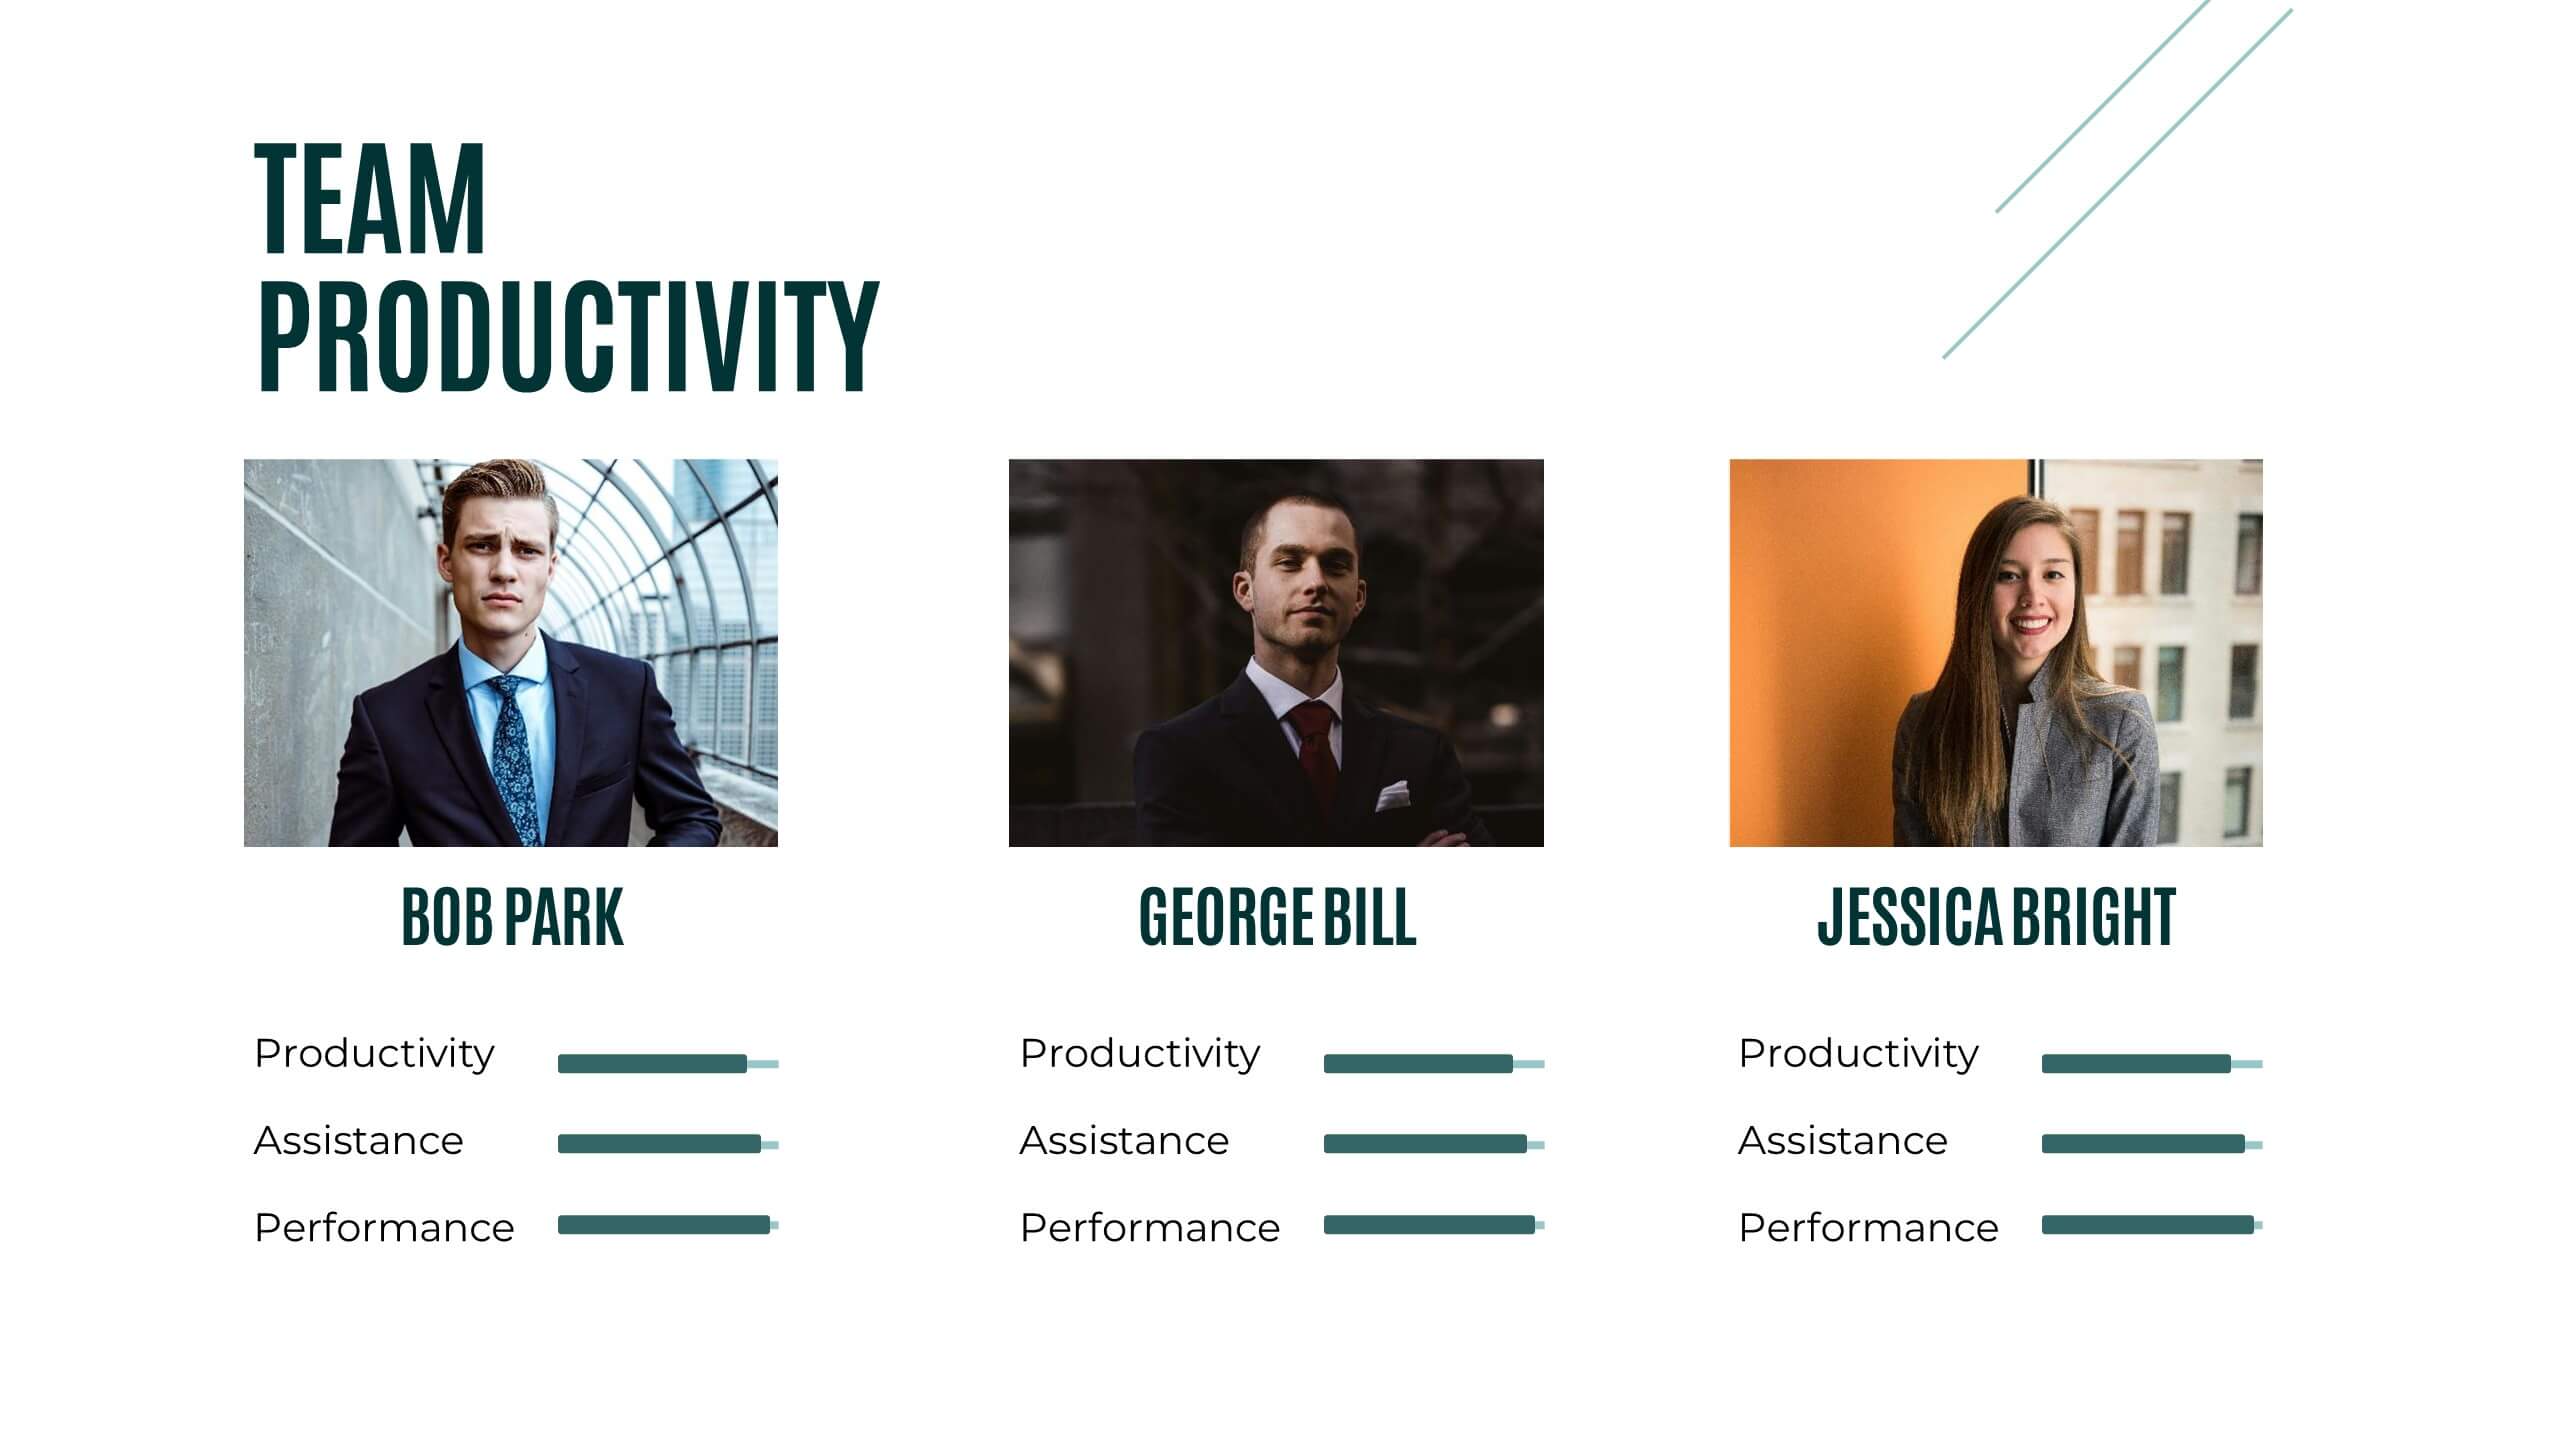
High-Performance Team Collaboration Presentation
Showcase teamwork, trust, and synergy with this bold, interconnected arms graphic. Ideal for illustrating roles, partnerships, or team frameworks, this infographic is perfect for leadership, HR, or corporate strategy slides. Fully customizable in PowerPoint, Keynote, and Google Slides.


23 diapositivas
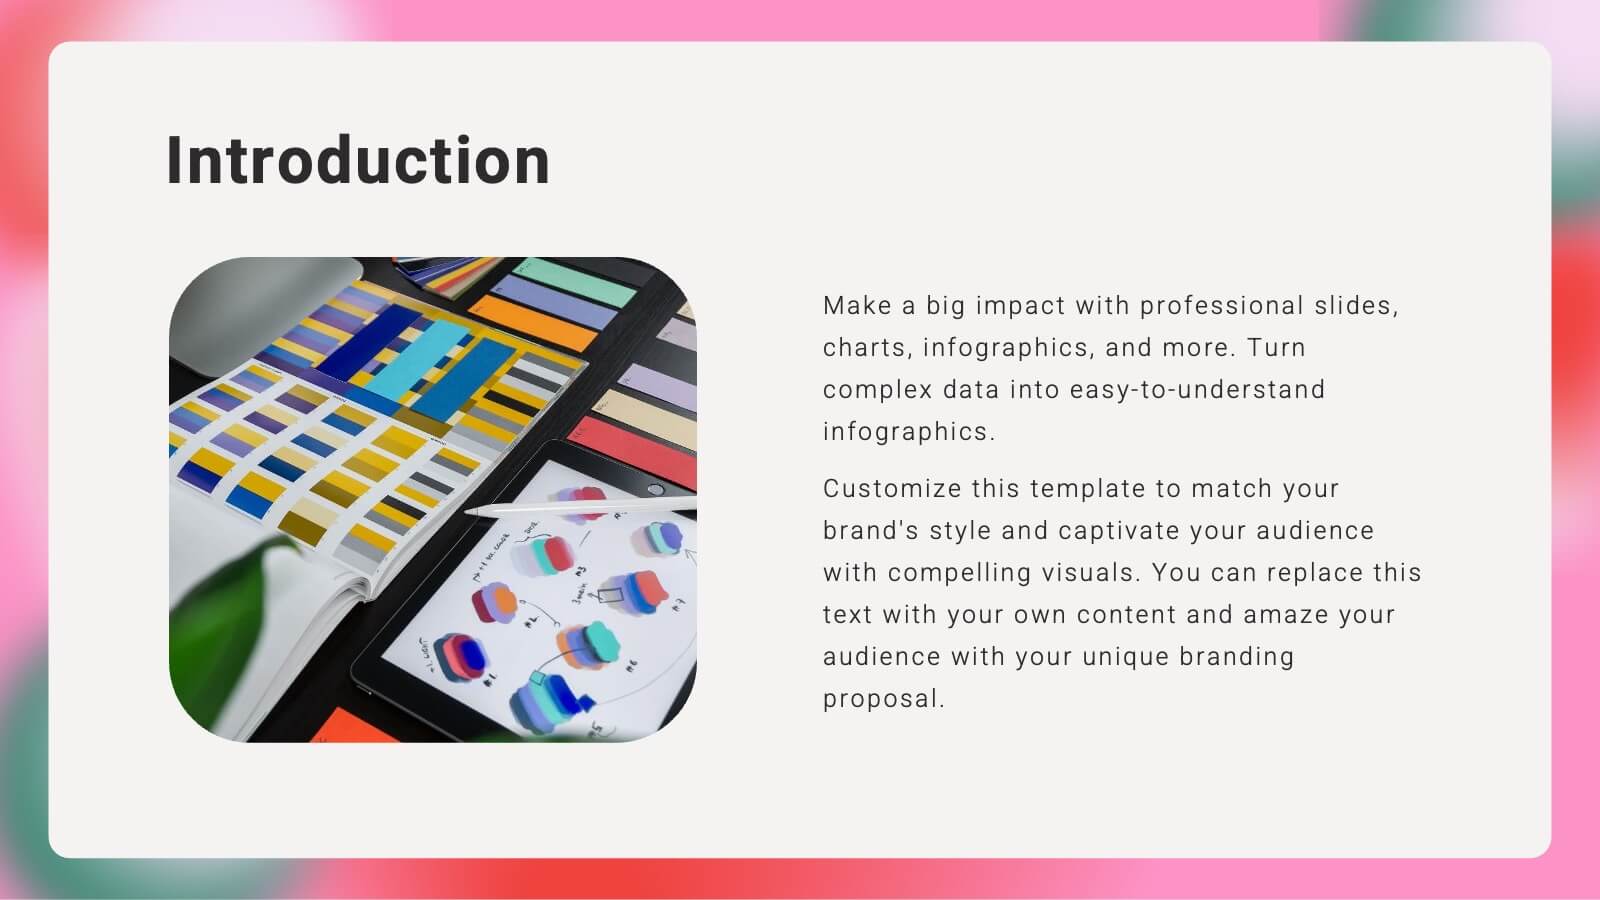
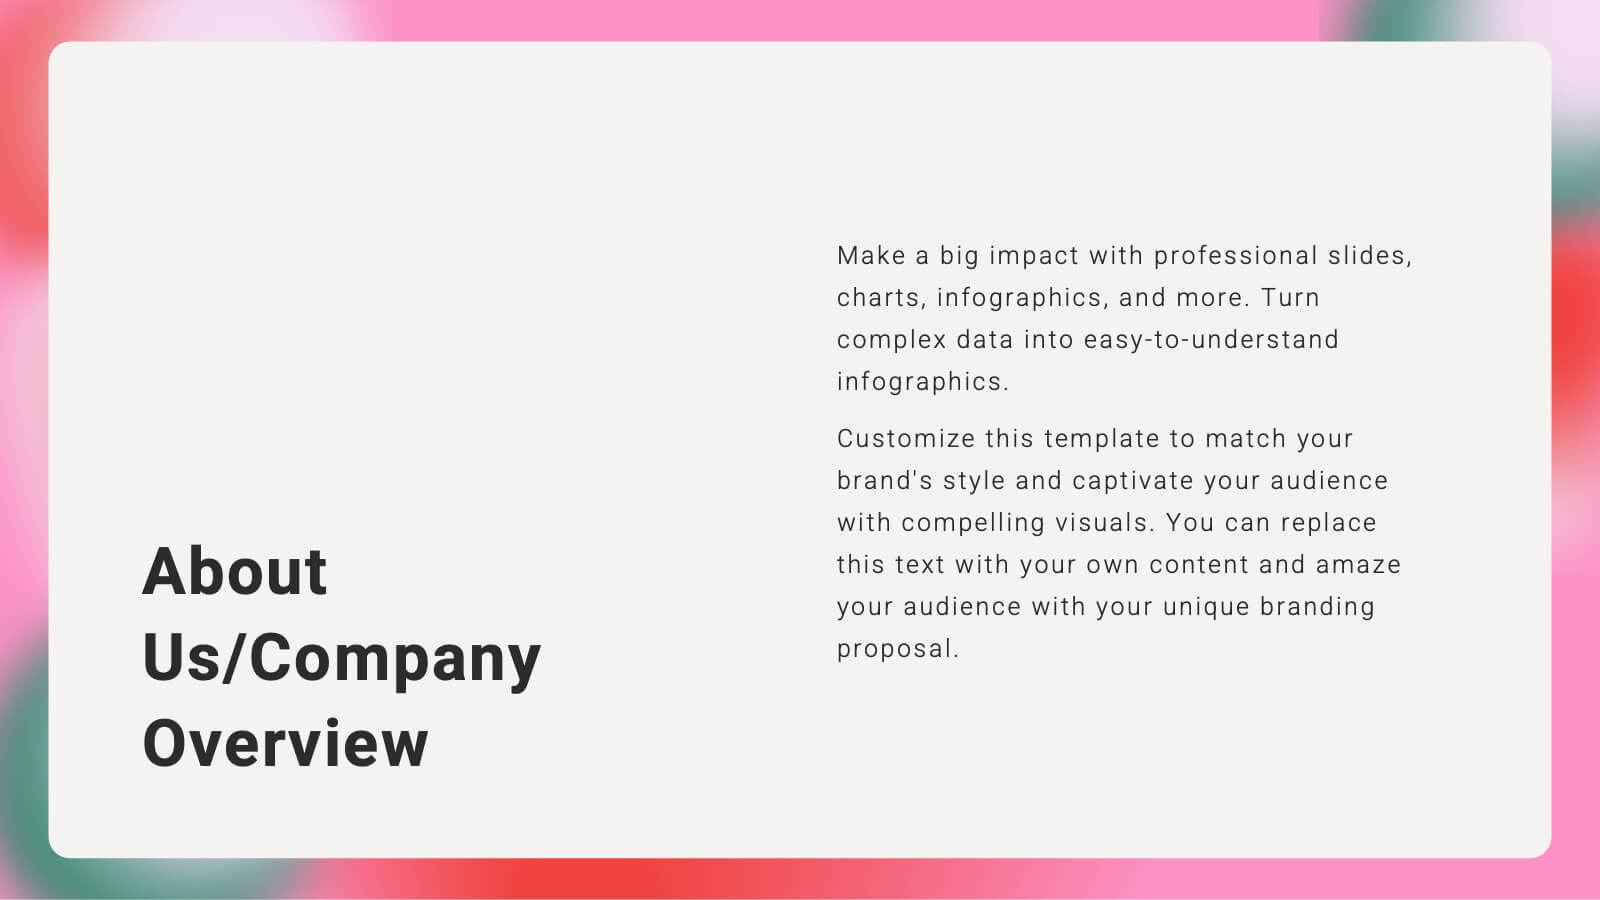
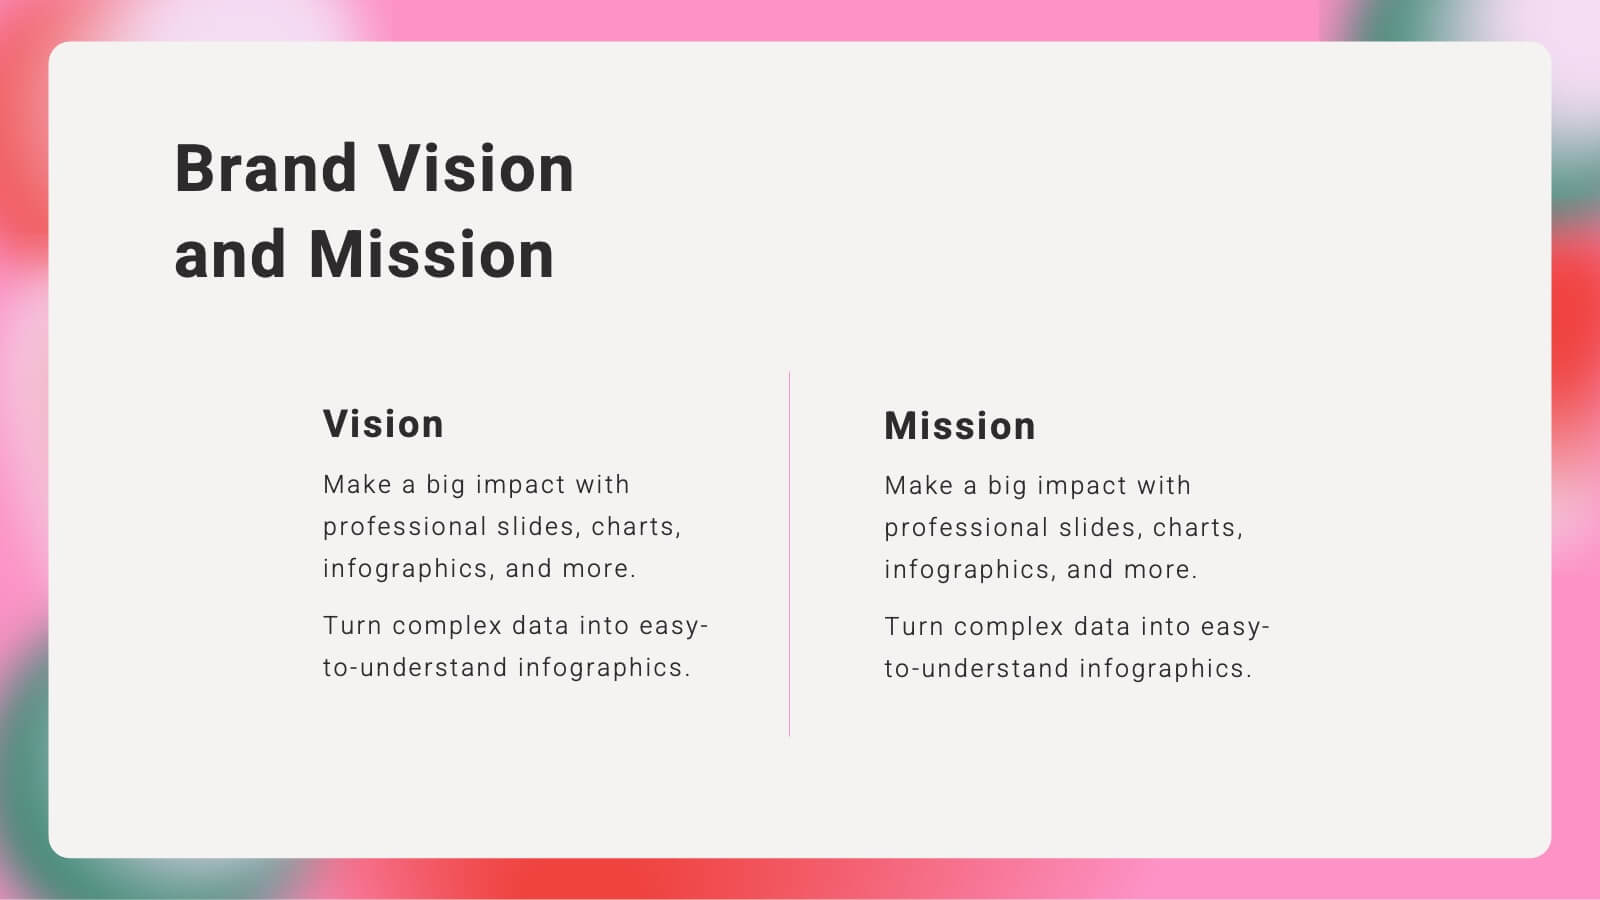
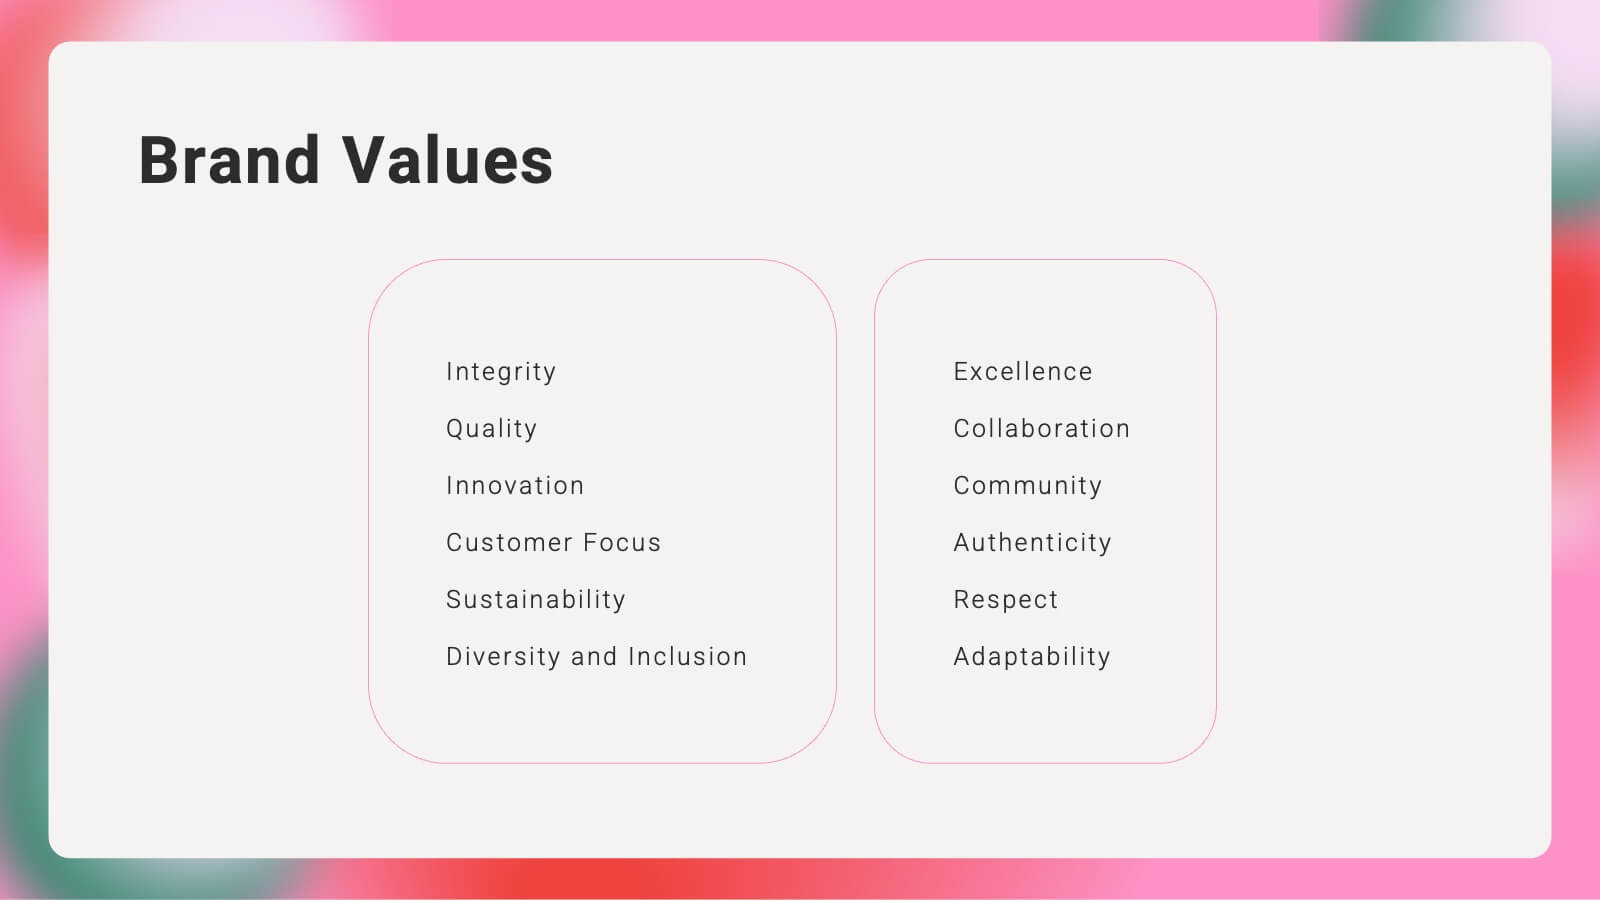
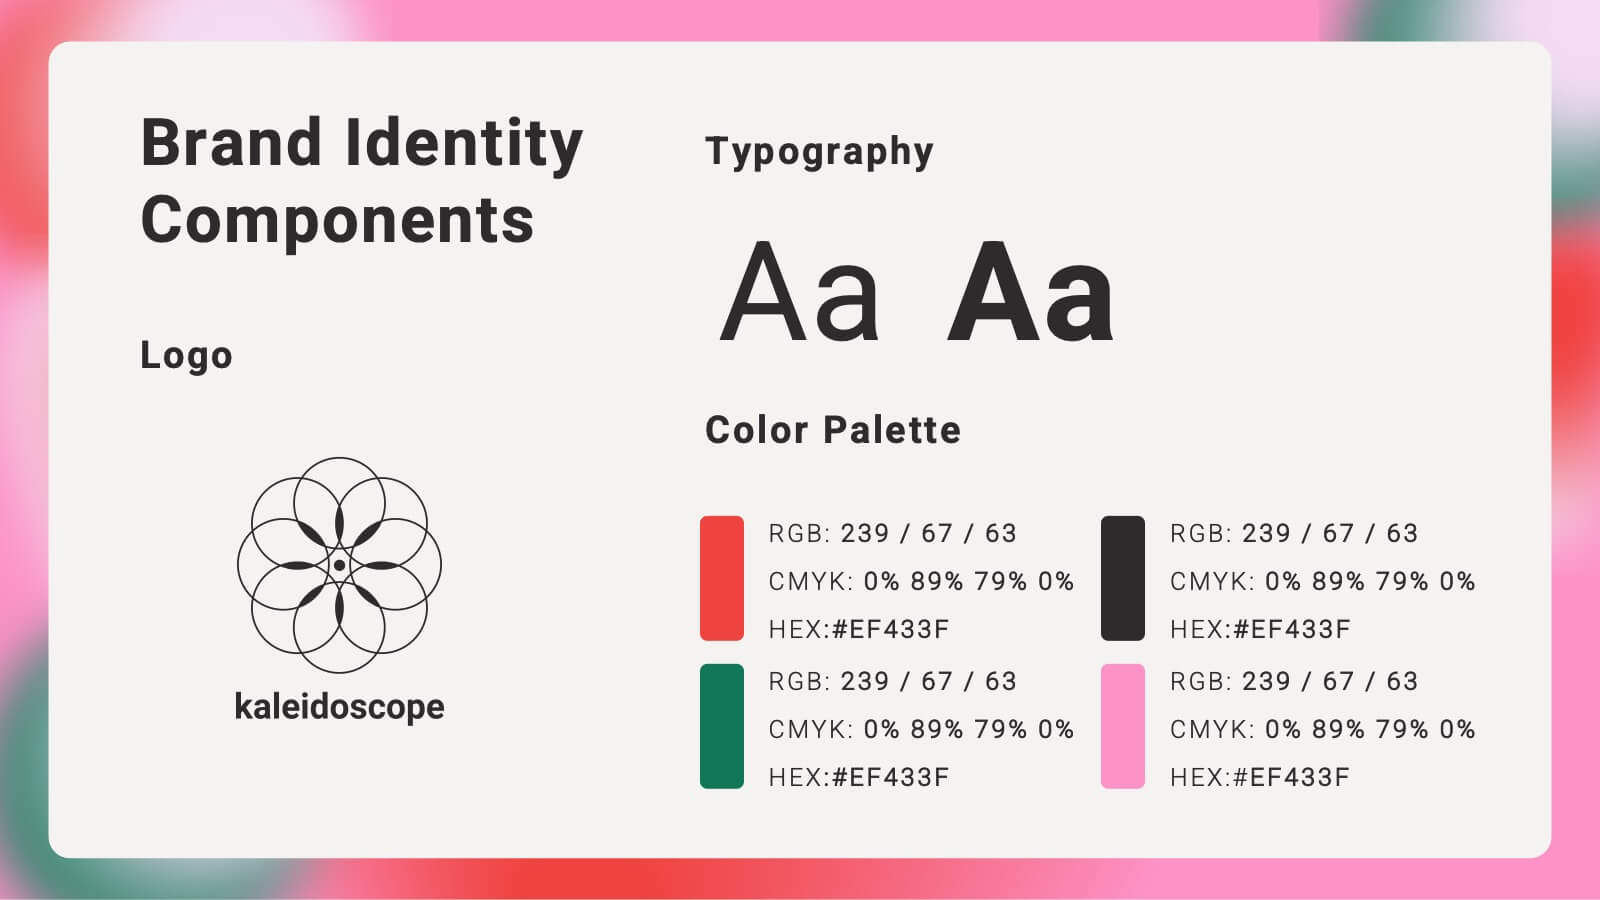
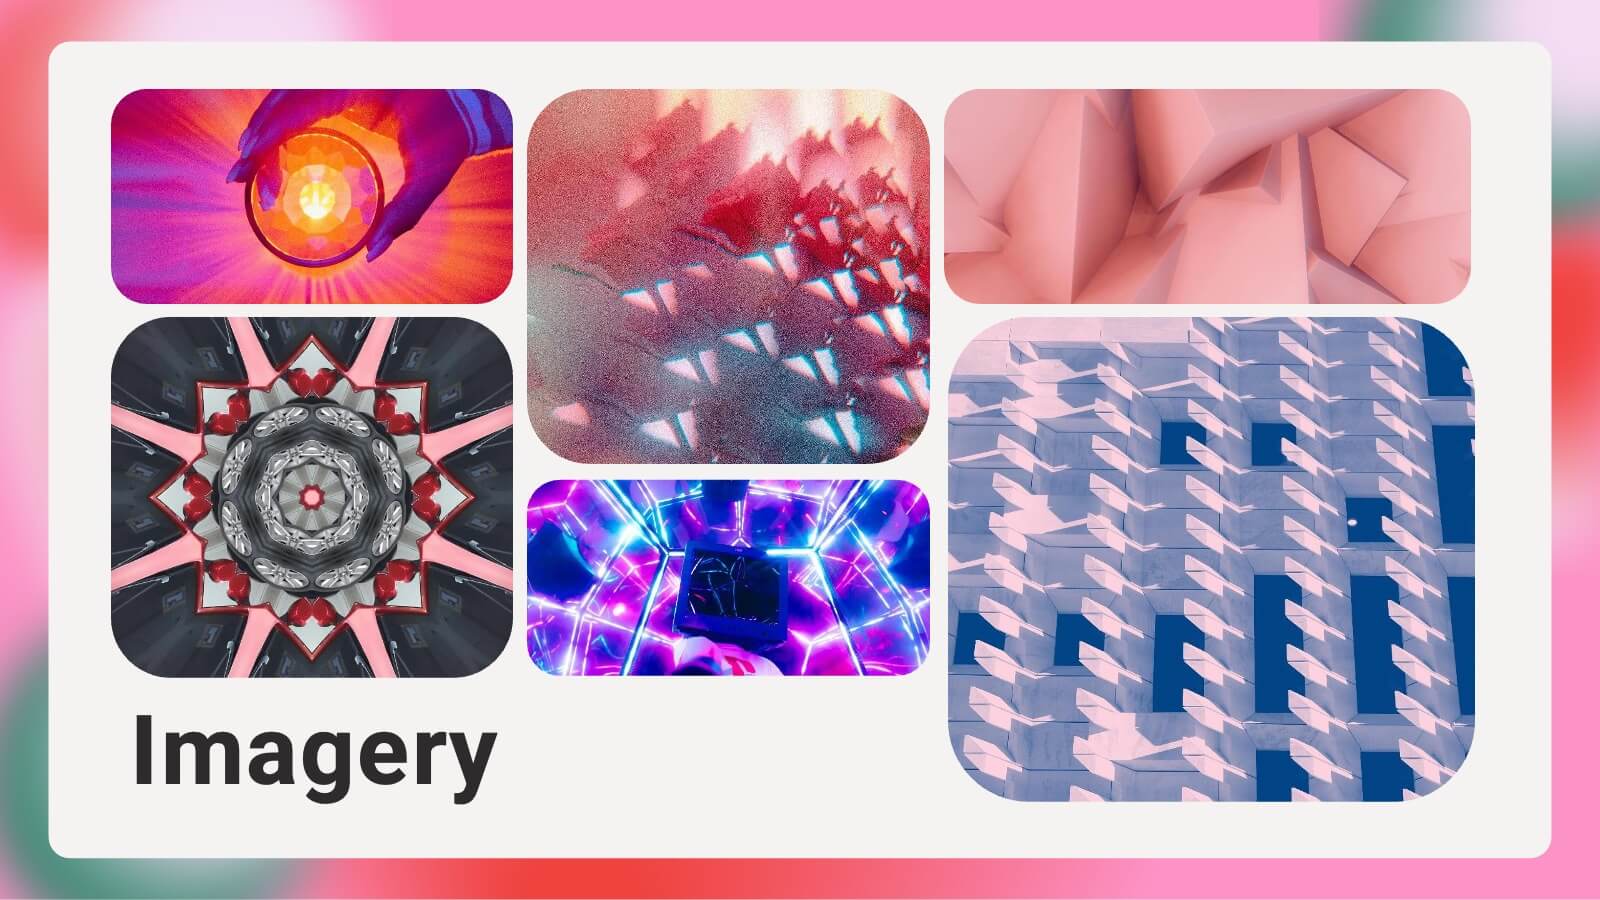
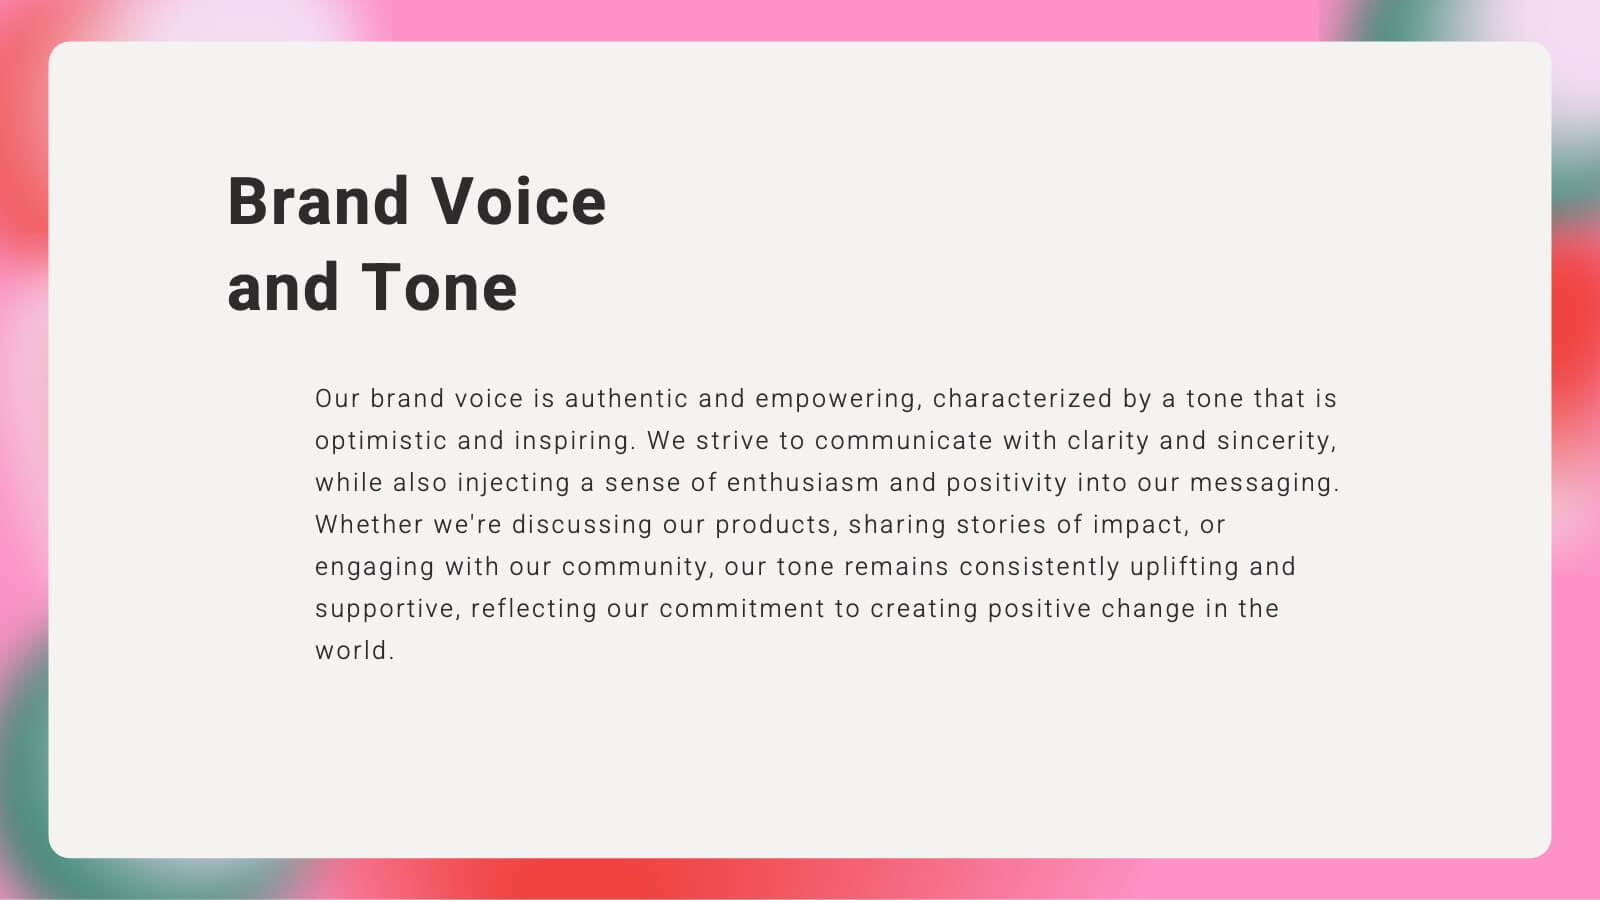
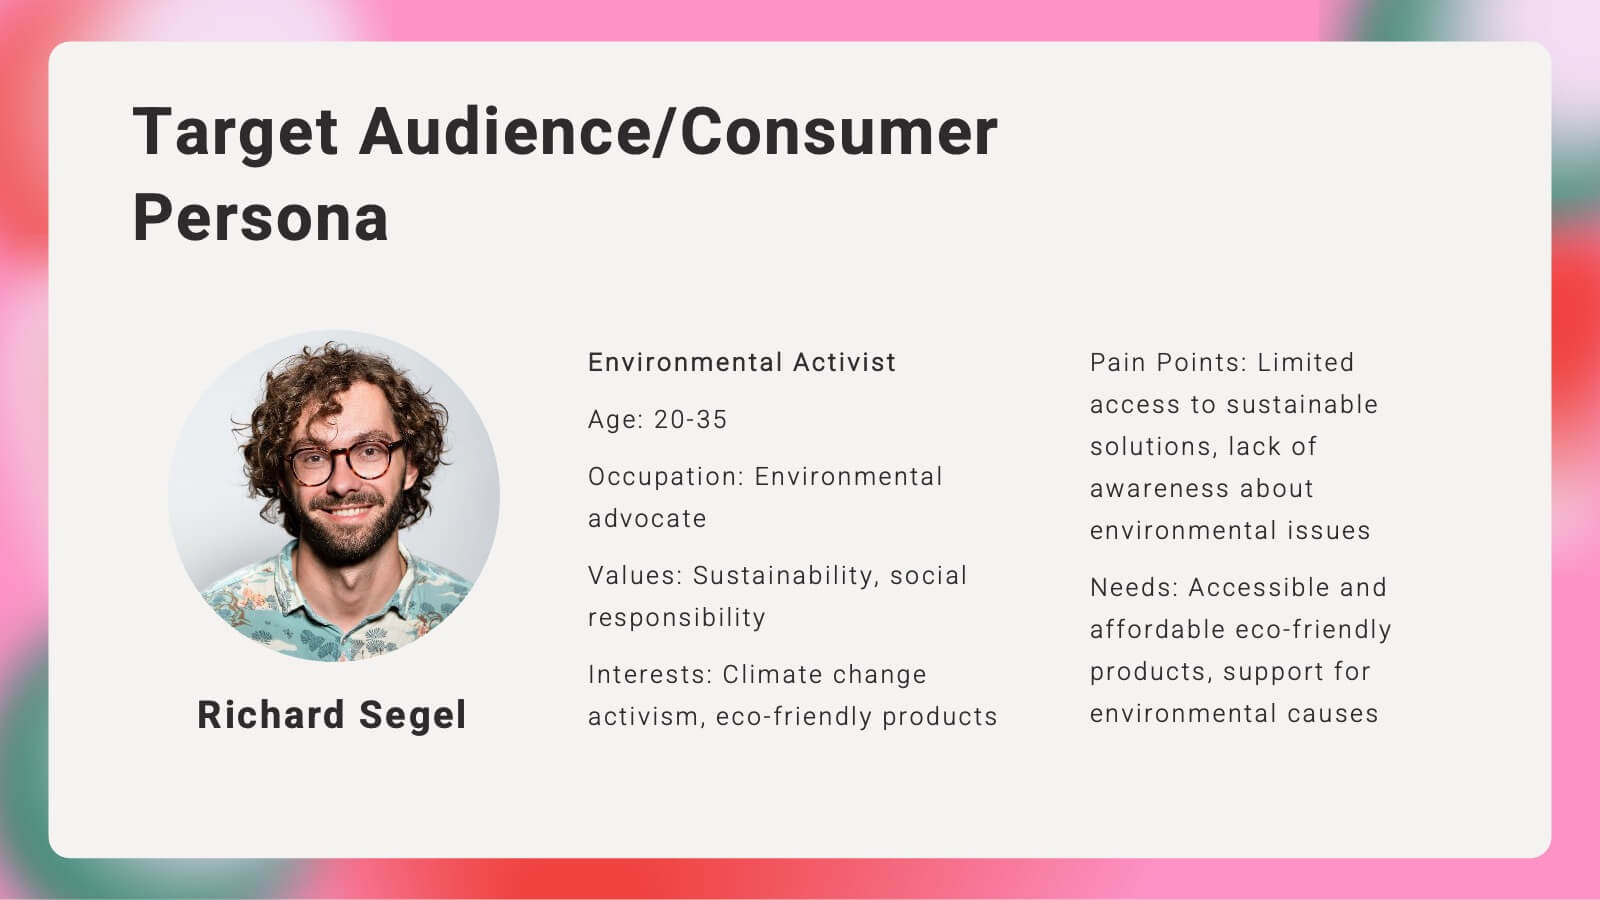
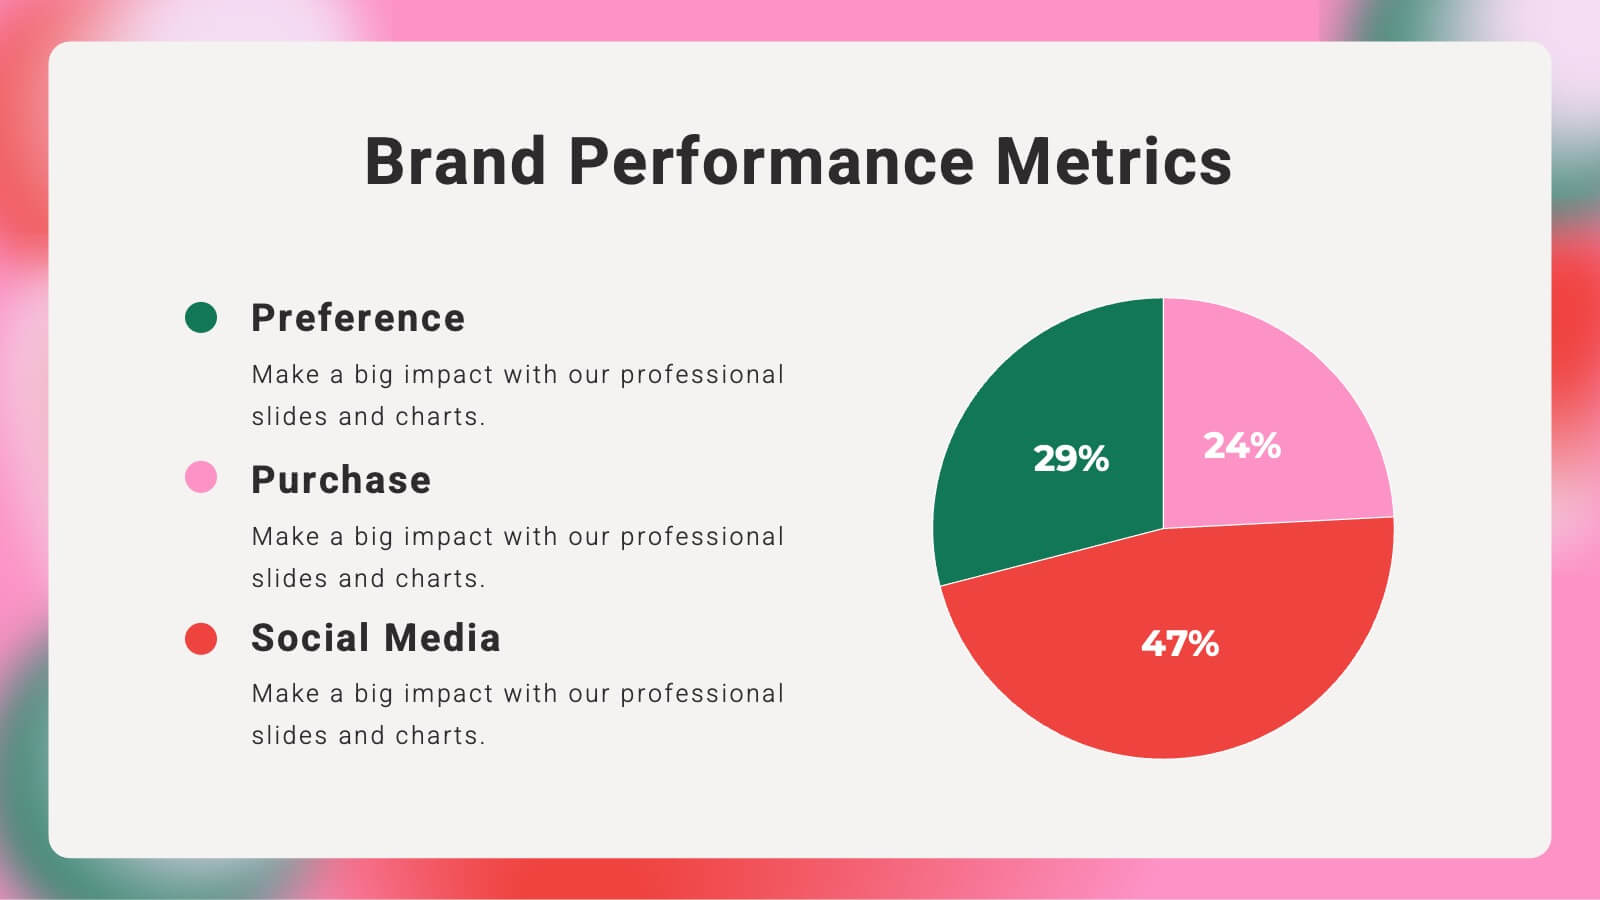
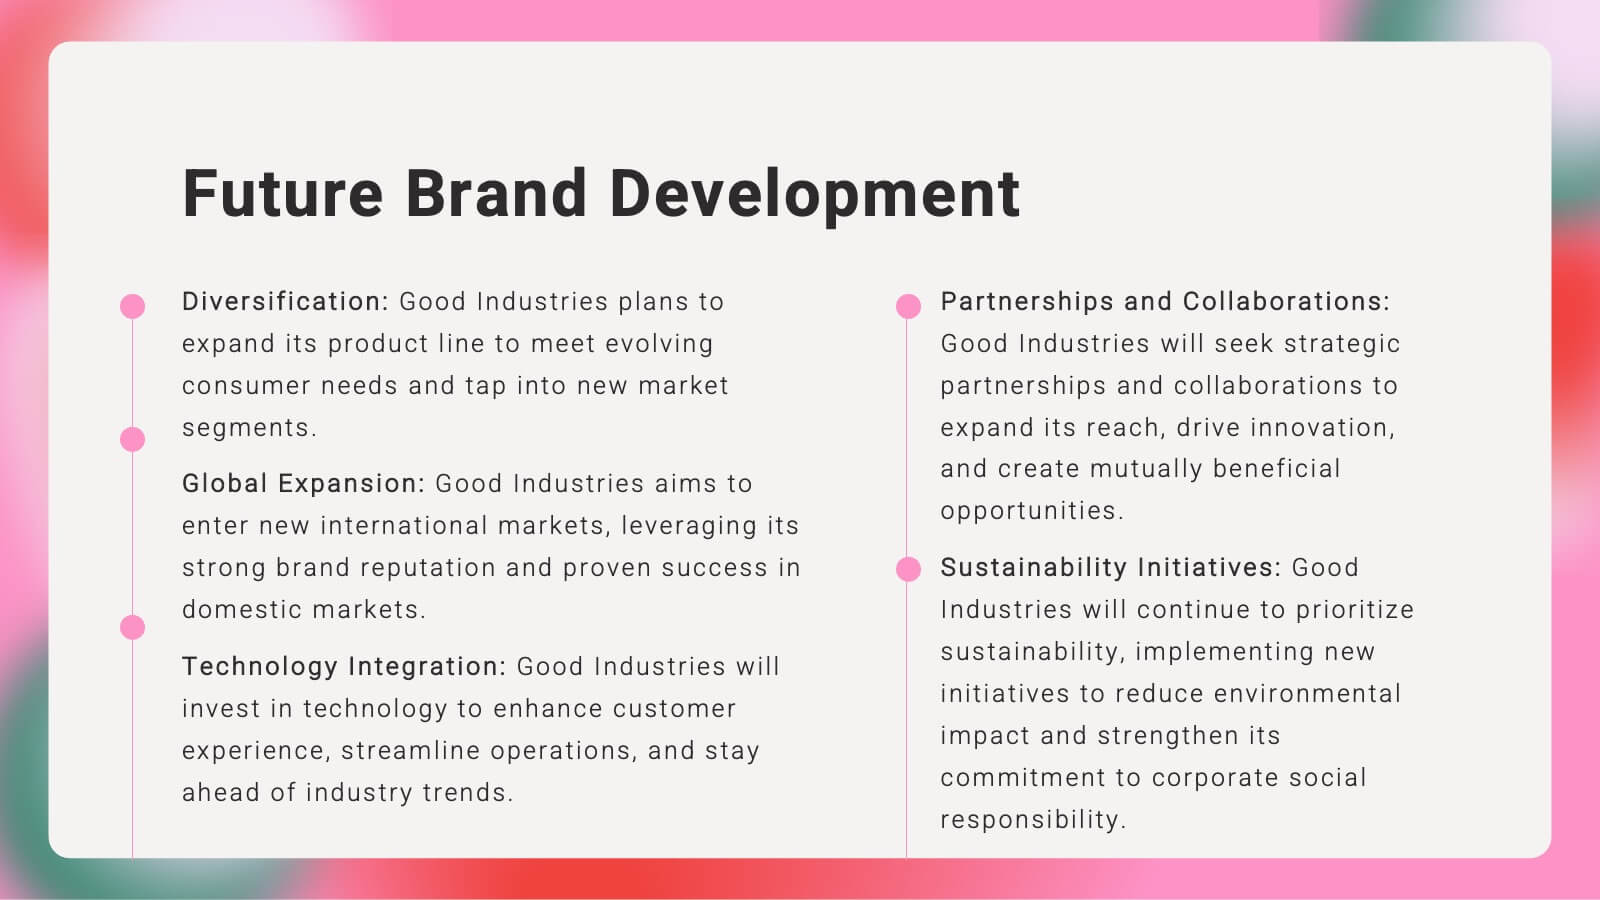
Kaleidoscope Brand Strategy Report Presentation
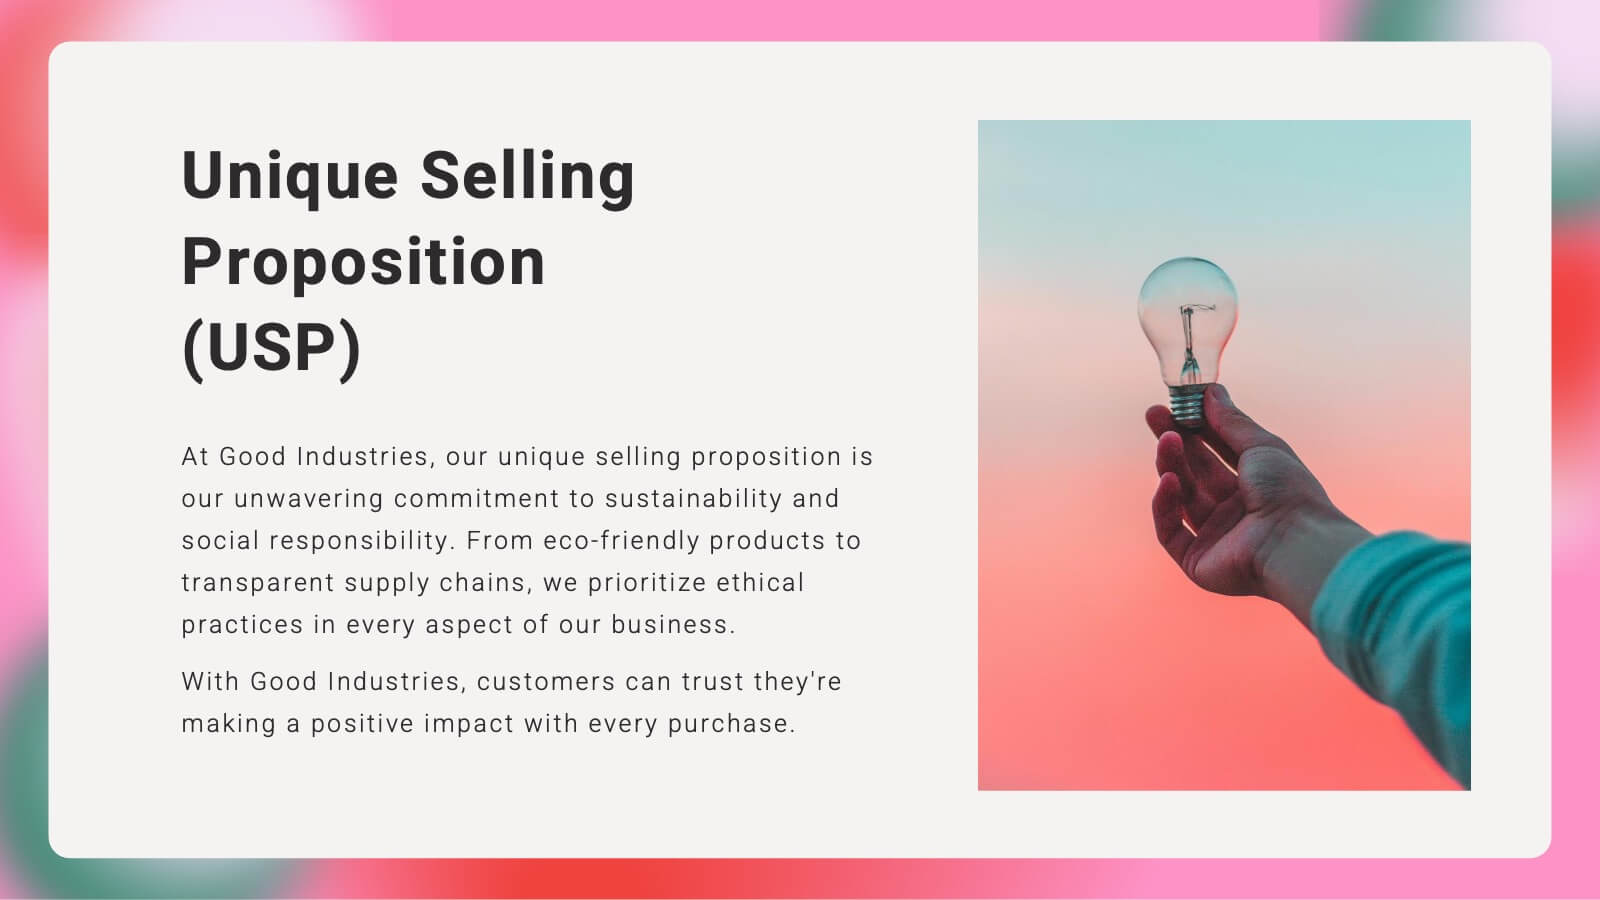
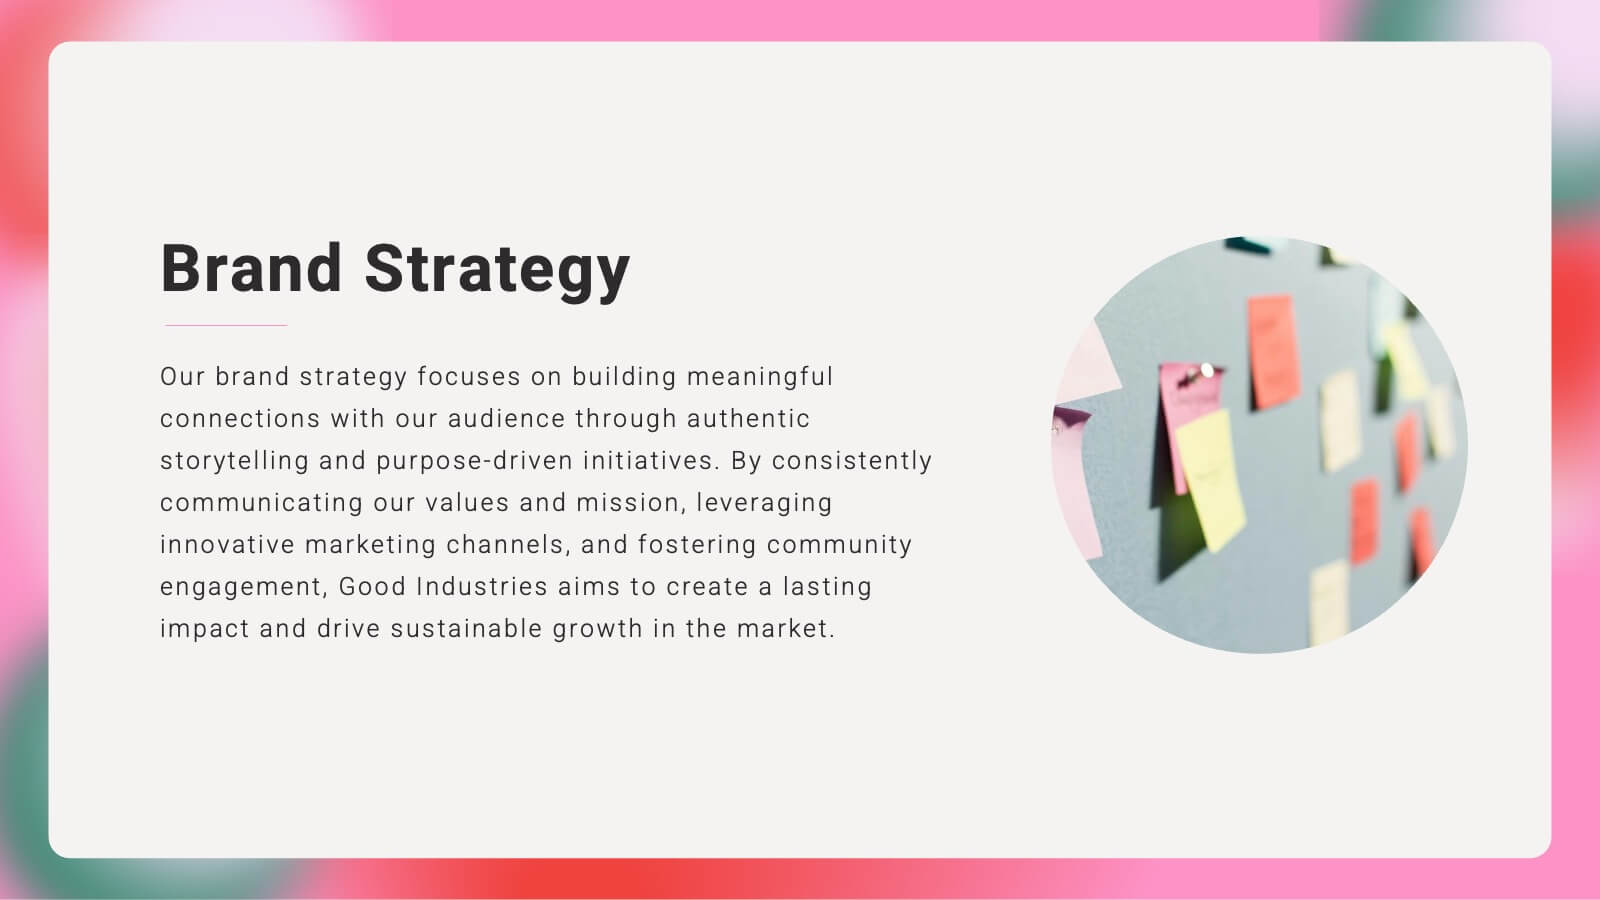
Craft a compelling narrative for your brand with this vibrant brand strategy presentation template. Designed to cover every facet of brand development, from vision and mission to market analysis and consumer personas, this template is an essential tool for businesses looking to establish a strong brand identity. It incorporates visually engaging slides that outline brand voice, values, and touchpoints, facilitating a thorough understanding of strategic branding. Compatible with platforms like PowerPoint, Google Slides, and Keynote, it is accessible across various devices, making it perfect for collaborative planning and presentations.


4 diapositivas
Progress Indicators with Harvey Visuals Presentation
Track multiple projects at a glance with the Progress Indicators with Harvey Visuals Presentation. This slide design uses Harvey balls and icons to clearly communicate status across key metrics such as schedule, budget, risk, and issues. Ideal for PMOs, stakeholder updates, or cross-functional reviews. Fully editable and compatible with PowerPoint, Keynote, and Google Slides.


26 diapositivas
Startup Presentation
Elevate your startup's story with this Startup Presentation template. It features slides for your mission, innovation highlights, market analysis, and growth strategy. Perfect for engaging potential investors and partners. This versatile template is compatible with PowerPoint, Keynote, and Google Slides, making it easily accessible for all your presentation needs.


22 diapositivas
Sky Drop Full-Service Agency Project Plan Presentation
Step into the world of strategic creativity with the Sky Drop Agency Project Plan template! Designed for modern agencies looking to impress clients and stakeholders, this template offers a sleek and professional design that highlights your agency's strengths, processes, and successes. With dedicated sections for mission and vision, team introduction, services, and client testimonials, this template provides a comprehensive overview of your agency's capabilities. It's perfect for showcasing case studies, market analysis, and future outlooks, helping you to build trust and establish credibility. Whether you're presenting a new project plan or updating clients on progress, this template ensures your information is communicated clearly and effectively. Fully customizable and compatible with PowerPoint, Keynote, and Google Slides, the Sky Drop template is your go-to for creating presentations that leave a lasting impact. Impress your audience and elevate your agency's brand with this powerful presentation tool!


7 diapositivas
Cognitive Psychology and Decision Making Presentation
Navigate the intricate relationship between thought processes and decision-making with our 'Cognitive Psychology and Decision Making' presentation template. Ideal for educators, psychologists, and business strategists, this template provides a structured way to explain how cognitive functions influence decisions. Enhance your next seminar or workshop with this visually engaging template, compatible with PowerPoint, Keynote, and Google Slides.


21 diapositivas
Eidora Qualitative Research Findings Presentation
Present your research findings with confidence using this professional and stylish presentation template. Covering key sections like objectives, methodology, data analysis, and recommendations, it helps you communicate complex information with clarity and impact. Perfect for academic or business use. Compatible with PowerPoint, Keynote, and Google Slides for easy customization.


22 diapositivas
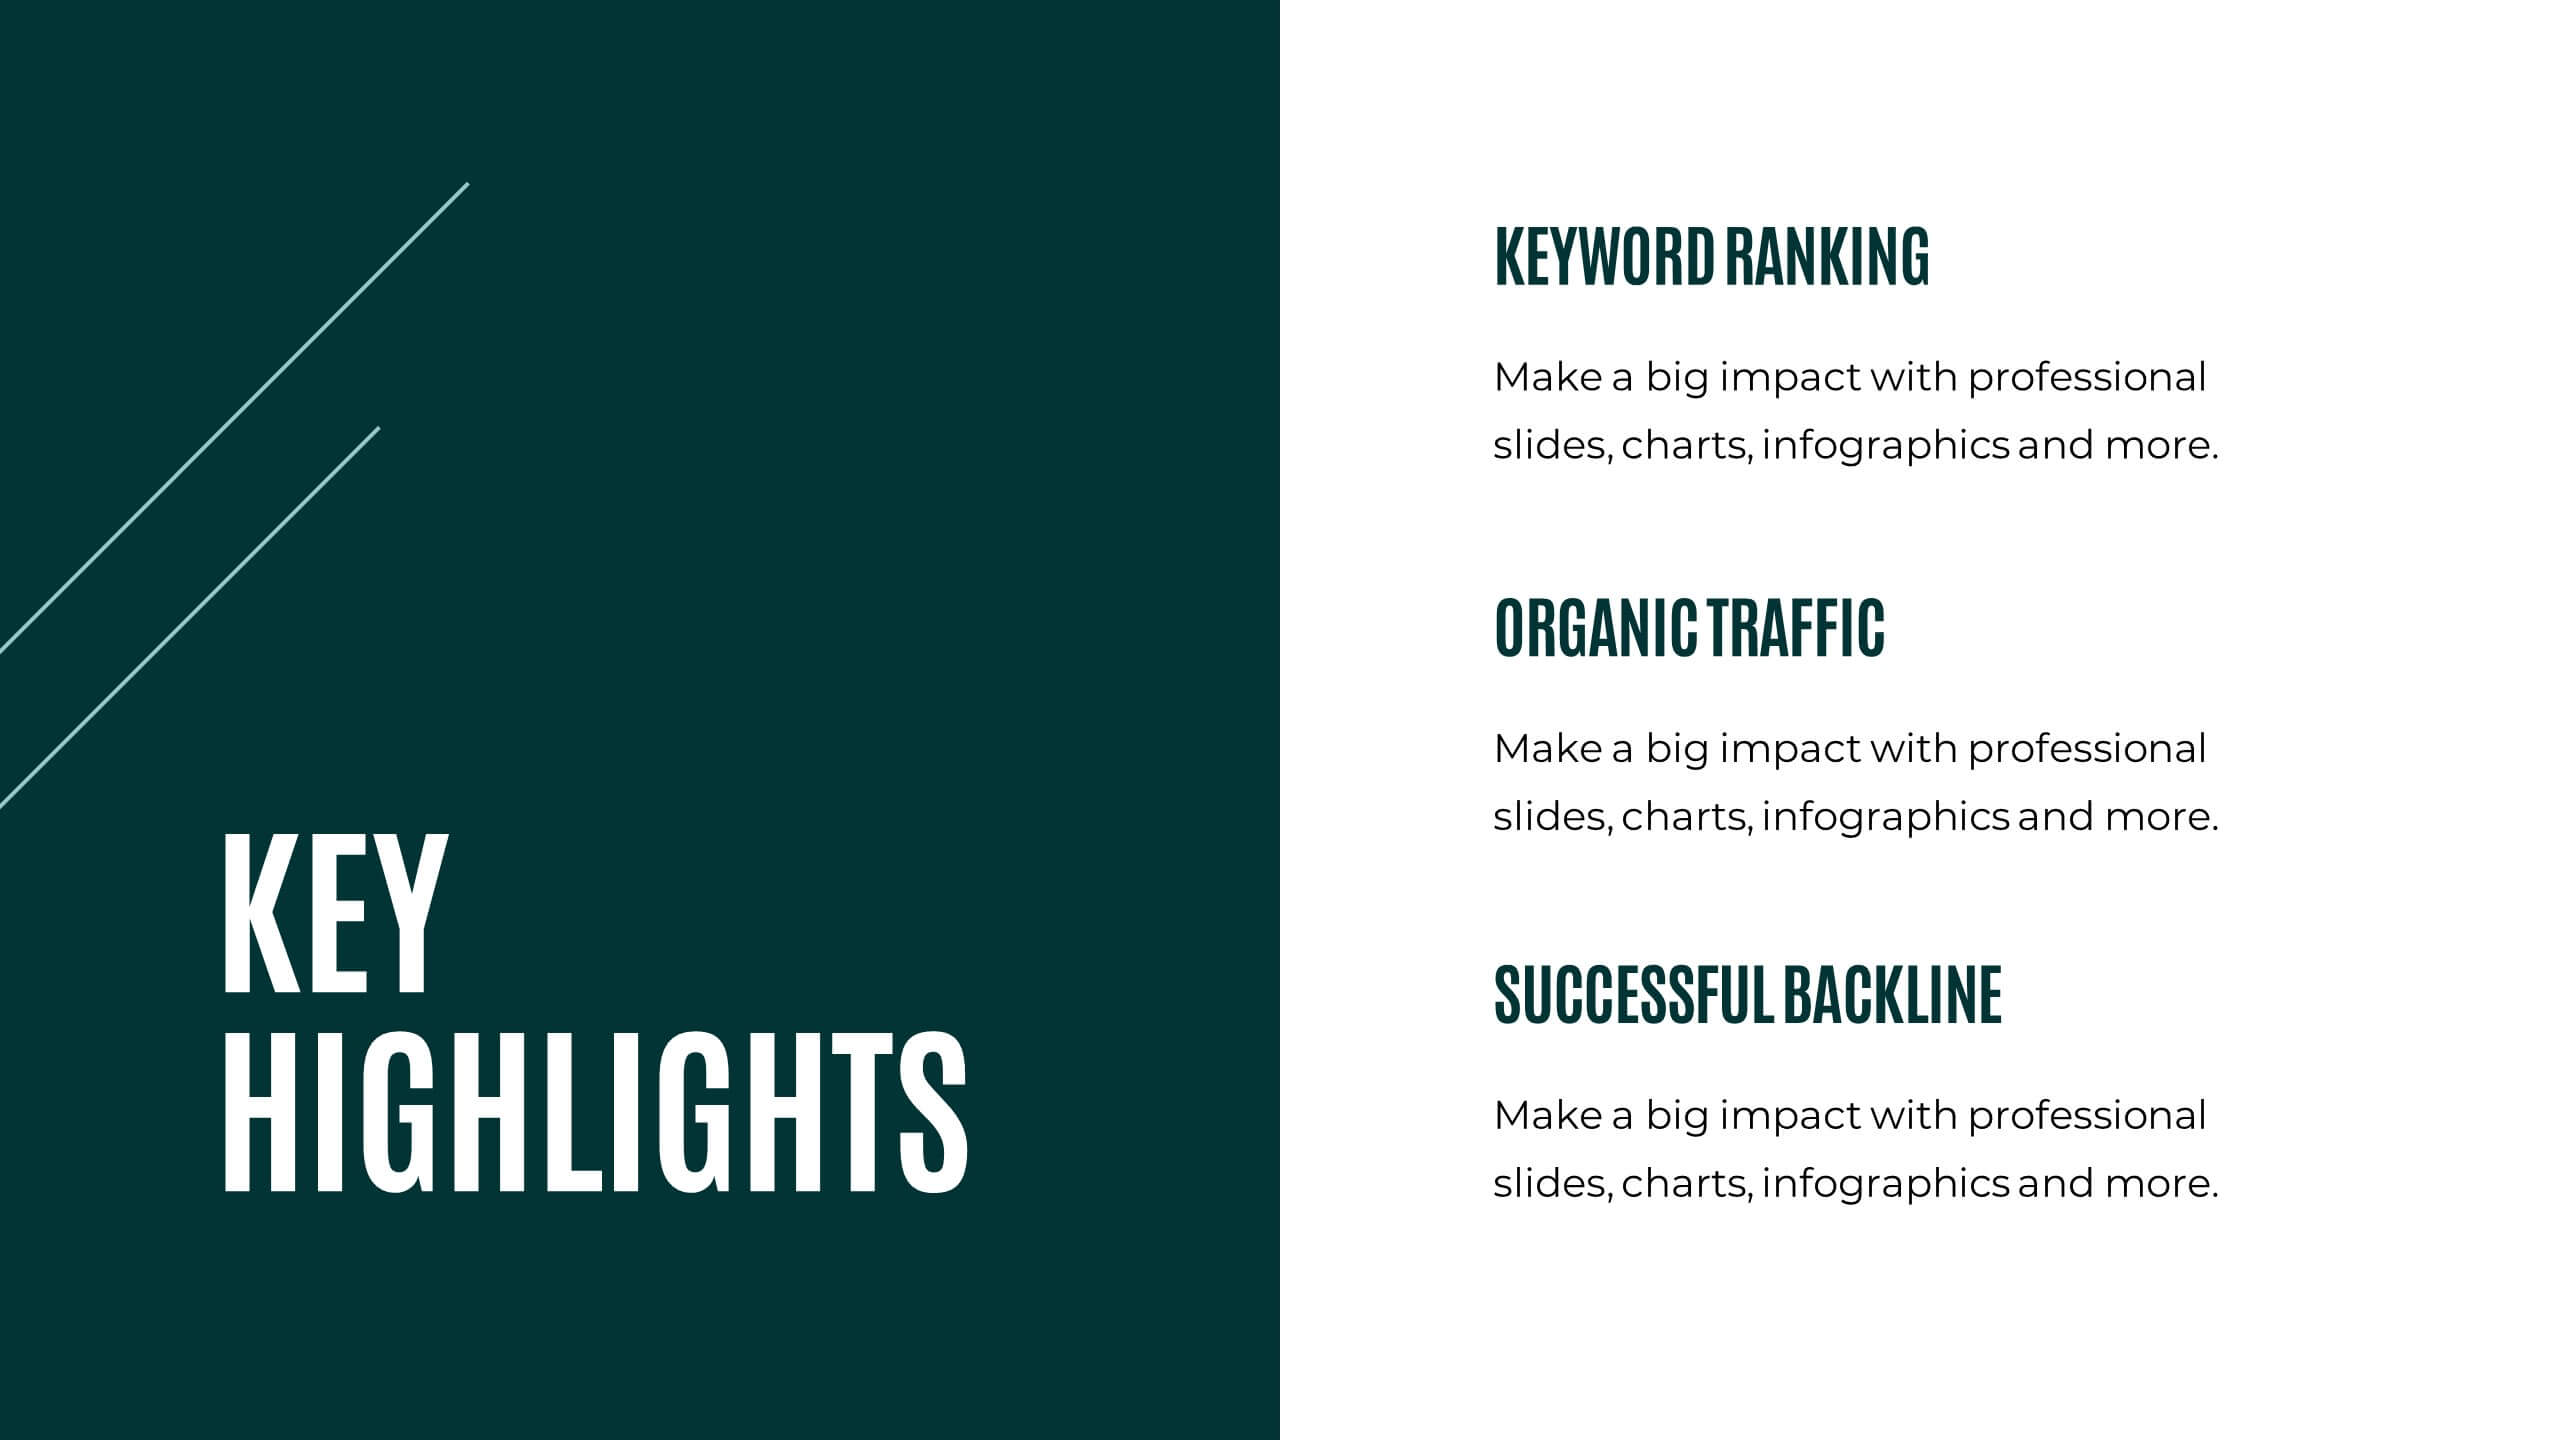
Prism Project Status Report Presentation
Deliver impactful updates with this comprehensive project status report template! Perfect for presenting key highlights, performance metrics, and strategic initiatives. Ideal for project managers aiming to keep stakeholders informed and aligned. Compatible with PowerPoint, Keynote, and Google Slides, this template ensures your reports are clear, professional, and engaging. Keep projects on track!


21 diapositivas
Sungrove Startup Strategy Presentation
Define and present your startup strategy with this sleek and dynamic template, tailored for showcasing innovative plans and competitive positioning. Dive into key slides like customer needs and market insights, business model breakdown, and unique value proposition to clearly outline your vision. Highlight target market analysis, financial forecasts, and growth projections to ensure stakeholders grasp the potential of your business. The template also includes sections for team introductions, infrastructure planning, and competitor landscape analysis to give a holistic overview of your strategy. Designed for customization and compatibility with PowerPoint, Google Slides, and Keynote, this template is perfect for entrepreneurs or startups aiming to deliver a compelling presentation.


26 diapositivas
Water Pollution in the Pacific Presentation
Water Pollution in the Pacific refers to the contamination of water bodies in the Pacific Ocean, which can have severe consequences for marine life, ecosystems, and human health. This template is designed to raise awareness about the critical issue of water pollution in the Pacific Ocean. This template can effectively convey the urgency and significance of addressing water pollution in the Pacific Ocean. This serves as a powerful tool to educate and inspire individuals, organizations, and policymakers to take action and work towards sustainable solutions for the preservation of our precious marine ecosystems.


6 diapositivas
Threat and Mitigation Bowtie Model
Break down complex threats and responses with the Threat and Mitigation Bowtie Model Presentation. This infographic visualizes the relationship between root causes, a central hazard event, and its potential consequences—alongside the controls that mitigate them. Clean, editable layouts and multiple visual states let you emphasize either side of the bowtie. Ideal for risk assessments, business continuity planning, and safety presentations. Compatible with PowerPoint, Keynote, and Google Slides.


6 diapositivas
Market Expansion Strategy with Asia Map Presentation
Explore new business frontiers with the Market Expansion Strategy with Asia Map template, your strategic platform for analyzing and expanding market presence across Asia. This presentation is designed to guide businesses through the complexities of Asian market landscapes. Featuring an integrated Asia map and designated spaces for in-depth insights, this template is ideal for corporate strategists and market analysts. It supports PowerPoint, Keynote and Google Slides for versatile presentation options.


7 diapositivas
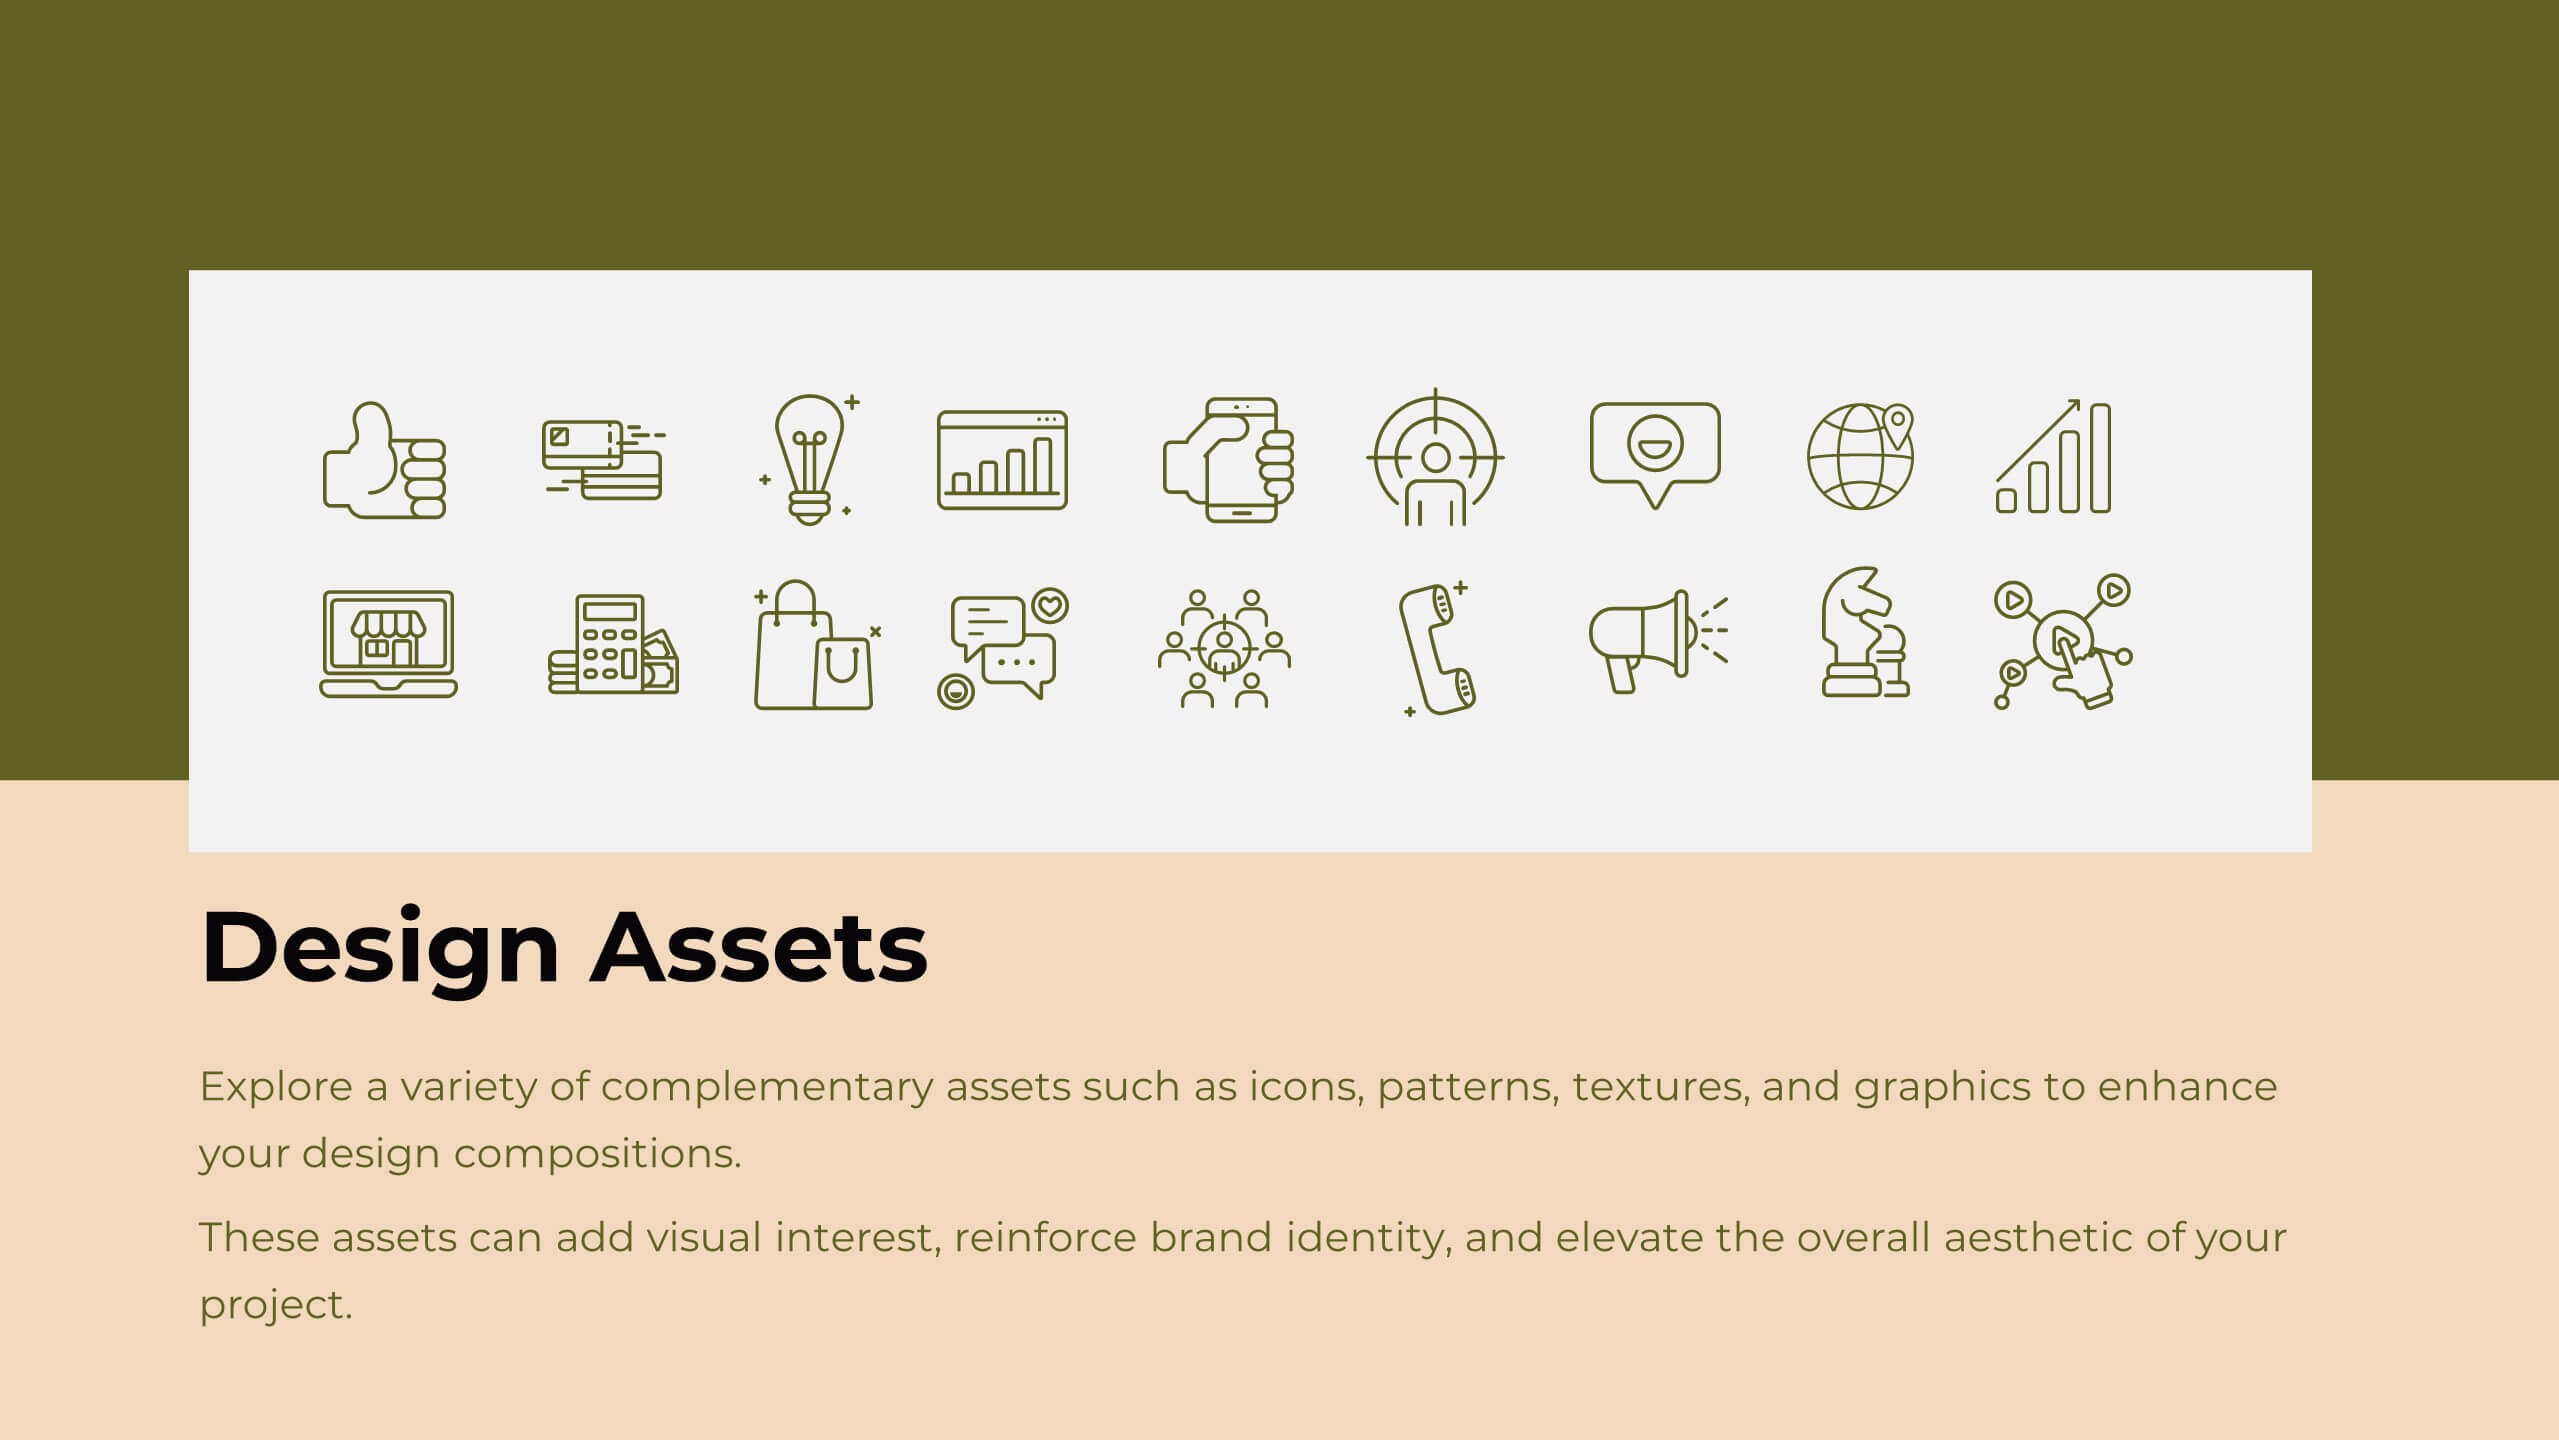
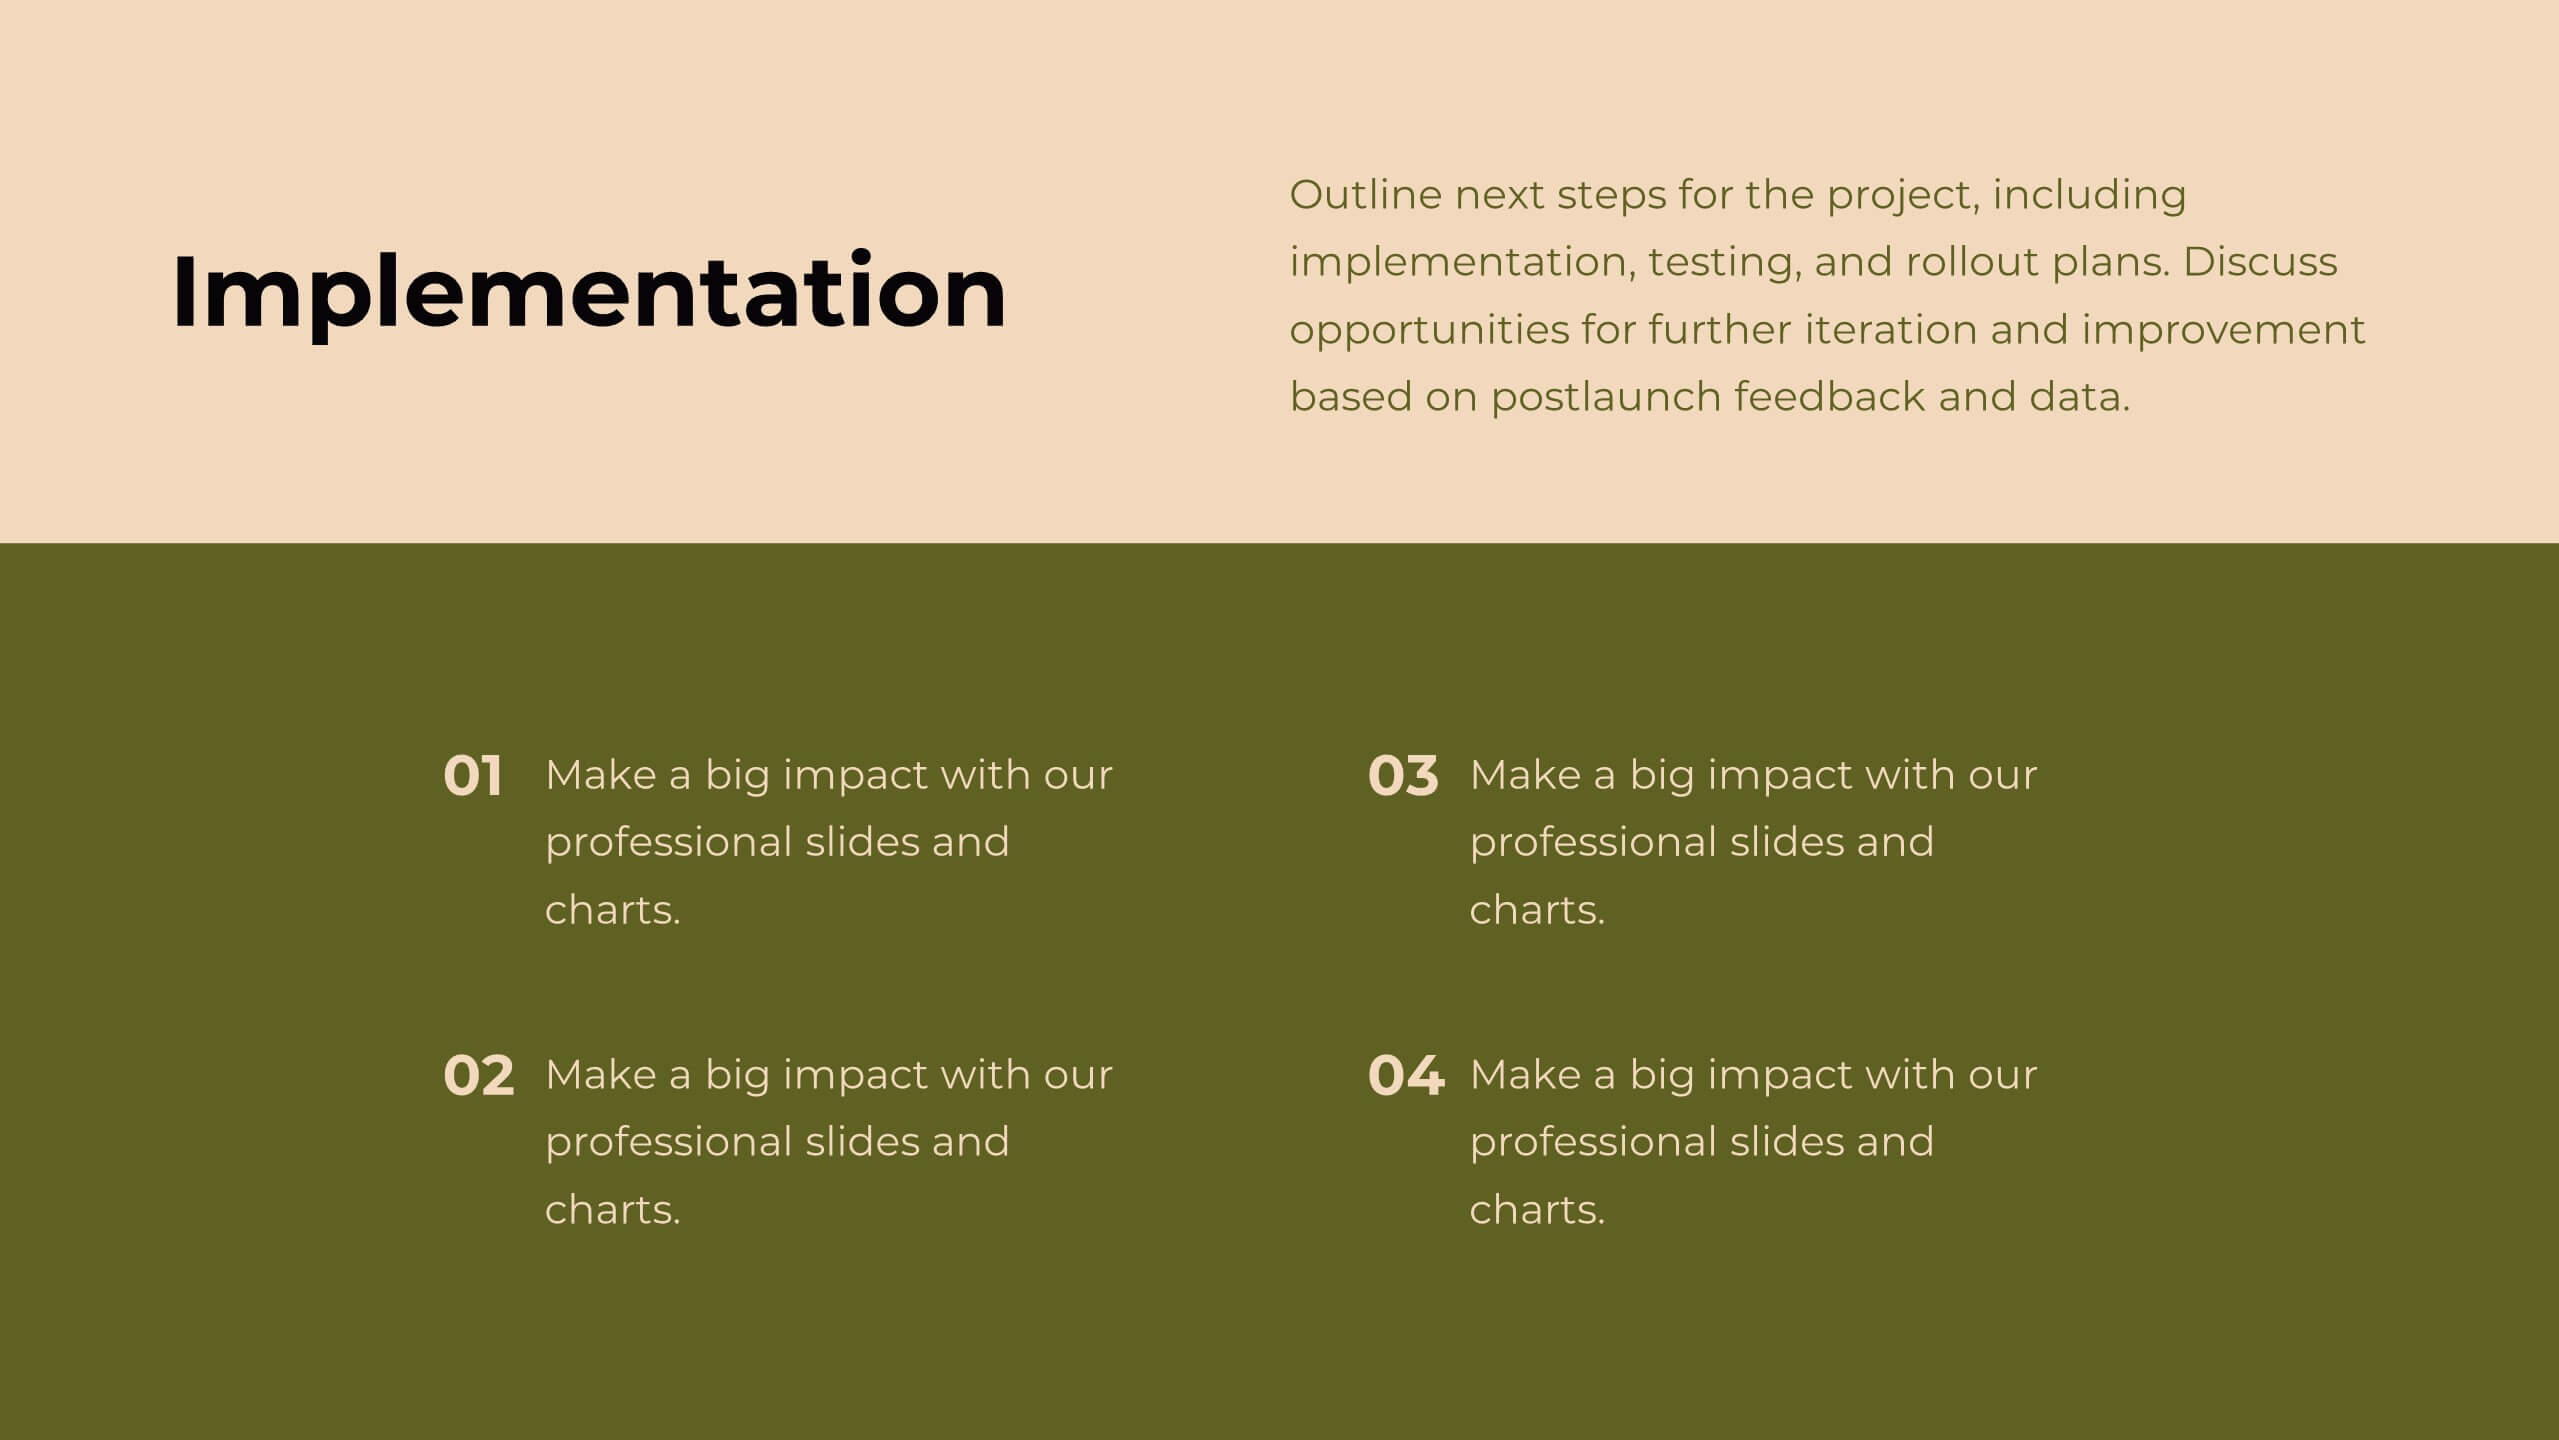
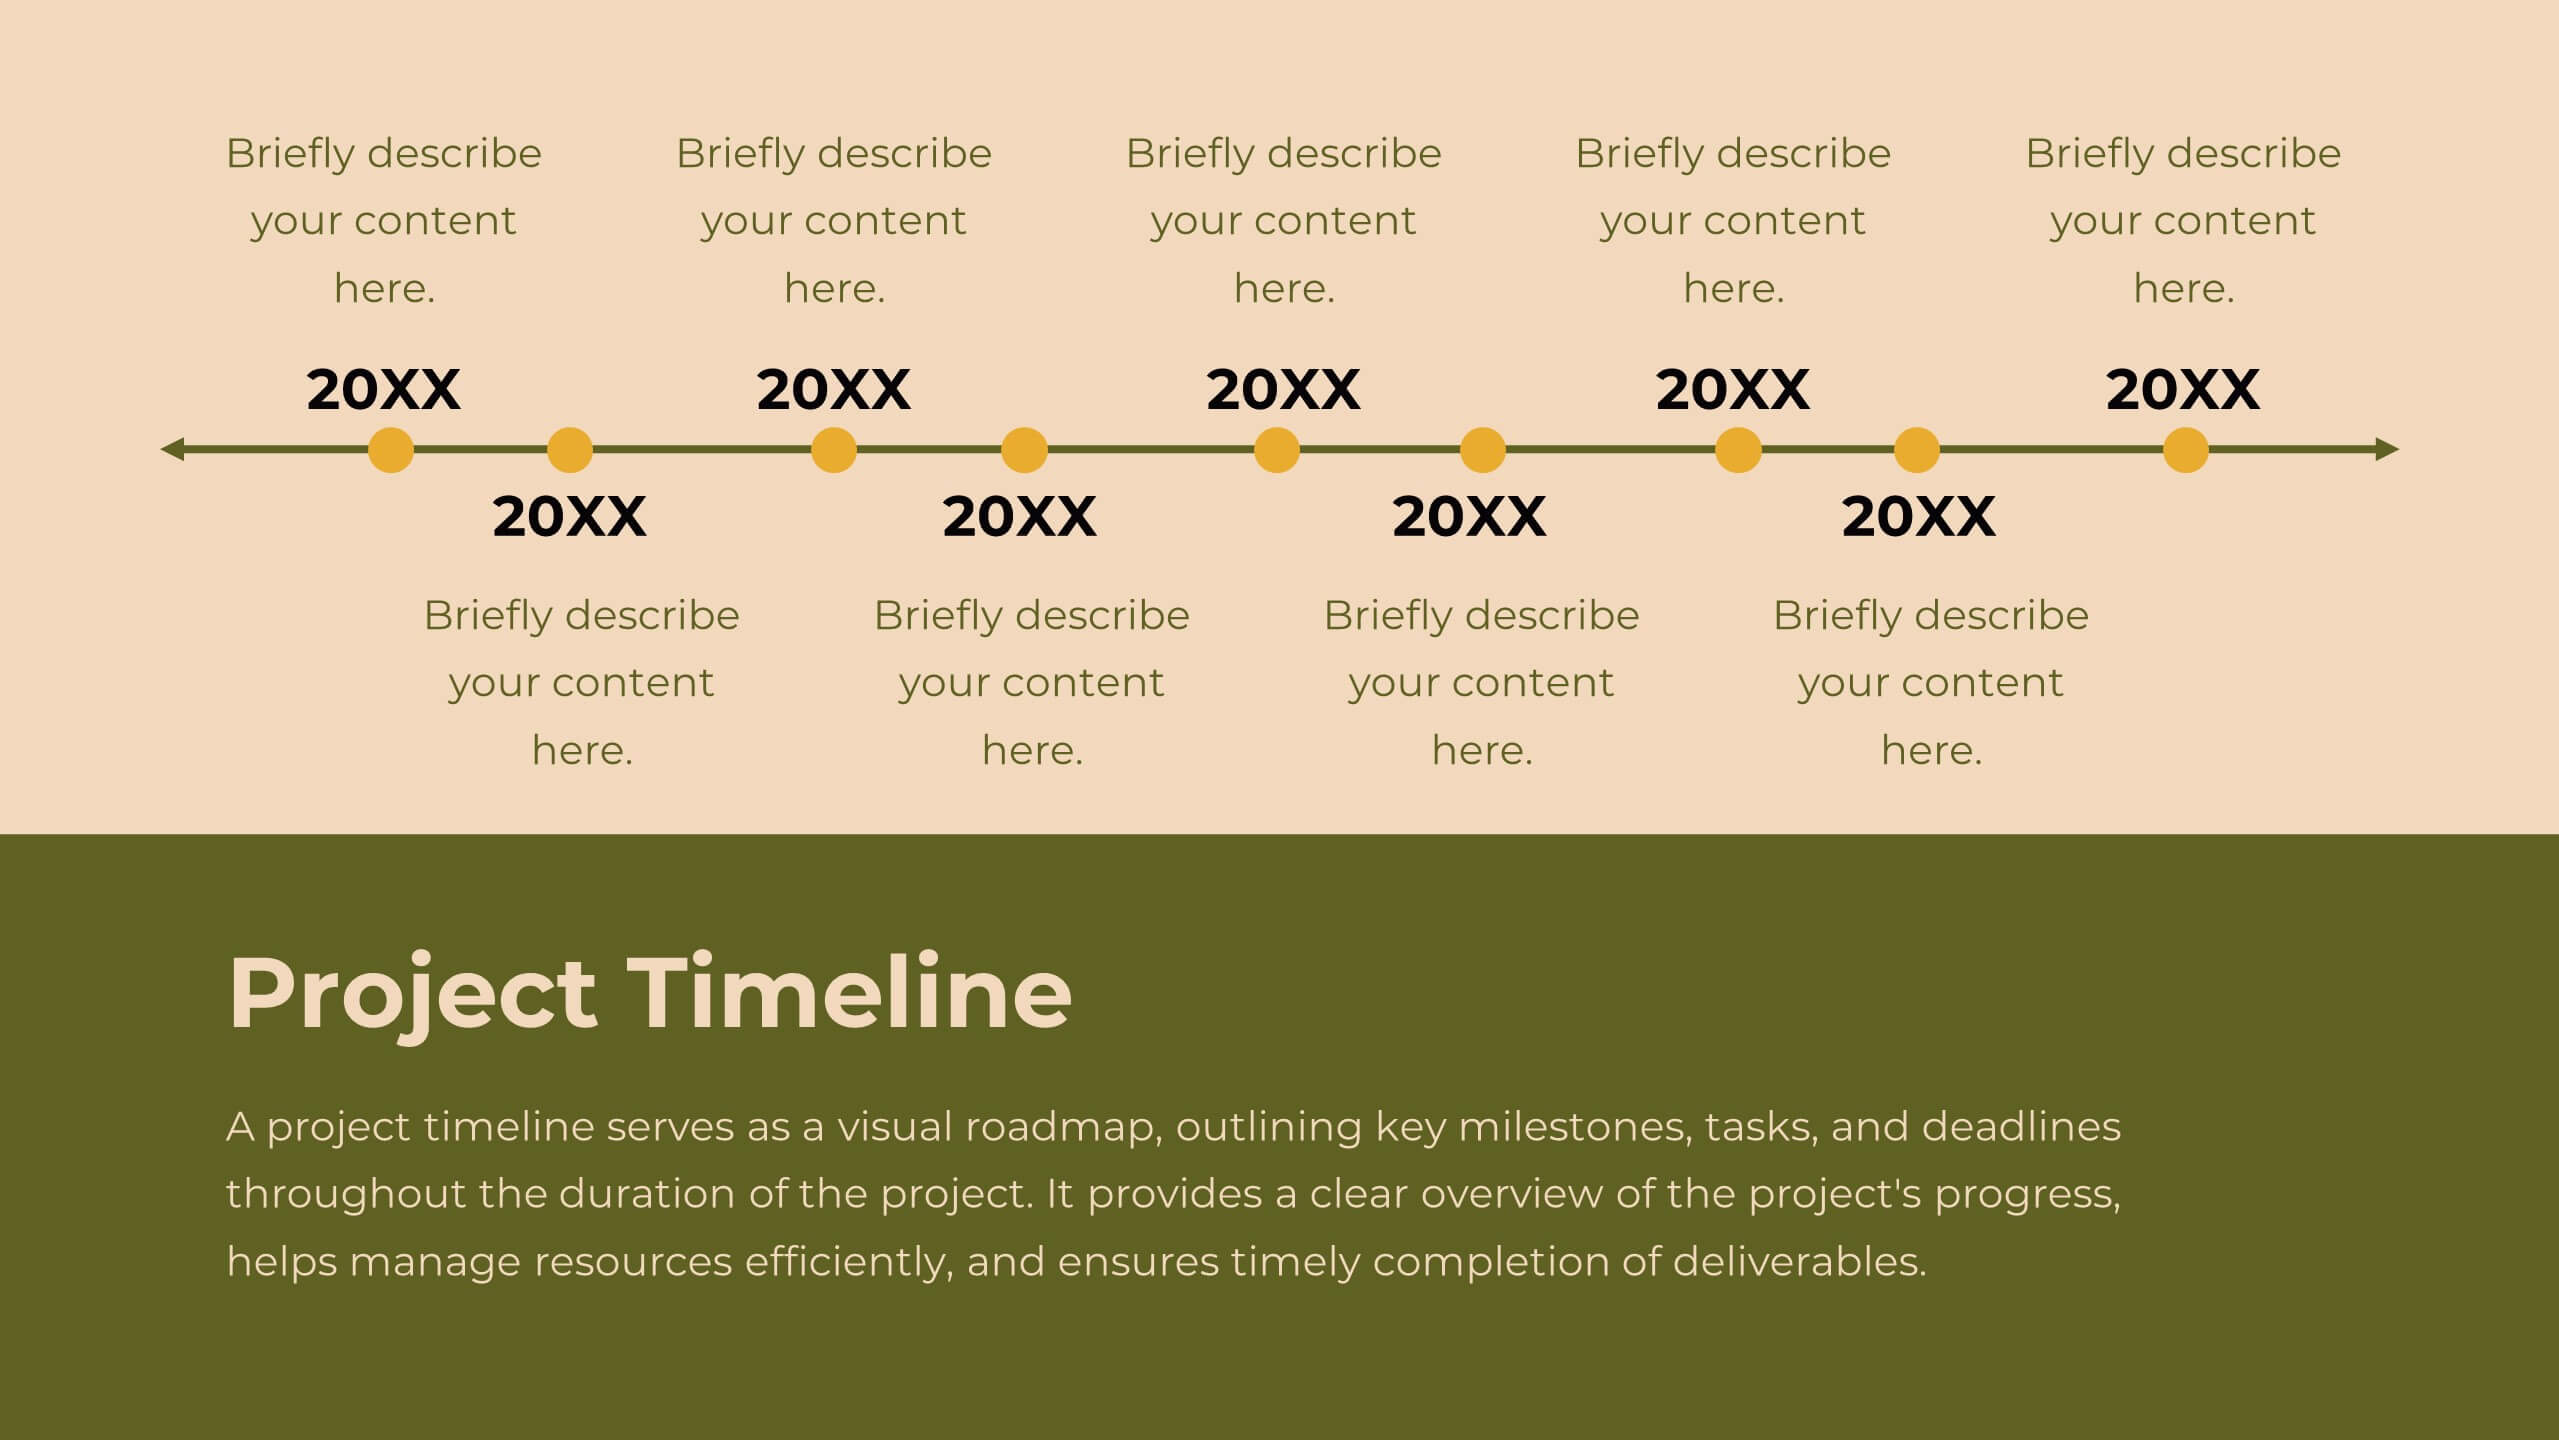
Company Profile Overview Infographic
This set of company profile templates is expertly designed to help organizations succinctly and effectively convey their corporate identity and core values. Ideal for businesses seeking to outline their brand, history, and capabilities, each template is structured to enhance the presentation of company data to stakeholders and clients. The templates feature professional layouts that prioritize ease of reading and aesthetic appeal, ensuring that critical information like company achievements, mission, and service offerings are highlighted effectively. The designs incorporate a clean, contemporary style with ample space for customization, allowing companies to adapt the visuals and text to match their branding requirements. This adaptability makes the templates suitable for a wide range of industries and purposes, from corporate introductions and annual reports to marketing materials and business proposals. By providing a coherent structure that businesses can personalize with their specific details, these templates serve as a valuable tool in building a strong, professional image. They offer practical solutions for companies to present themselves in a polished and organized manner, fostering a positive impression among potential investors, clients, and partners.


21 diapositivas
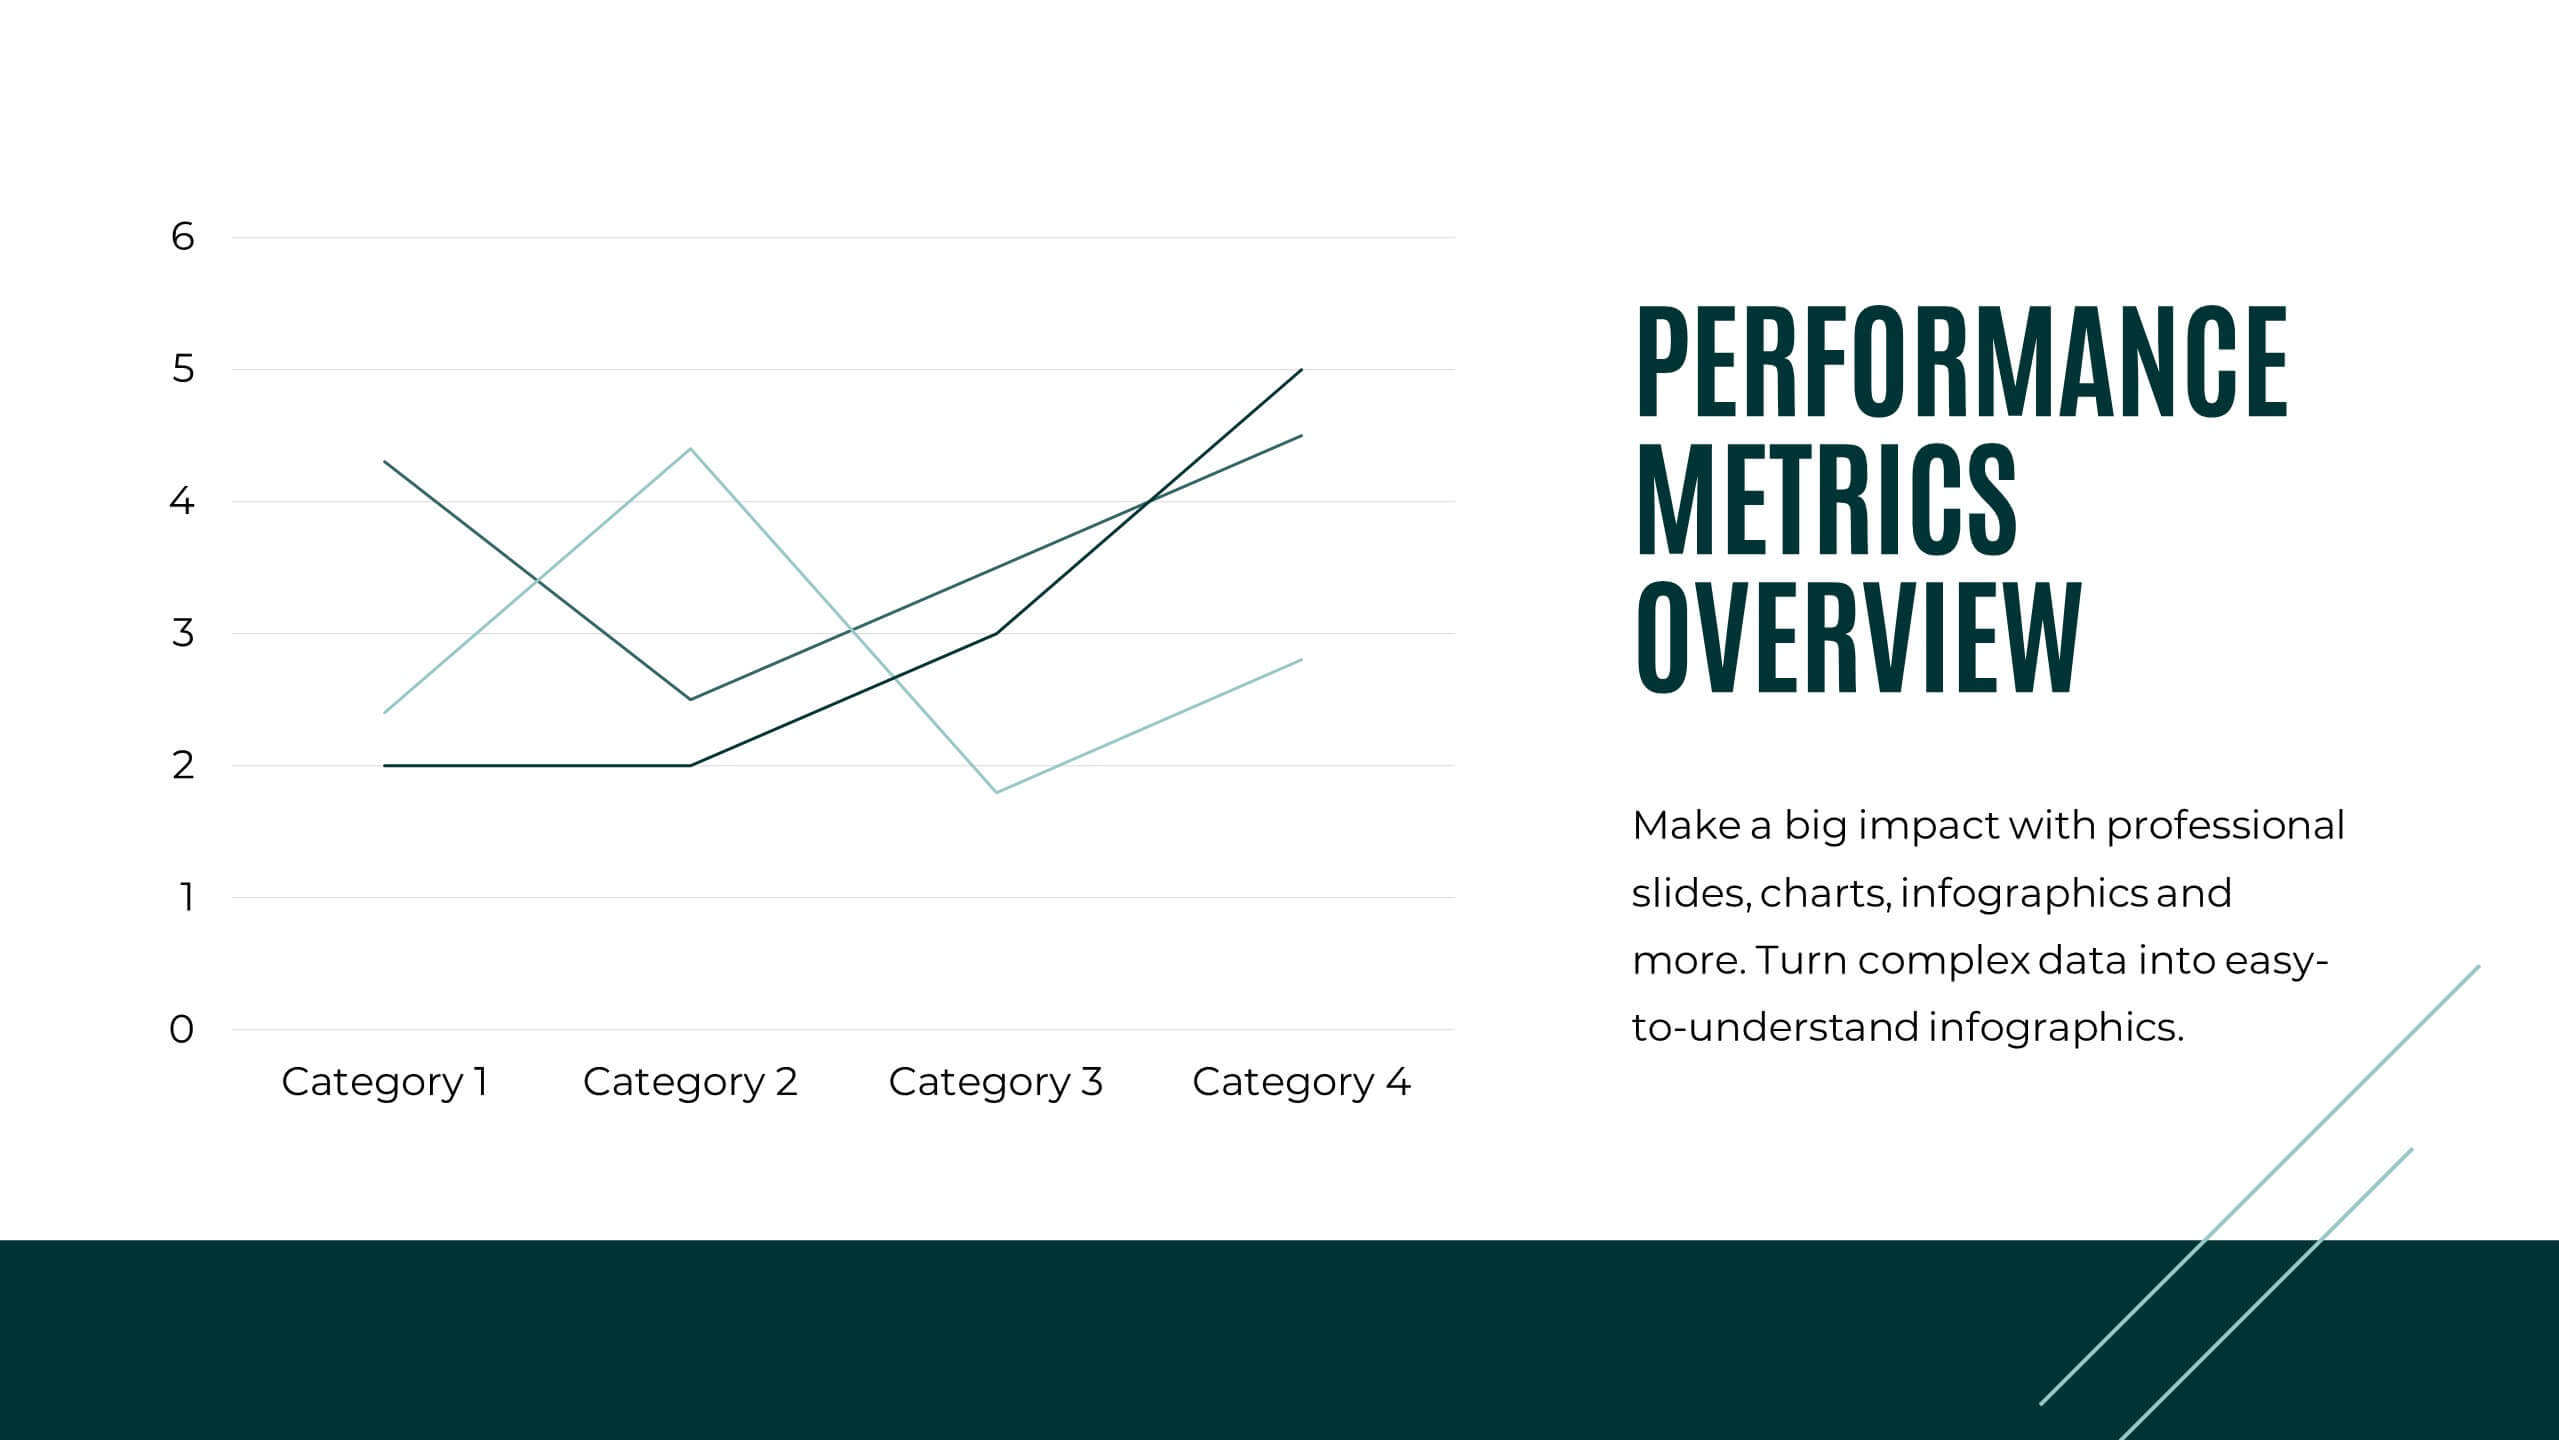
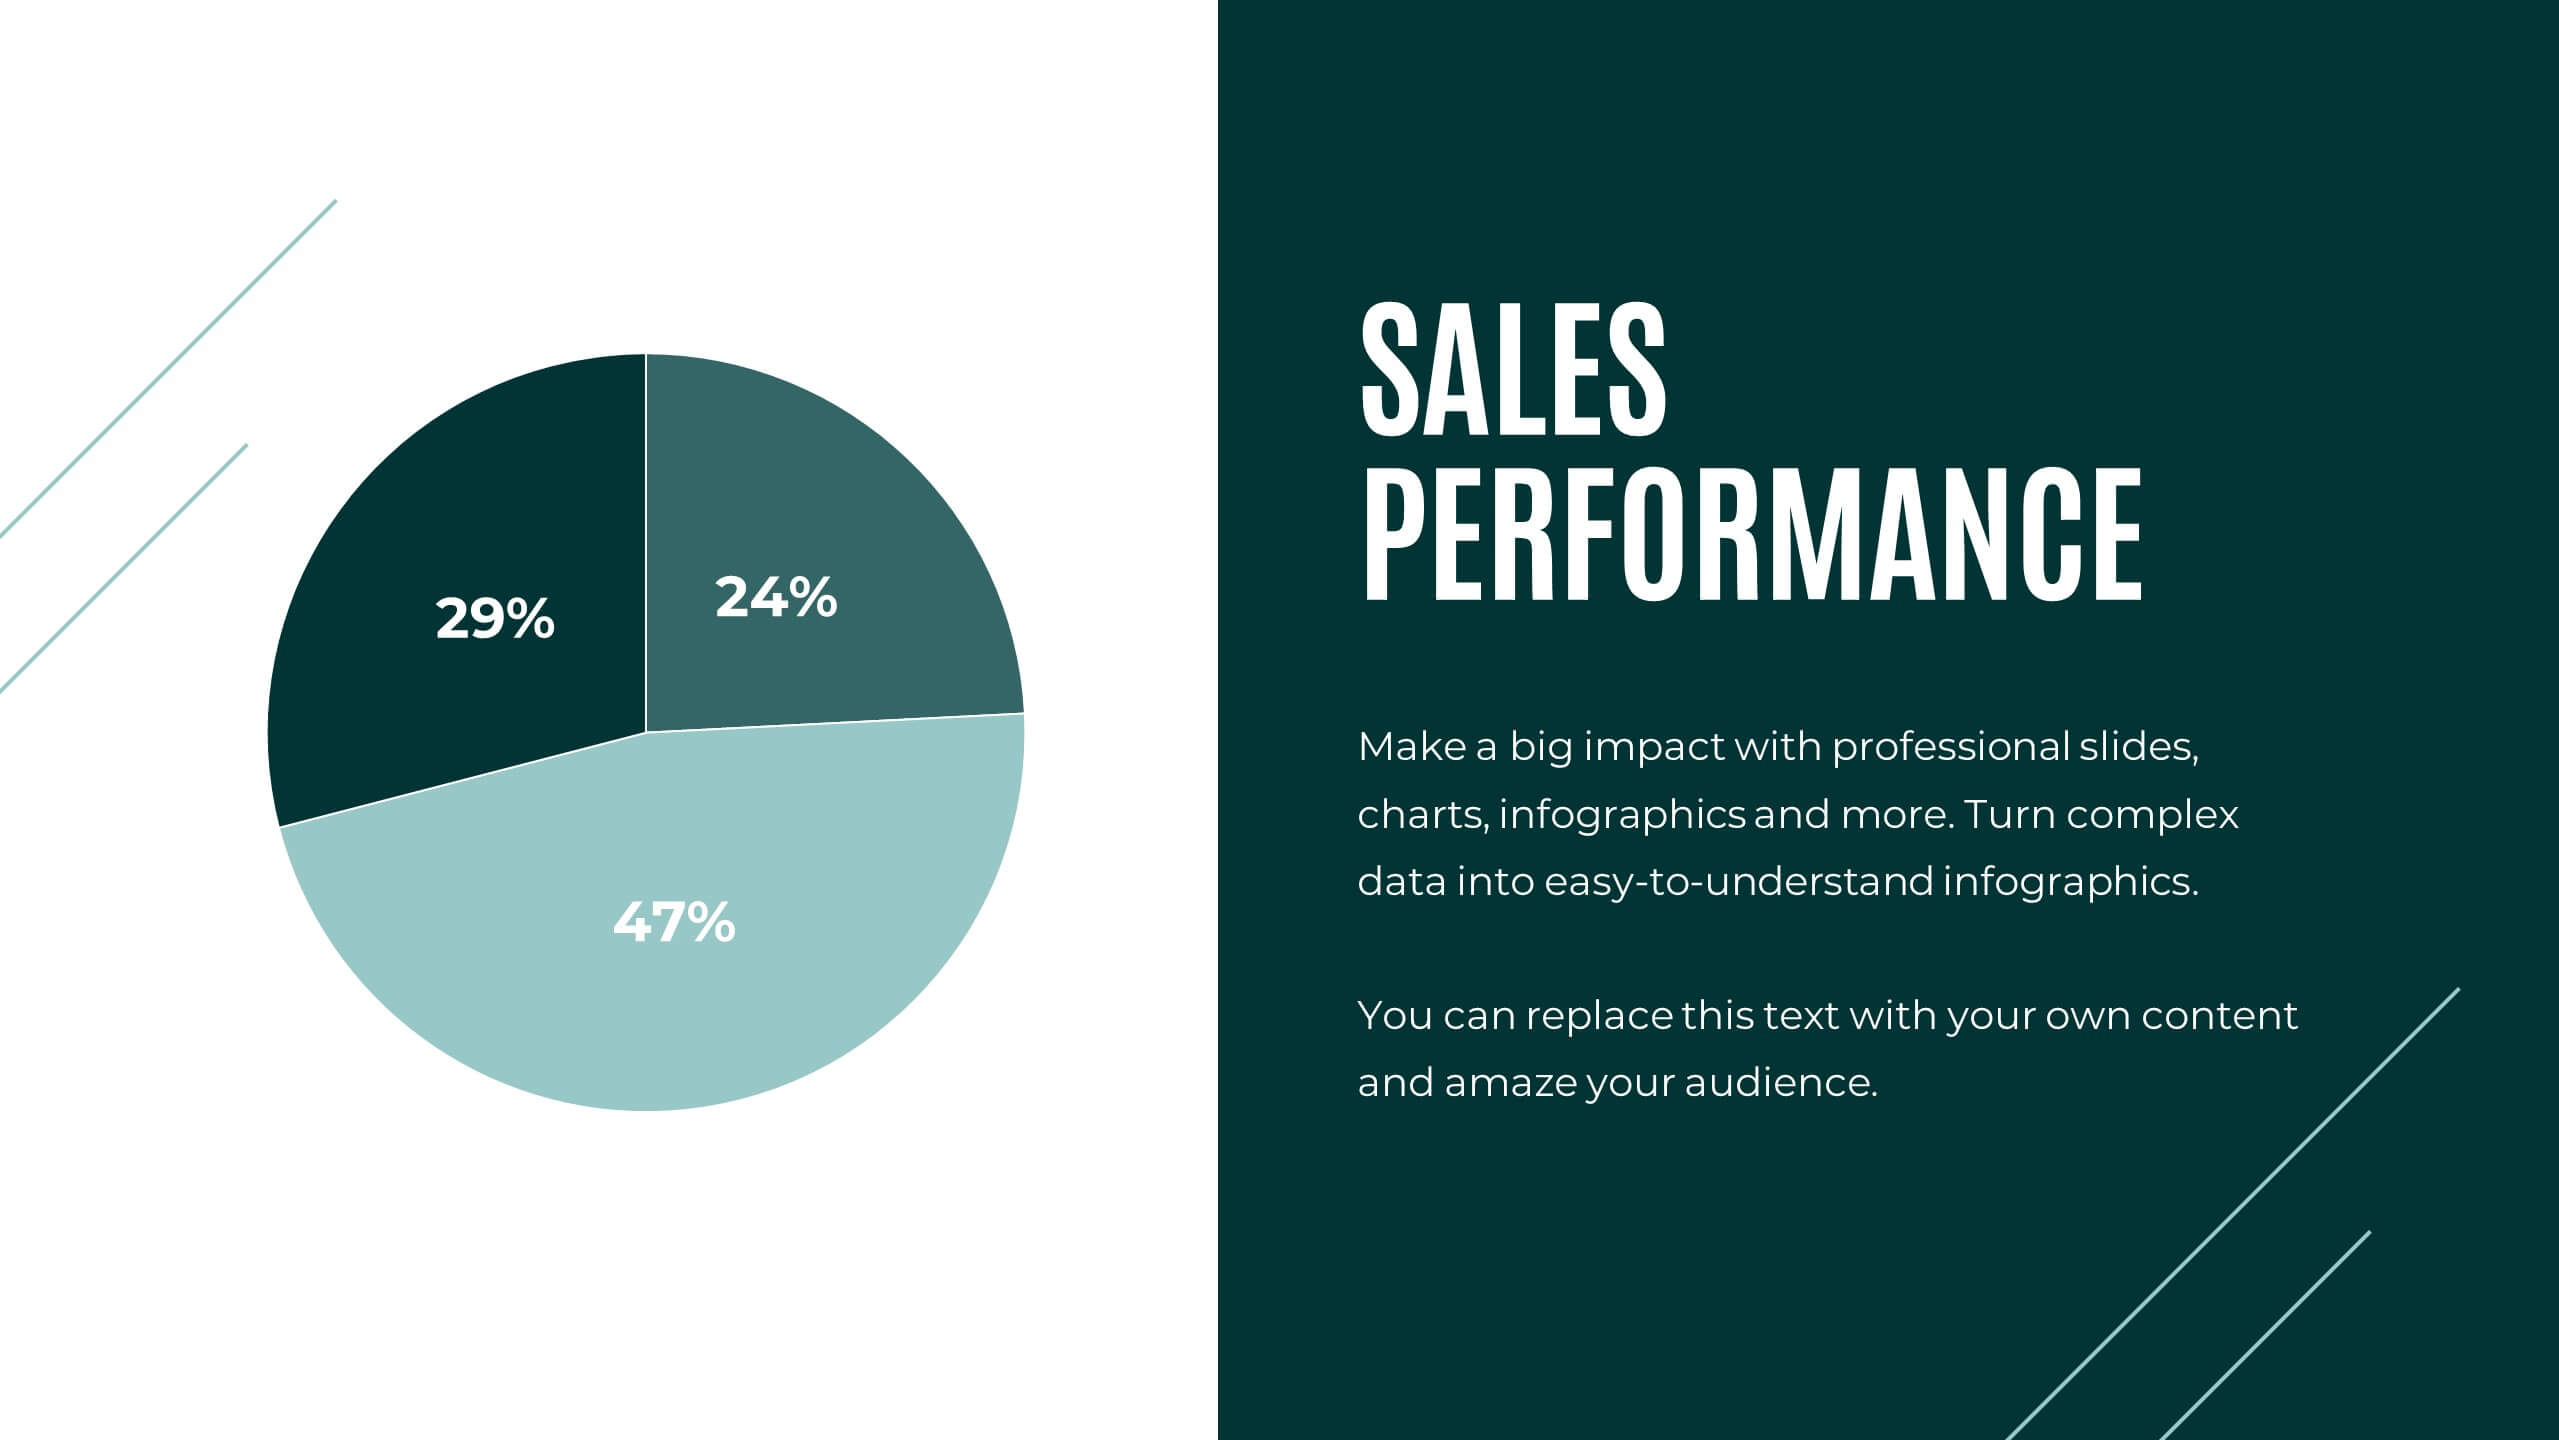
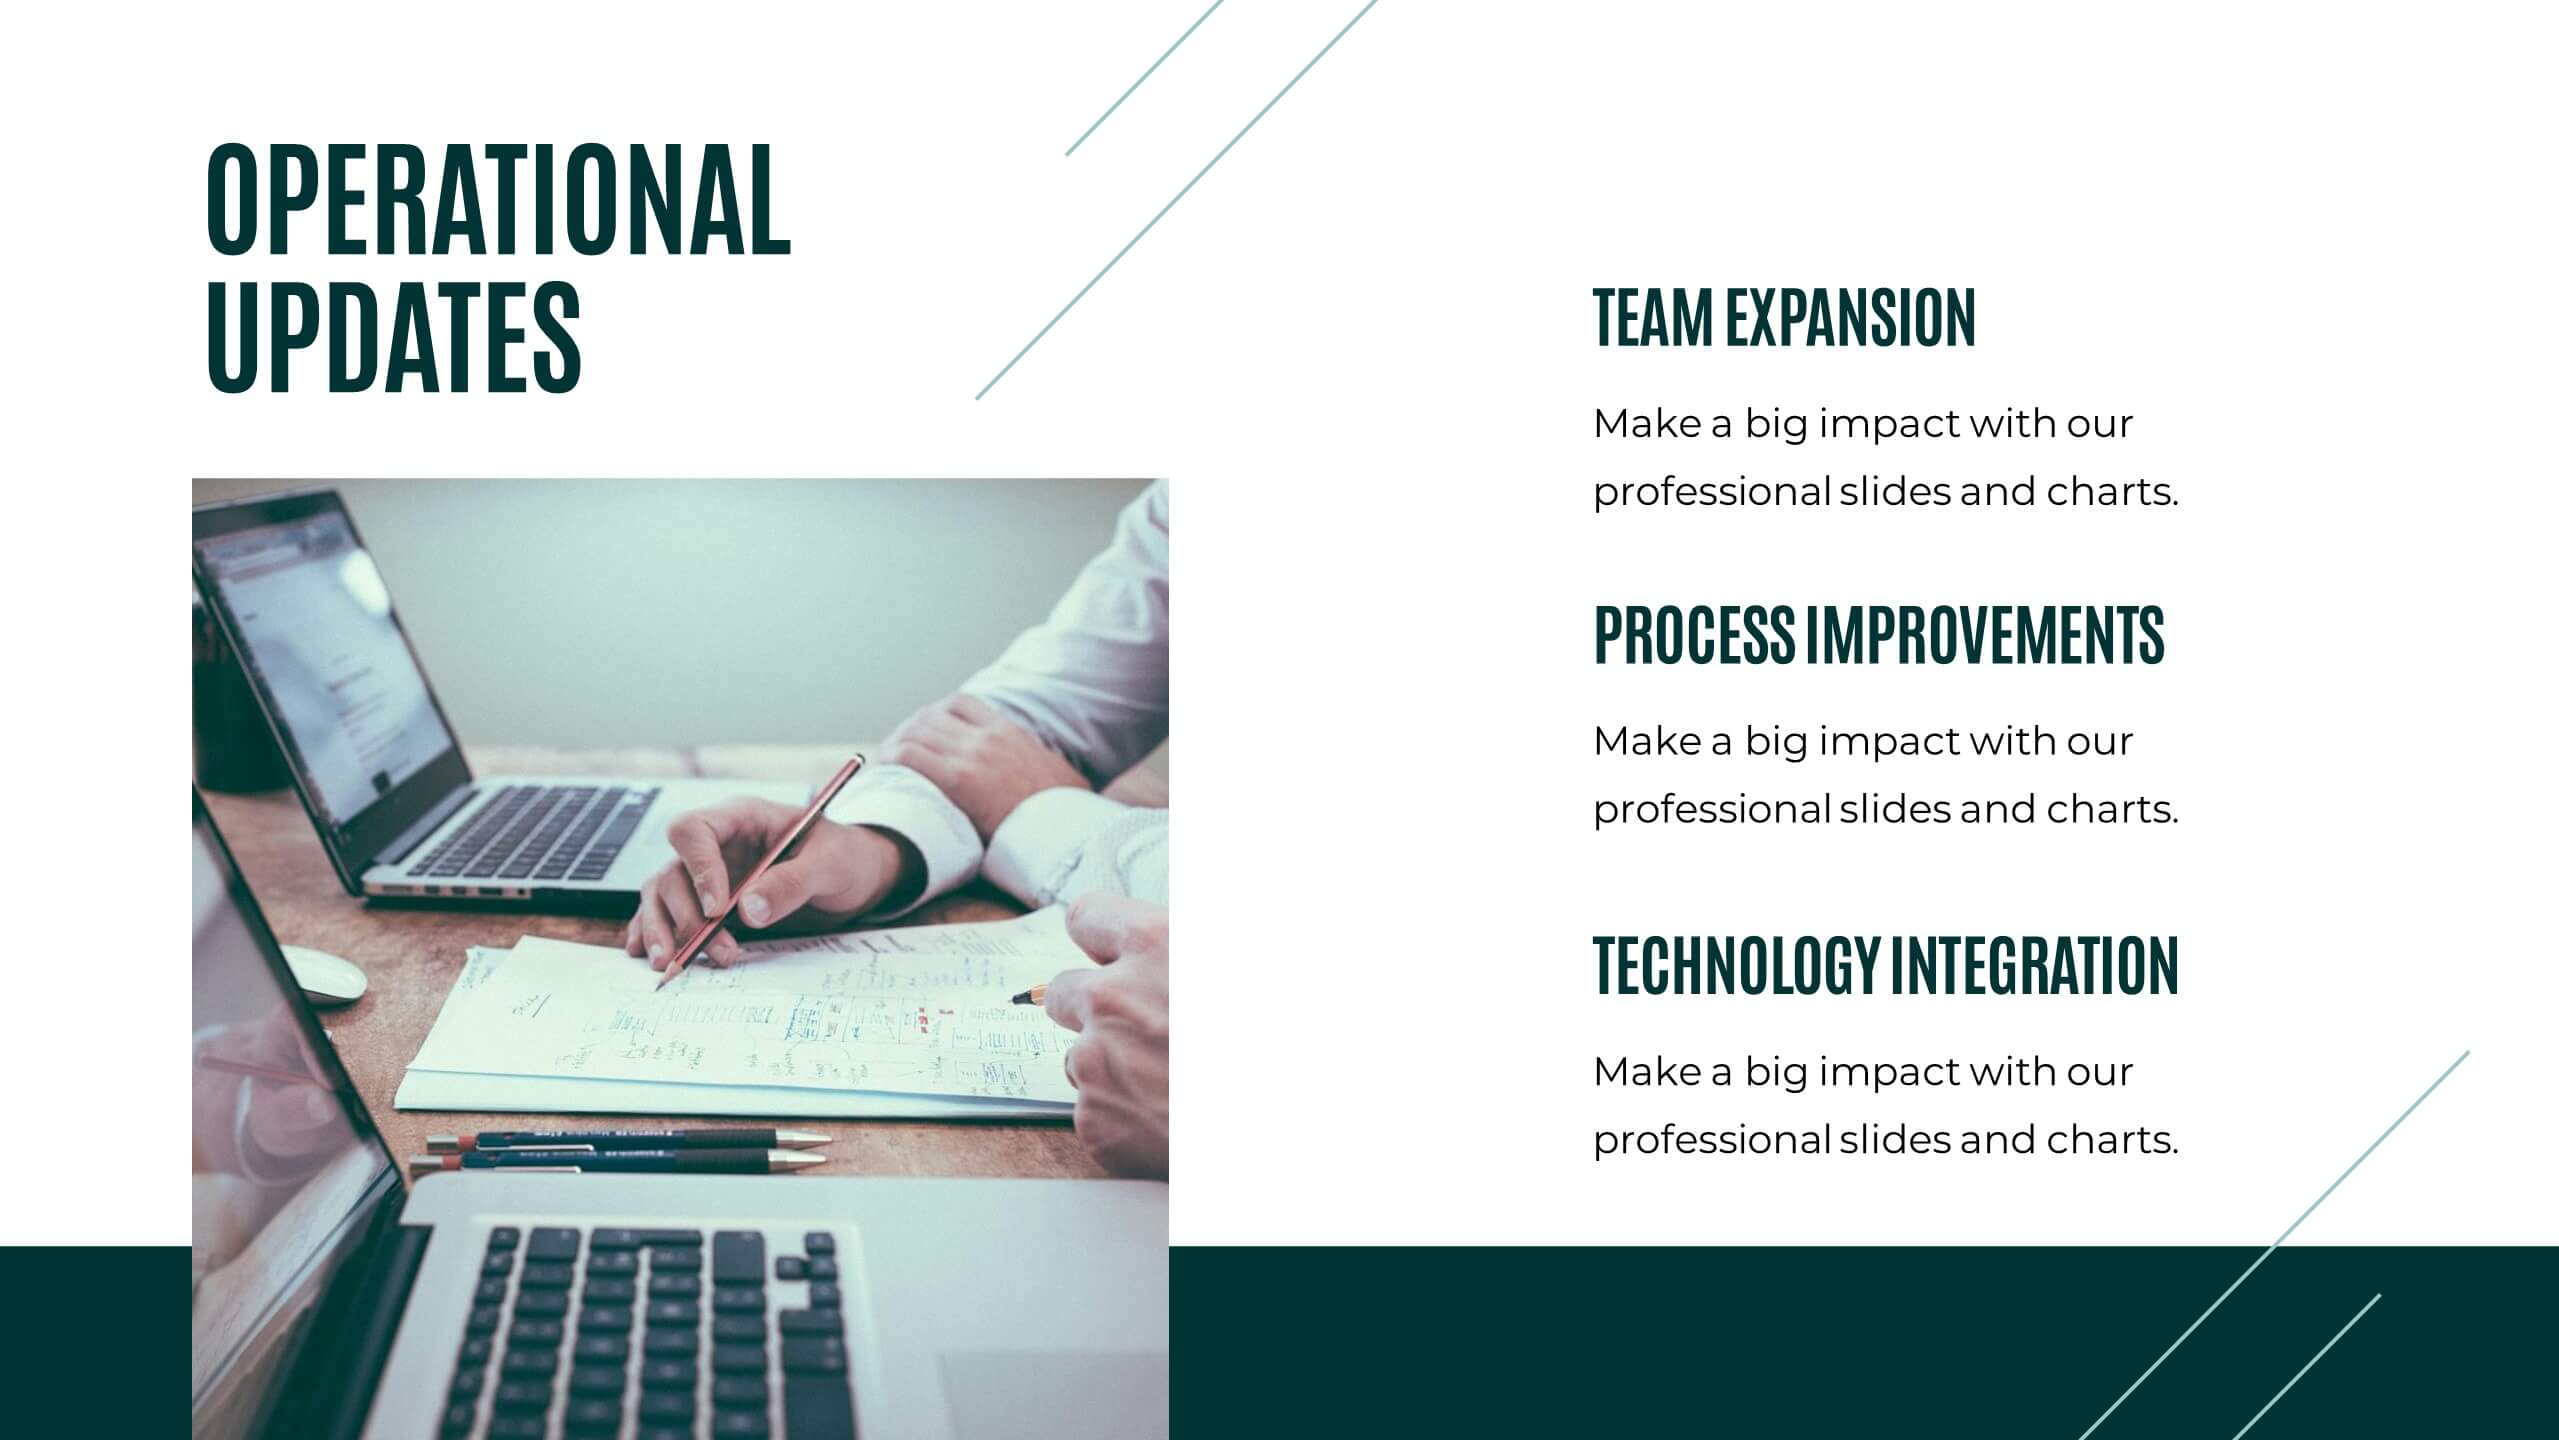
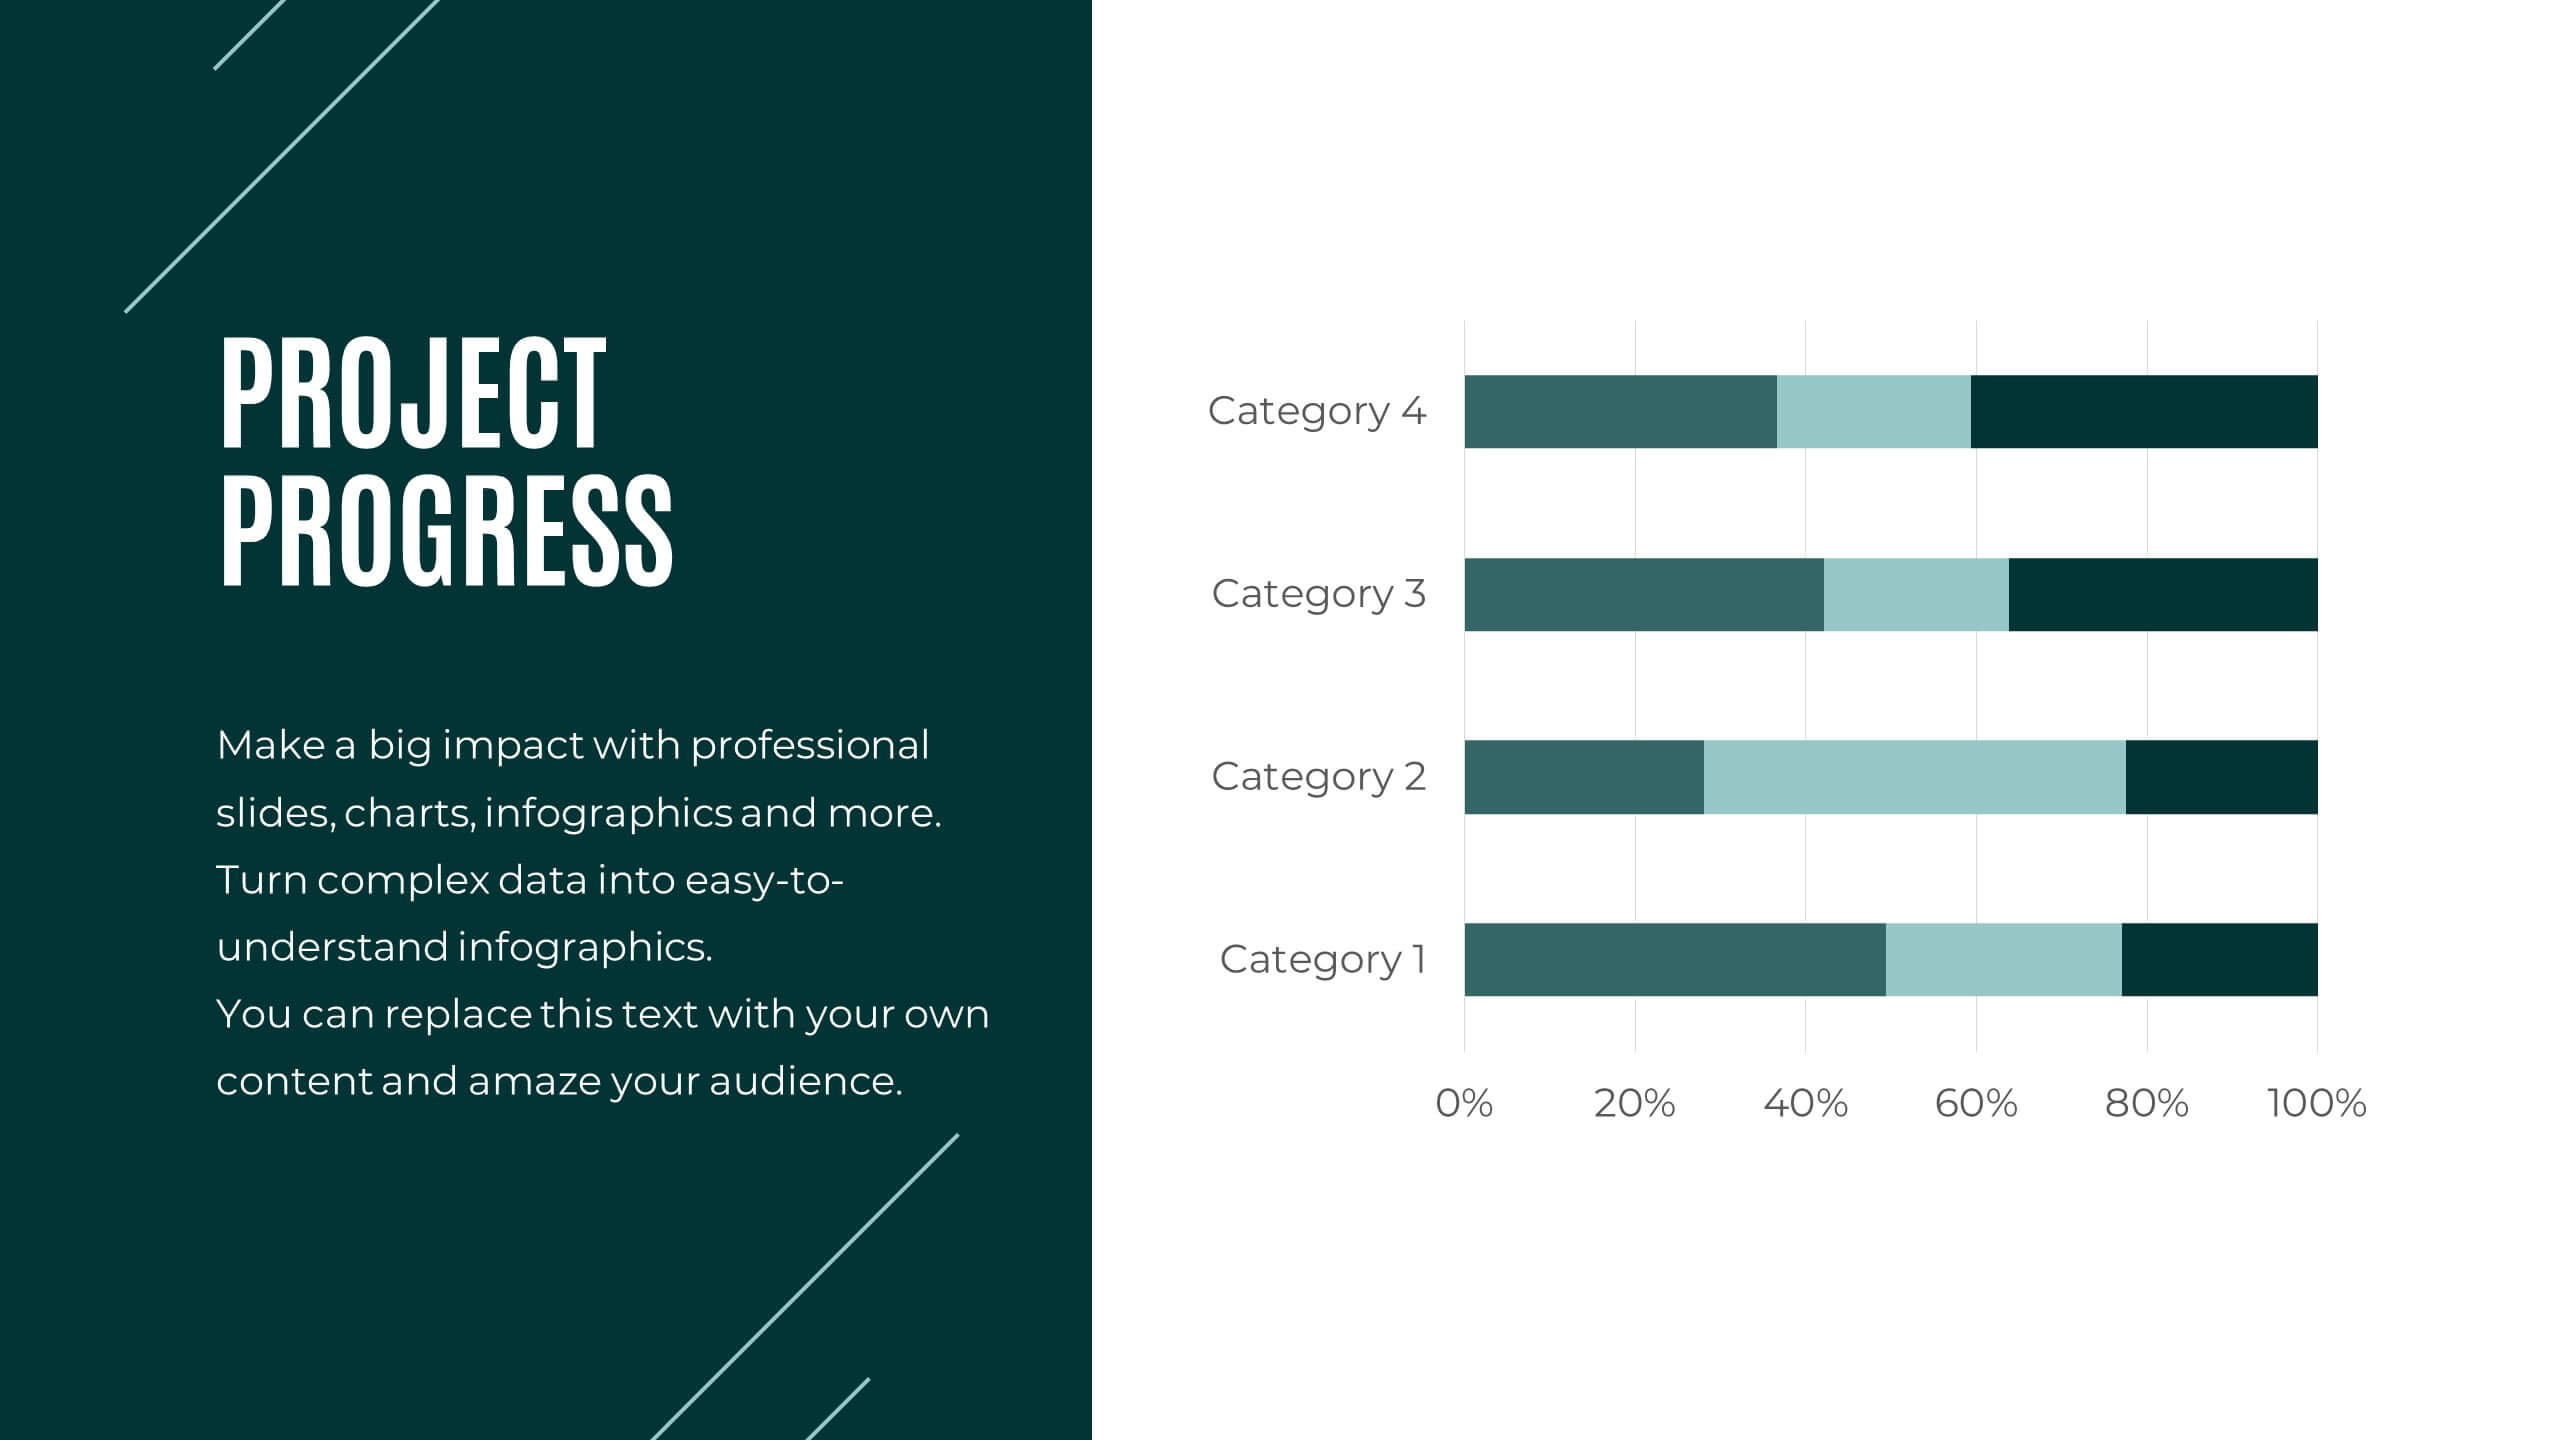
Glacieron Financial Report Presentation
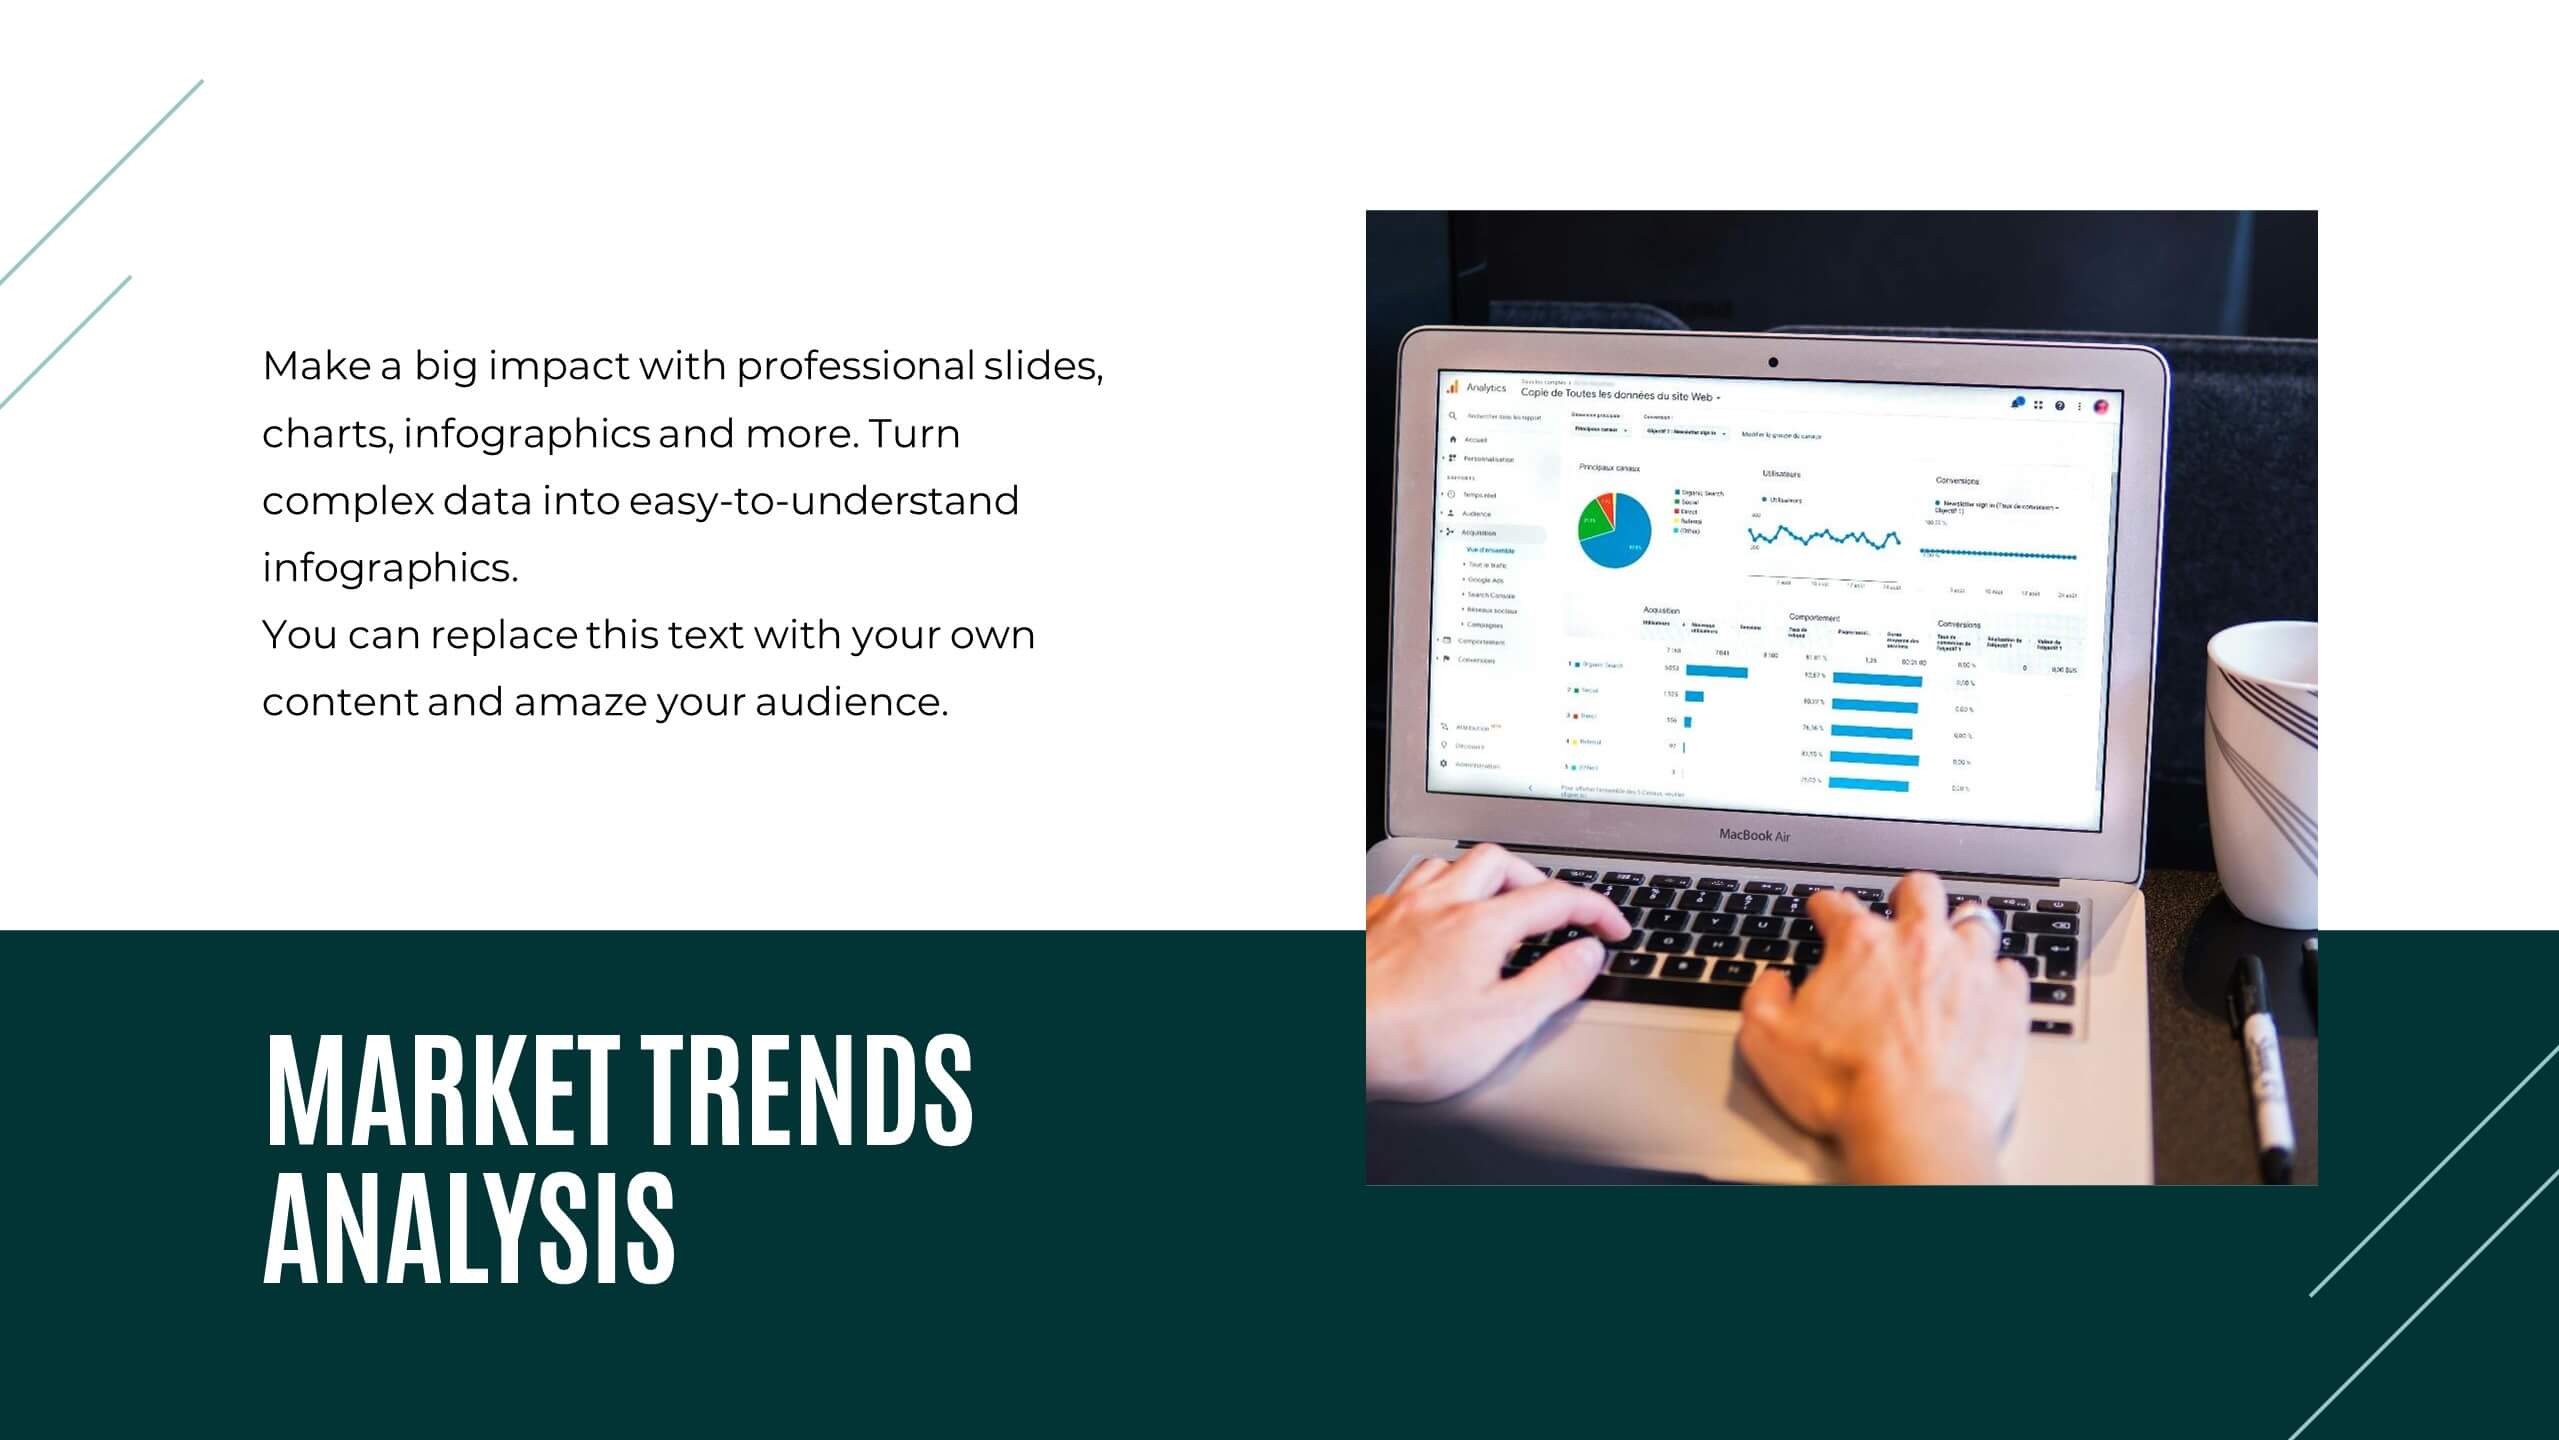
This Financial Report Presentation Template is a professional and visually engaging tool to showcase financial performance, key metrics, and strategic initiatives. It includes slides for performance metrics, financial summaries, competitor insights, and future goals, making it ideal for business reviews and stakeholder meetings. Compatible with PowerPoint, Keynote, and Google Slides for easy customization.


2 diapositivas
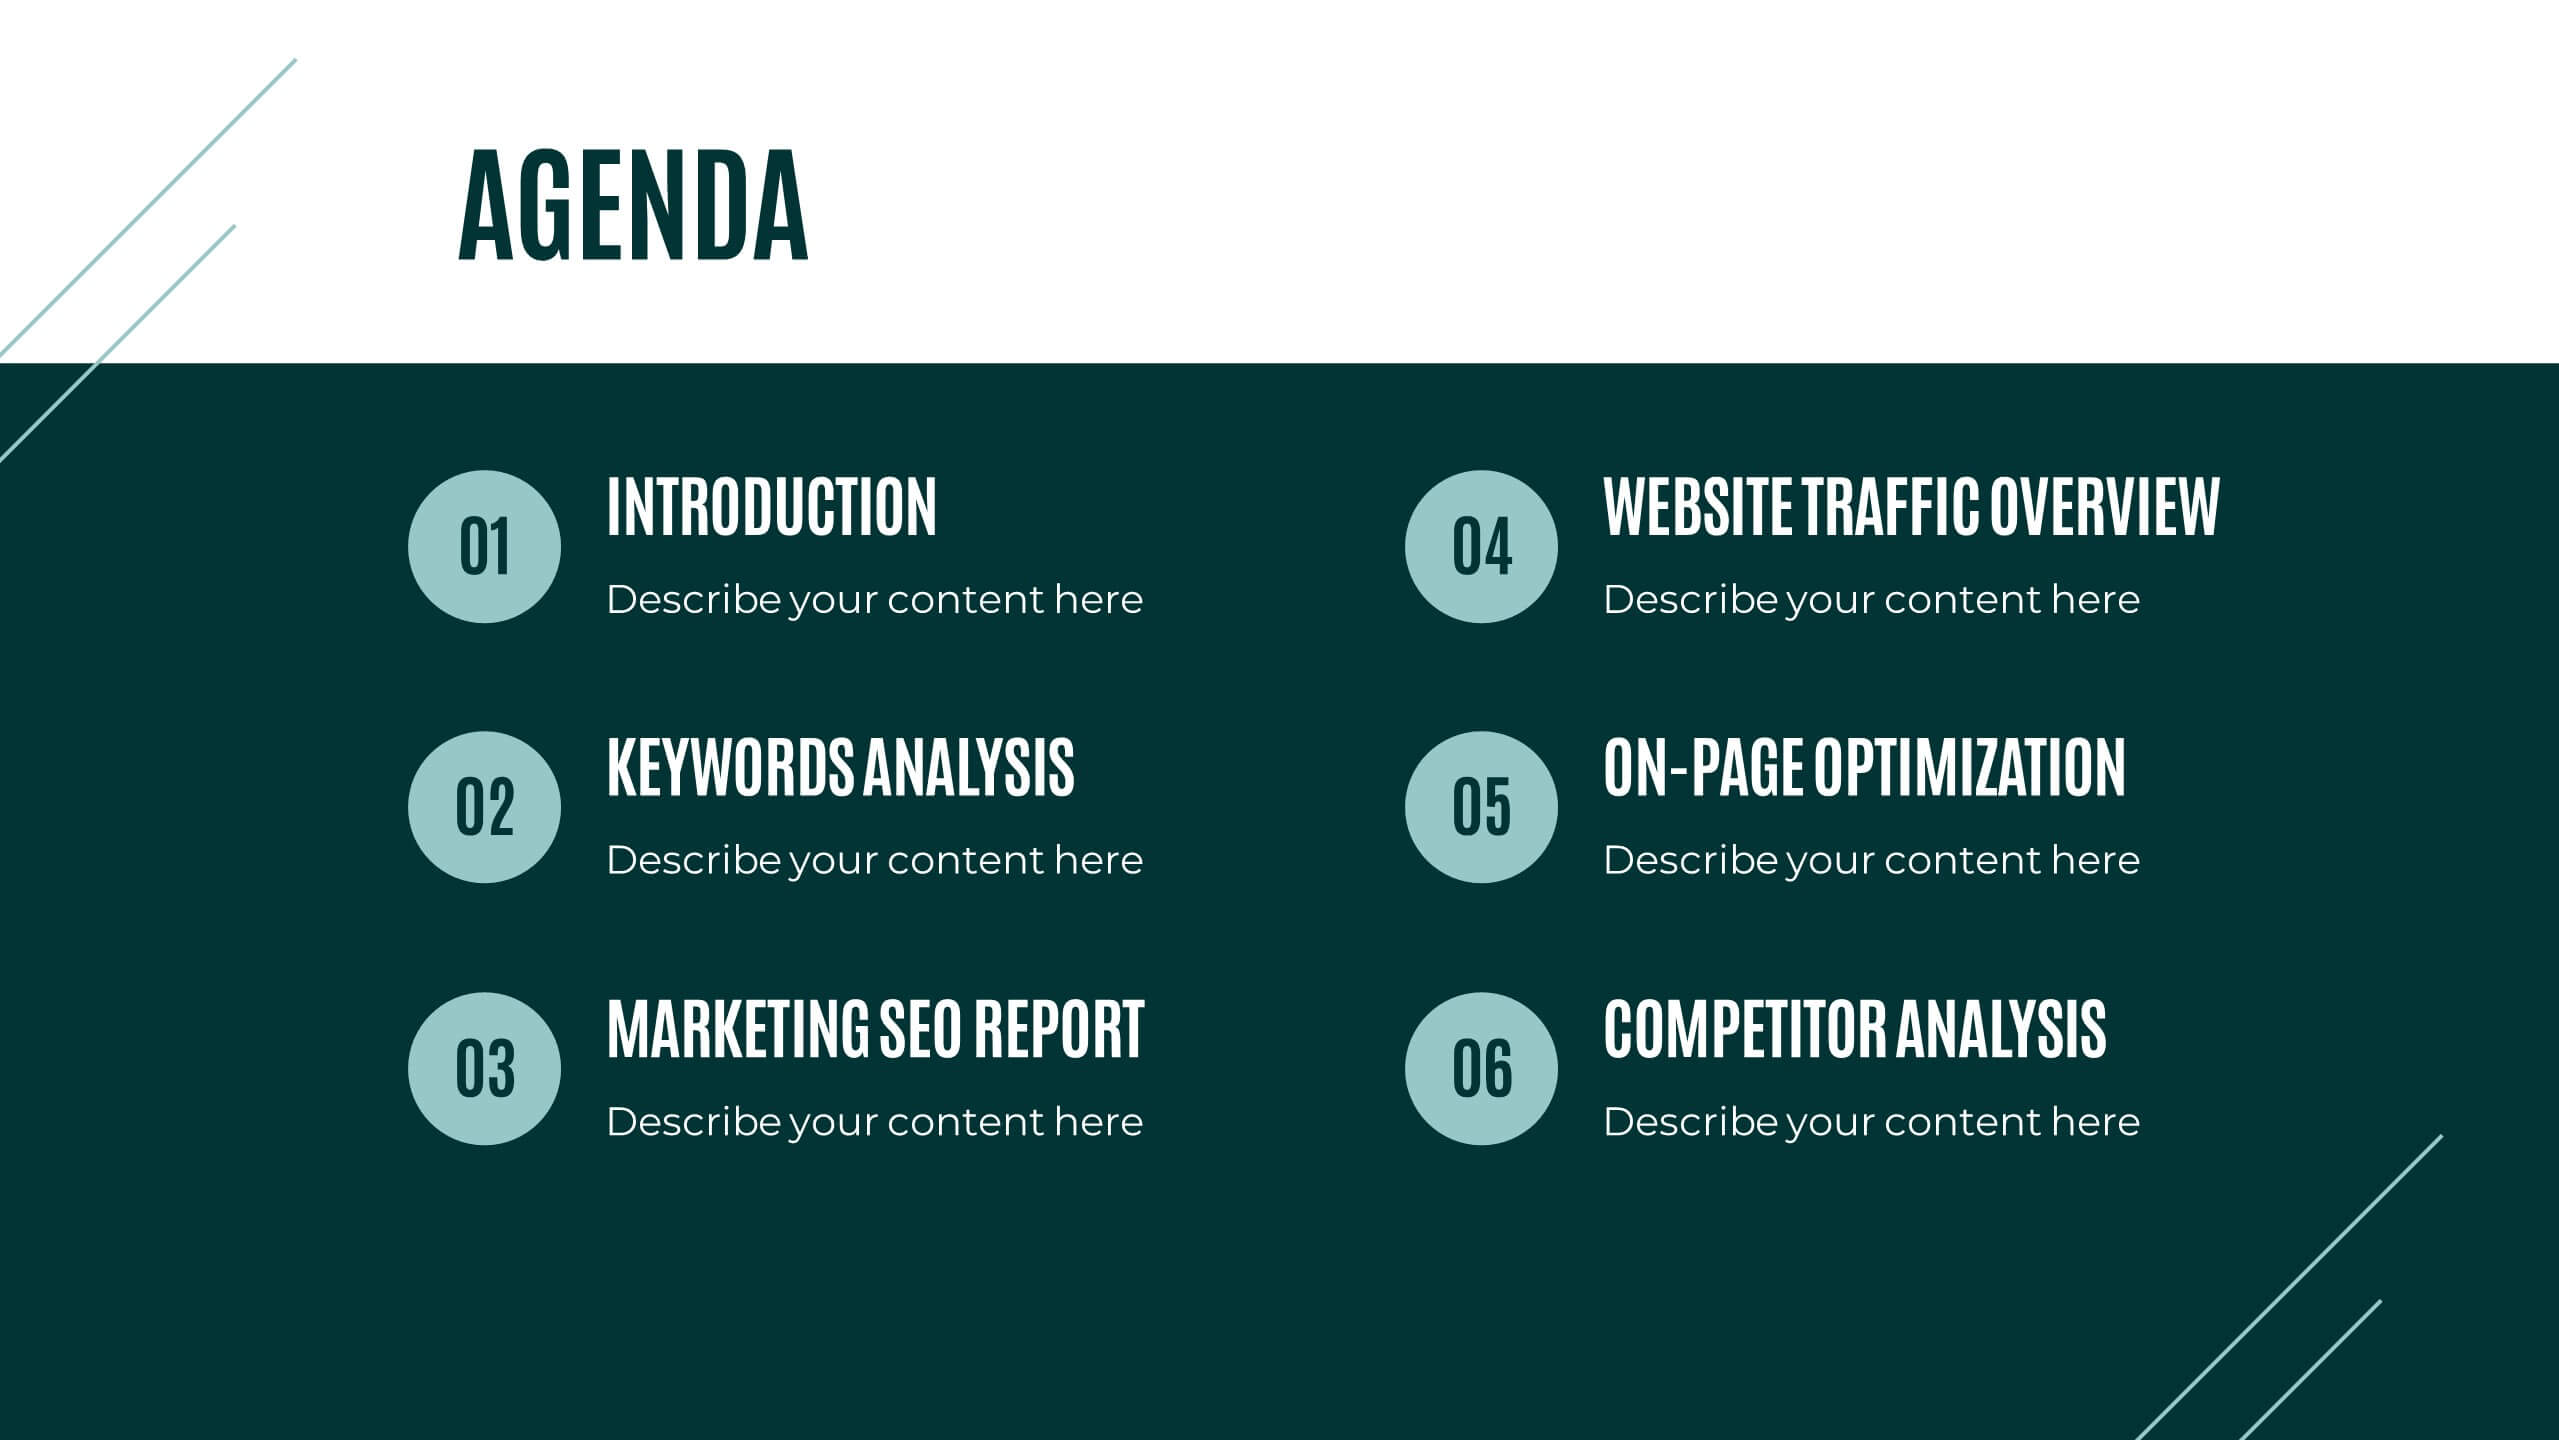
Introduction Slide for Professional Decks Presentation
Make a strong first impression with this clean and modern introduction slide. Designed to kick off your presentation with clarity, this template is ideal for professional decks, pitch presentations, and business briefings. Customize the layout with your visuals and text to align with your message. Fully compatible with PowerPoint, Keynote, and Google Slides.
21 diapositivas
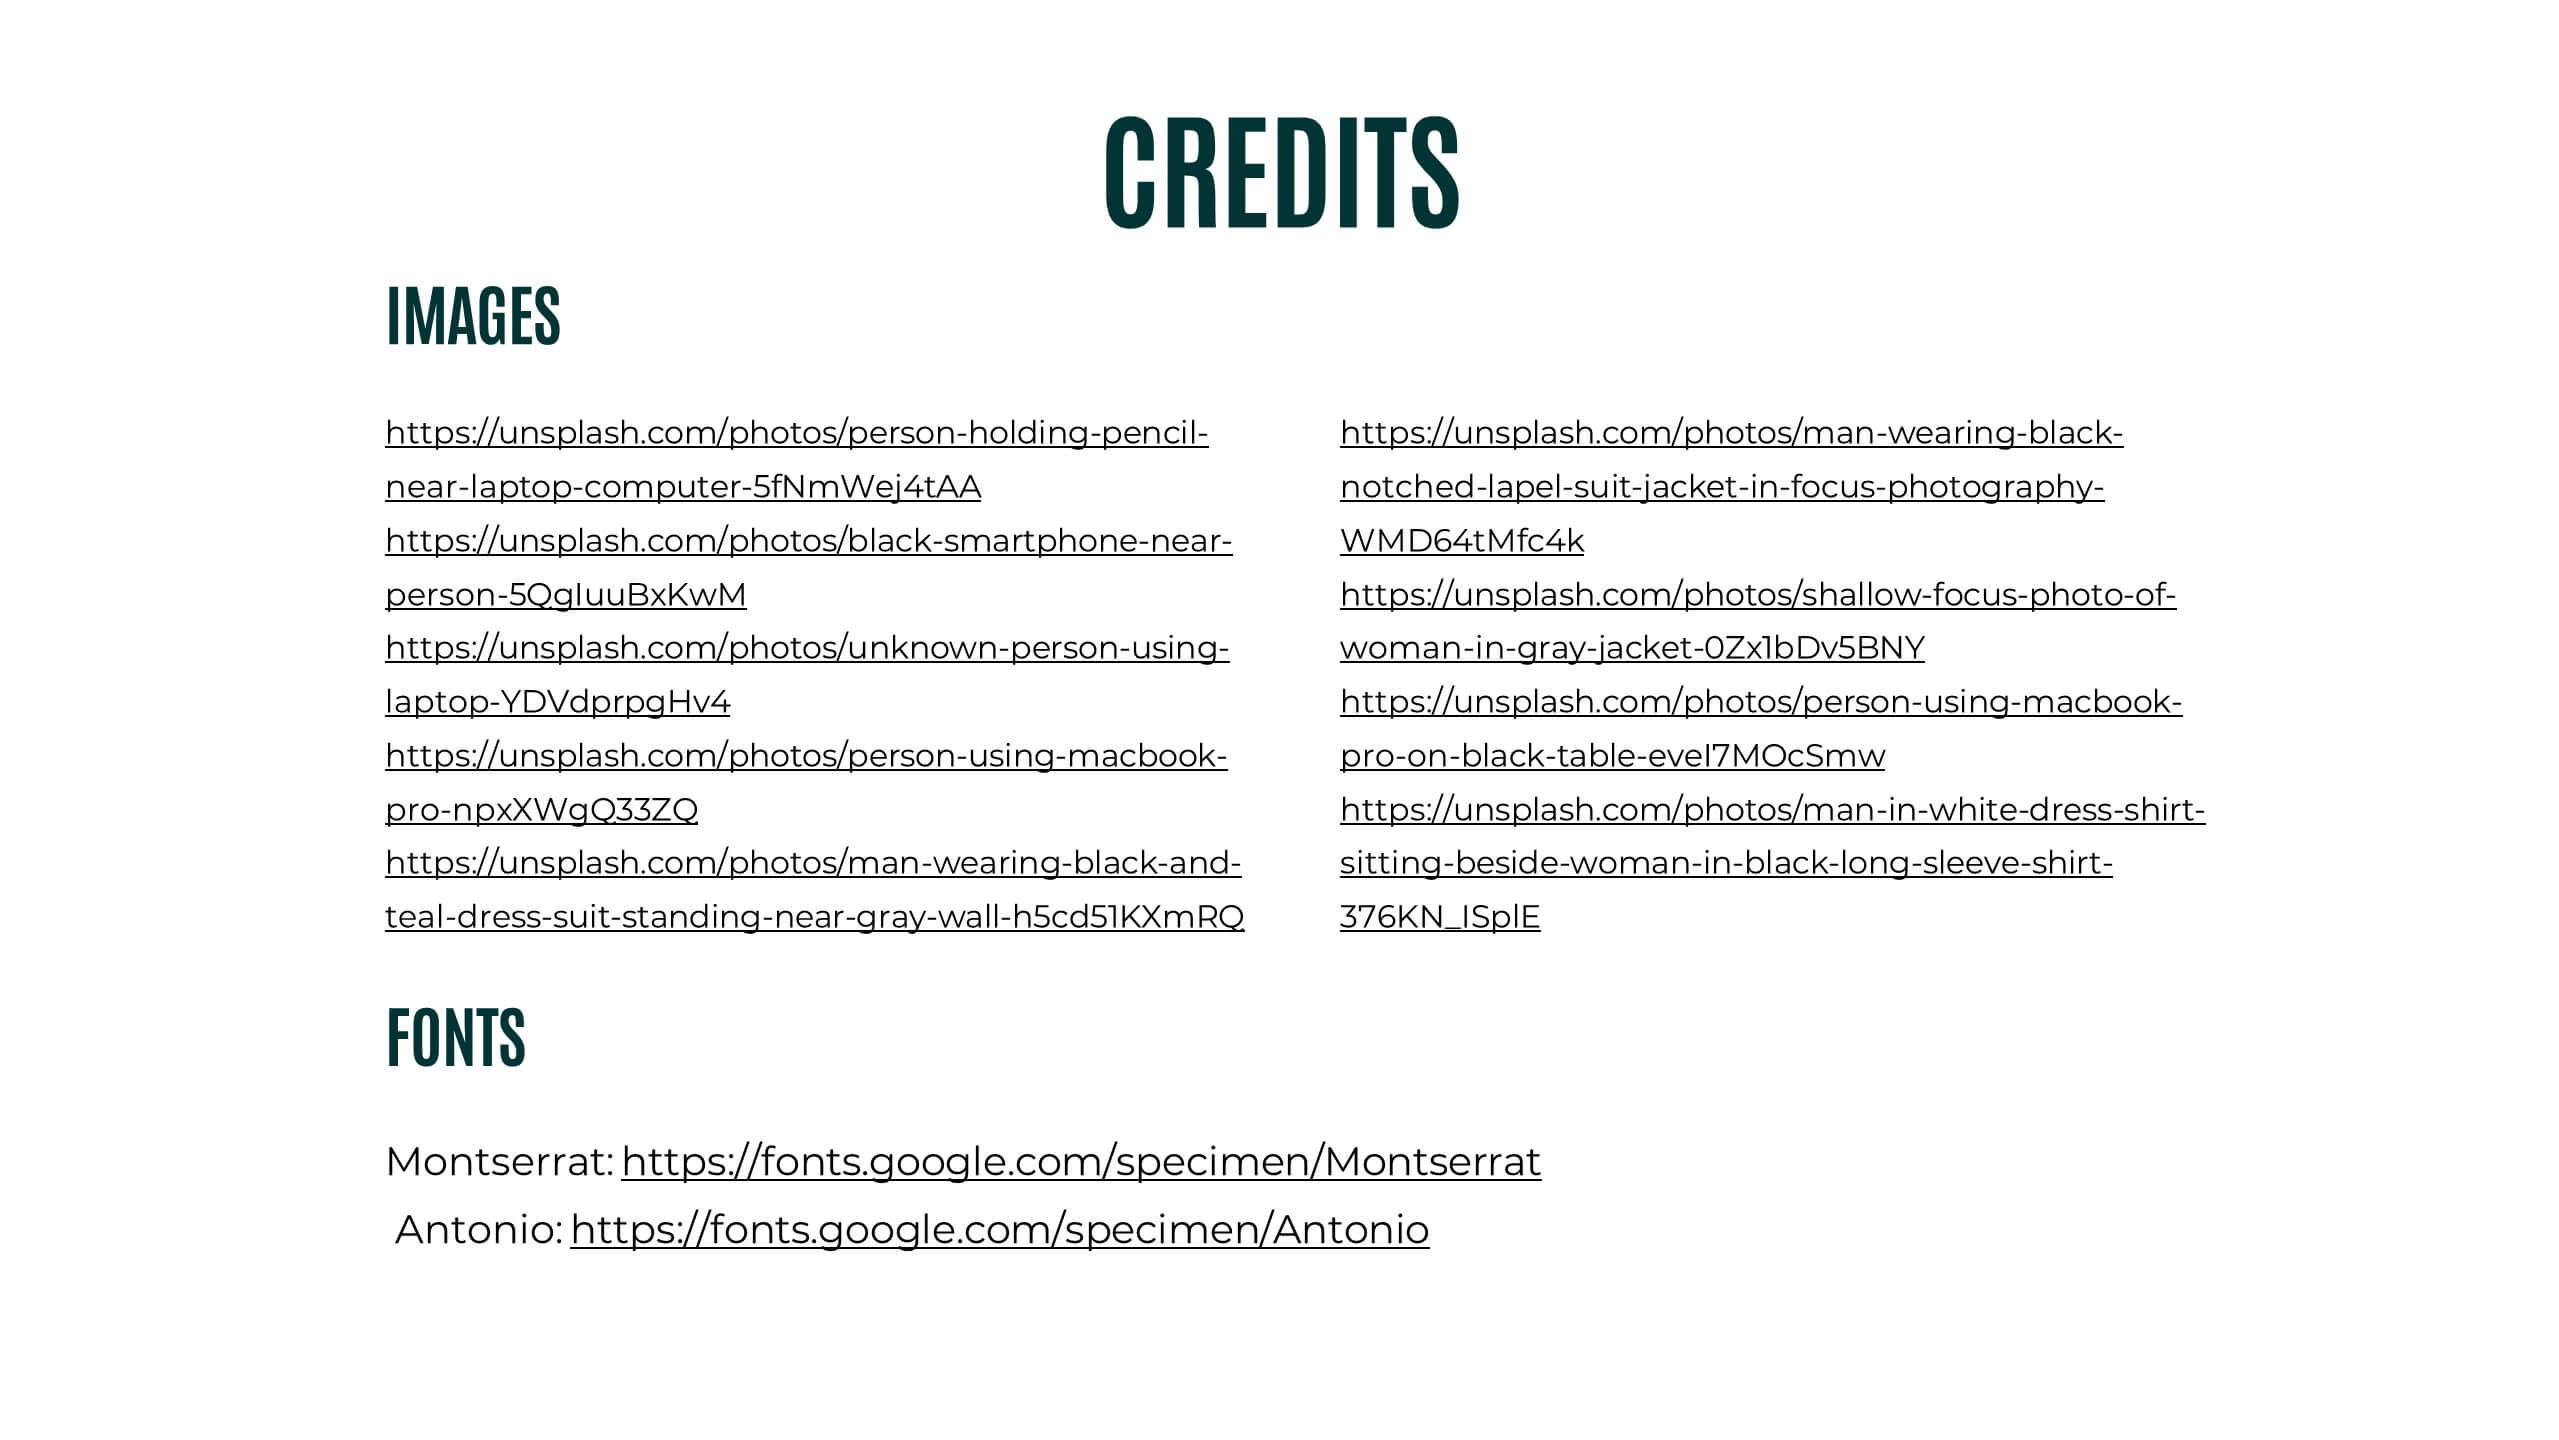
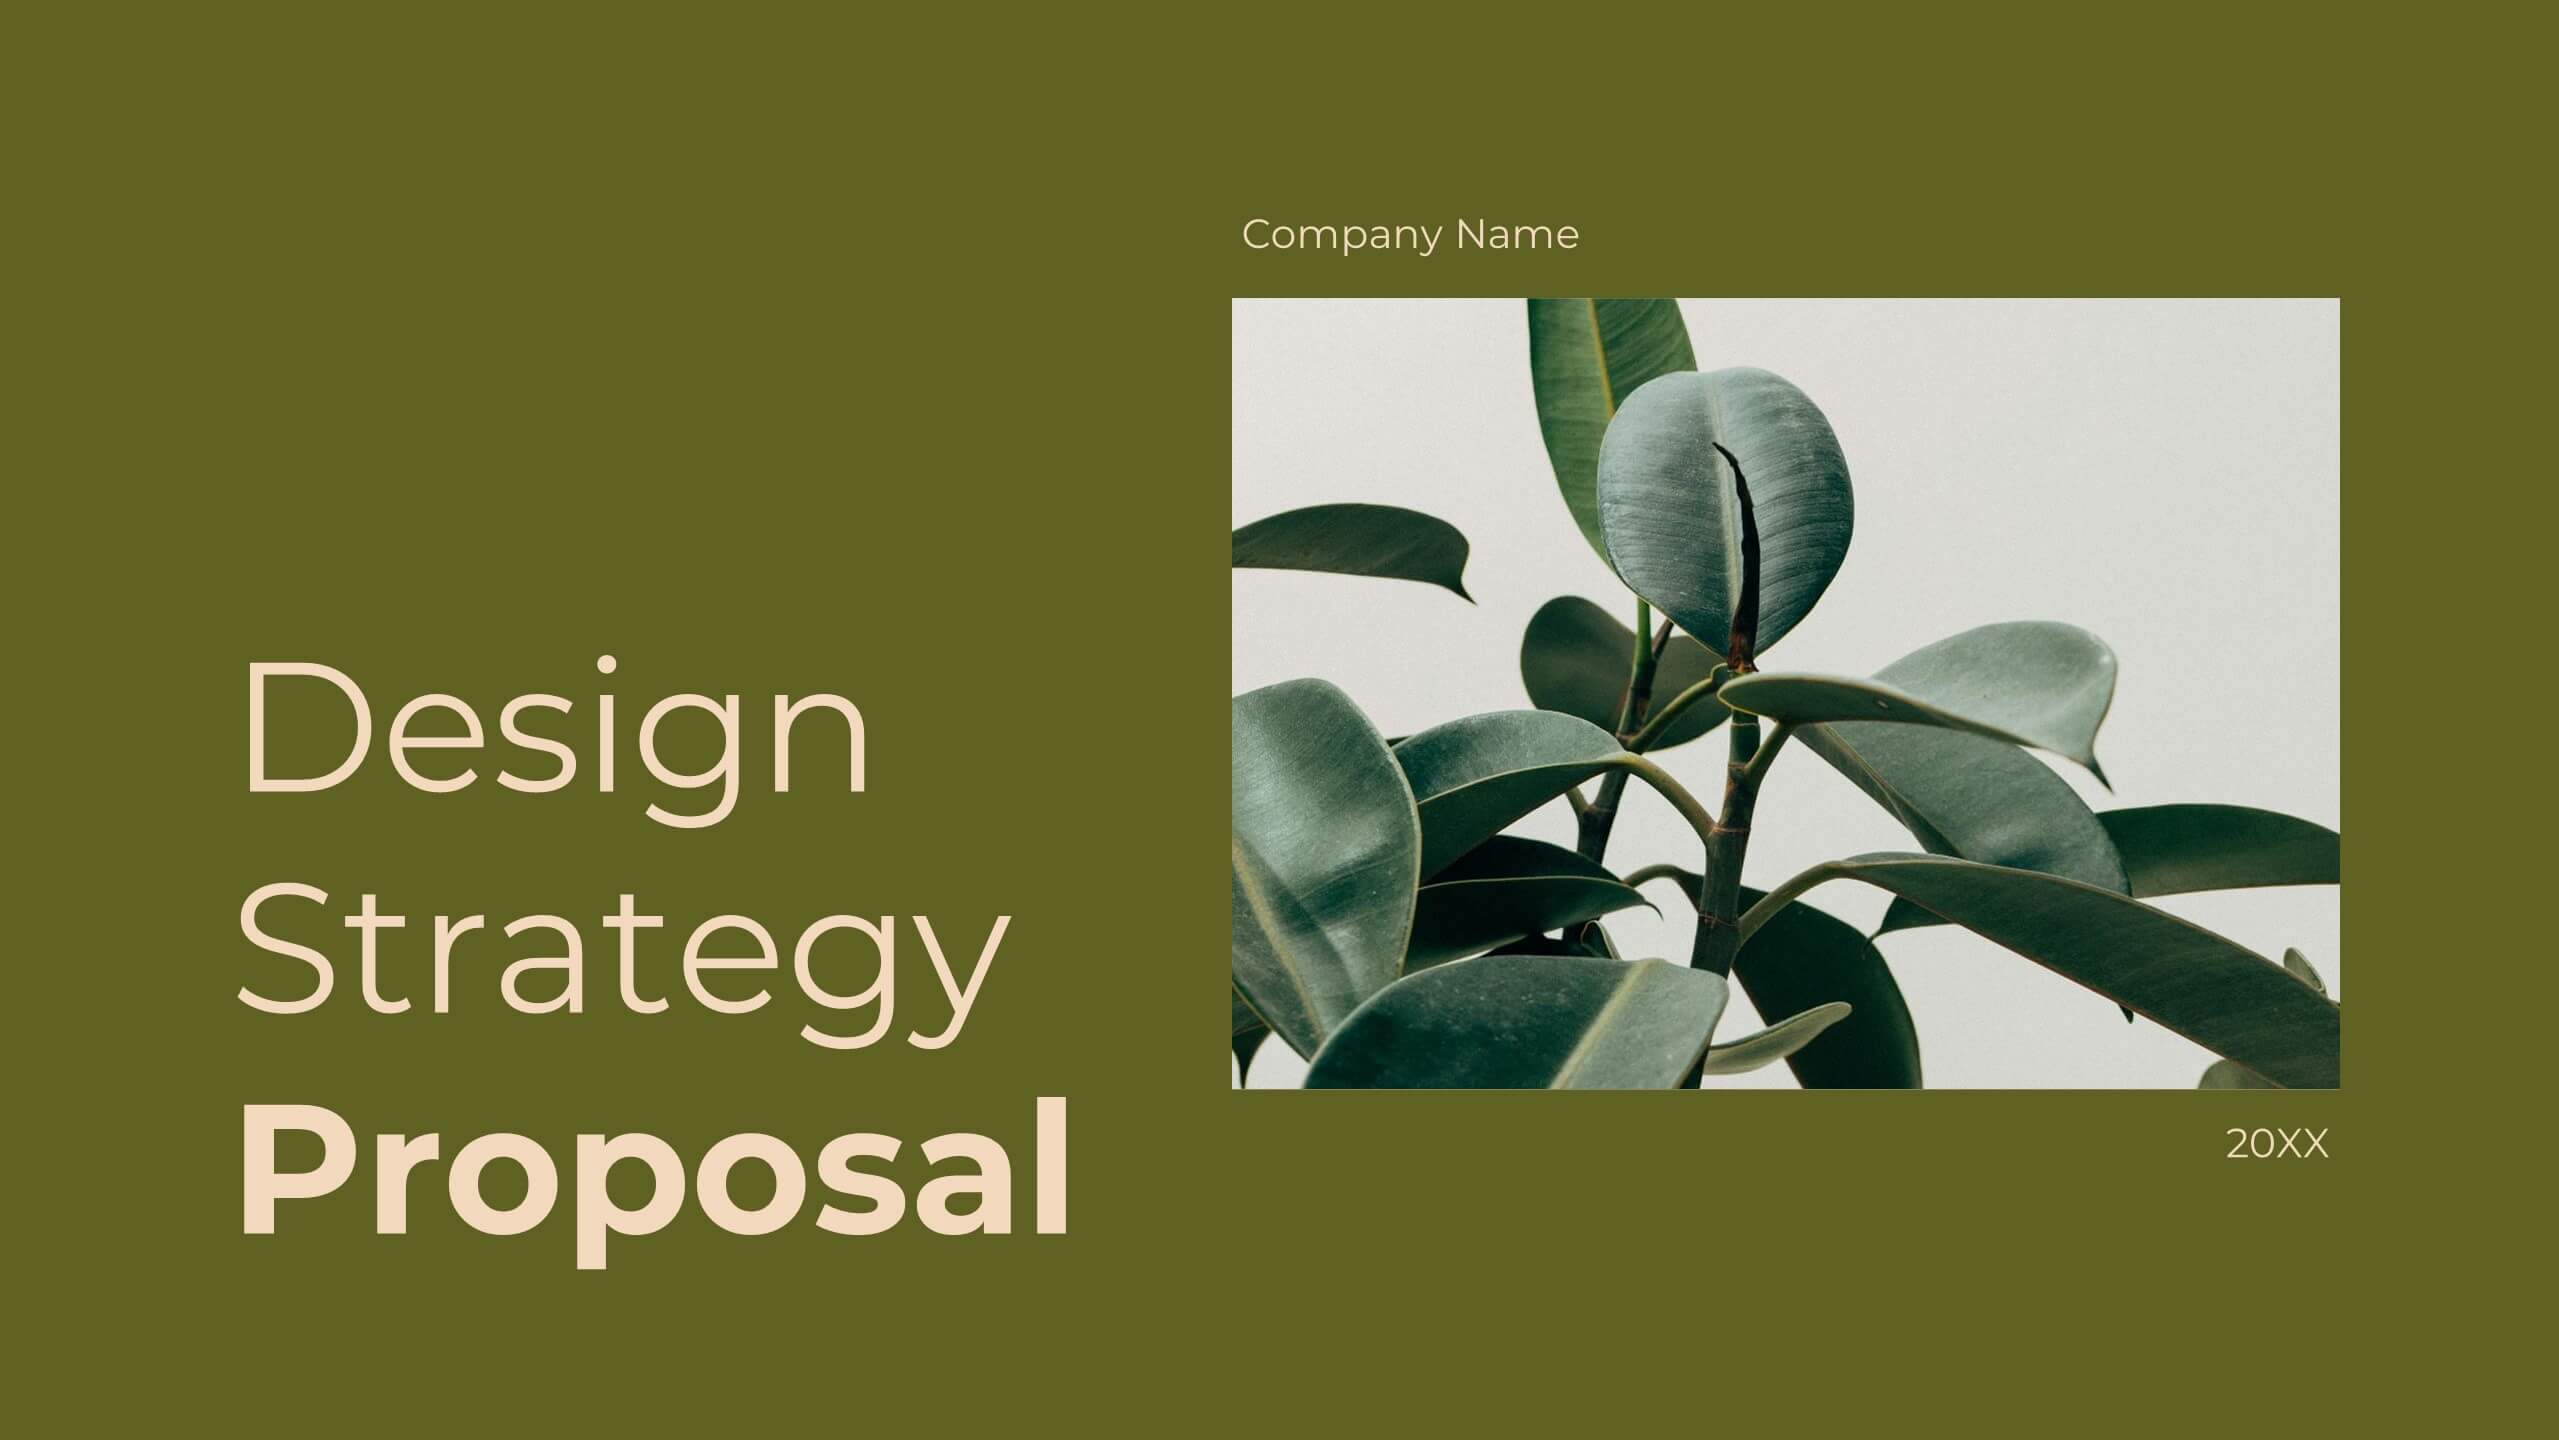
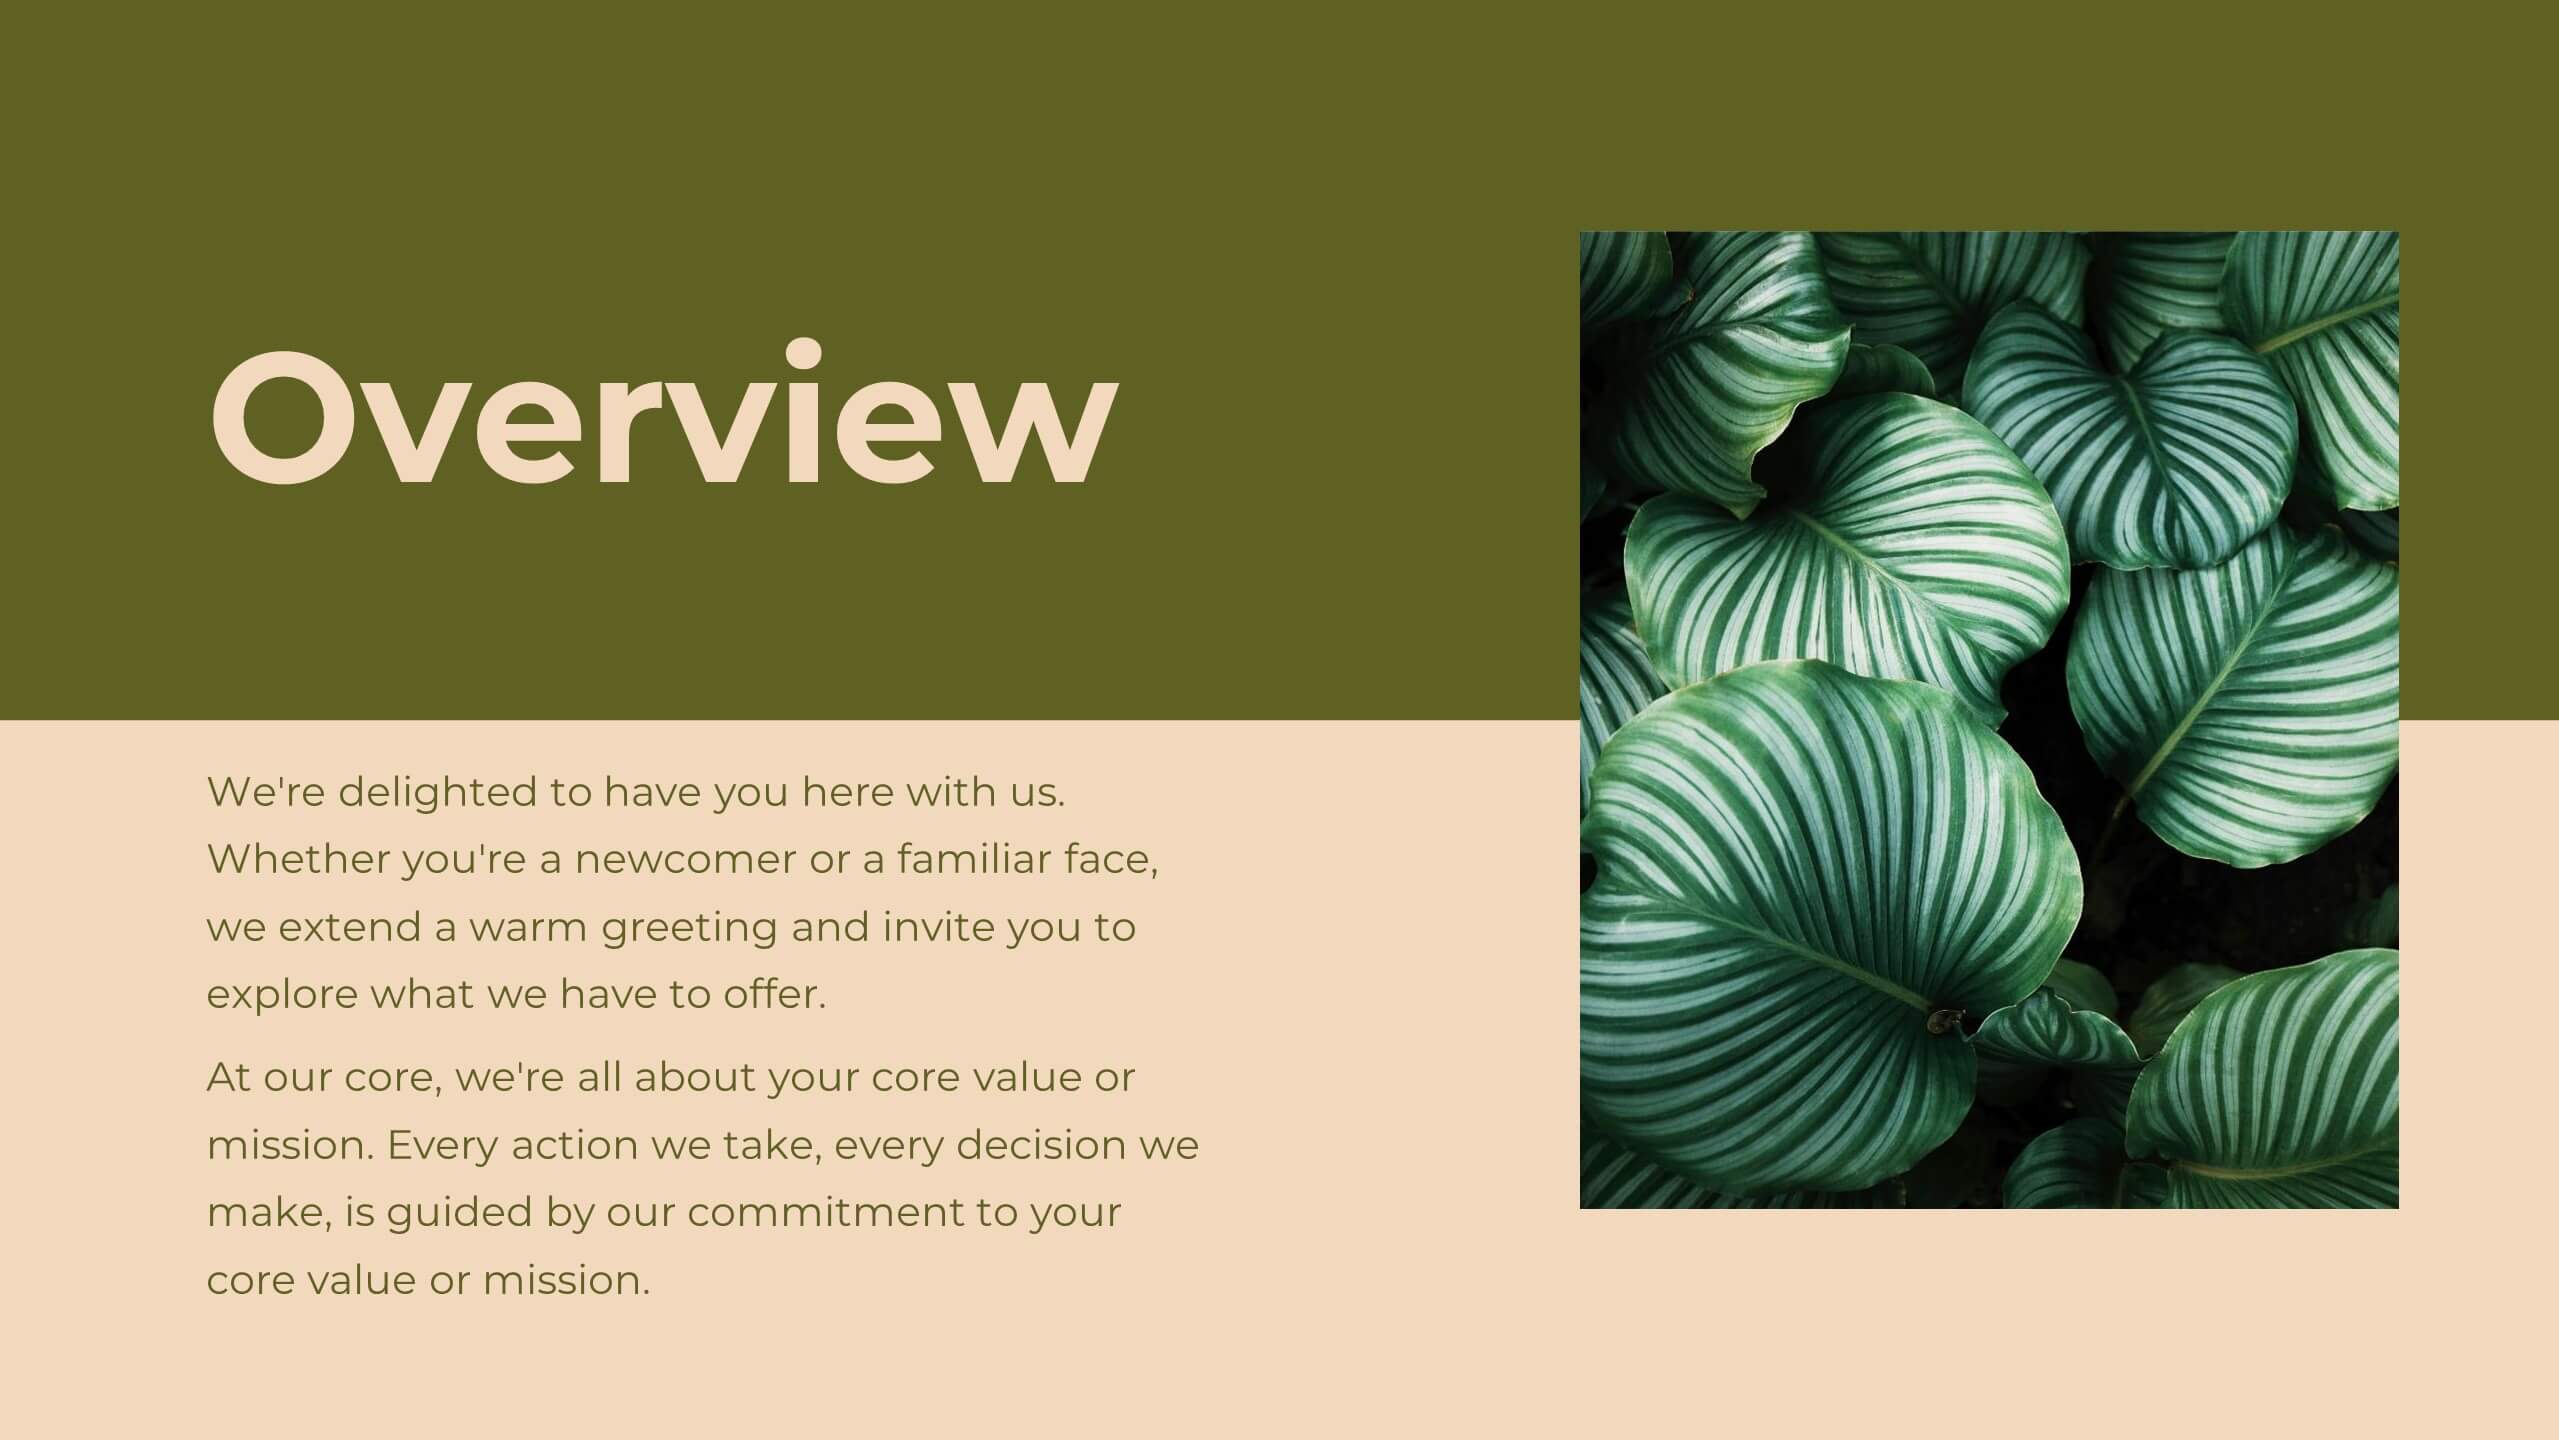
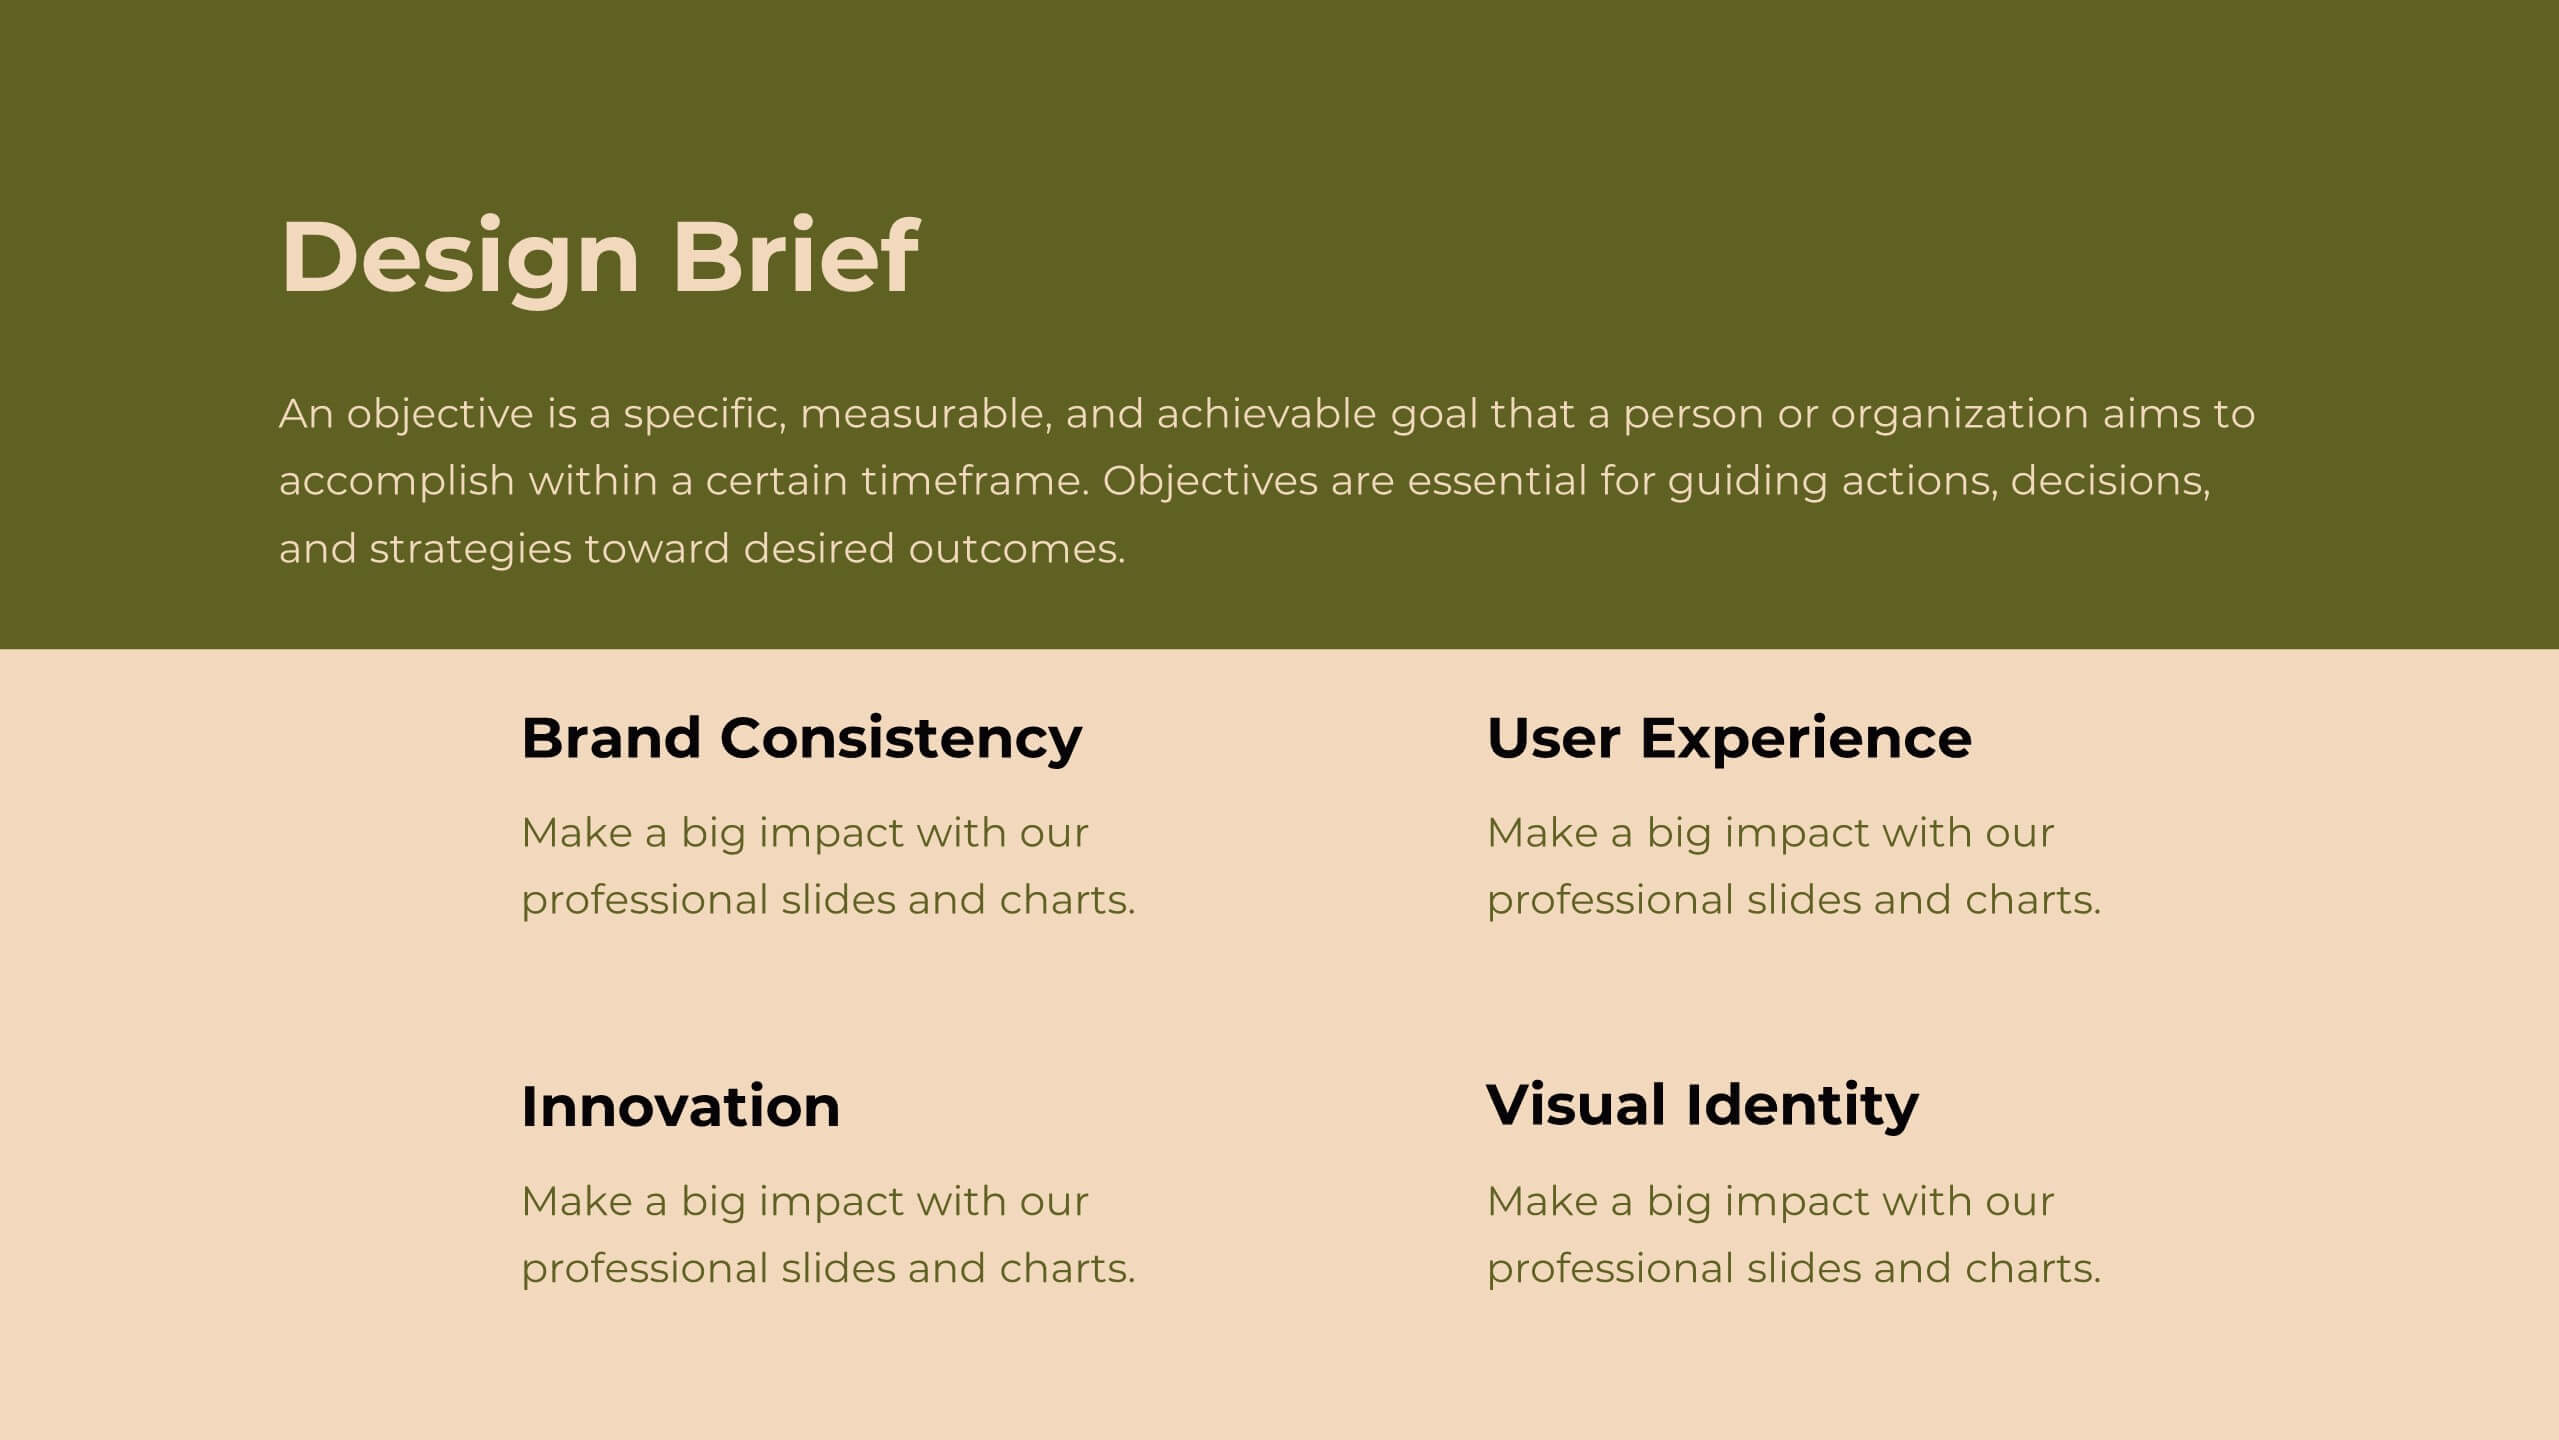
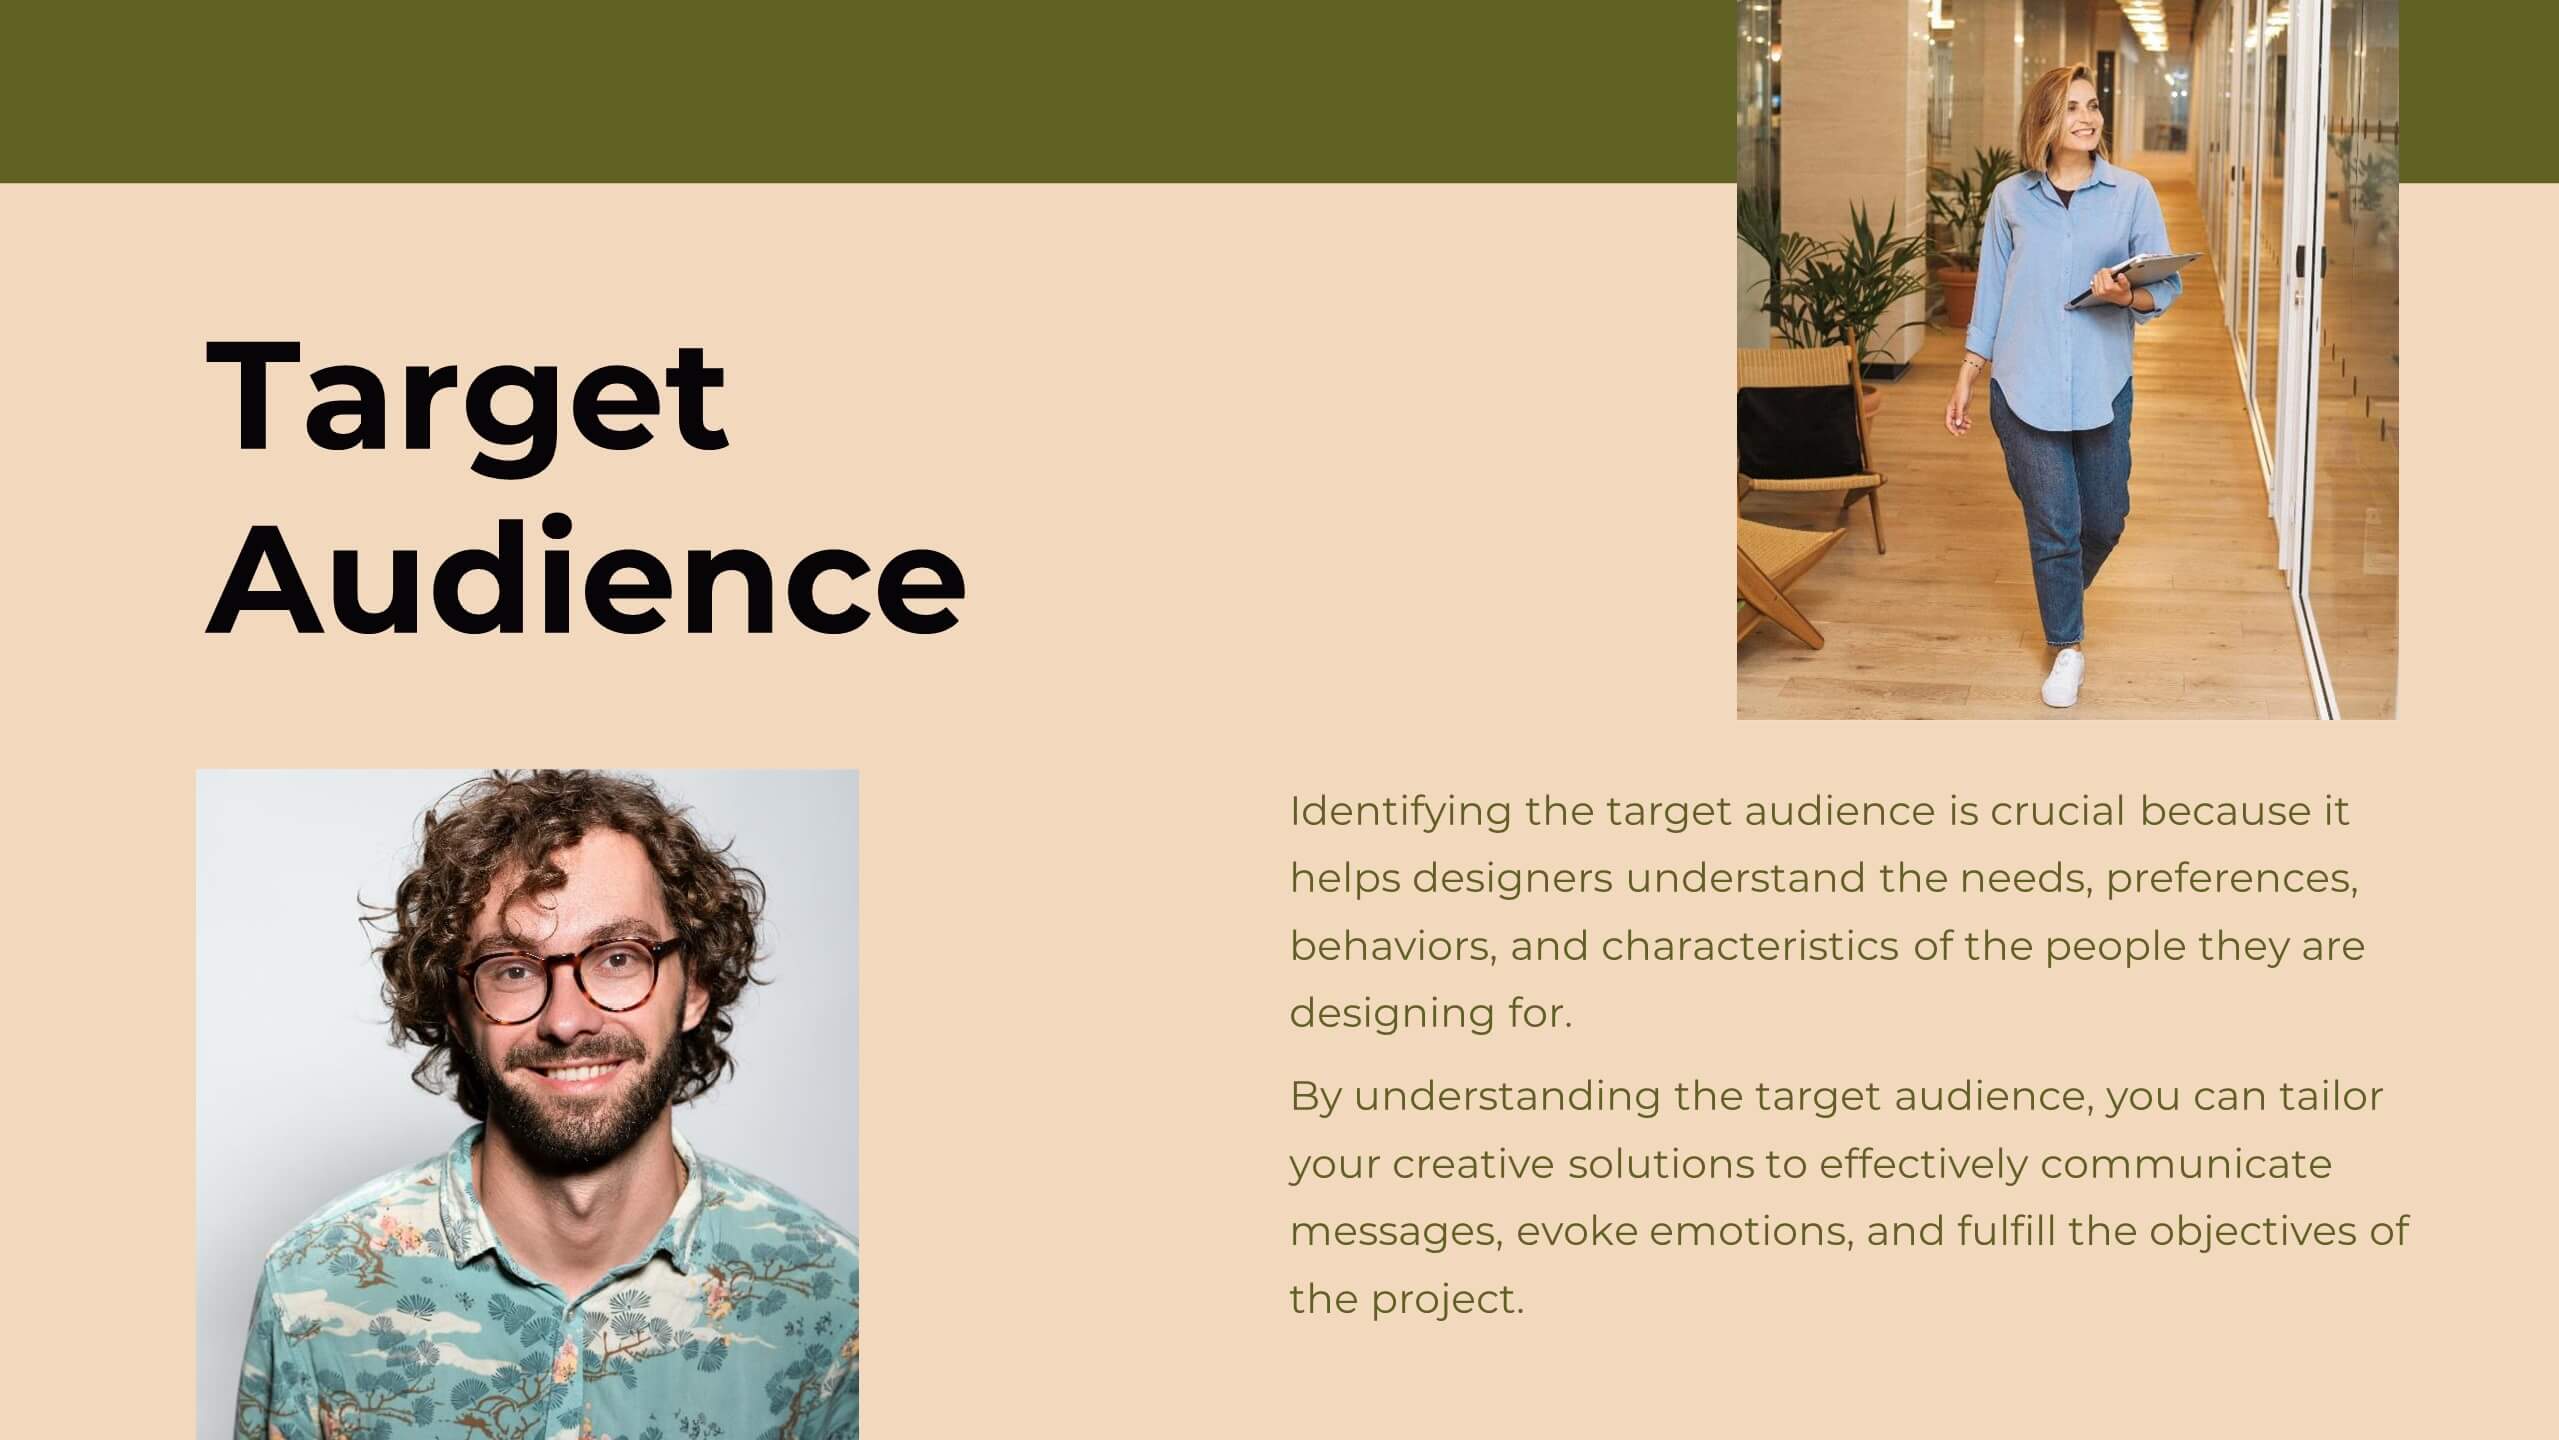
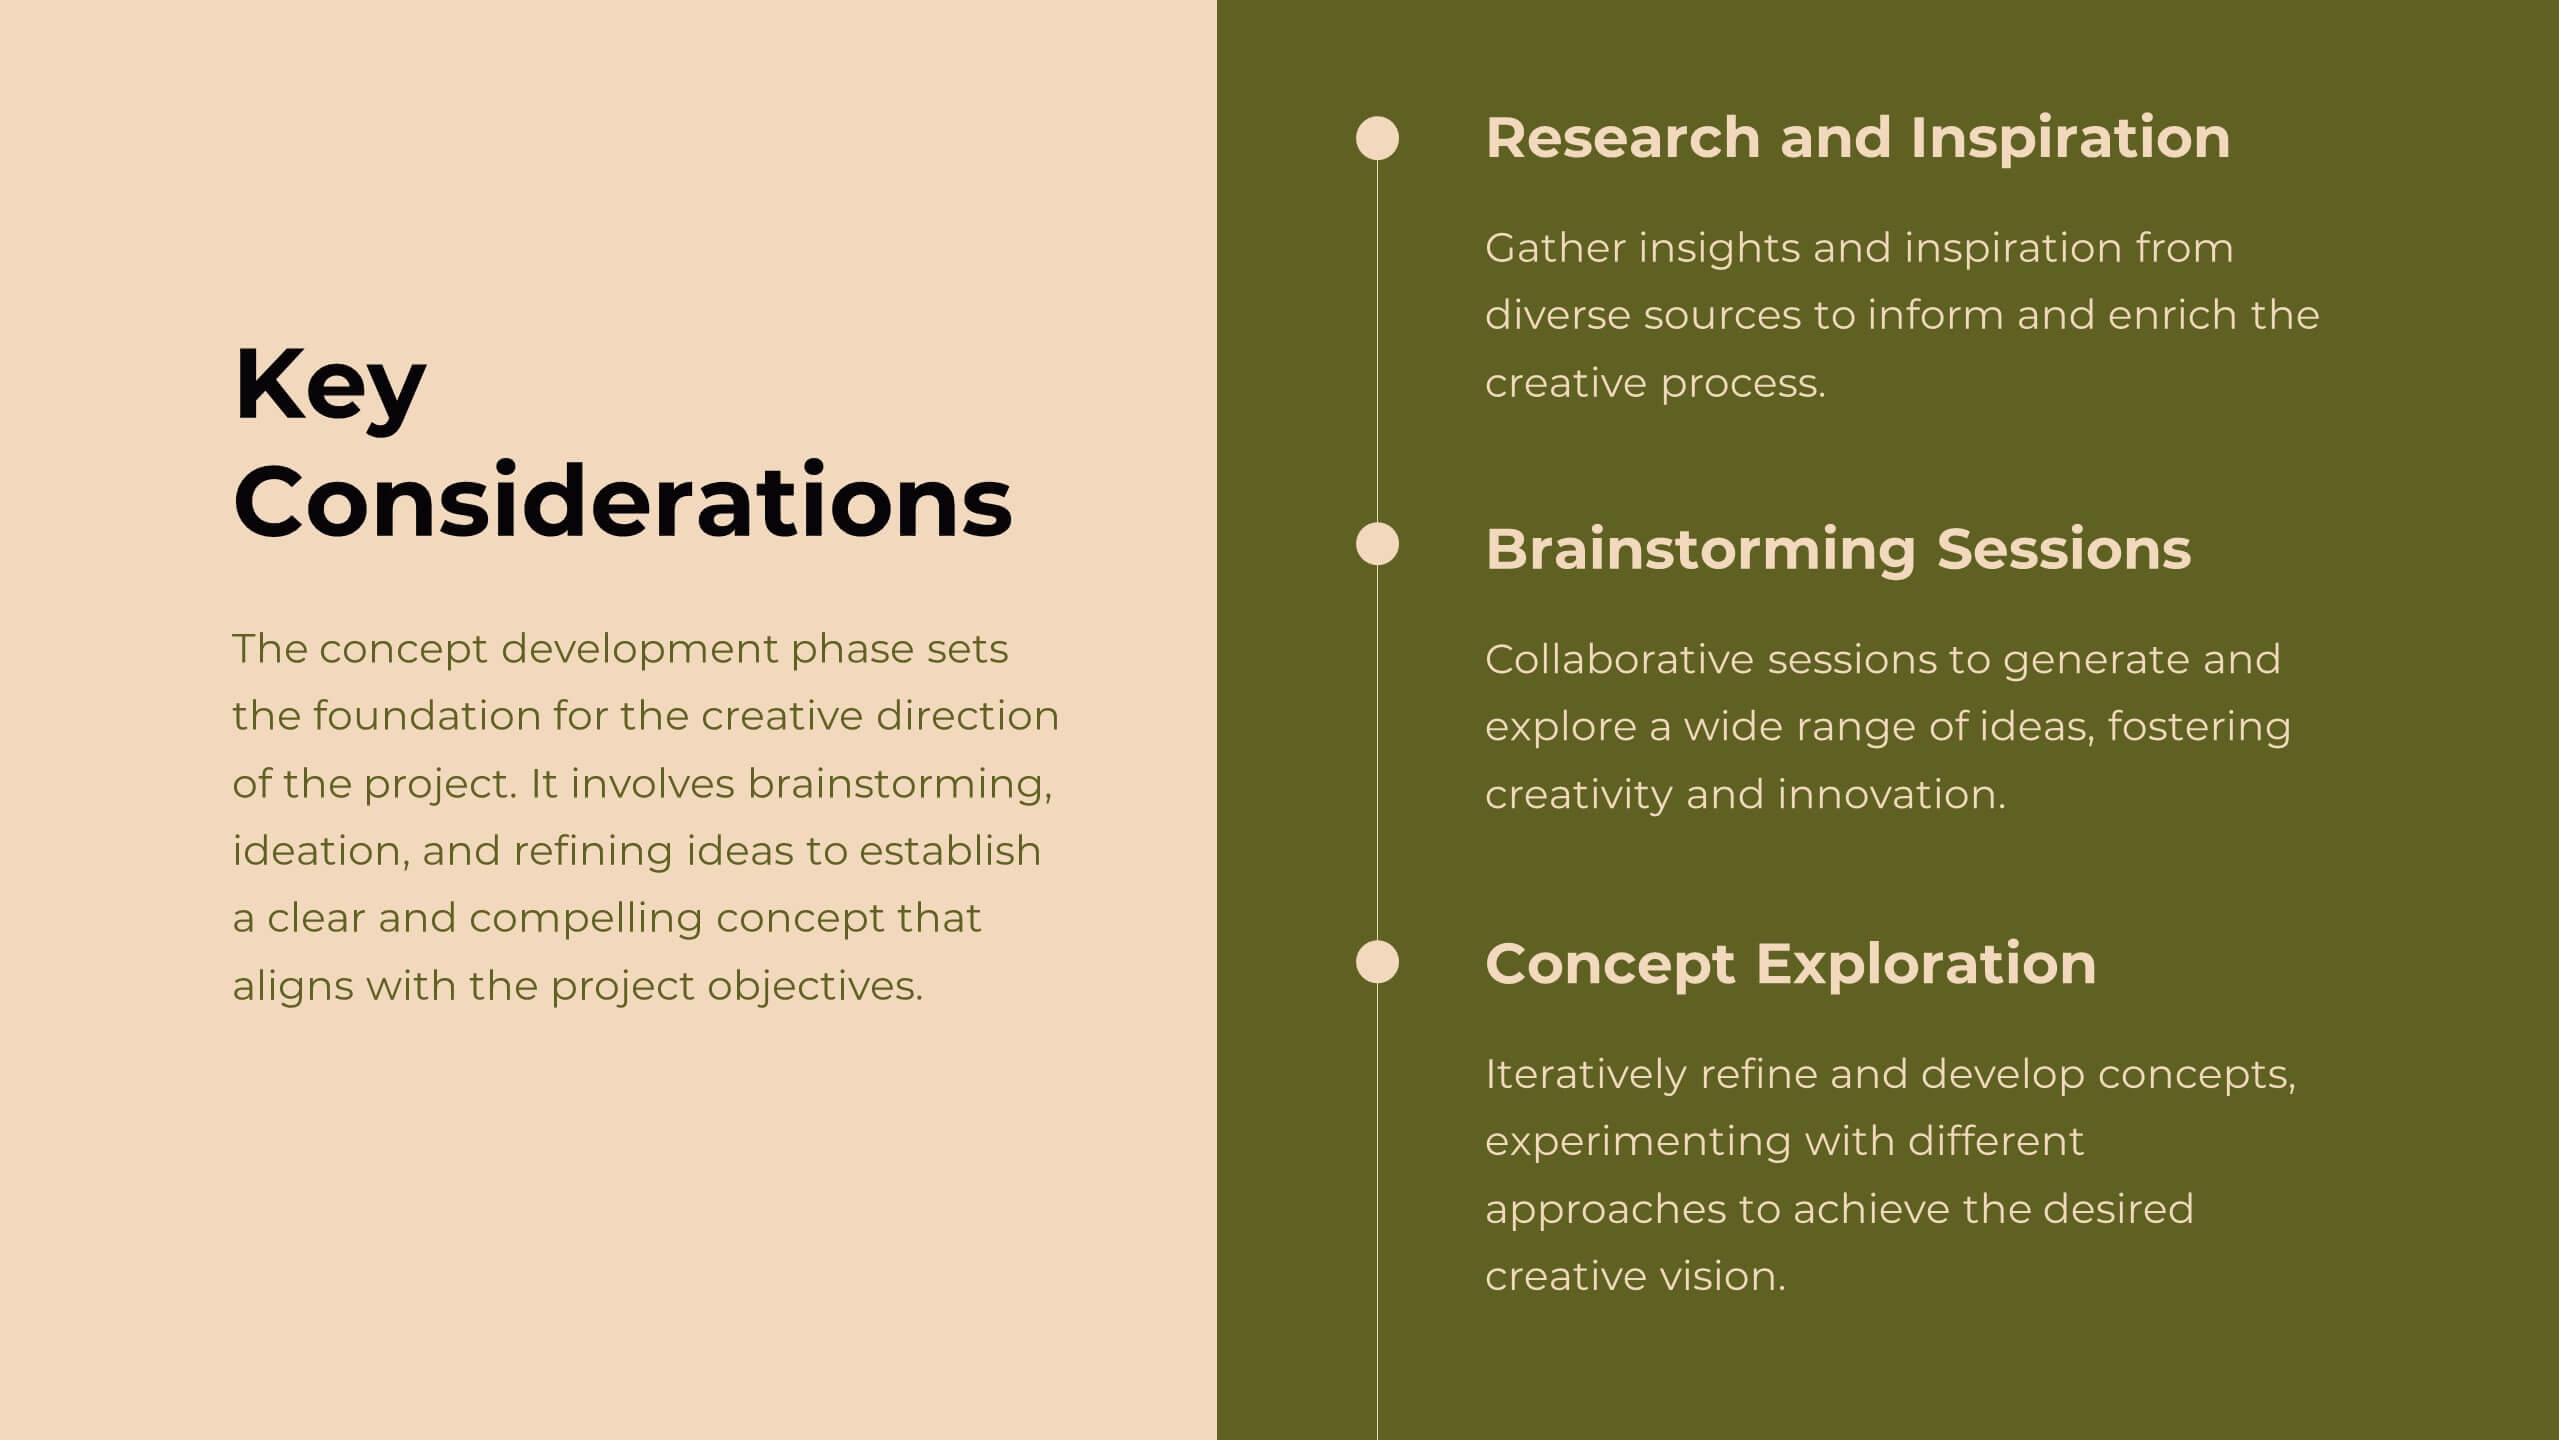
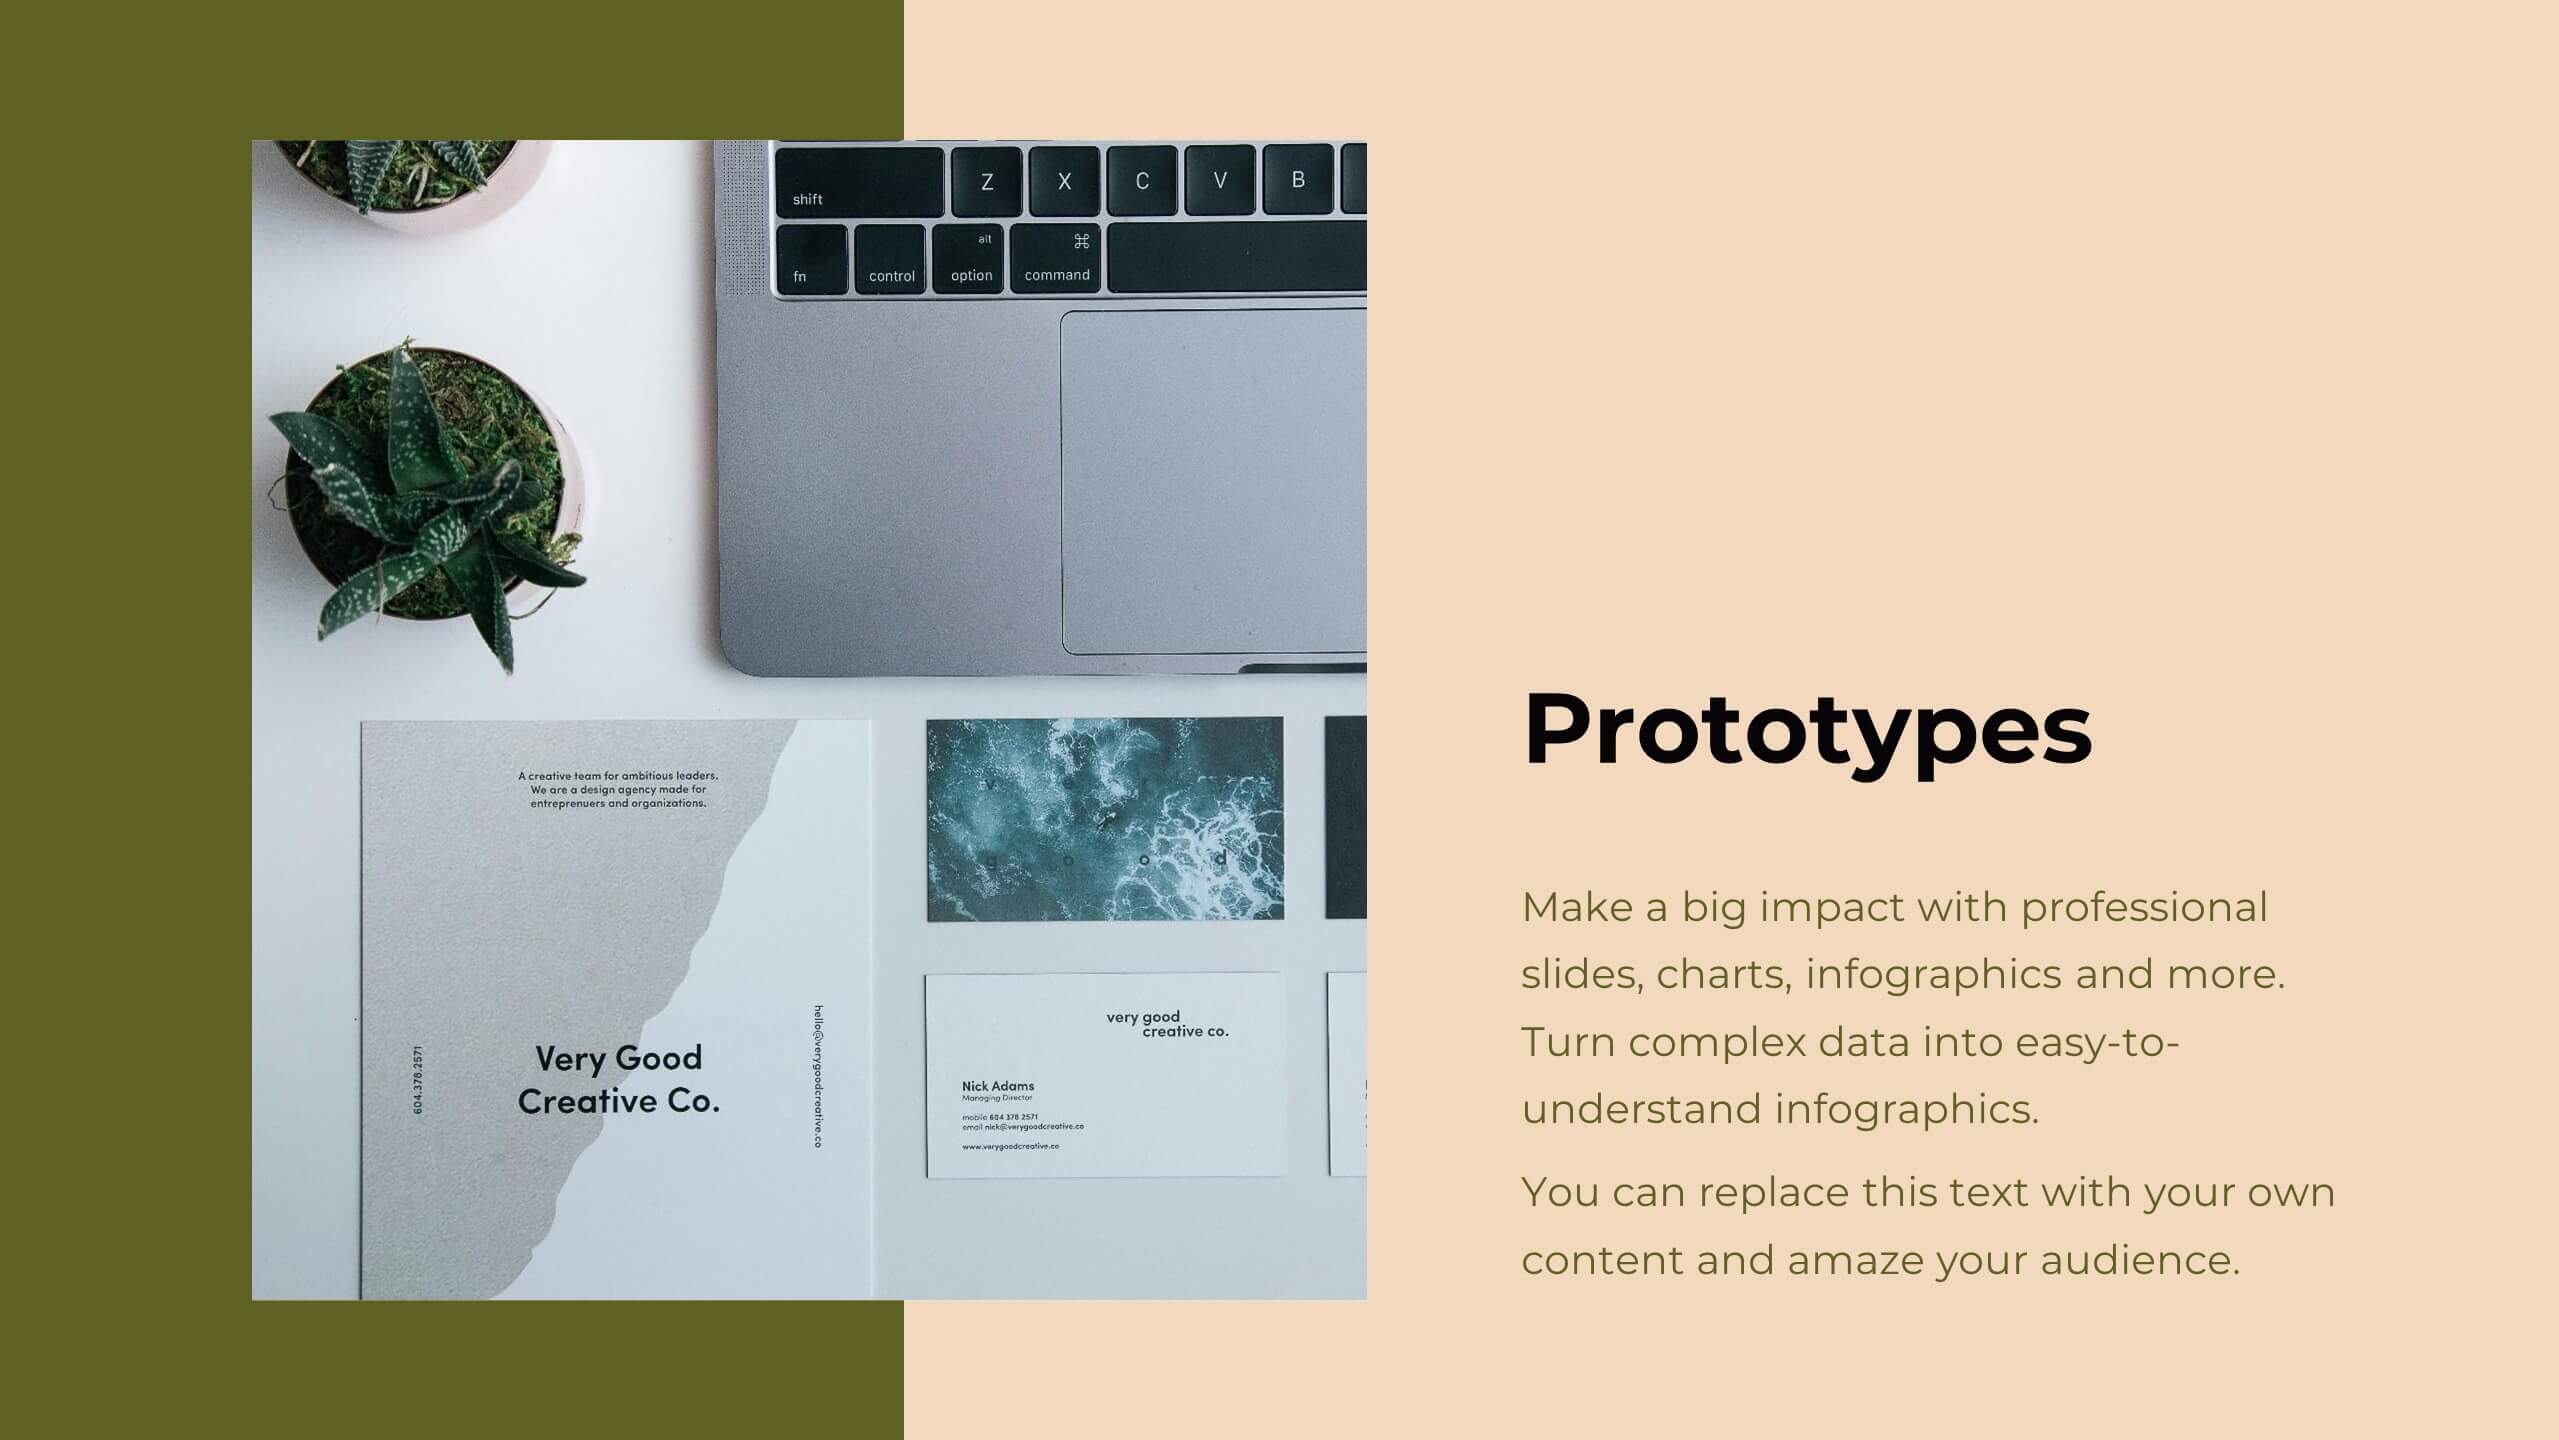
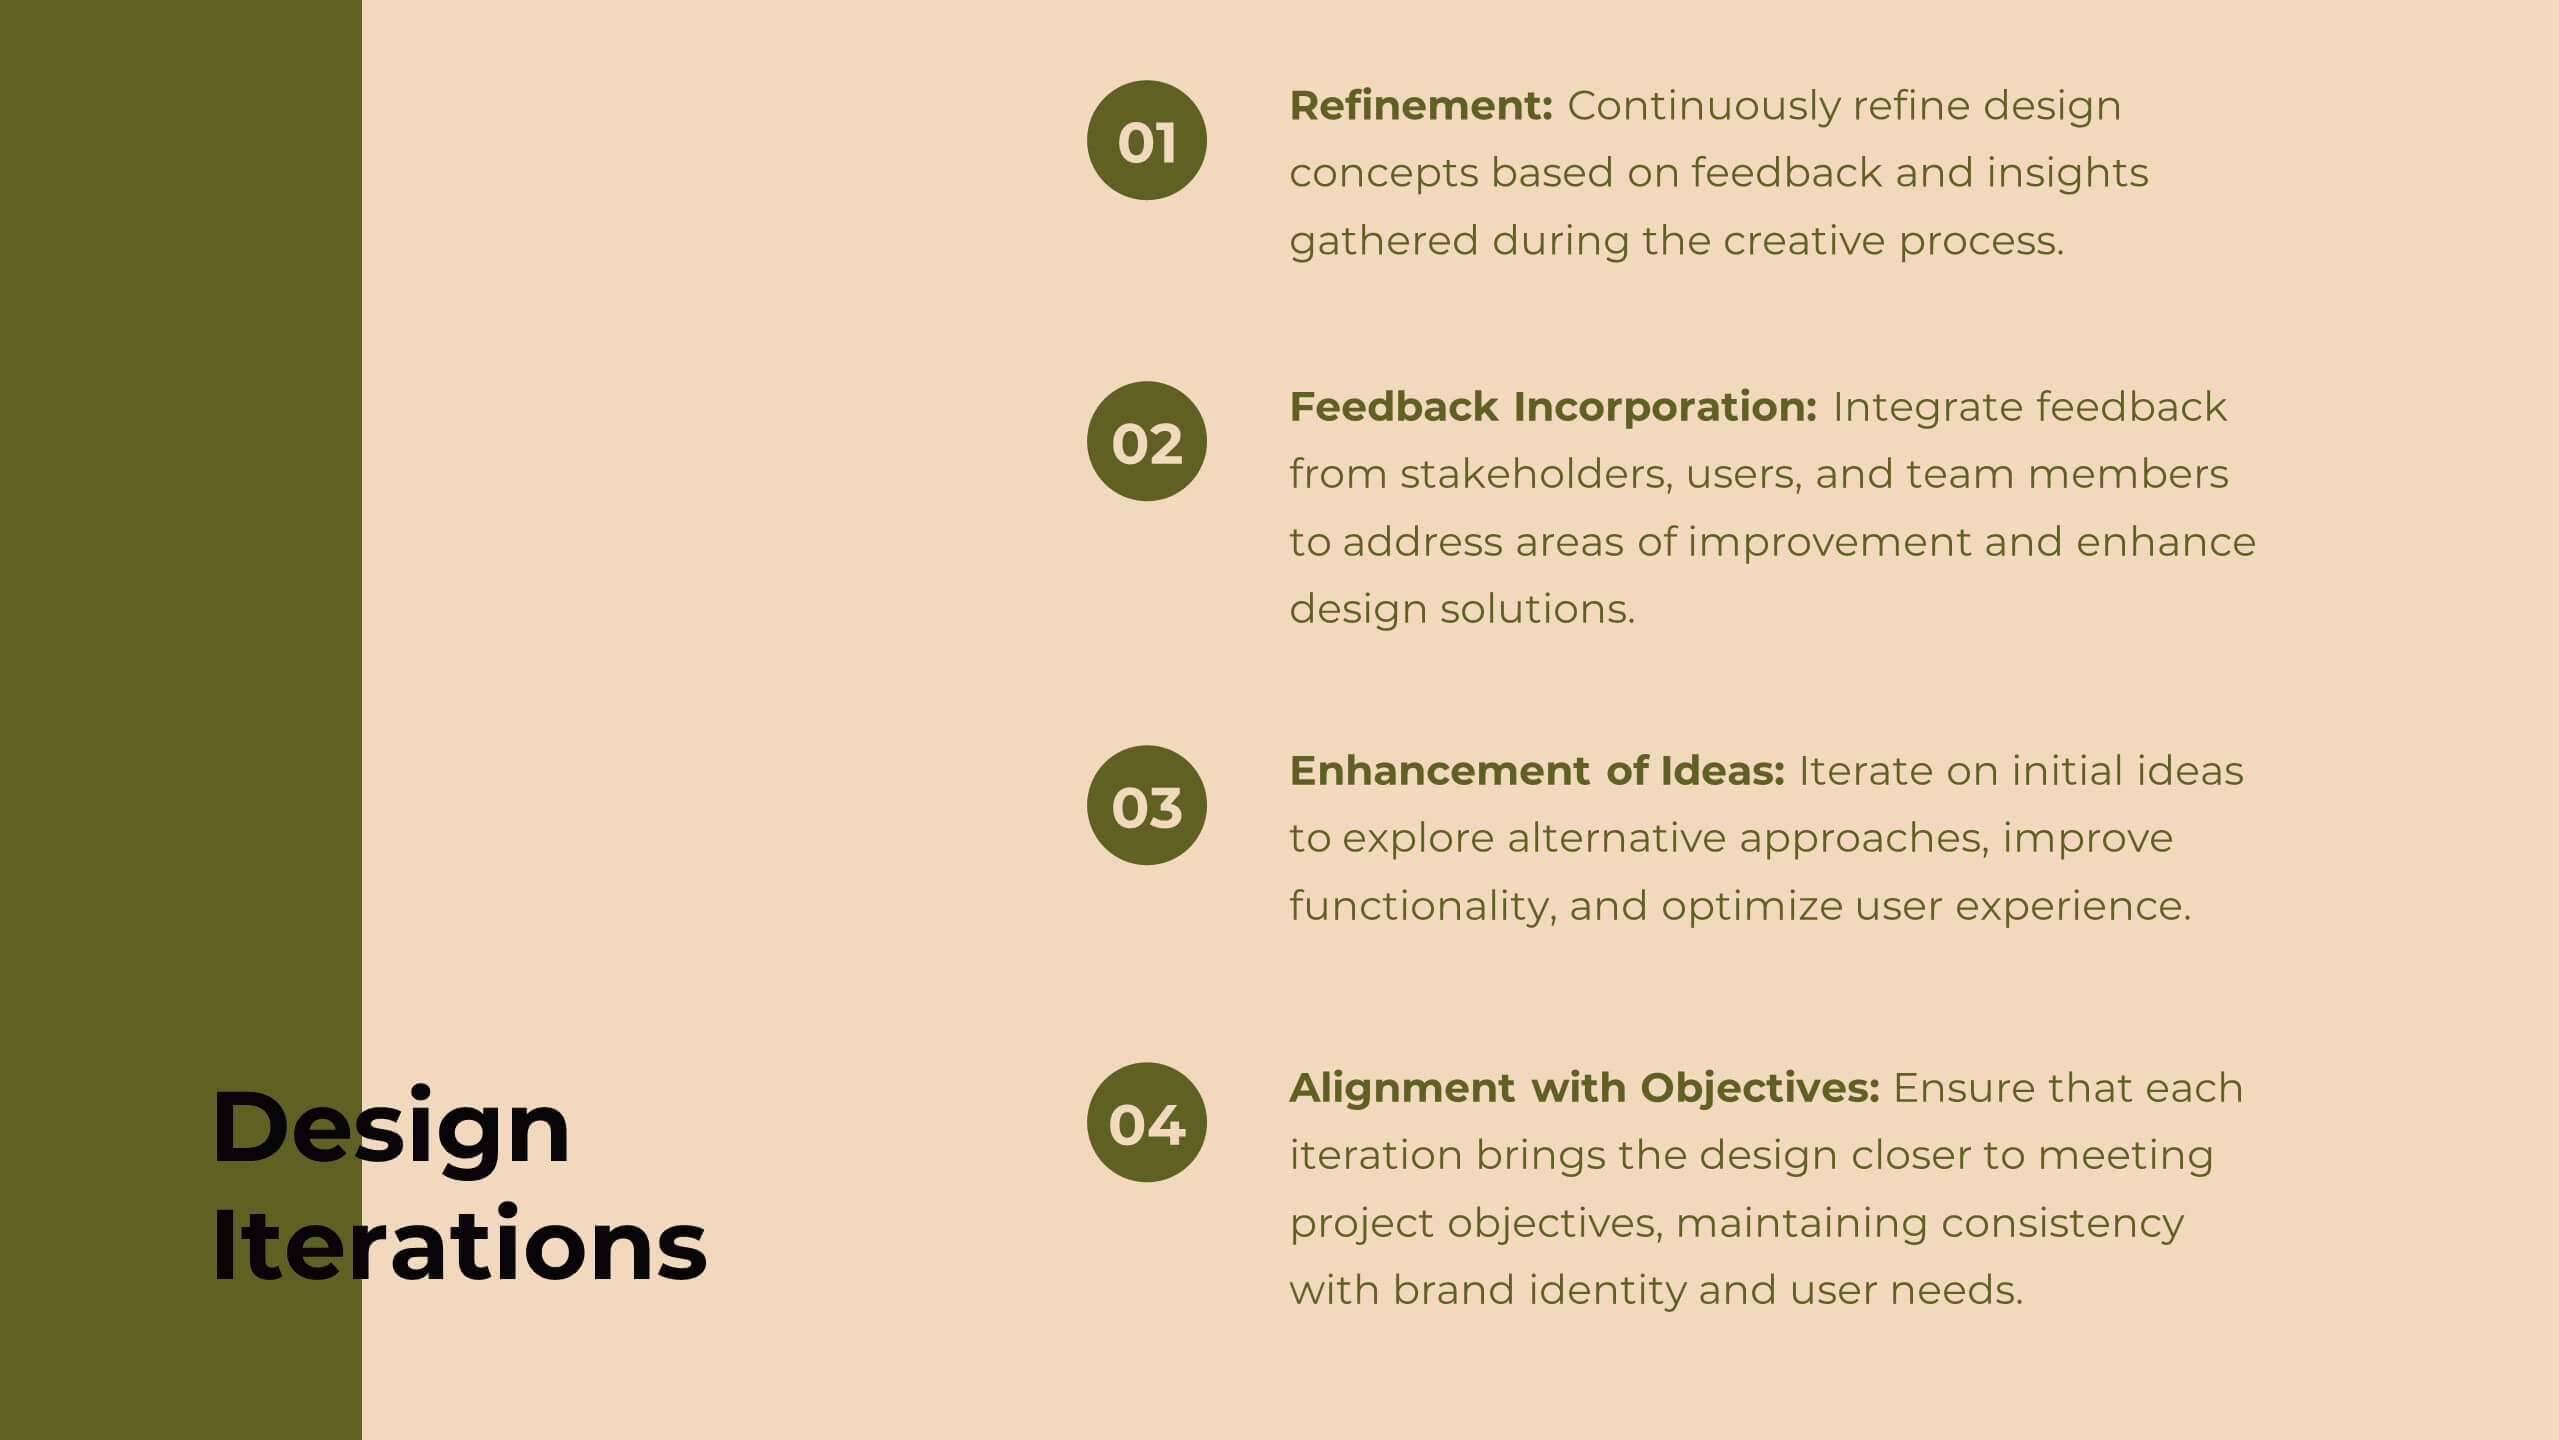
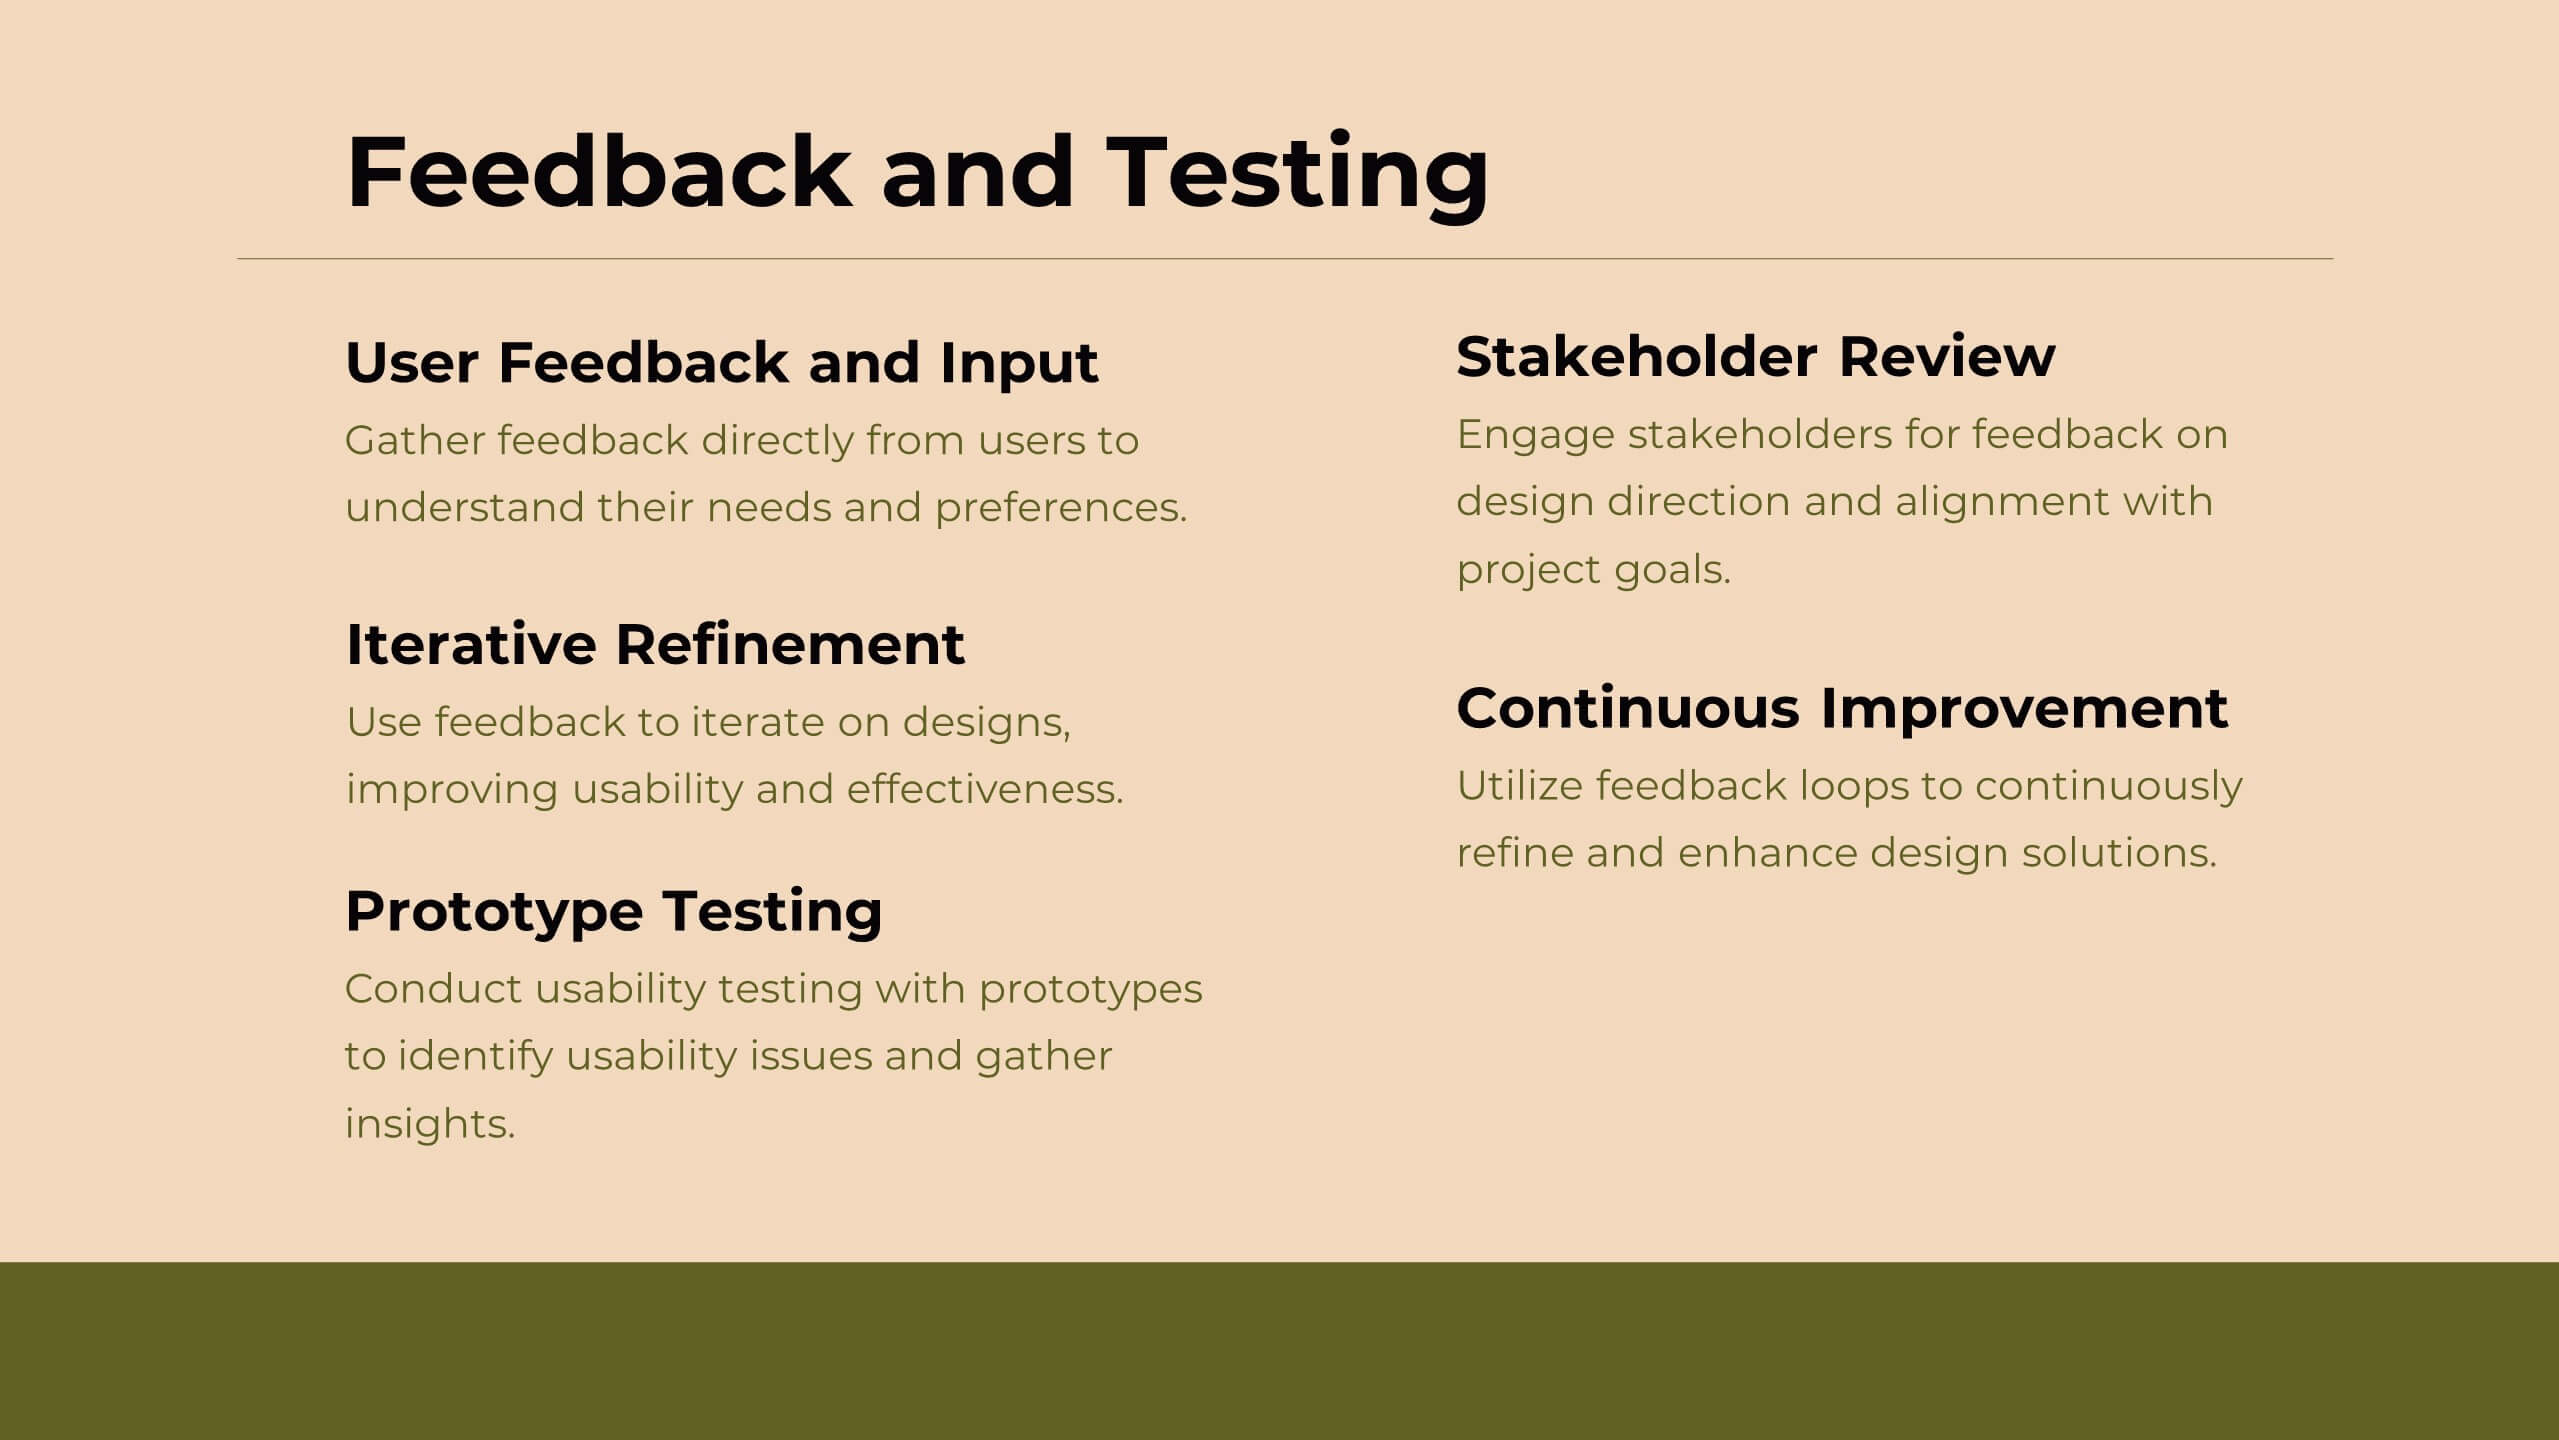
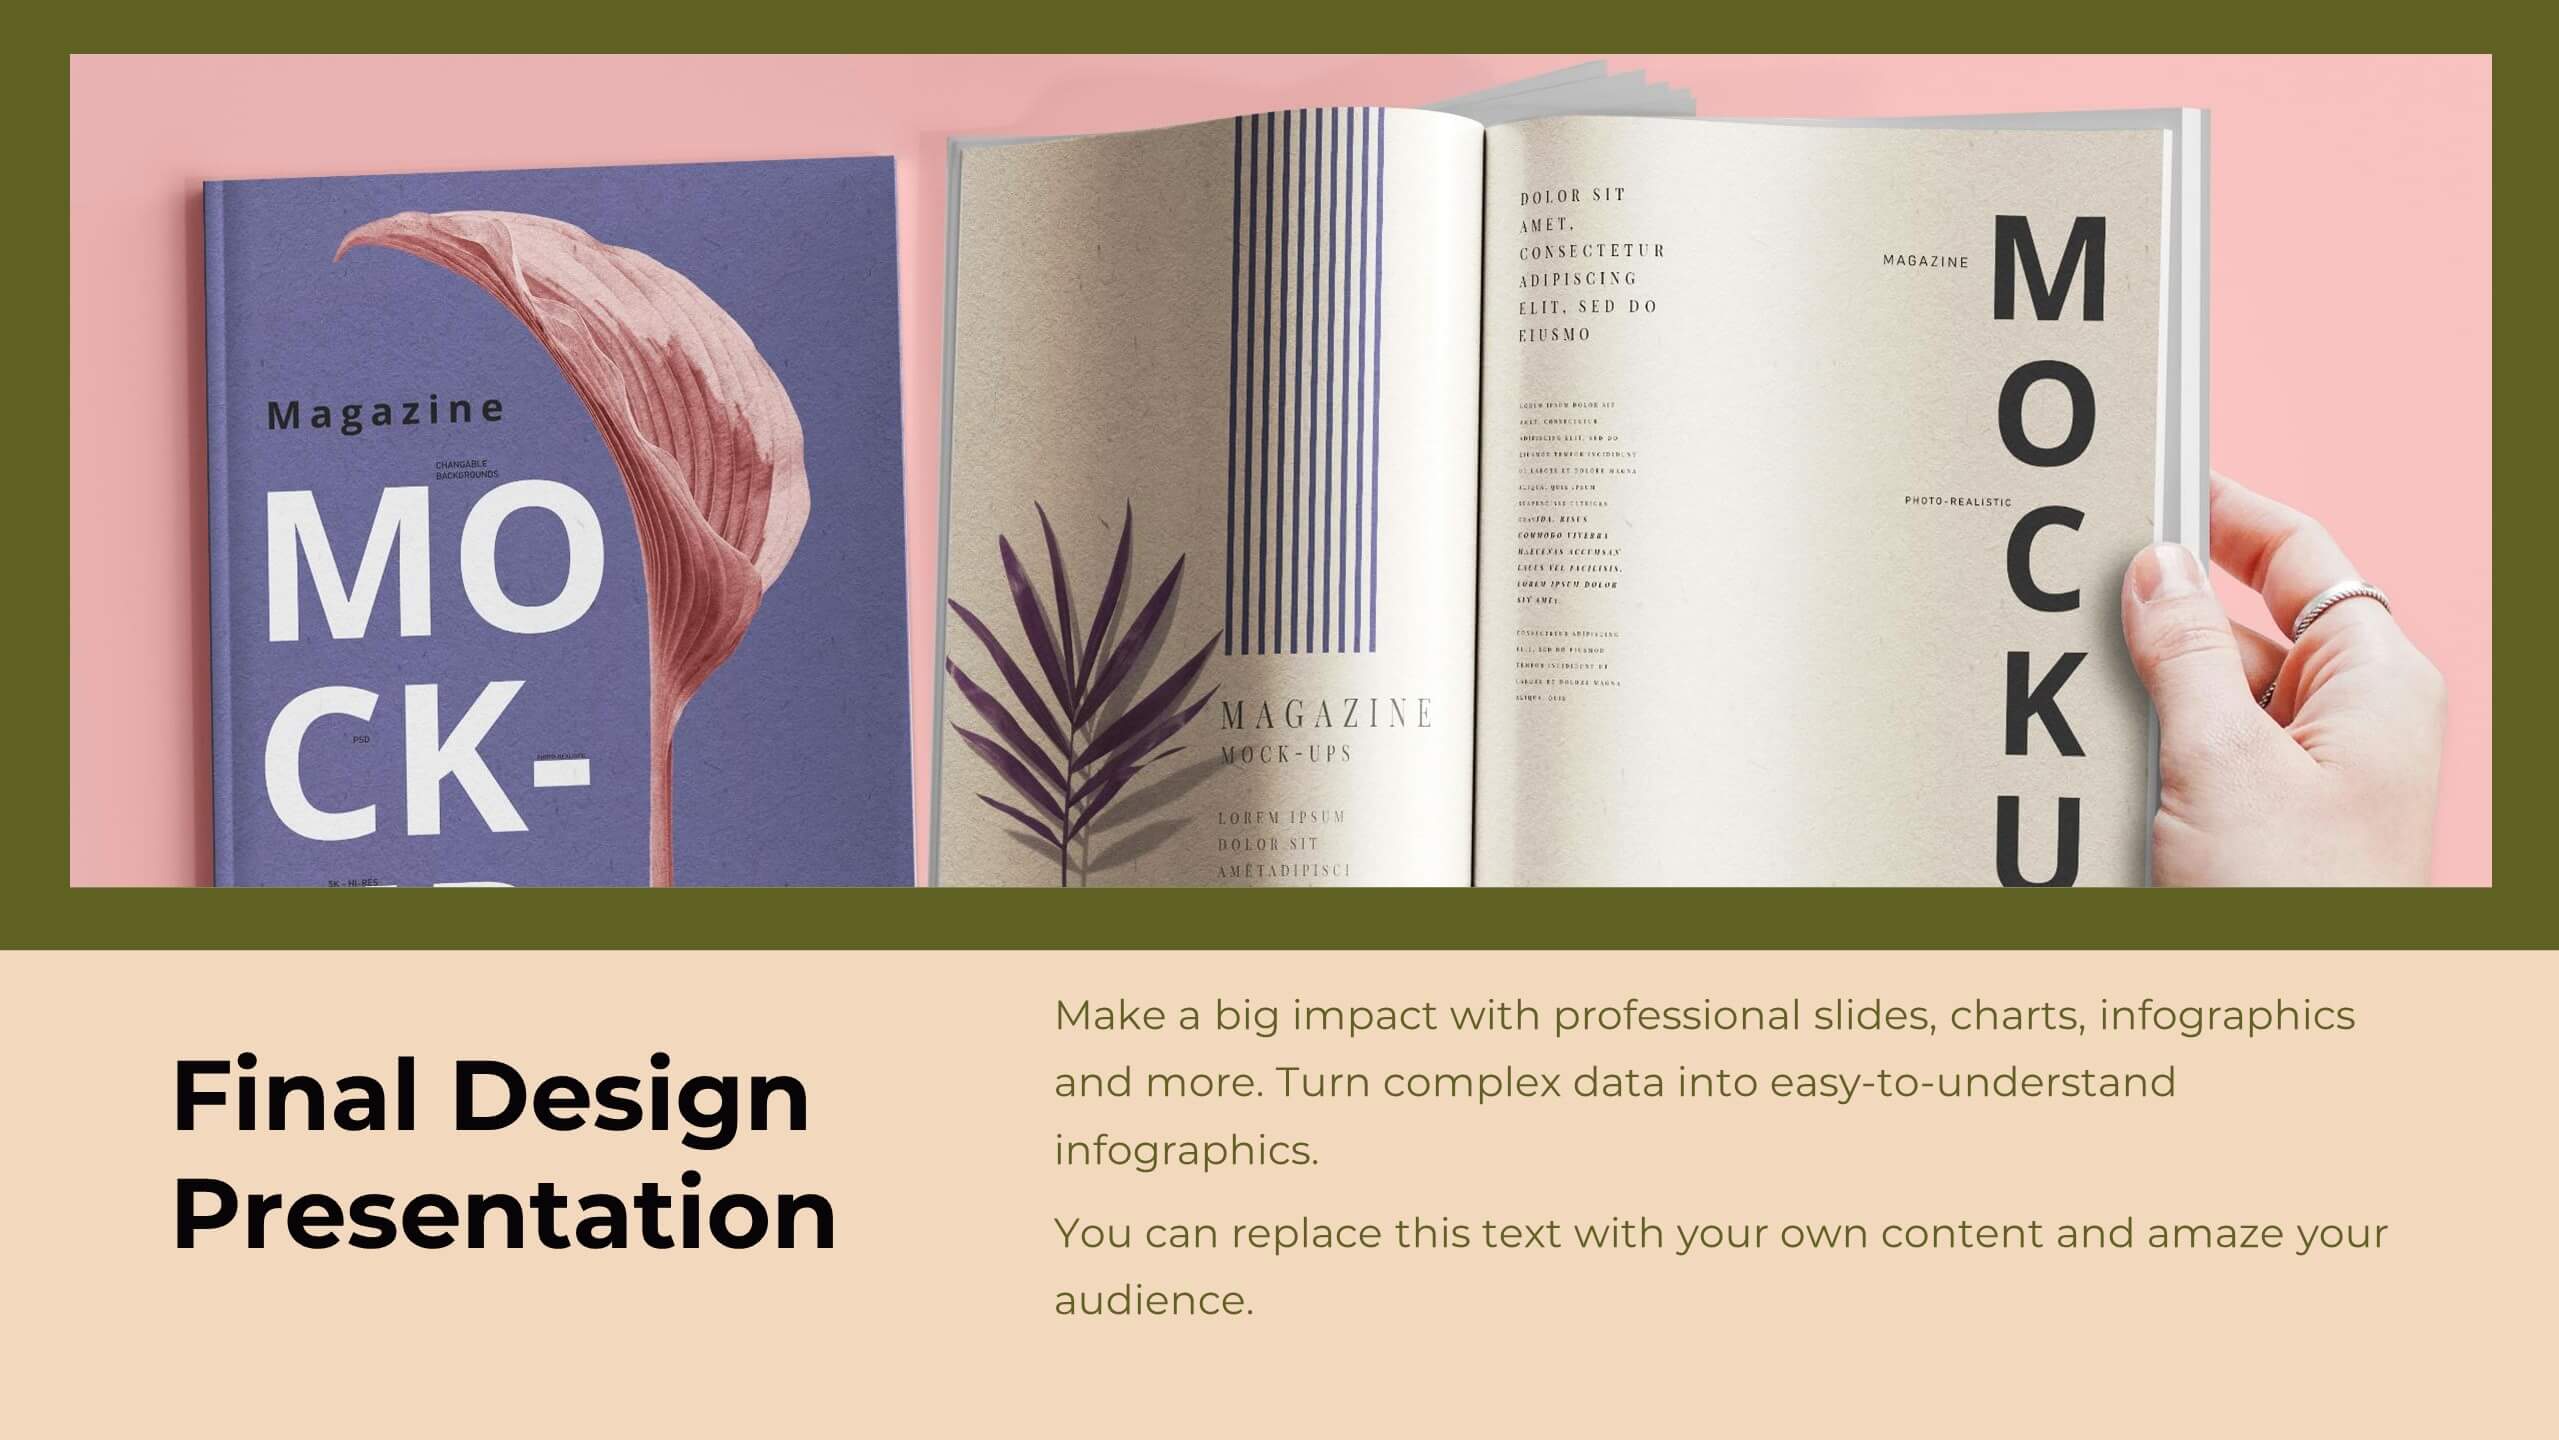
Delta Design Strategy Proposal Presentation
Transform your design strategy with this elegant proposal template! Perfect for presenting design briefs, target audience insights, and concept development. Ideal for designers and creative teams aiming to align vision and execution. Compatible with PowerPoint, Keynote, and Google Slides, this template ensures your design strategy is clear, professional, and compelling. Elevate your projects today!


10 diapositivas
Watercolor Texture Infographic
Watercolor texture refers to the visual and tactile effect created by the application of watercolor paint on paper or any other porous surface. This infographic template is a creative representation that incorporates watercolor textures and elements to convey information or data. This infographic is designed to engage viewers with its artistic and unique aesthetic while effectively presenting complex information in a simplified manner. This infographic features a white with watercolor background that sets the tone for the entire design. The soft, flowing, and colorful watercolor patterns create a visually appealing backdrop for the content.