


Características


¿Tienes alguna pregunta?
Recomendar


3 diapositivas
Transportation Services Workflow Presentation
Showcase your delivery process with clarity. This template tracks each transportation step—from port to truck to doorstep—with minimal, modern visuals and editable callouts. It’s perfect for workflow overviews, operations planning, or client onboarding. Use it in PowerPoint, Keynote, or Google Slides without losing style or structure.


5 diapositivas
Employee Training Needs Skills Gap Presentation
Optimize Workforce Training with a Skills Gap Analysis! The Employee Training Needs Skills Gap template helps HR teams, trainers, and managers visualize skill gaps, assess employee competencies, and align training programs with business goals. Featuring an interactive dot matrix layout, this template enables clear comparisons across skill areas, ensuring targeted and efficient upskilling strategies. Fully customizable in PowerPoint, Keynote, and Google Slides, it streamlines workforce development planning for maximum impact and growth.


6 diapositivas
Informational Data Table Overview Presentation
Present your tasks with clarity using this Informational Data Table Overview presentation. Perfect for team planning, status updates, or project management, this slide helps you organize tasks by name, due date, priority, and assignment. Visual indicators make it easy to track progress at a glance. Fully editable in PowerPoint, Canva, and Google Slides.


4 diapositivas
Step-by-Step Company Workflow Map Presentation
Visually track business processes with this step-by-step workflow map. Each stage is illustrated as a vertical bar, representing progression and task hierarchy. Ideal for project managers, operations teams, and onboarding sessions. Fully editable in PowerPoint, Keynote, and Google Slides for quick customization of labels, icons, and stage descriptions to fit your goals.


6 diapositivas
Creative Cycle Diagram Presentation
Illustrate processes and workflows effectively with this Creative Cycle Diagram. Designed for business, strategy, and creative projects, this fully editable diagram helps visualize cyclical processes with clarity. Customize text, colors, and elements to align with your brand. Compatible with PowerPoint, Keynote, and Google Slides for seamless integration.


4 diapositivas
Future-Focused Business Vision Planning Presentation
Plan ahead with clarity using the Future-Focused Business Vision Planning infographic. This 4-step layout helps you outline long-term goals, strategic milestones, and action points in a visually structured format. Perfect for business roadmaps, planning decks, and executive briefings. Fully editable in Canva, PowerPoint, and Google Slides.


6 diapositivas
Innovation Pipeline and Idea Execution
Streamline your innovation process with the Innovation Pipeline and Idea Execution Presentation. This clean, layered funnel layout is ideal for visualizing each stage from idea generation to implementation. Perfect for R&D teams, product managers, or corporate strategists, this slide is fully editable in PowerPoint, Keynote, and Google Slides.


8 diapositivas
Cycle of Continuous Improvement Deck Presentation
Highlight iterative progress and strategic refinement with the Cycle of Continuous Improvement Deck. This template is ideal for quality management, agile planning, or operational excellence sessions. Fully editable and visually dynamic, it presents circular workflows in clean layouts. Compatible with PowerPoint, Keynote, and Google Slides—great for teams and consultants.


4 diapositivas
Modern 3D Business Diagram Presentation
Bring your metrics to life with this sleek 3D chart that adds instant dimension to any business presentation. Designed to visualize comparisons or progress across three data sets, this diagram helps you communicate clearly without overloading the slide. Fully compatible with PowerPoint, Keynote, and Google Slides for a seamless workflow.


5 diapositivas
Multi-Step Procedure and Execution Flow Presentation
Visualize complex processes with clarity using the Multi-Step Procedure and Execution Flow Presentation. Ideal for SOPs, task breakdowns, or team workflows, this layout helps you present sequential actions, decision points, and outcomes with a clean, structured flow. Fully editable in PowerPoint, Canva, and Google Slides.


22 diapositivas
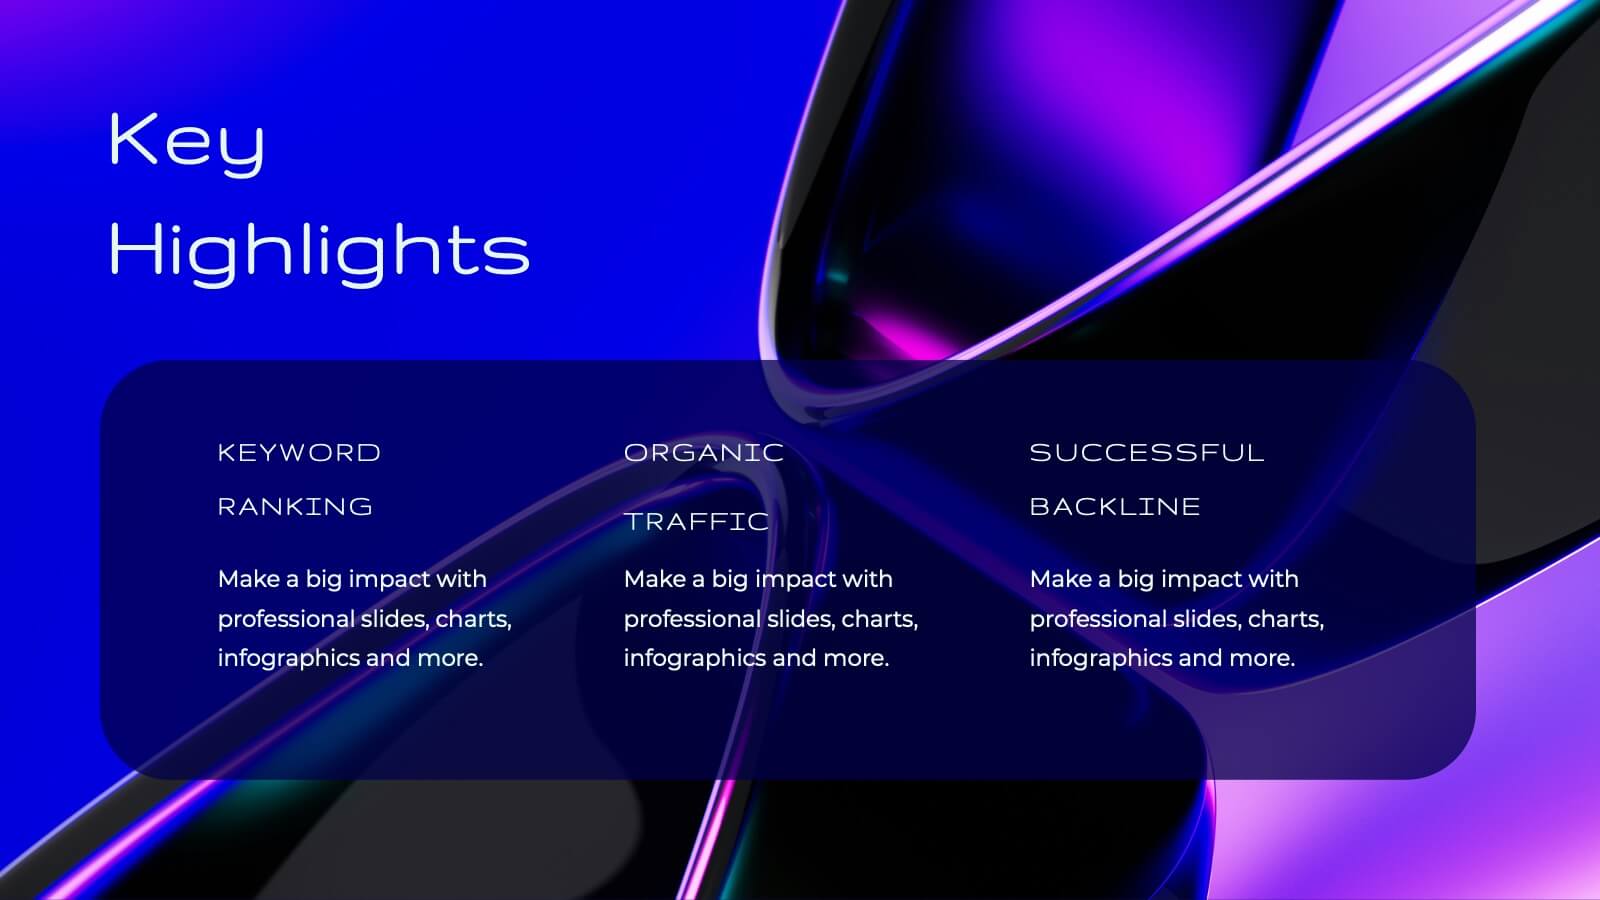
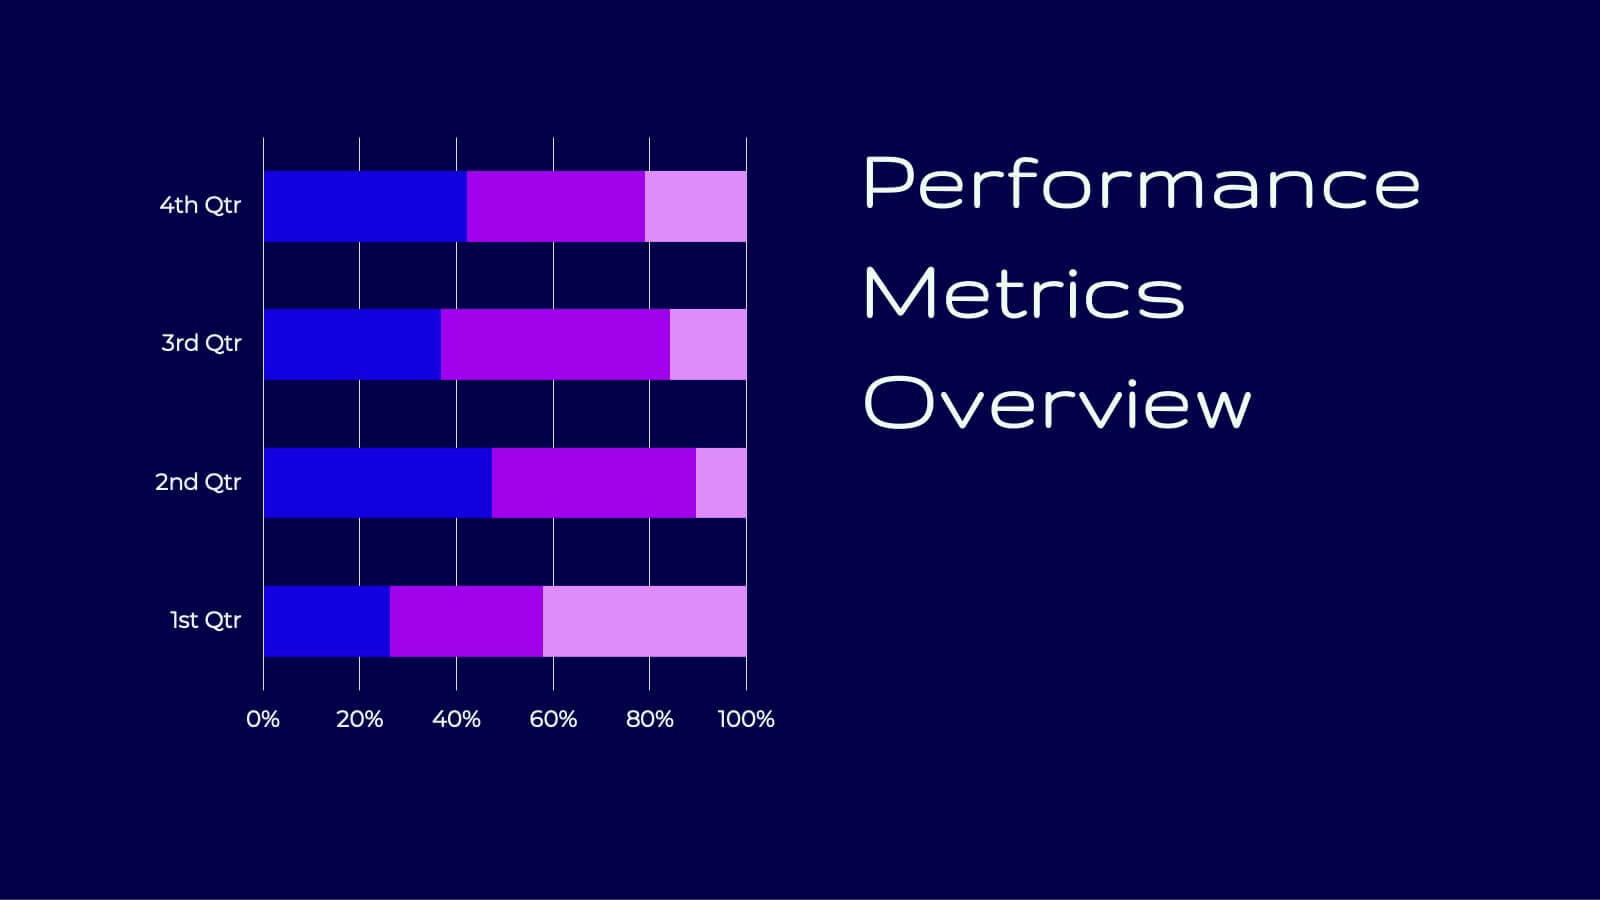
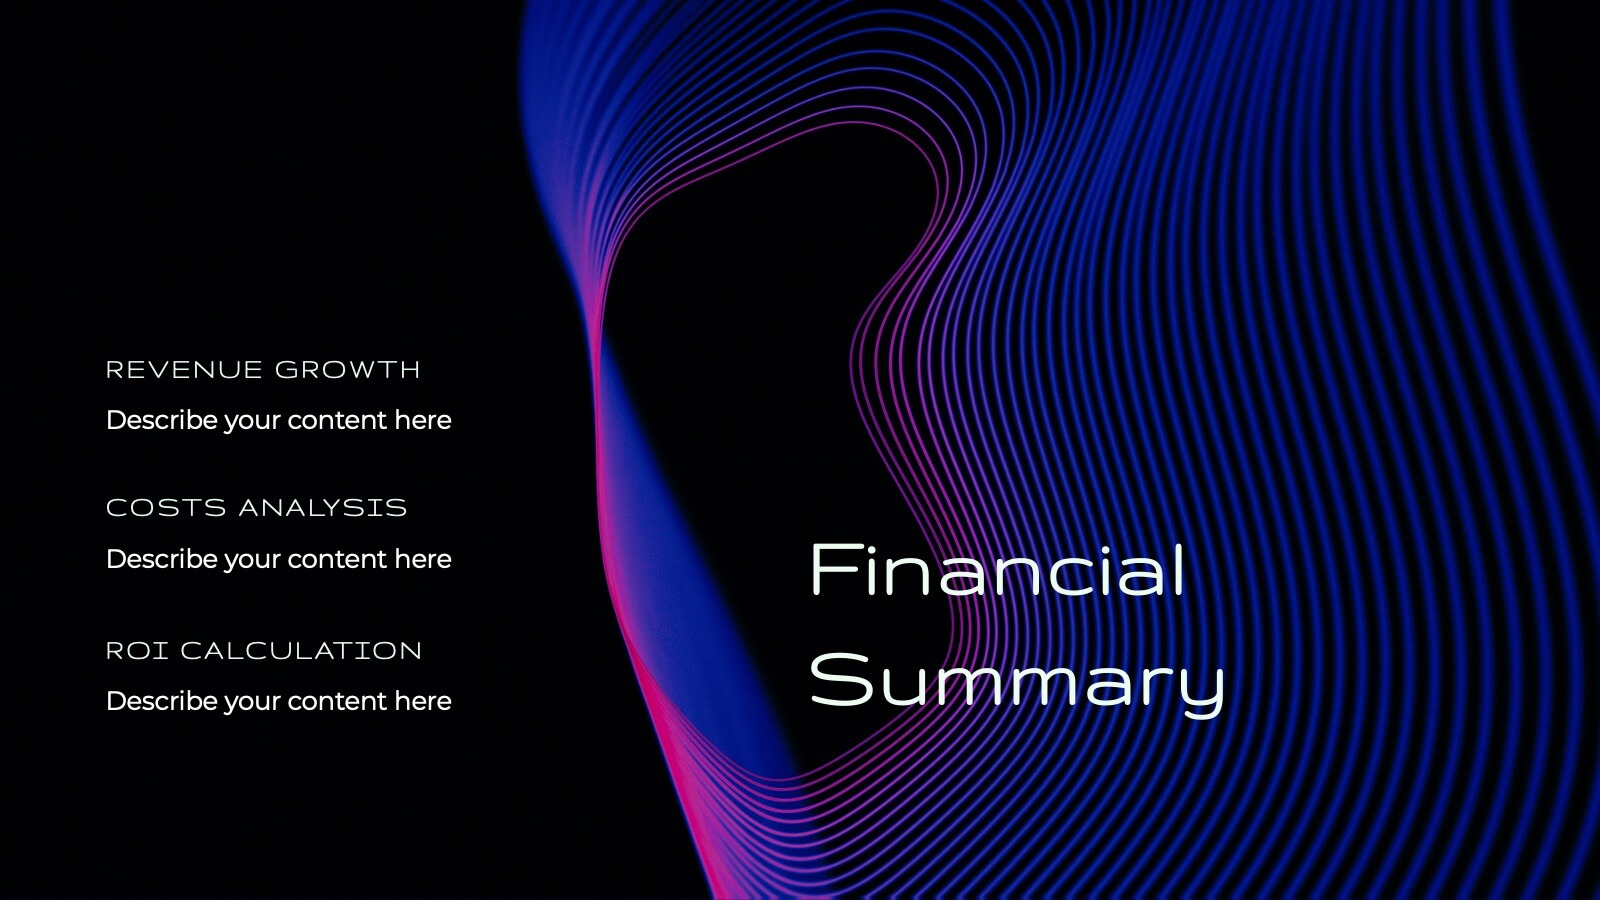
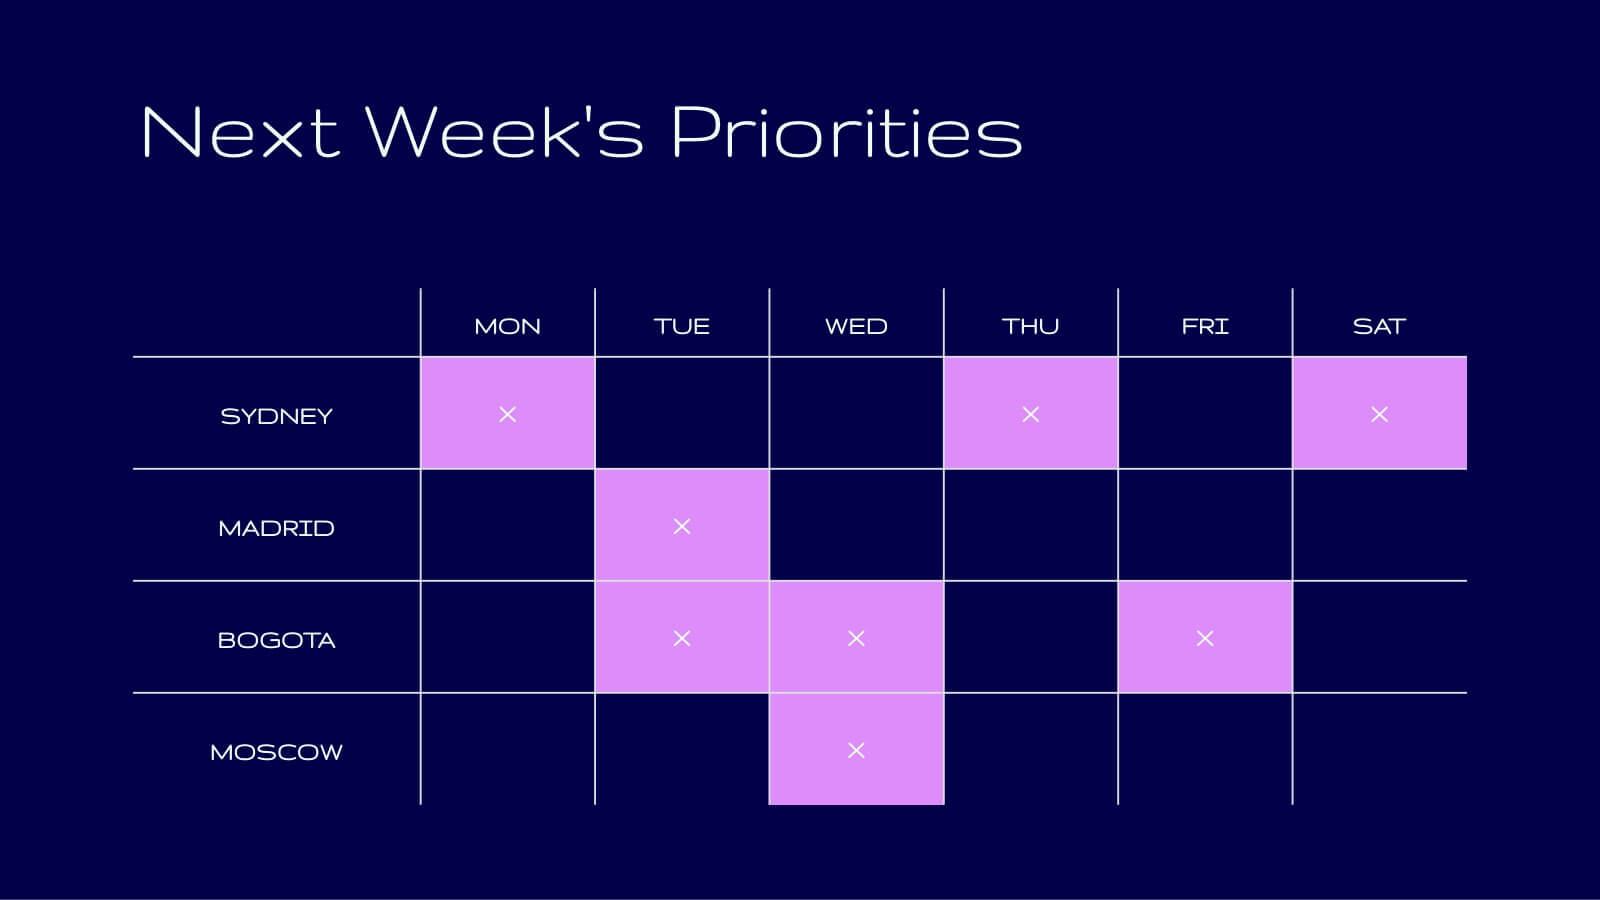
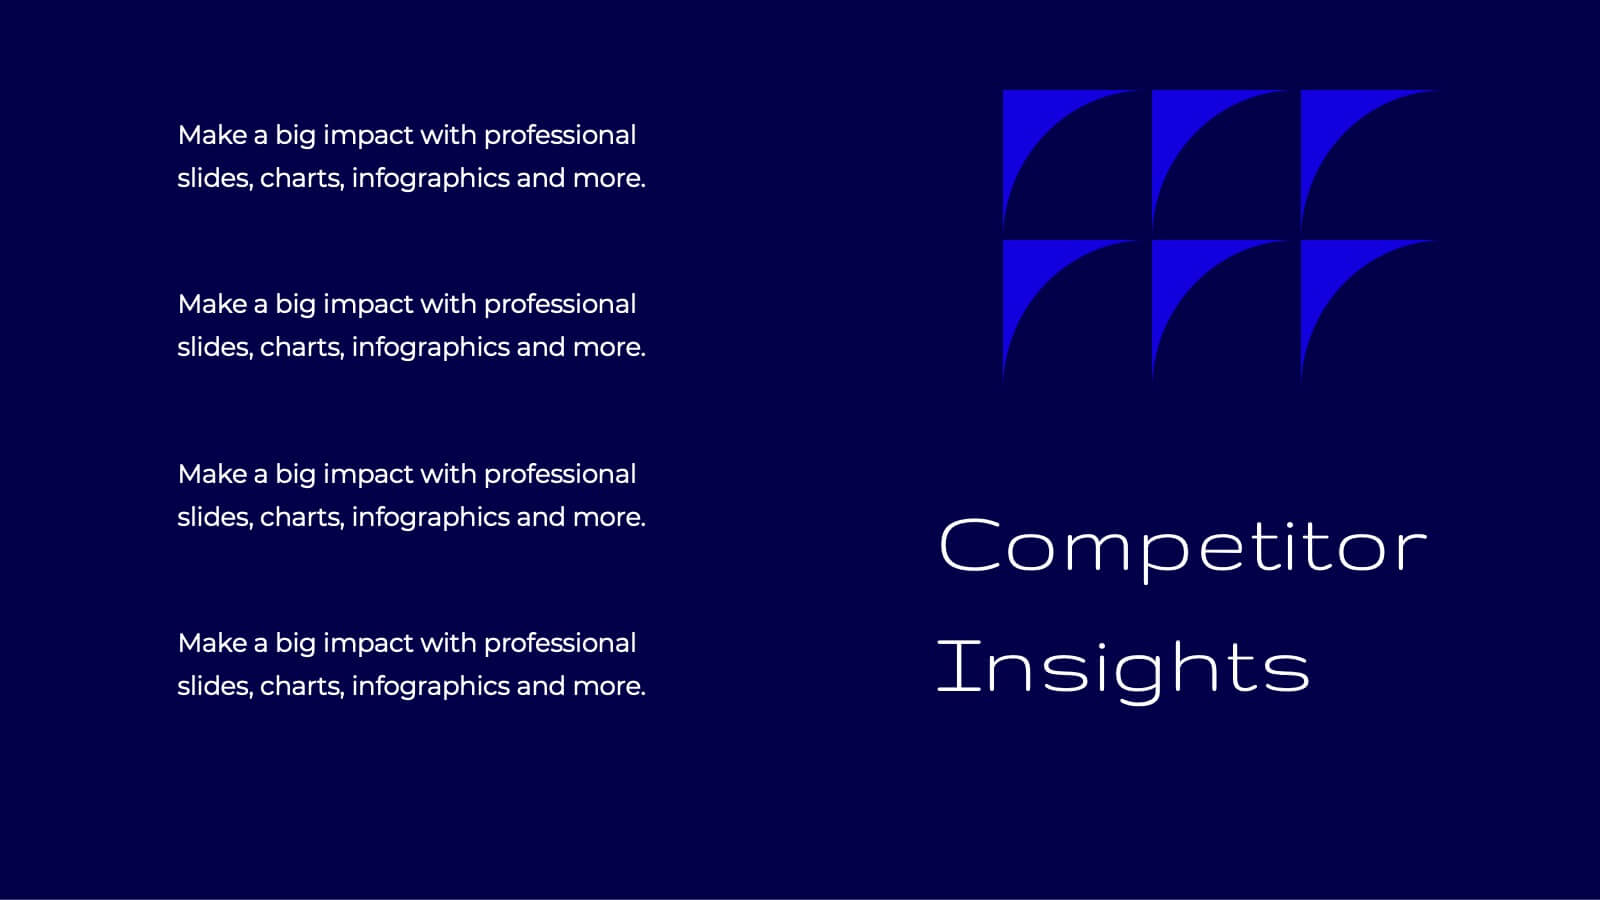
Tidal Research Findings Report Presentation
Deliver your research findings with impact using this sleek and modern report template! It covers key highlights, performance metrics, project progress, and competitor insights, making it ideal for clear, professional presentations. Perfect for summarizing challenges, solutions, and strategic initiatives. Compatible with PowerPoint, Keynote, and Google Slides for seamless reporting.


5 diapositivas
Nutrition Facts Infographics
Nutrition facts provide important information about the nutritional content of food and beverages. This helps individuals make informed decisions about their dietary choices and understand the impact of food on their health. These infographic templates are designed to present essential information about nutrition and healthy eating habits. These infographics are suitable for nutritionists, dietitians, health educators, or anyone looking to communicate key facts and guidelines about nutrition in a clear and engaging manner. Compatible with Powerpoint, Keynote, and Google Slides, these are fully customizable.


4 diapositivas
KPI and Business Performance Dashboard
Drive strategic insights with this sleek KPI and business dashboard template. Highlight key metrics, trends, and performance results using easy-to-read graphs and organized data sections. Perfect for management reports, executive summaries, and project tracking. Fully editable in PowerPoint, Keynote, and Google Slides.


5 diapositivas
Cyber Security Best Practices Infographics
Navigate the digital landscape safely with our cyber security best practices infographics. Crafted in a striking combination of black with colorful accents, this creative, vertical template is a powerhouse of cyber safety education. It's an indispensable resource for IT professionals, and educators seeking to propagate security protocols. The design encapsulates compelling graphics, intuitive icons, and dedicated placeholders. Compatible with Powerpoint, Keynote, and Google Slides. By employing this infographic, users can foster a culture of digital vigilance and defense, making it an asset in the fight against online threats.


10 diapositivas
Six Sigma Process Improvement
Visualize each stage of the Six Sigma DMAIC methodology—Define, Measure, Analyze, Improve, and Control—with this circular diagram layout. Perfect for quality control meetings, workflow optimization, and training sessions. Fully customizable in PowerPoint, Keynote, and Google Slides.


21 diapositivas
Kinetic Startup Funding Proposal Presentation
Get ready to impress potential investors with the Kinetic Startup Funding Proposal template! This dynamic and modern template is designed to help you present your startup's vision, mission, and growth potential in the most compelling way possible. From introducing your team and services to highlighting your unique value proposition and business model, every slide is crafted to showcase your startup's strengths. The template includes sections for market analysis, customer needs, and pain points, ensuring your presentation is data-driven and focused on solving real problems. With slides dedicated to your marketing strategy, sales channels, and financial overview, you can provide a comprehensive plan for success. The sleek design, combined with easy-to-edit slides, allows you to customize the presentation to reflect your startup's brand identity. Whether you're pitching to angel investors or venture capitalists, the Kinetic Startup Funding Proposal template will help you stand out and secure the funding you need. Compatible with PowerPoint, Keynote, and Google Slides, this template is your key to delivering a winning pitch.


6 diapositivas
IT Architecture Enterprise Infographics
Gain insights into Enterprise IT Architecture with our customizable infographic template. This template is fully compatible with popular presentation software like PowerPoint, Keynote, and Google Slides, allowing you to easily customize it to illustrate and communicate various aspects of enterprise IT architecture. The Enterprise IT Architecture infographic template offers a visually engaging platform to explore and explain the architectural components, frameworks, and strategies used in large organizations. Whether you're an IT professional, business leader, or simply interested in enterprise technology, this template provides a user-friendly canvas to create informative presentations and educational materials. Enhance your knowledge of Enterprise IT Architecture with this SEO-optimized infographic template, thoughtfully designed for clarity and ease of use. Customize it to highlight key principles, architectural layers, integration strategies, and best practices, ensuring that your audience gains a comprehensive understanding of this critical field. Start crafting your personalized infographic today to delve into the world of Enterprise IT Architecture.