


Características


¿Tienes alguna pregunta?
Recomendar


2 diapositivas
Stylish Title Cover Presentation for Reports Presentation
Set the tone with a title slide that means business—without being boring. This stylish cover layout gives your report presentations a polished, modern look while keeping the focus clear and professional. Ideal for executive updates or client-facing decks, it’s fully editable and works perfectly in PowerPoint, Keynote, and Google Slides.


21 diapositivas
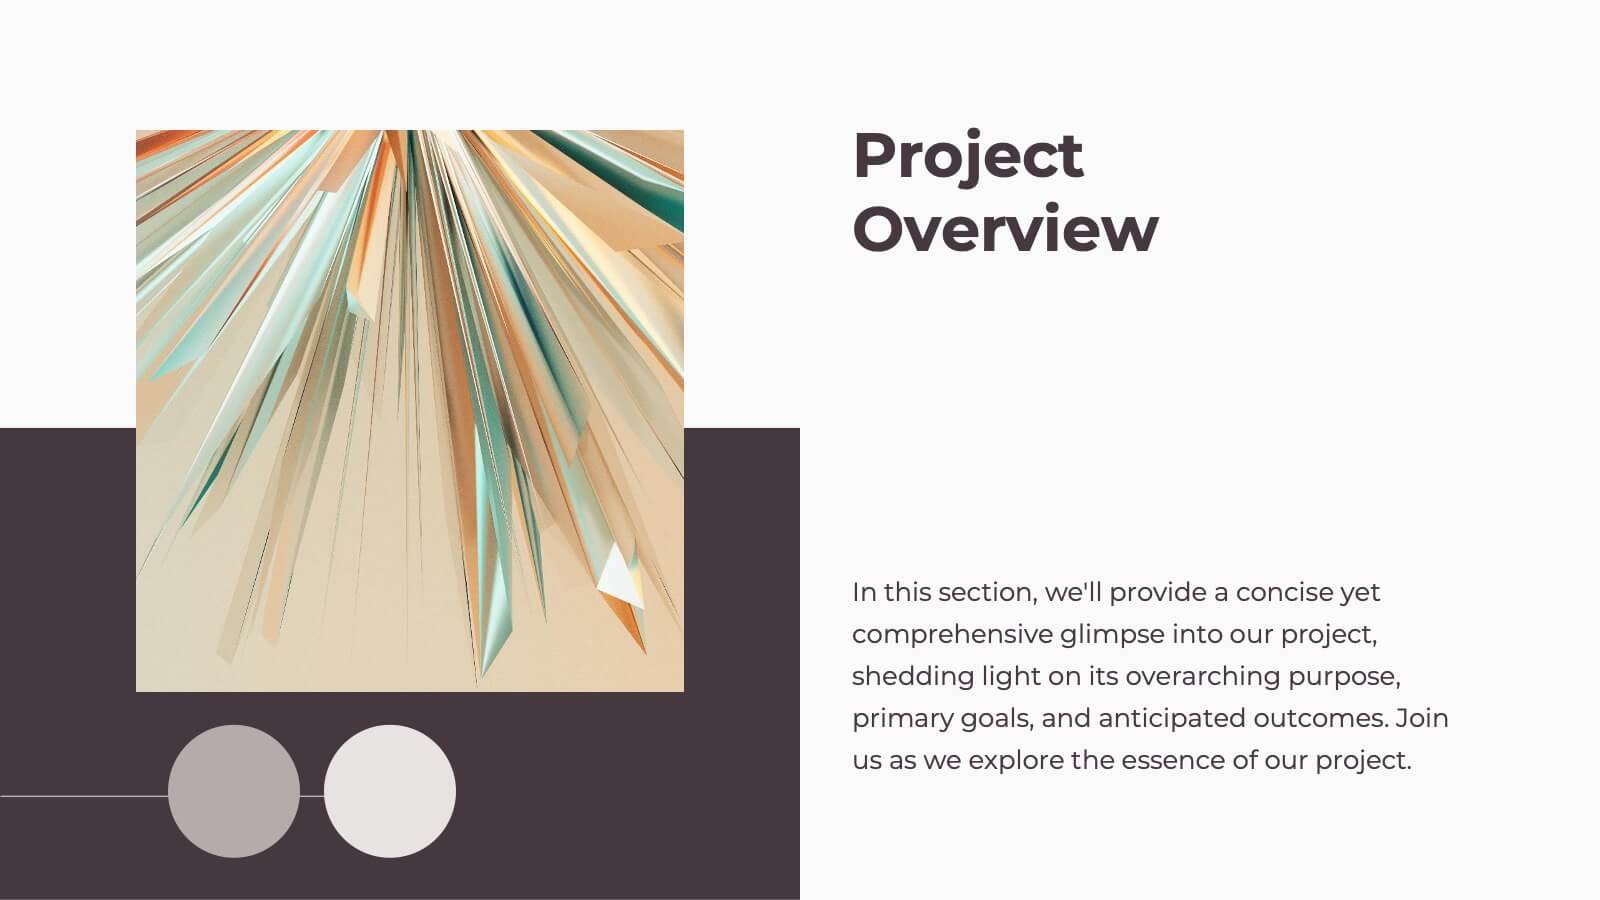
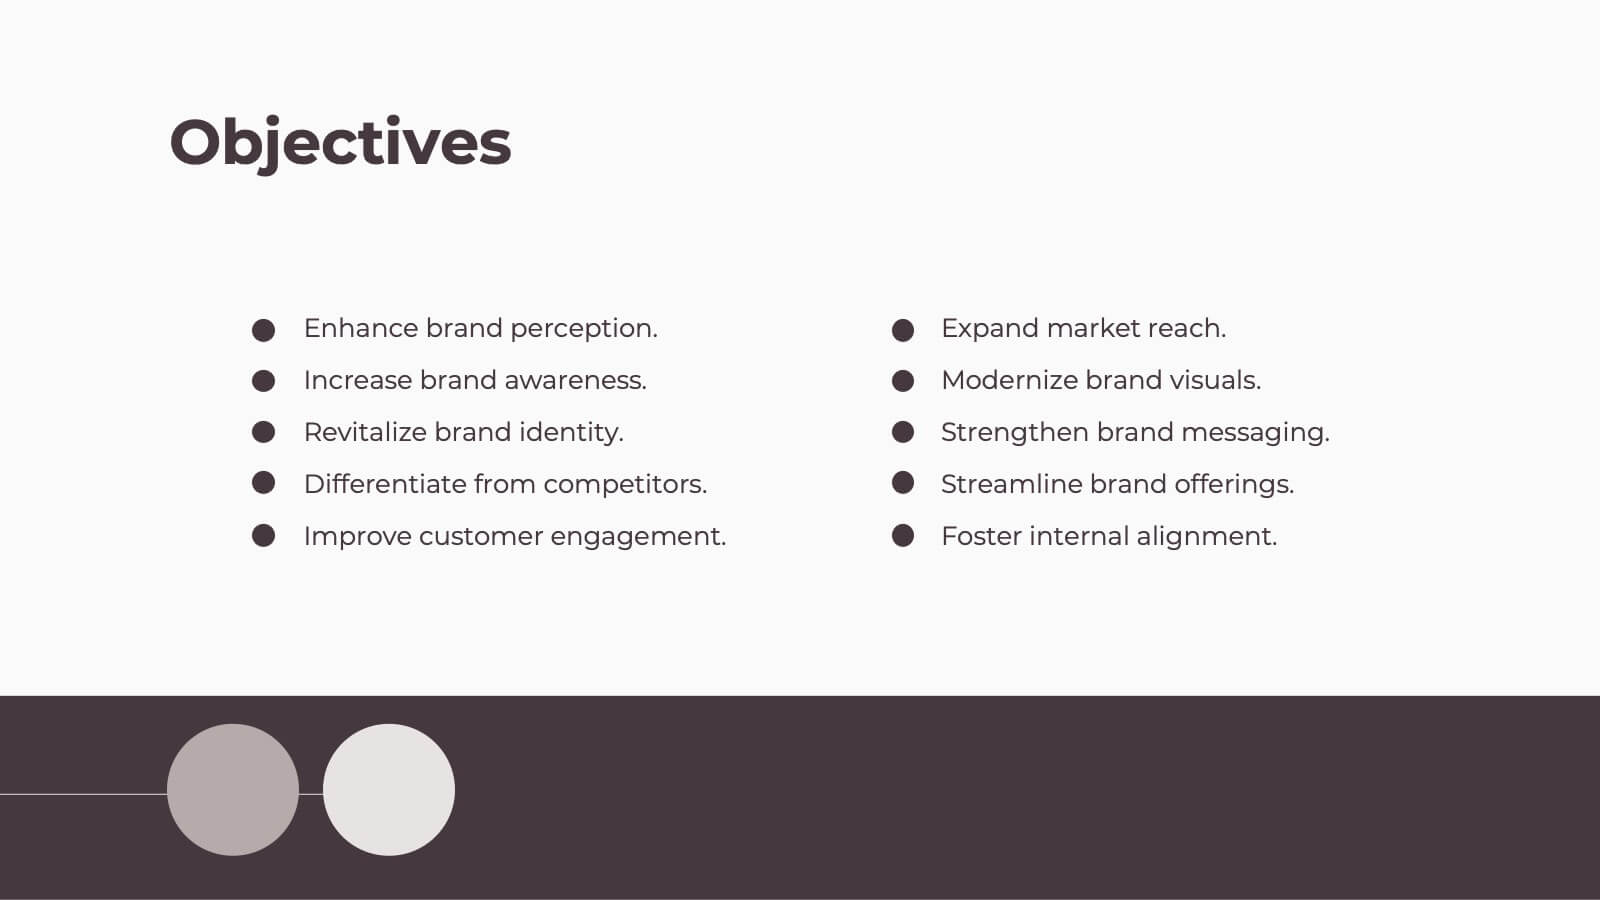
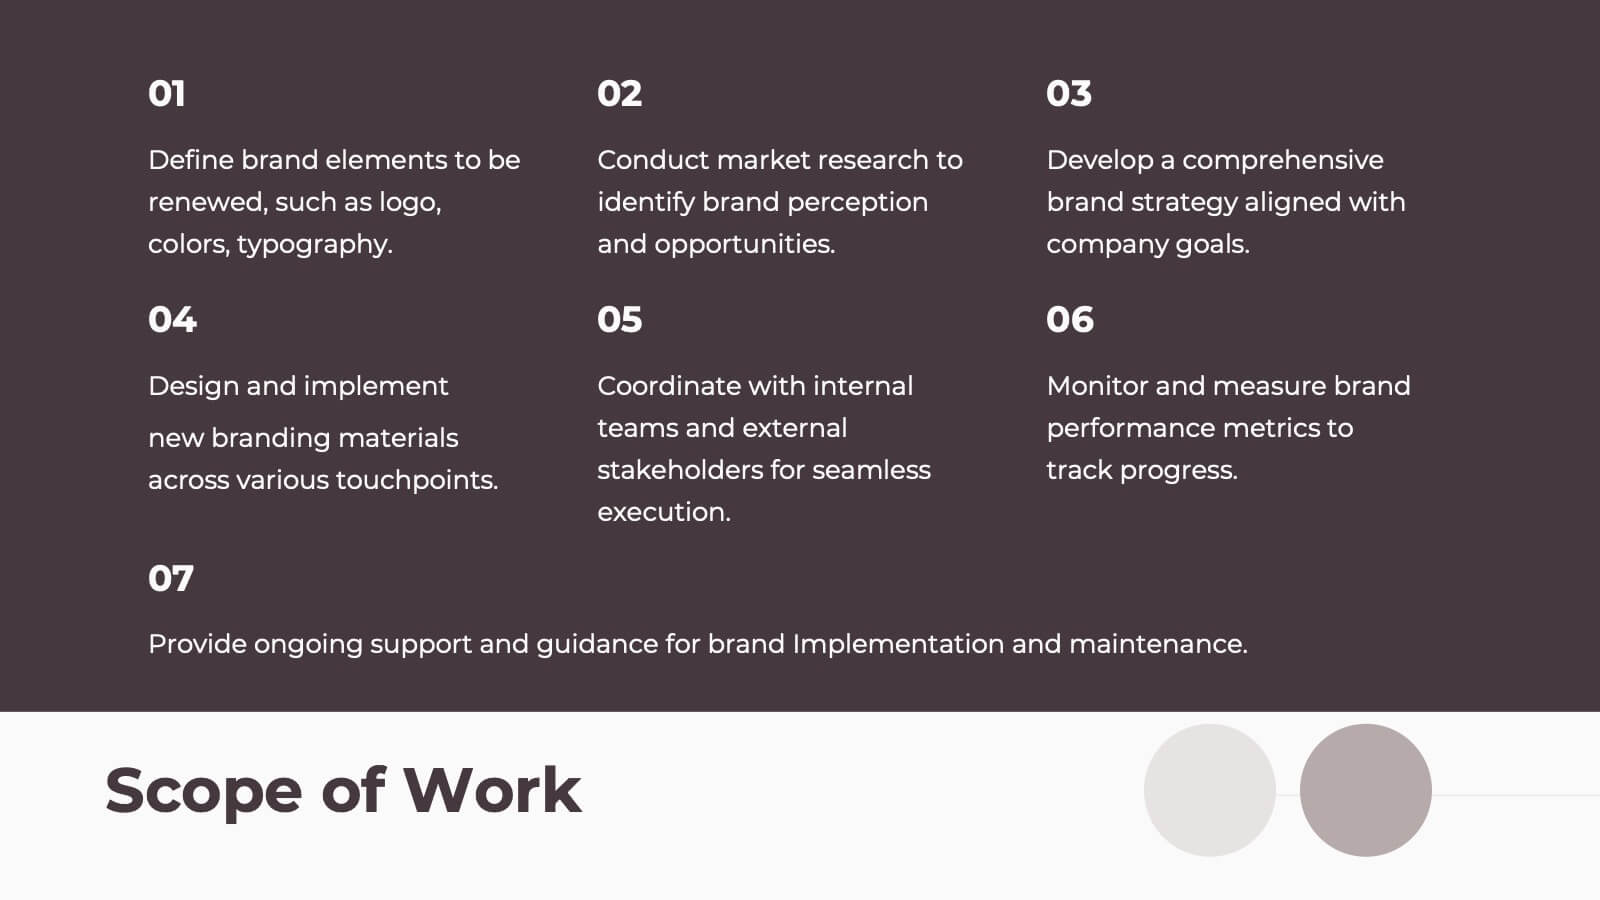
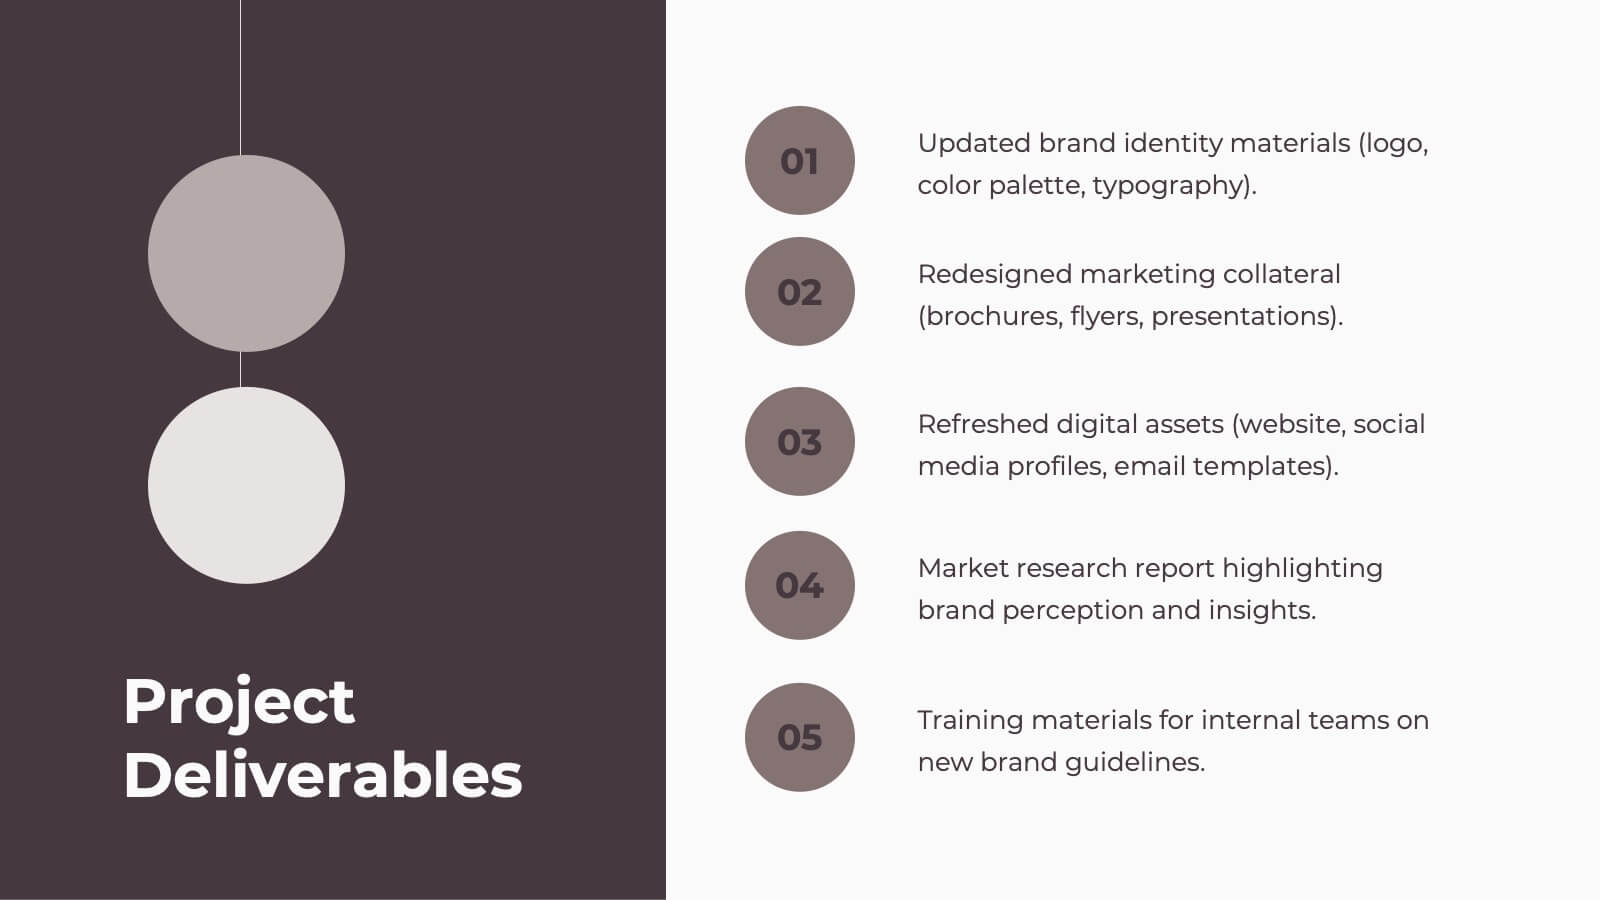
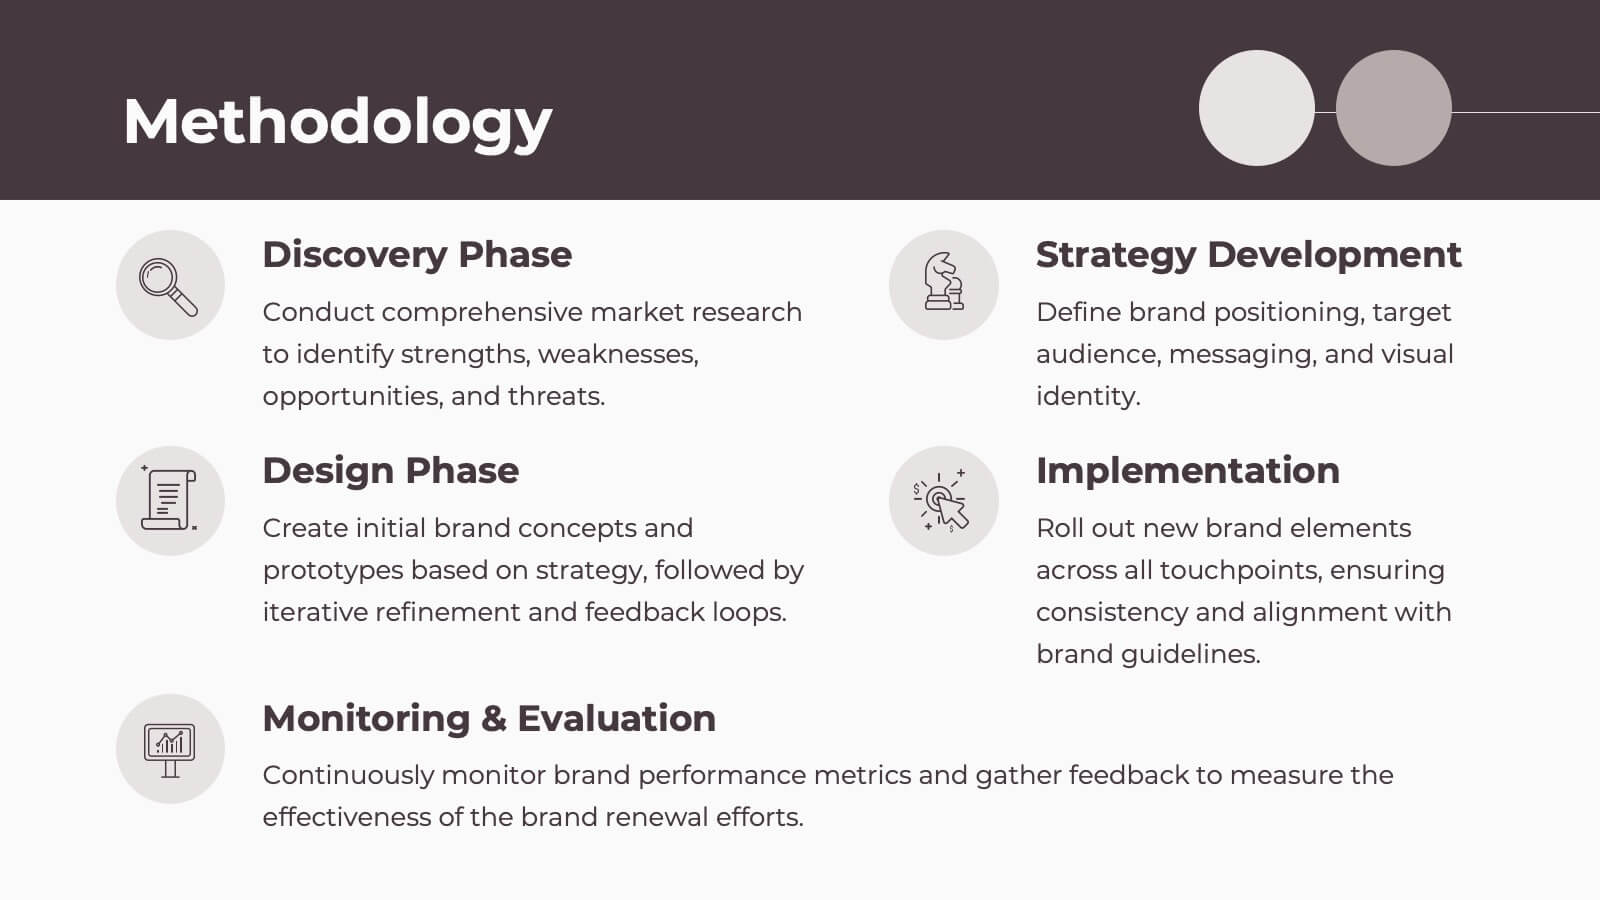
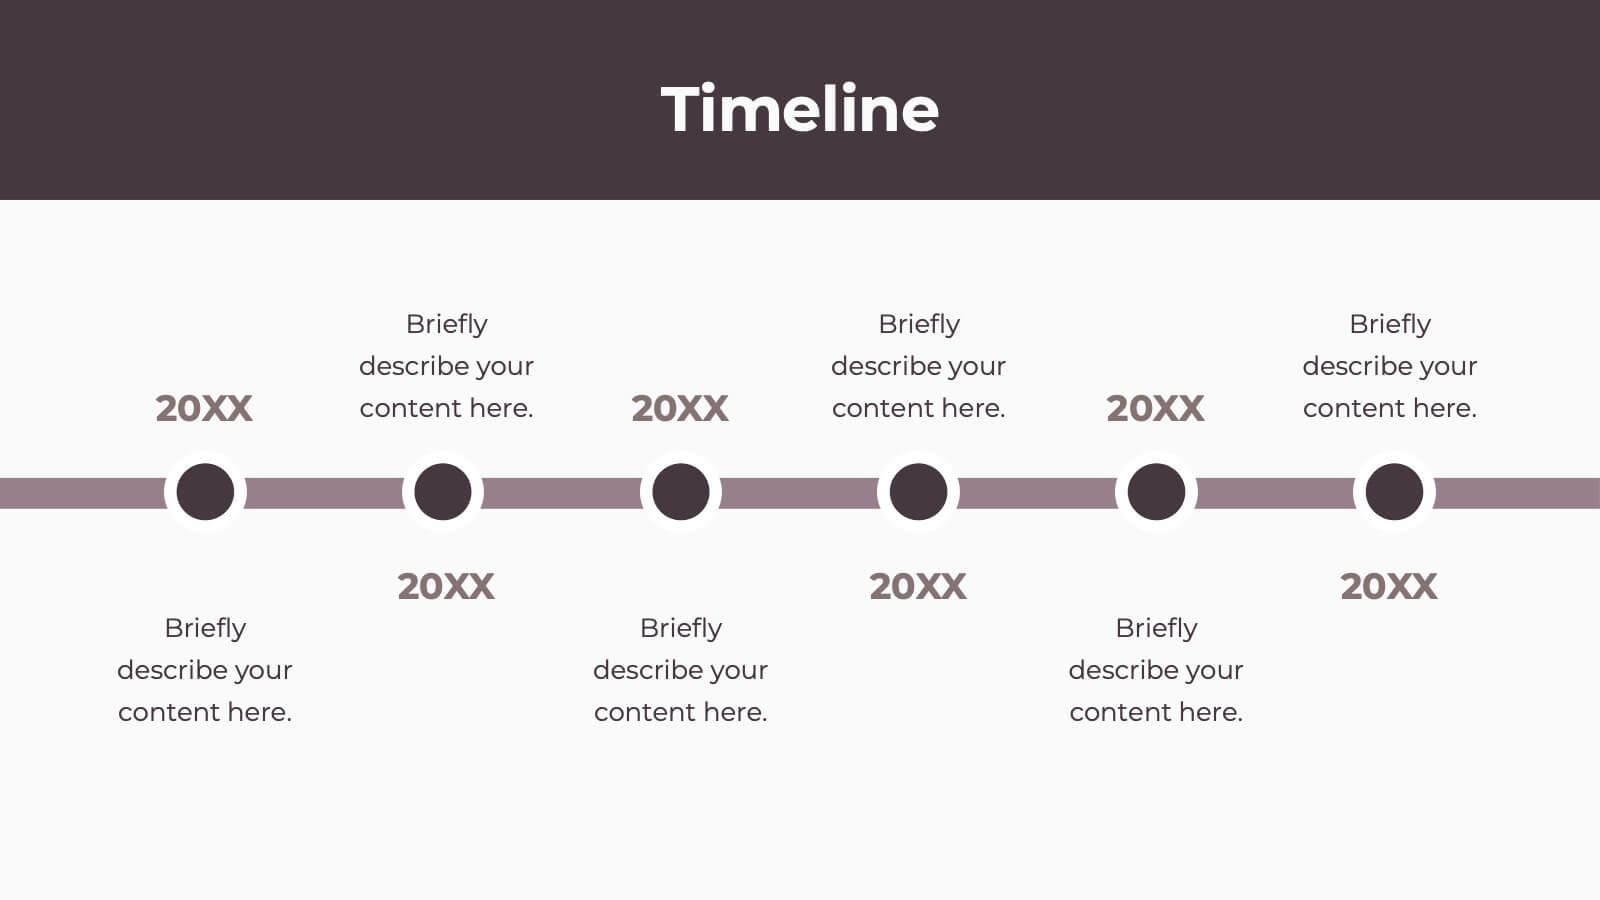
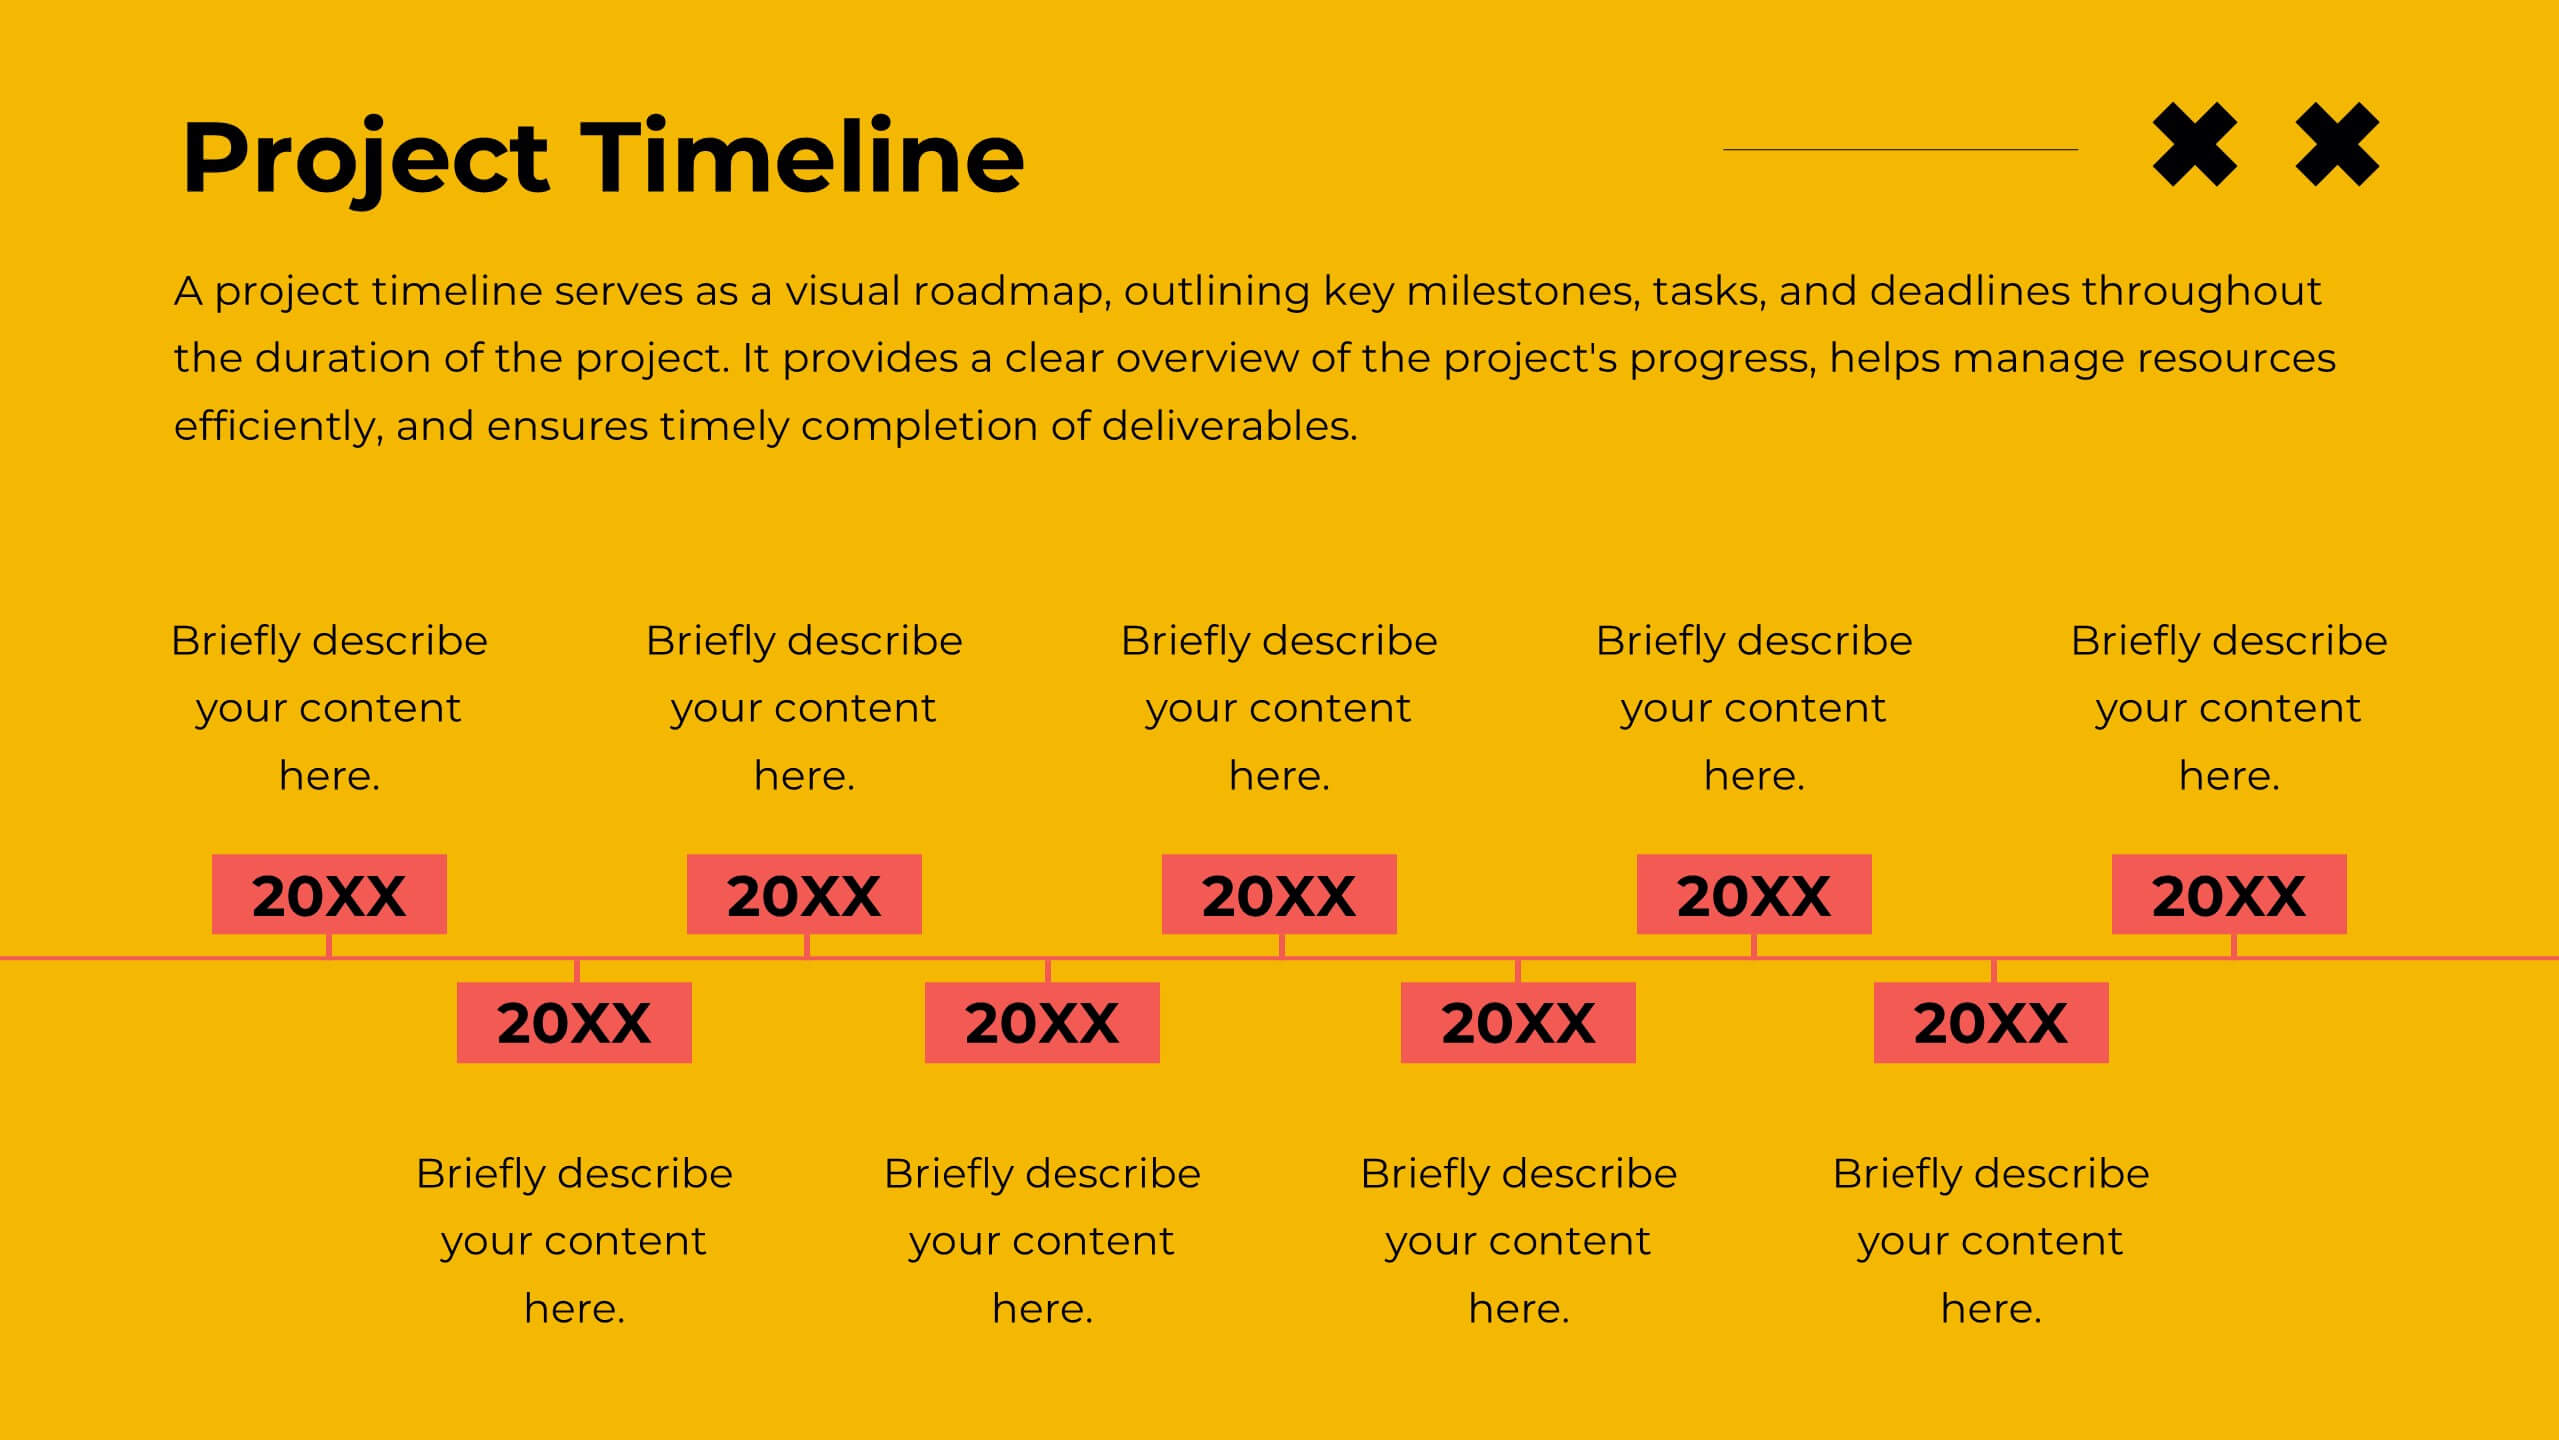
Spectrum Project Timeline Presentation
Plan and execute your projects with precision using this detailed project plan template! Perfect for outlining objectives, timelines, and resource allocation. Ideal for project managers and teams aiming to ensure successful project delivery. Compatible with PowerPoint, Keynote, and Google Slides, this template keeps your project organized, clear, and on track. Ensure project success!


21 diapositivas
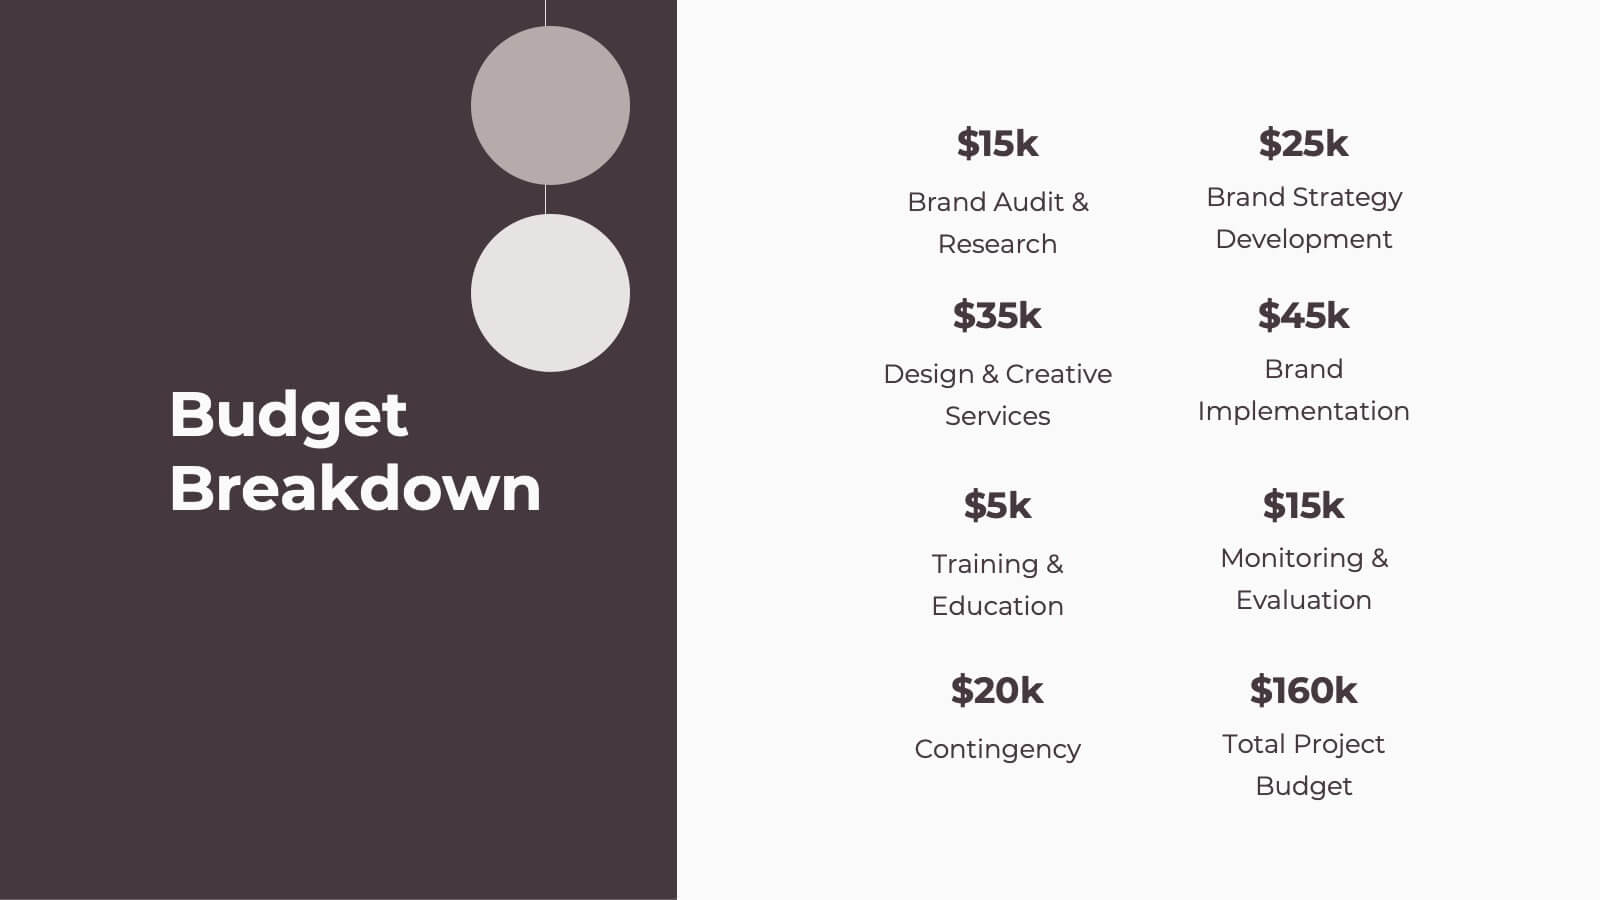
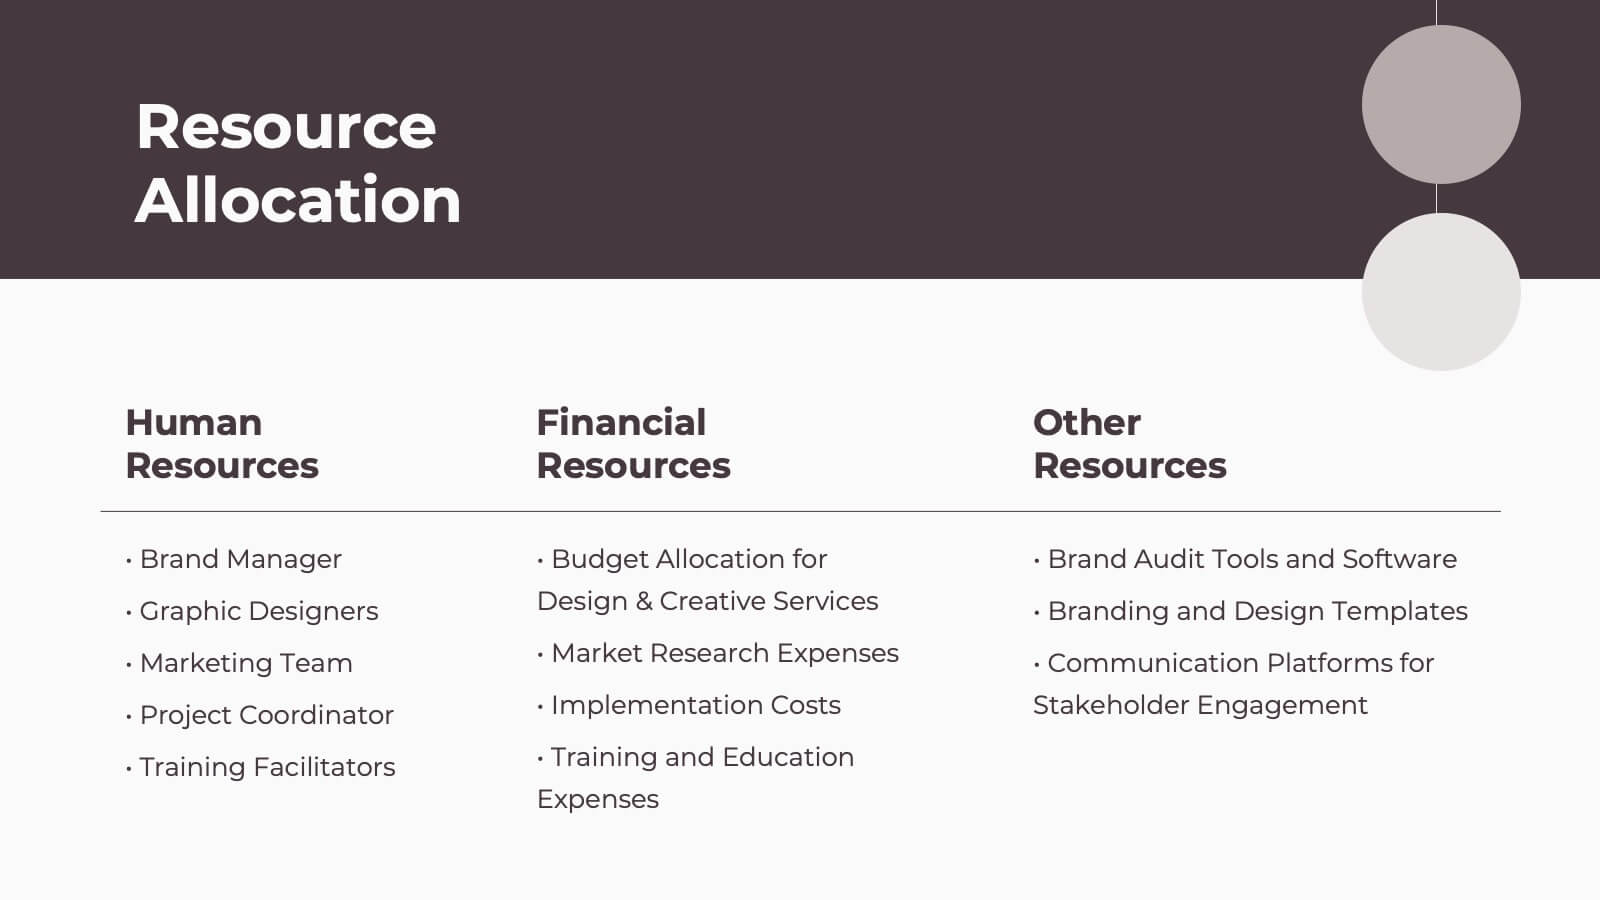
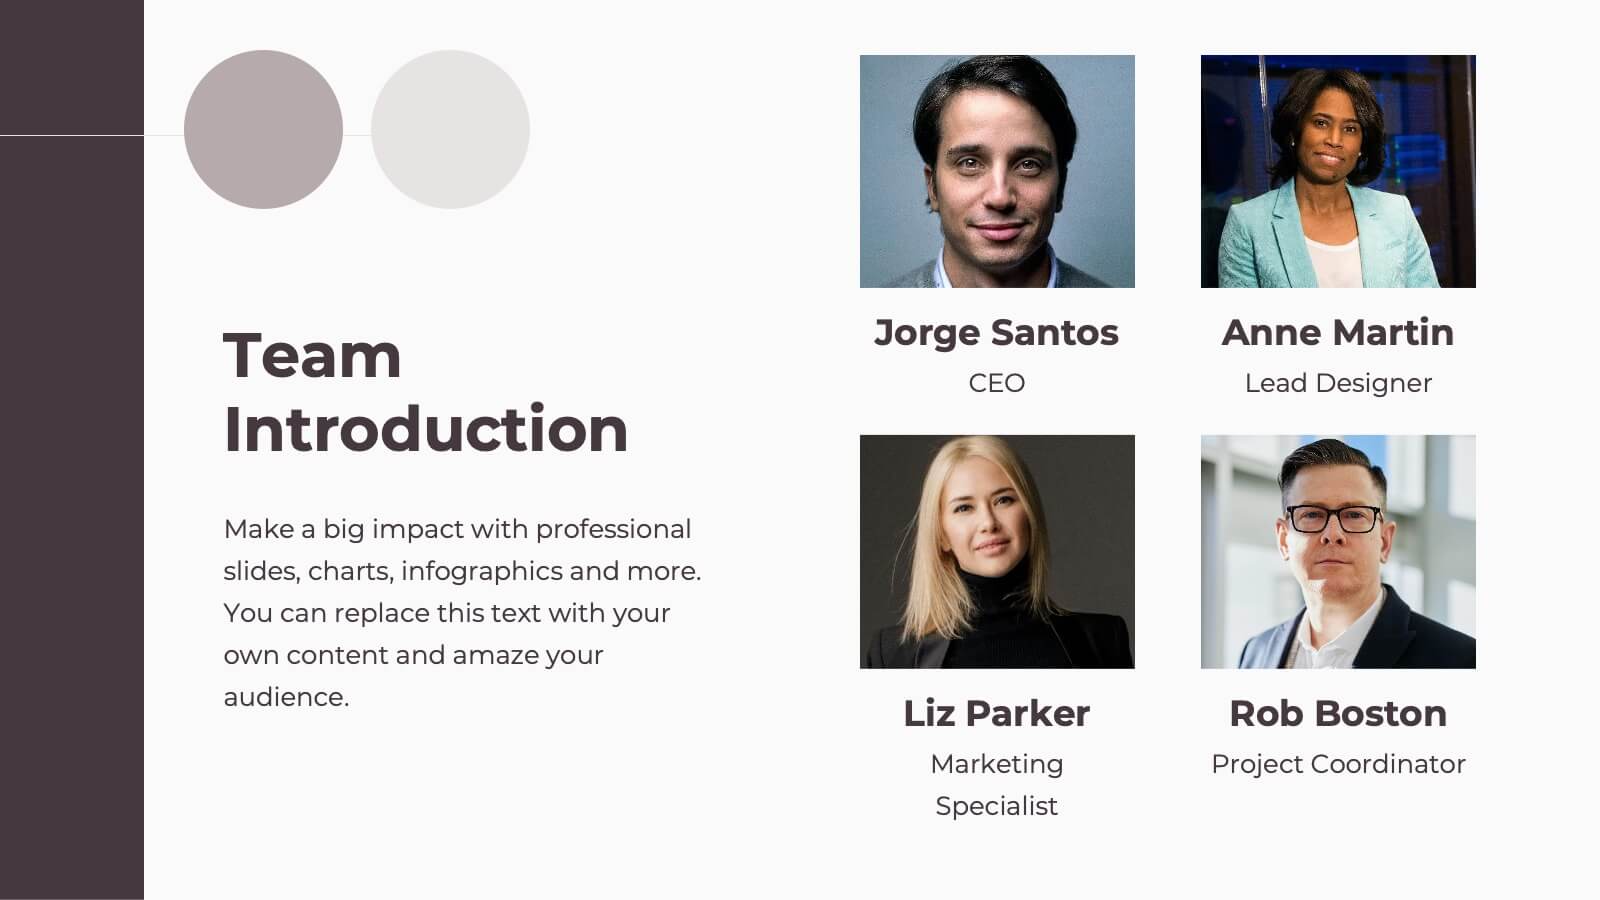
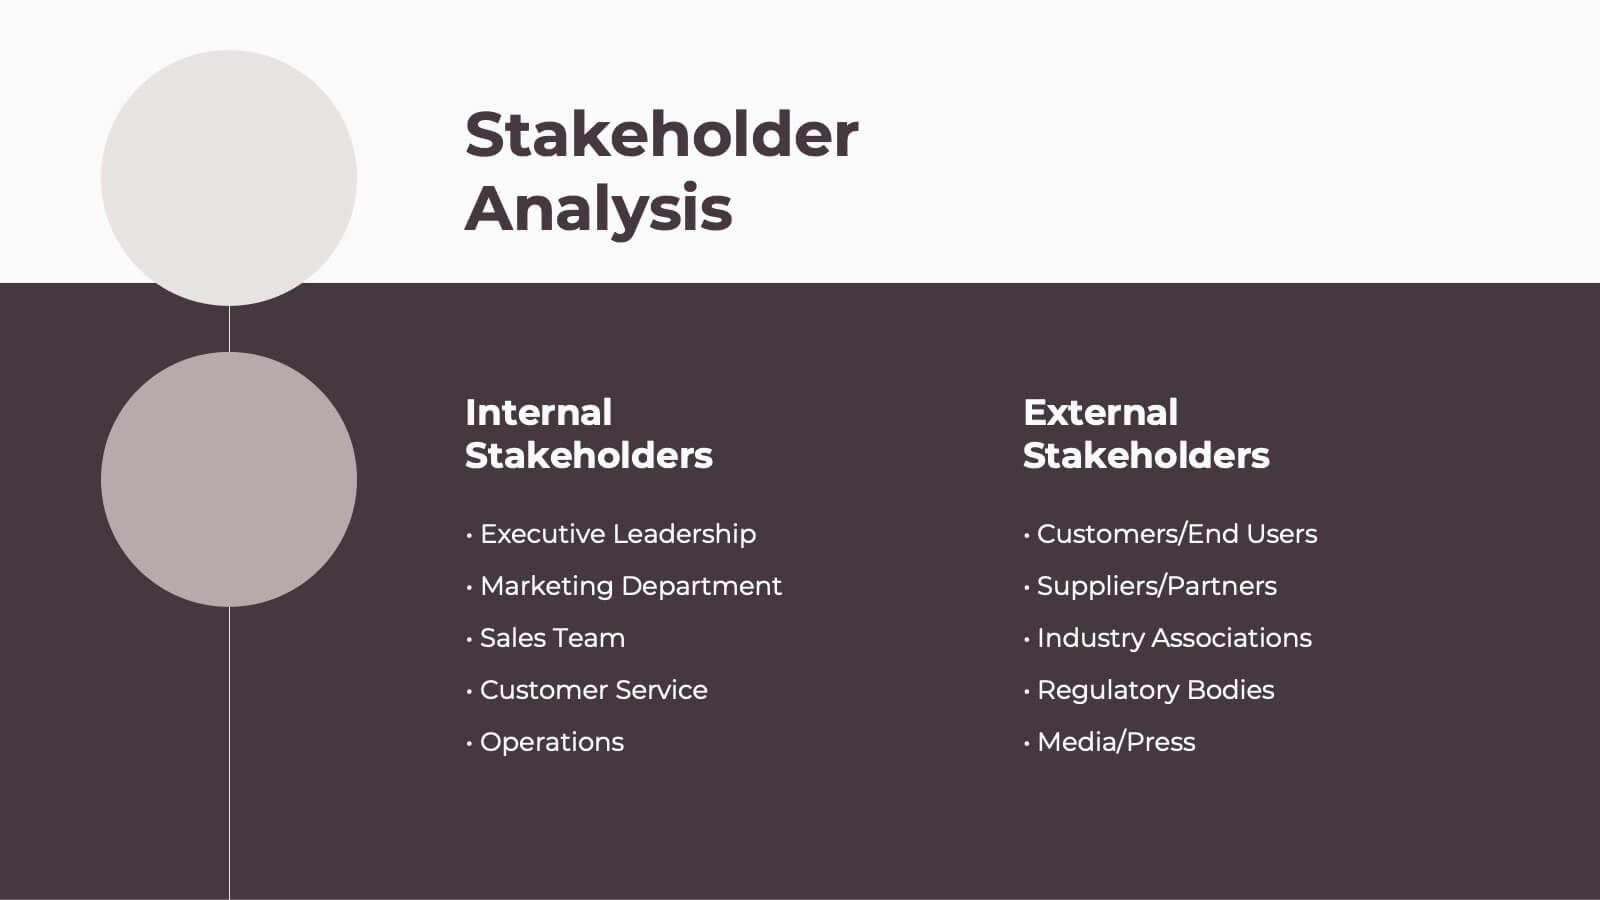
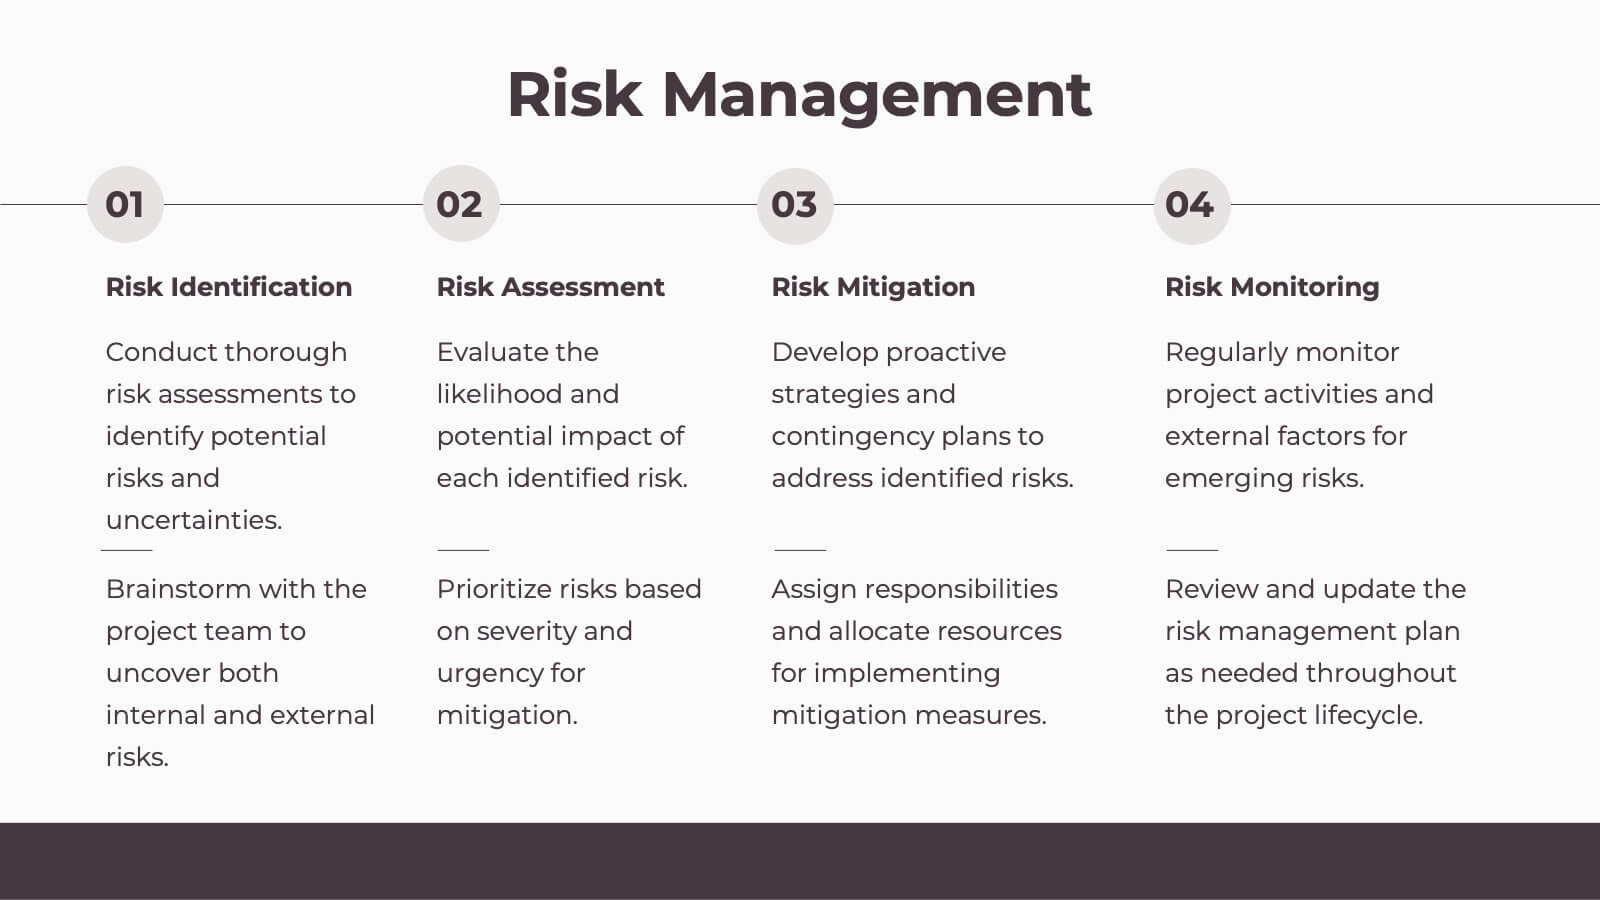
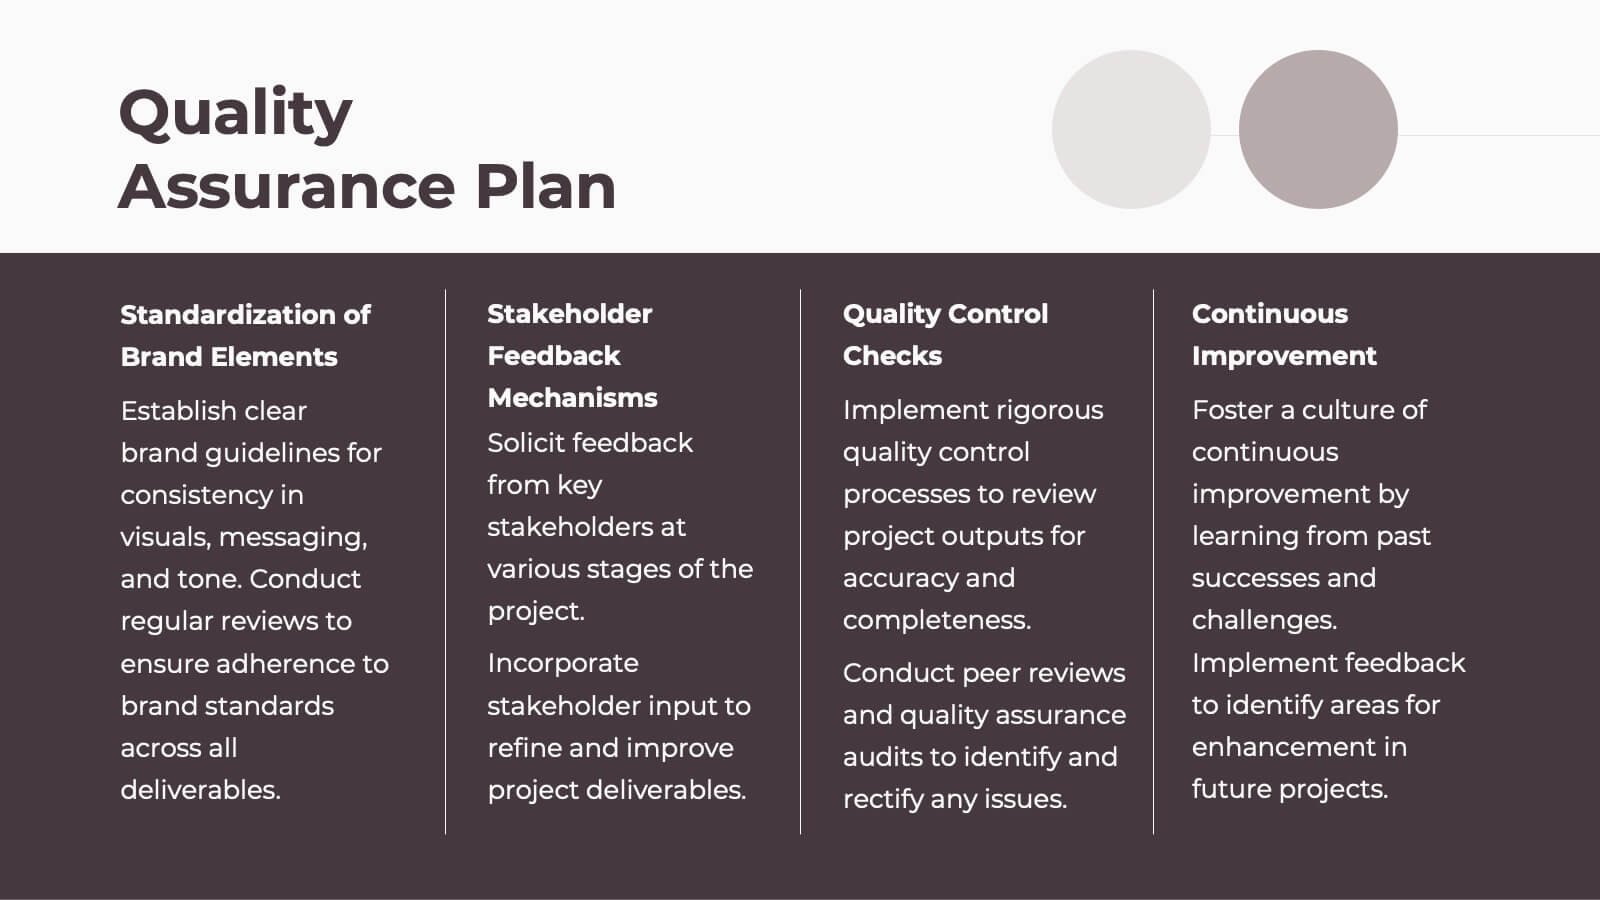
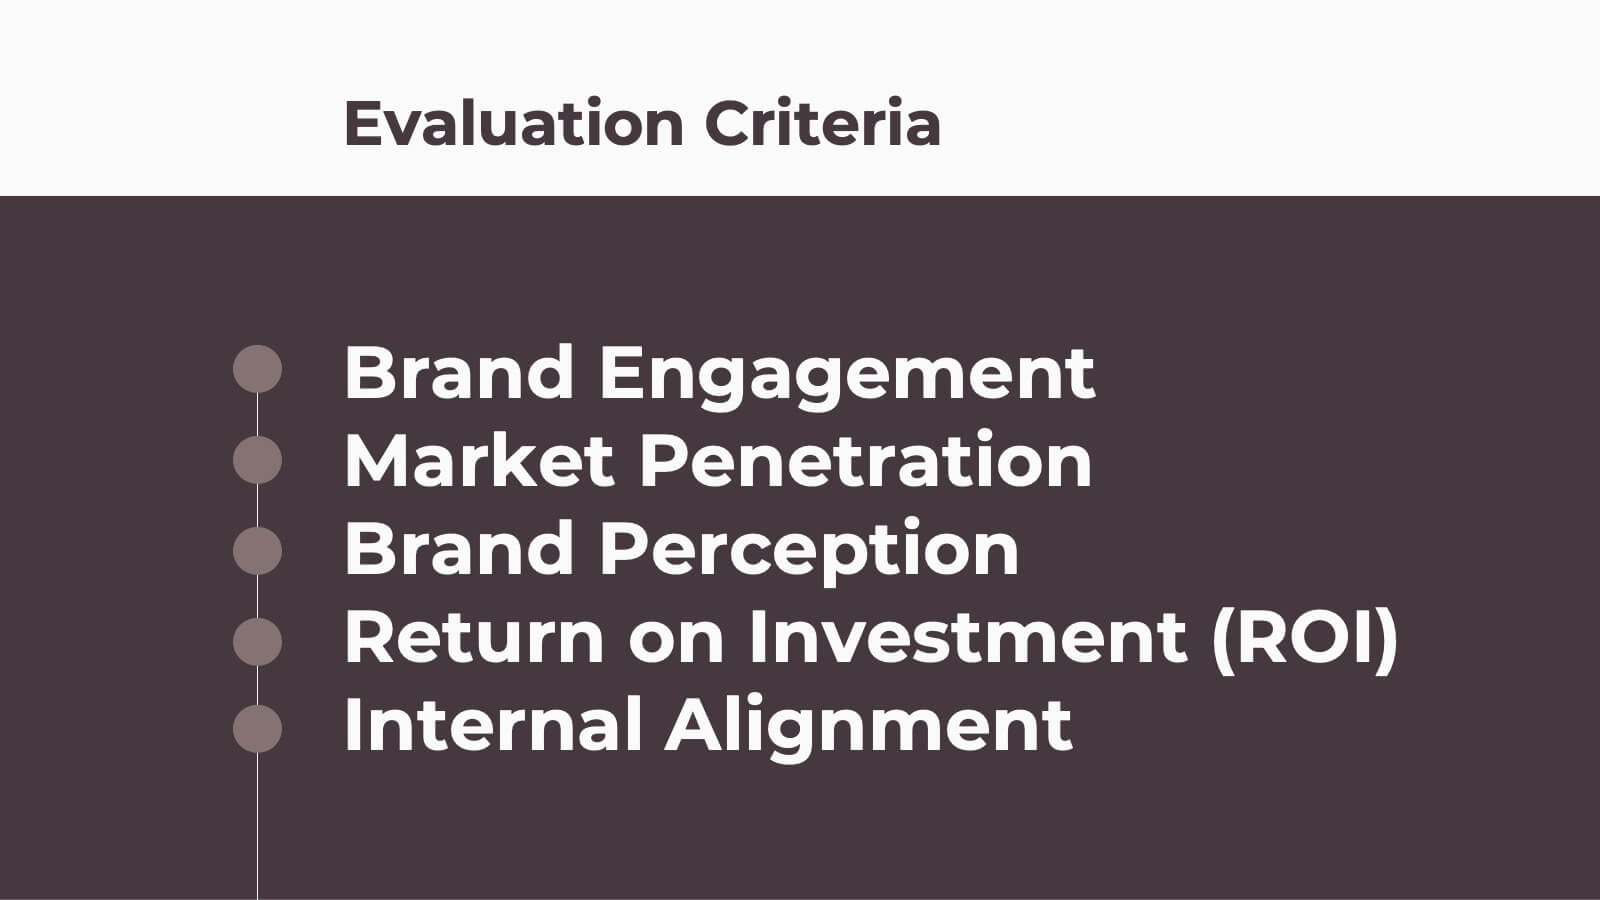
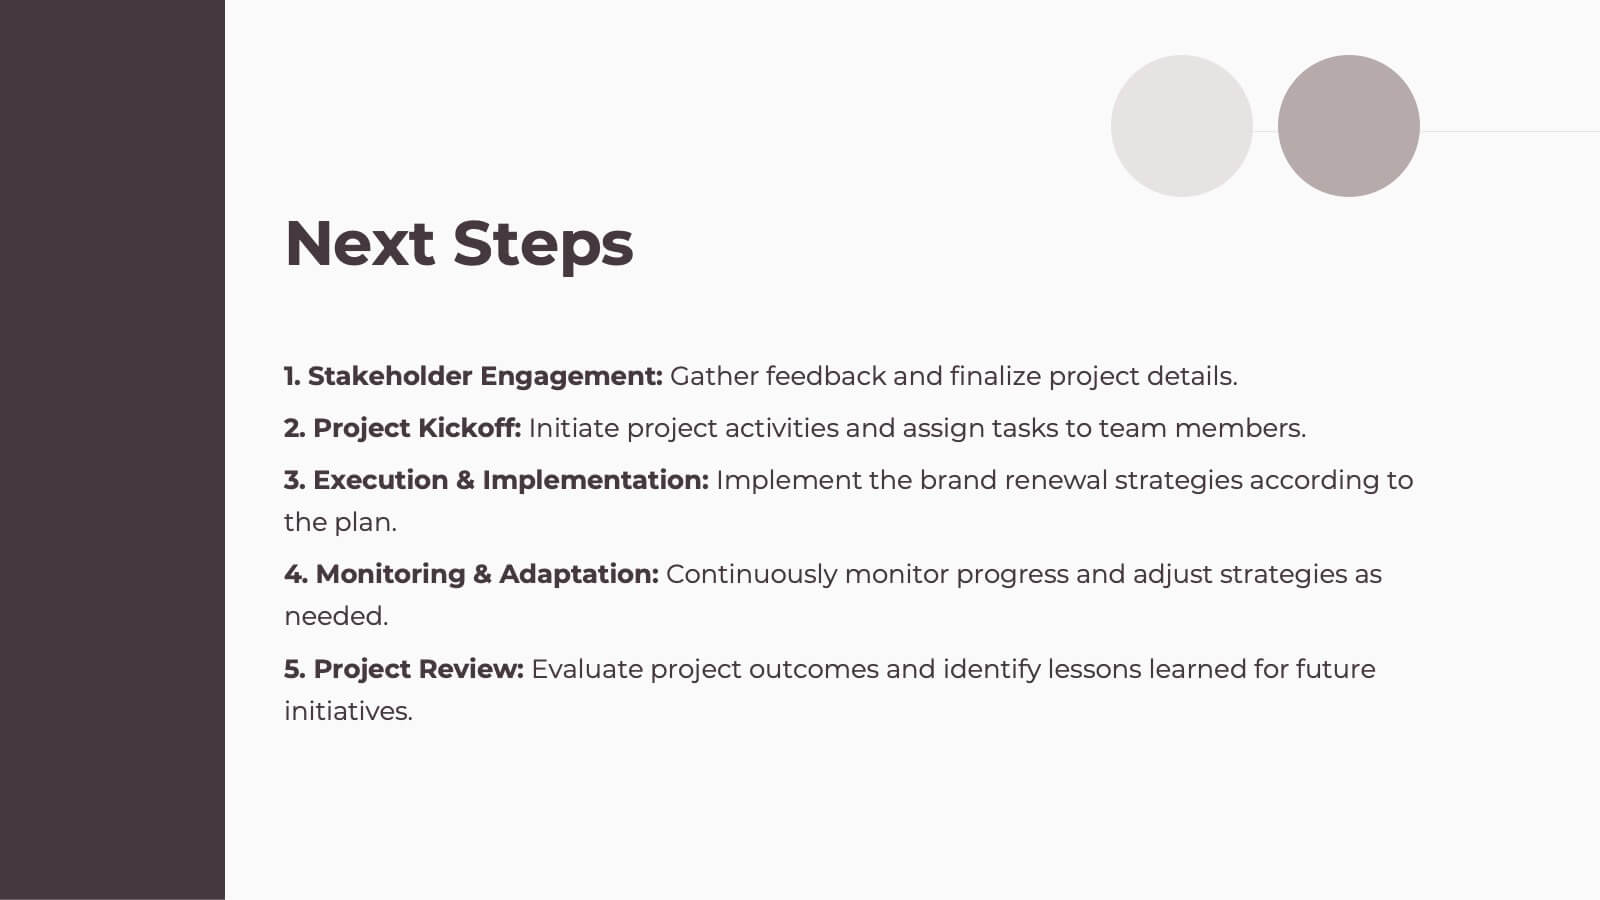
Oneiros Project Timeline Presentation
Effectively communicate your project's progress, goals, and milestones with this professional timeline presentation. Cover key areas such as objectives, resource allocation, stakeholder analysis, and risk management to keep your team aligned. Fully customizable and compatible with PowerPoint, Keynote, and Google Slides.


10 diapositivas
Business Performance Metrics Presentation
Track and display your business metrics effectively with the "Business Performance Metrics" presentation templates. These visually engaging slides are designed to help you present key performance indicators in a clear and structured manner, enhancing understanding and decision-making. Ideal for corporate presentations, these templates are fully compatible with PowerPoint, Keynote, and Google Slides, ensuring seamless integration into your workflow.


21 diapositivas
Starchime UX Case Study Presentation
Showcase your UX design process with this case study template, covering research, user journey mapping, wireframes, and usability testing. Ideal for presenting design insights and outcomes. Compatible with PowerPoint, Keynote, and Google Slides, it’s perfect for a clear, professional, and impactful UX design presentation.


7 diapositivas
Frequently Asked Question (FAQ) Guide Infographic
Unravel the art of answers with our "FAQ Guide" Infographic Template—your next step in revolutionizing how you communicate with curious customers. With its bold, eye-catching design, this template turns the routine task of answering questions into an engaging experience. Dive into a layout that blends vibrant visuals and crisp, clear typography to ensure your answers not only catch the eye but also stick in the mind. Whether you're in tech, retail, or any service-oriented industry, our template flexes to fit your brand’s unique flair. Customize with your colors, integrate your style, and transform your customer service into an impressive visual journey. Perfect for websites, marketing materials, or quick training sessions, this template makes information fun and accessible. Equip your team with the tools to engage, enlighten, and excite with every FAQ presented. Compatible with all leading graphic design software, it's ready to go whenever you are.


5 diapositivas
Medical Services Infographics
Navigate the complexities of healthcare information with our medical services infographics. Rendered in a life-affirming palette of blue and red, these infographics elucidate various facets of medical services. The template serves as a lifeline for healthcare professionals, and public health advocates by providing a clear, visual narrative of services, processes, and advancements in the medical field. Compatible with Powerpoint, Keynote, and Google Slides. Its creative yet informative style, enhanced with relevant graphics and icons, ensure that critical information catches the eye, improves understanding, and encourages engagement.


6 diapositivas
Student Success and Learning Programs Presentation
Showcase your academic initiatives with the Student Success and Learning Programs Presentation. Ideal for school boards, educators, or program leaders, this slide lets you highlight six key focus areas around student achievement. Fully editable in PowerPoint, Keynote, Google Slides, and Canva—making it easy to tailor to your curriculum goals.


6 diapositivas
Professional Title Infographic
This collection of professional presentation templates is meticulously designed to meet a variety of business needs, blending visual appeal with practical functionality. The templates are versatile, allowing professionals to effectively communicate complex data, strategic insights, and operational updates. One template is perfect for detailed data visualization, helping to highlight trends and insights that are crucial for data-driven decision-making. Another template focuses on team introductions, ideal for building a connection between your team and the audience, whether in stakeholder meetings or internal briefings. For marketing strategies, there's a template designed to outline customer demographics and behaviors, which is essential for tailoring marketing campaigns and product development. The collection also includes templates for financial reporting and pricing strategies, ensuring that financial data is communicated clearly and efficiently. Additionally, a strategic analysis template aids in outlining key business strengths, weaknesses, opportunities, and threats, supporting strategic planning and risk management. Overall, these templates are a valuable tool for any professional looking to present information clearly and compellingly in various business contexts.


6 diapositivas
Customer Journey Mapping with Buyer Persona Presentation
Clearly visualize the customer experience across all touchpoints with this structured journey mapping slide. Featuring a central buyer persona graphic and six customizable steps with icons, this layout helps you break down each stage of the customer path. Perfect for UX strategy, customer service insights, and product development. Fully editable and compatible with PowerPoint, Keynote, and Google Slides.


7 diapositivas
Geographic Global Data Presentation
Bring worldwide insights to life with a crisp, modern layout designed to make global trends easy to understand. This presentation highlights regional metrics, geographic comparisons, and key data points in a clean, visual format perfect for business or research reporting. Fully compatible with PowerPoint, Keynote, and Google Slides.


23 diapositivas
Twilora Business Plan Presentation
Present your business strategy with a comprehensive and visually engaging template designed to impress stakeholders and investors. This template covers key elements of a business plan, including company background, market opportunities, business objectives, and key milestones. Showcase your product offerings, target audience, and competitive advantages through clear, professional visuals and data-driven charts. Highlight your financial performance, investment opportunities, and operational plans with precision and clarity. Tailor the design to reflect your brand's identity and goals. Fully compatible with PowerPoint, Google Slides, and Keynote, this versatile template is perfect for startups, established businesses, and entrepreneurs aiming to present a strong and compelling business case.


21 diapositivas
Oslo Design Strategy Proposal Presentation
This design strategy proposal template is tailored to present your creative process with bold colors and clean layouts. It includes sections like overview, design brief, concept development, design process, mood board, and project timeline, giving you a comprehensive structure for showcasing your approach. Compatible with PowerPoint, Keynote, and Google Slides, it ensures seamless presentations.


21 diapositivas
Talestra Startup Pitch Deck Presentation
Make a strong first impression with this clean and modern startup pitch deck. Covering key areas such as mission and vision, market analysis, business model, growth plan, and financial overview, it's designed to captivate investors and stakeholders. Fully customizable and compatible with PowerPoint, Keynote, and Google Slides.


2 diapositivas
Pink Ribbon Event Slide Deck Presentation
Bring awareness and compassion to your presentation with a bold ribbon design that symbolizes unity and support. Perfect for health campaigns, charity events, or educational talks, this layout helps you share key messages with clarity and impact. Fully compatible with PowerPoint, Keynote, and Google Slides for easy customization.


6 diapositivas
Education and Learning Strategy Presentation
Enhance educational planning with the Education and Learning Strategy Presentation template. This structured and visually compelling layout is designed to outline learning initiatives, training programs, and academic strategies effectively. Ideal for educators, trainers, and institutions, this template ensures clarity and engagement. Fully customizable and compatible with PowerPoint, Keynote, and Google Slides for seamless presentation creation.


8 diapositivas
Business Competitive Analysis
Break down your market strategy into clear, actionable steps with this streamlined analysis slide. Featuring an 8-step horizontal layout with bold icons and color-coded segments, it helps visualize competitive research and planning at a glance. Easily customizable in PowerPoint, Keynote, and Google Slides.