


Características


¿Tienes alguna pregunta?
Recomendar


21 diapositivas
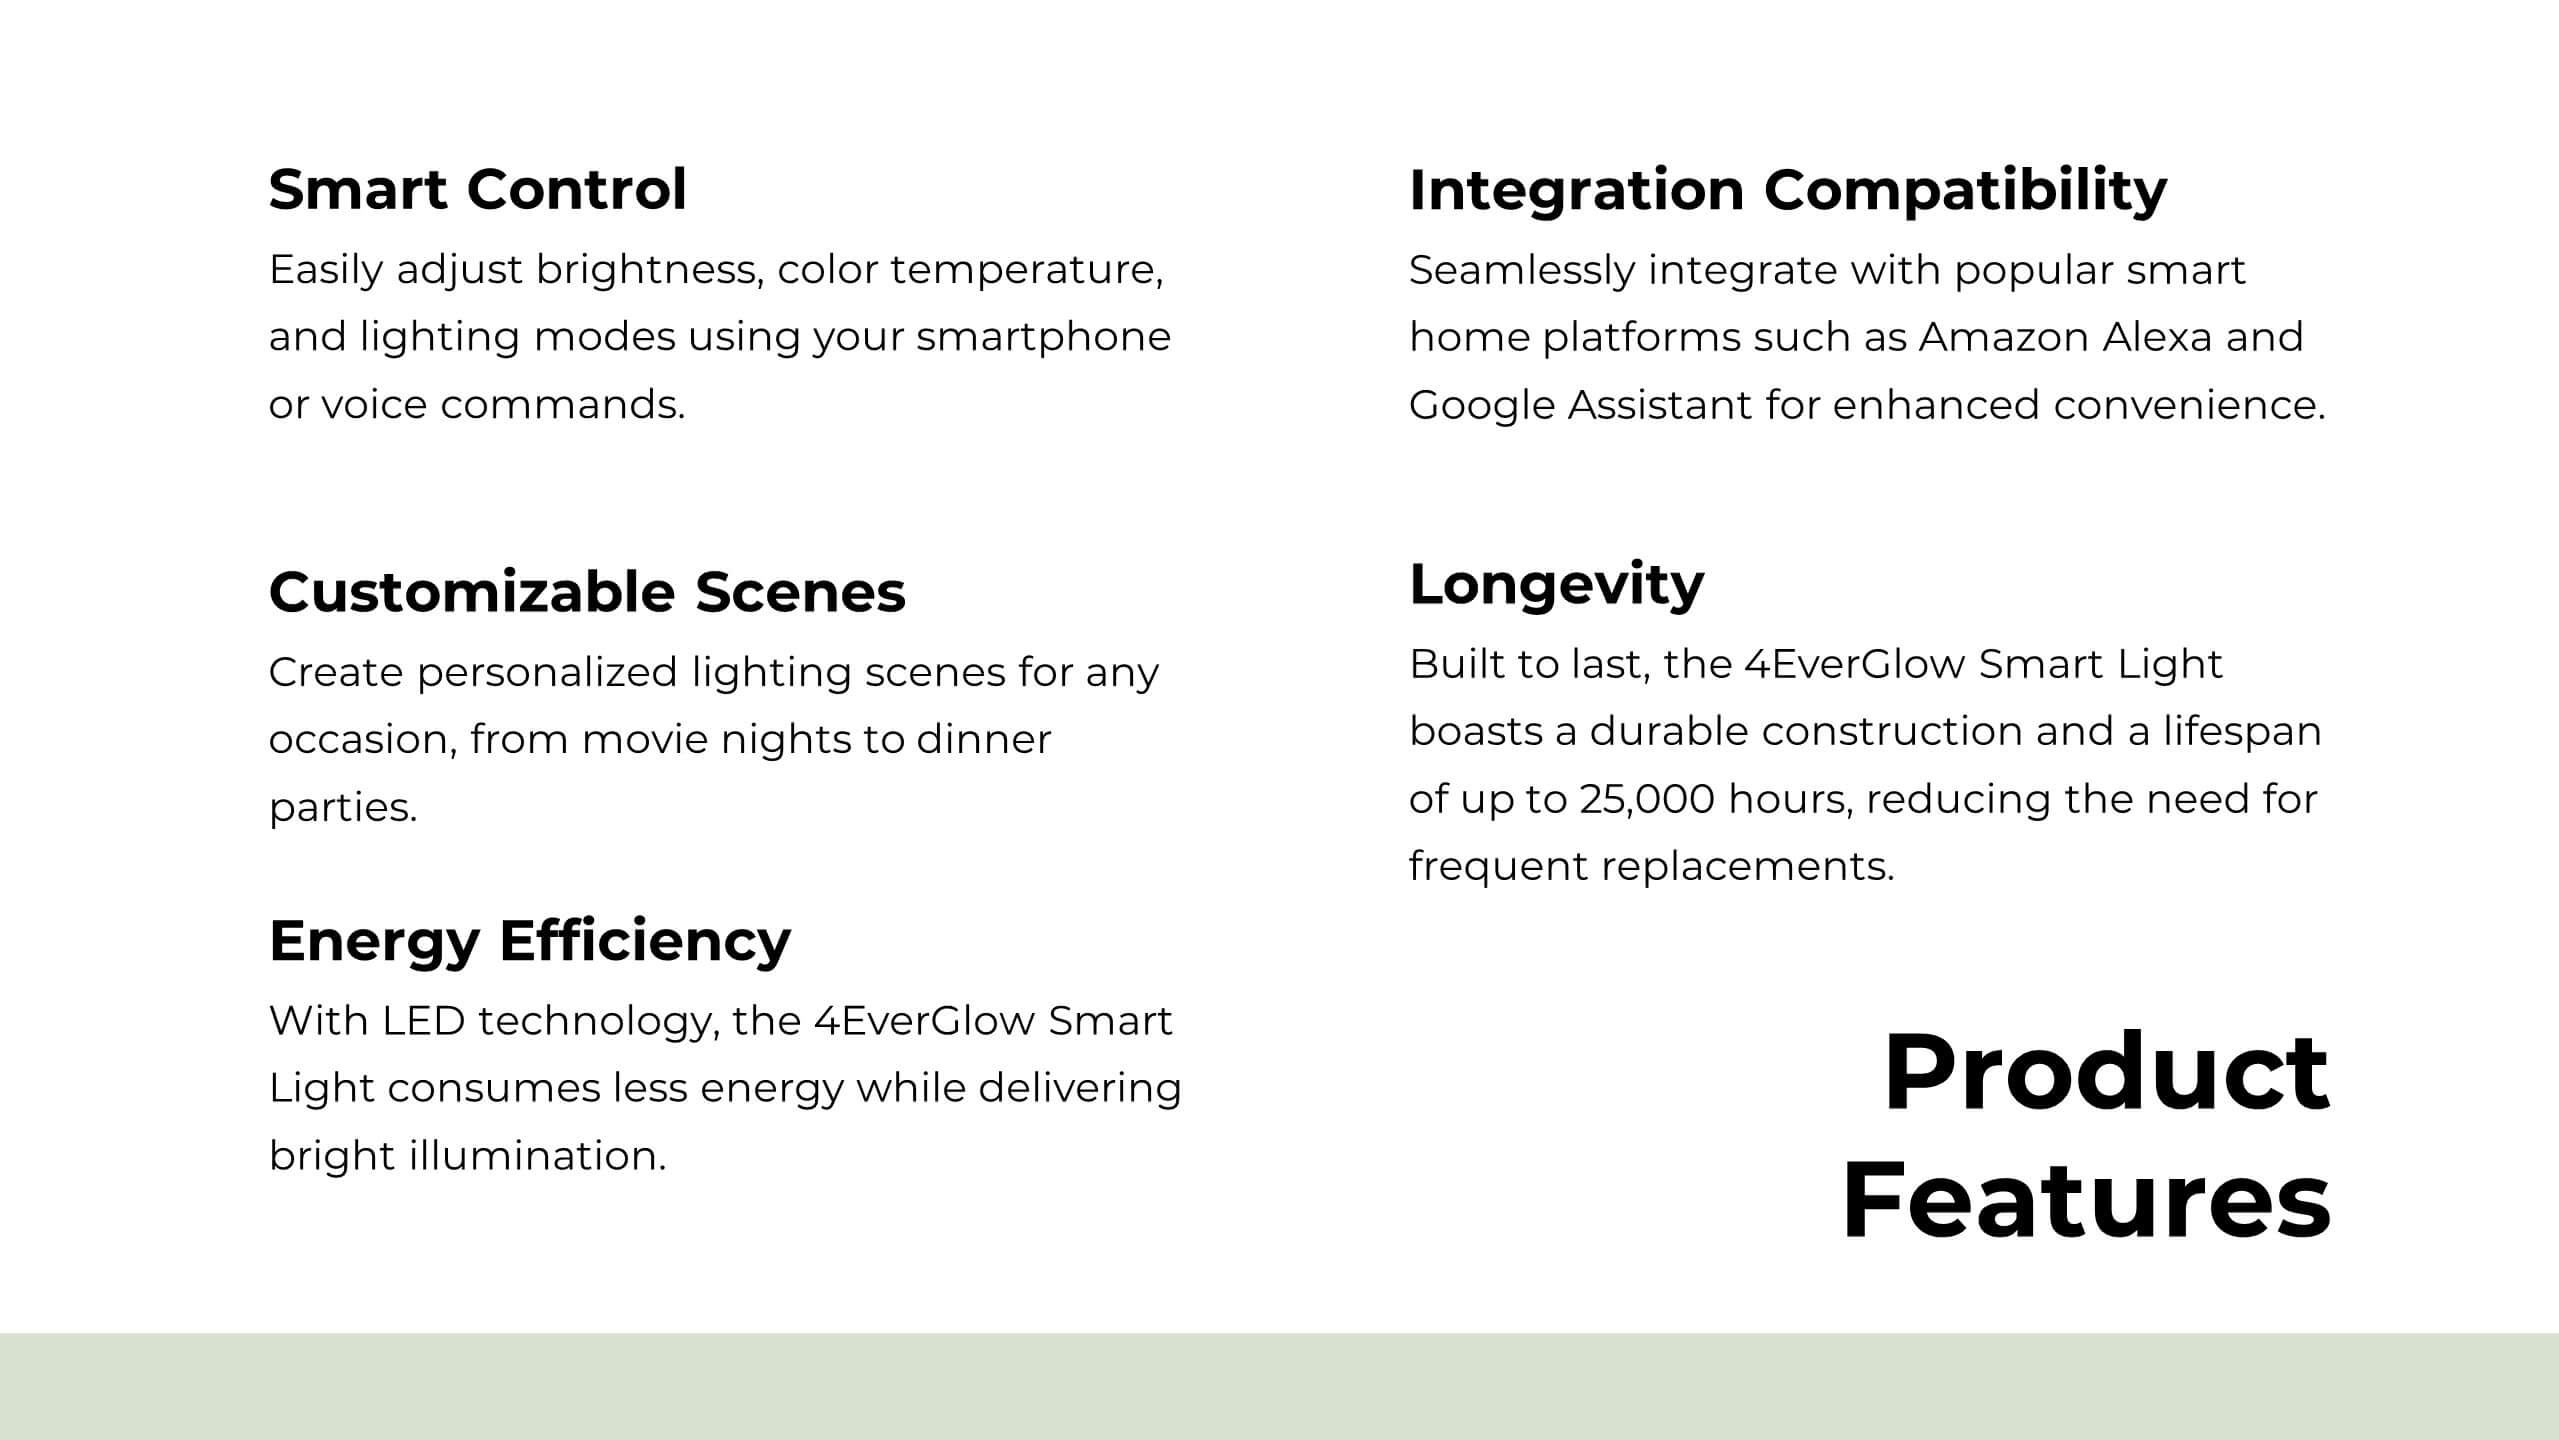
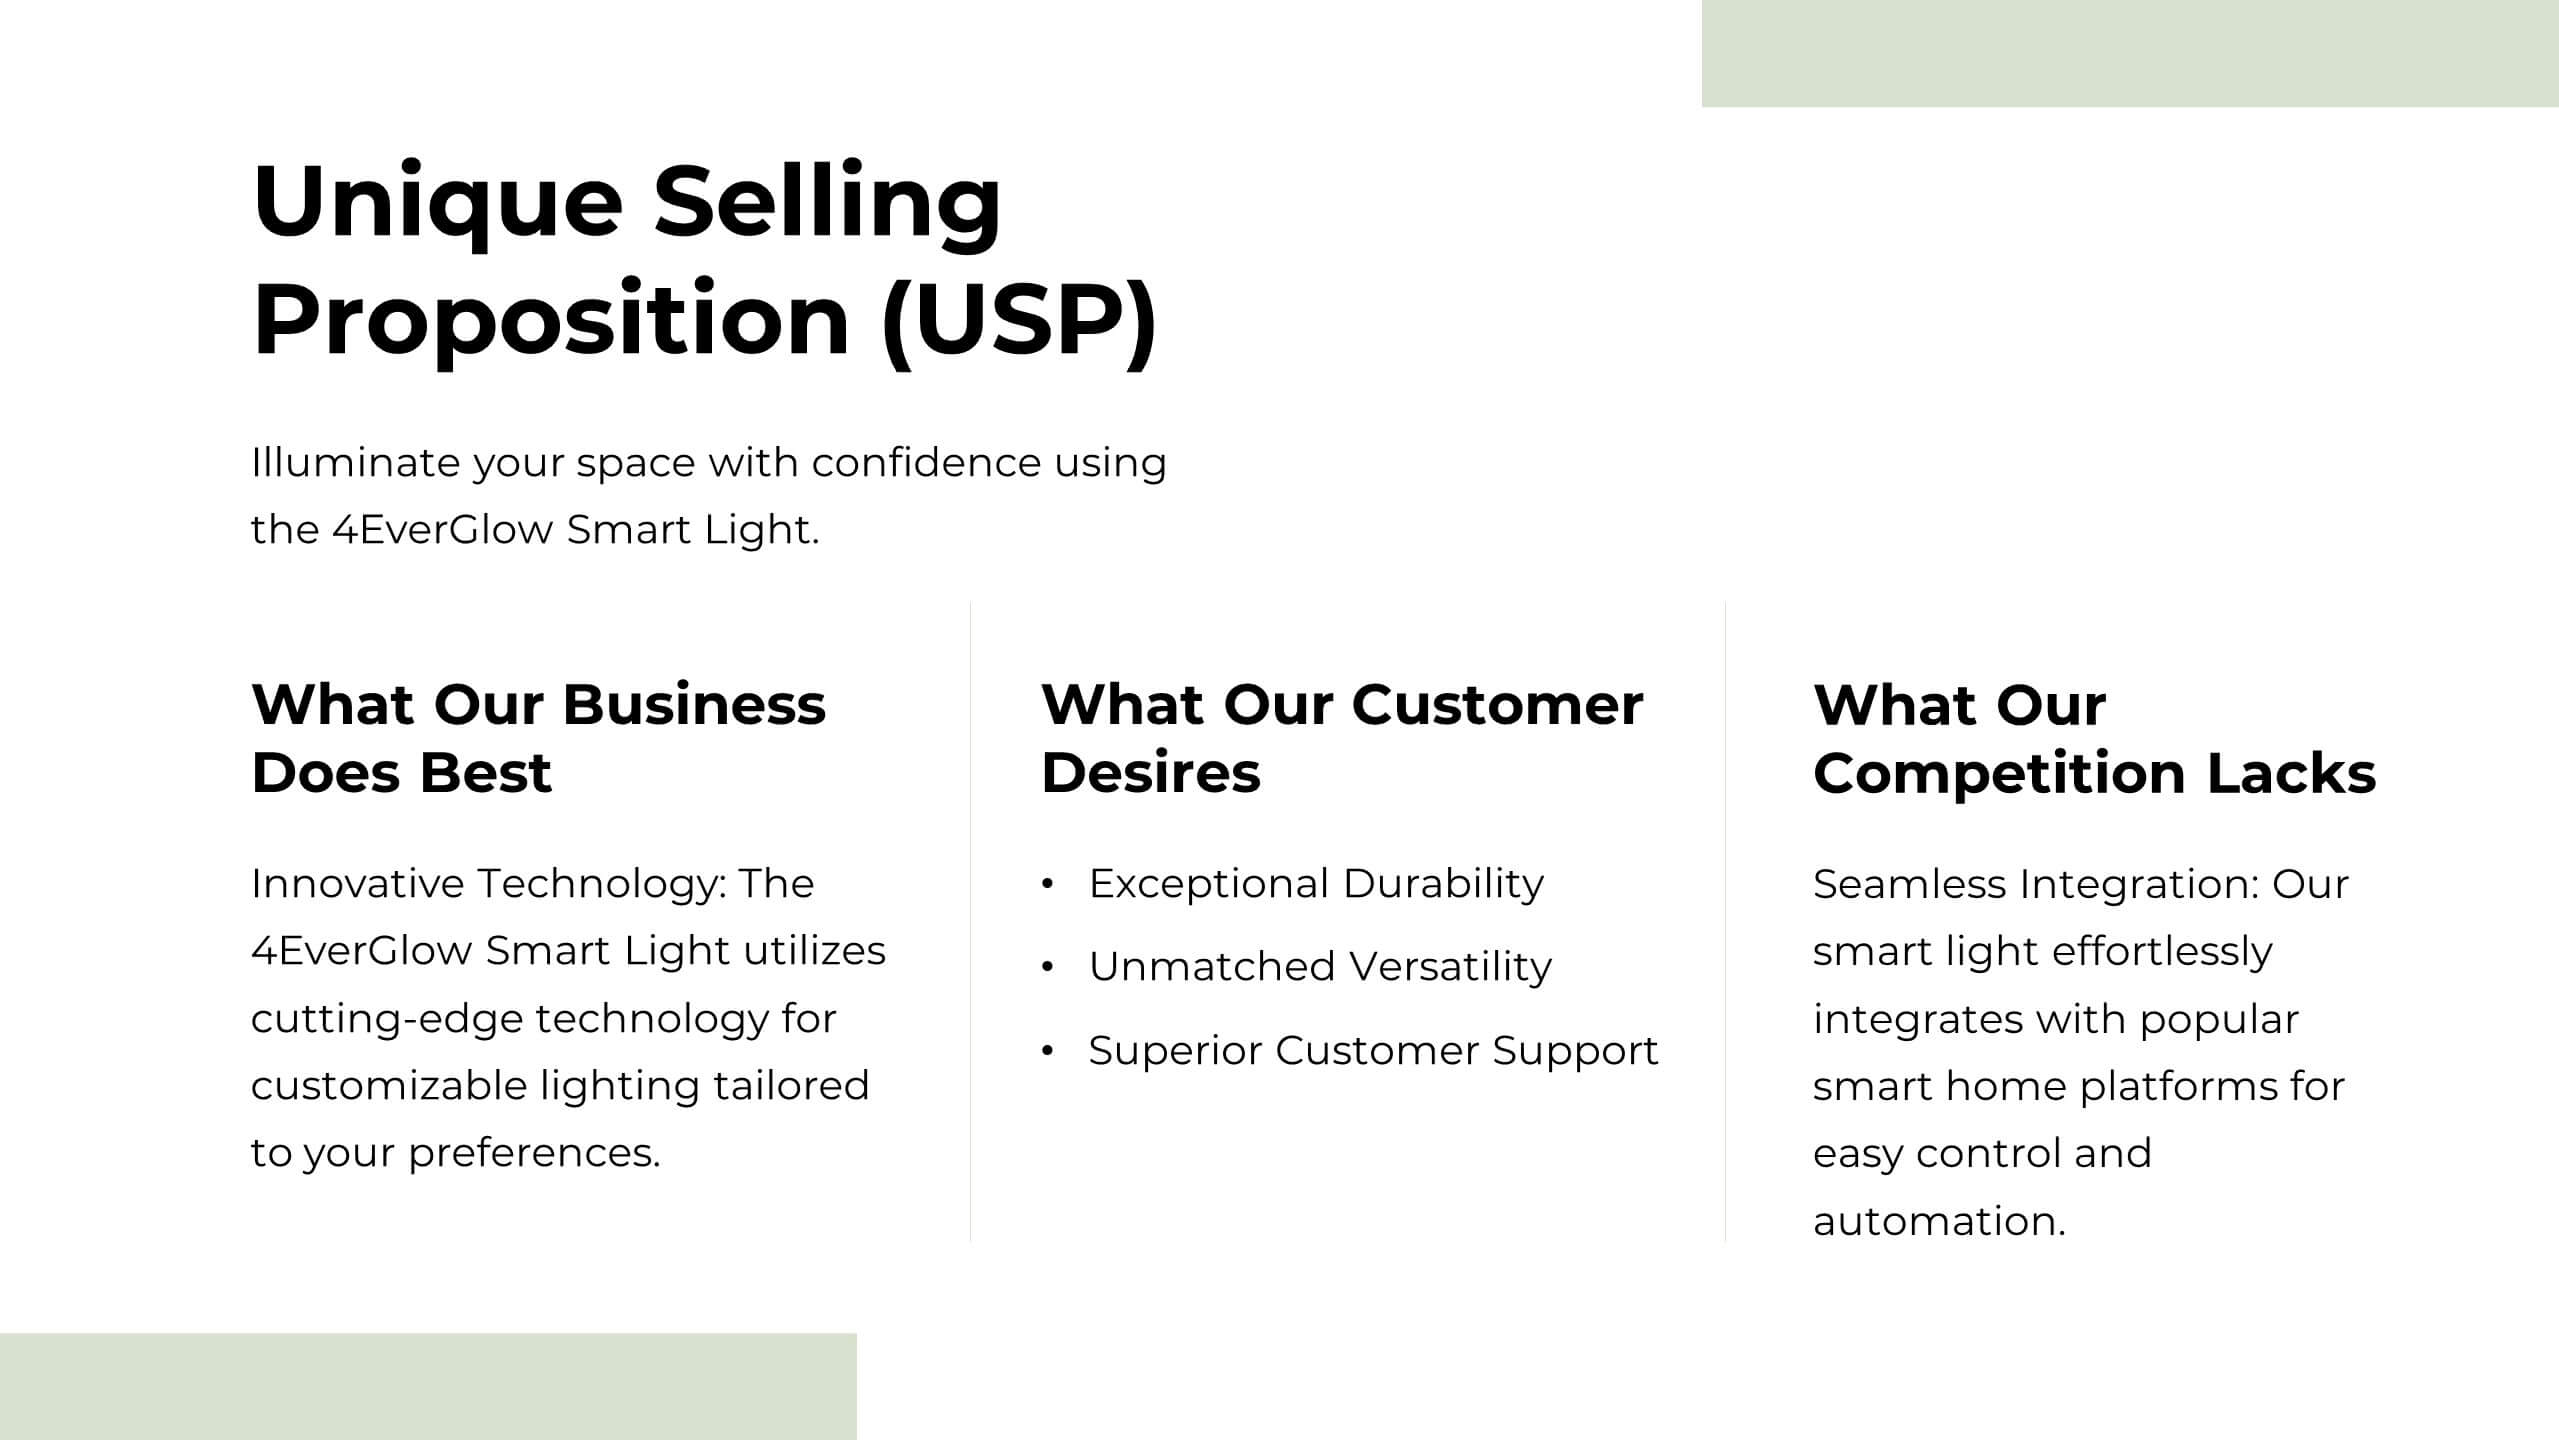
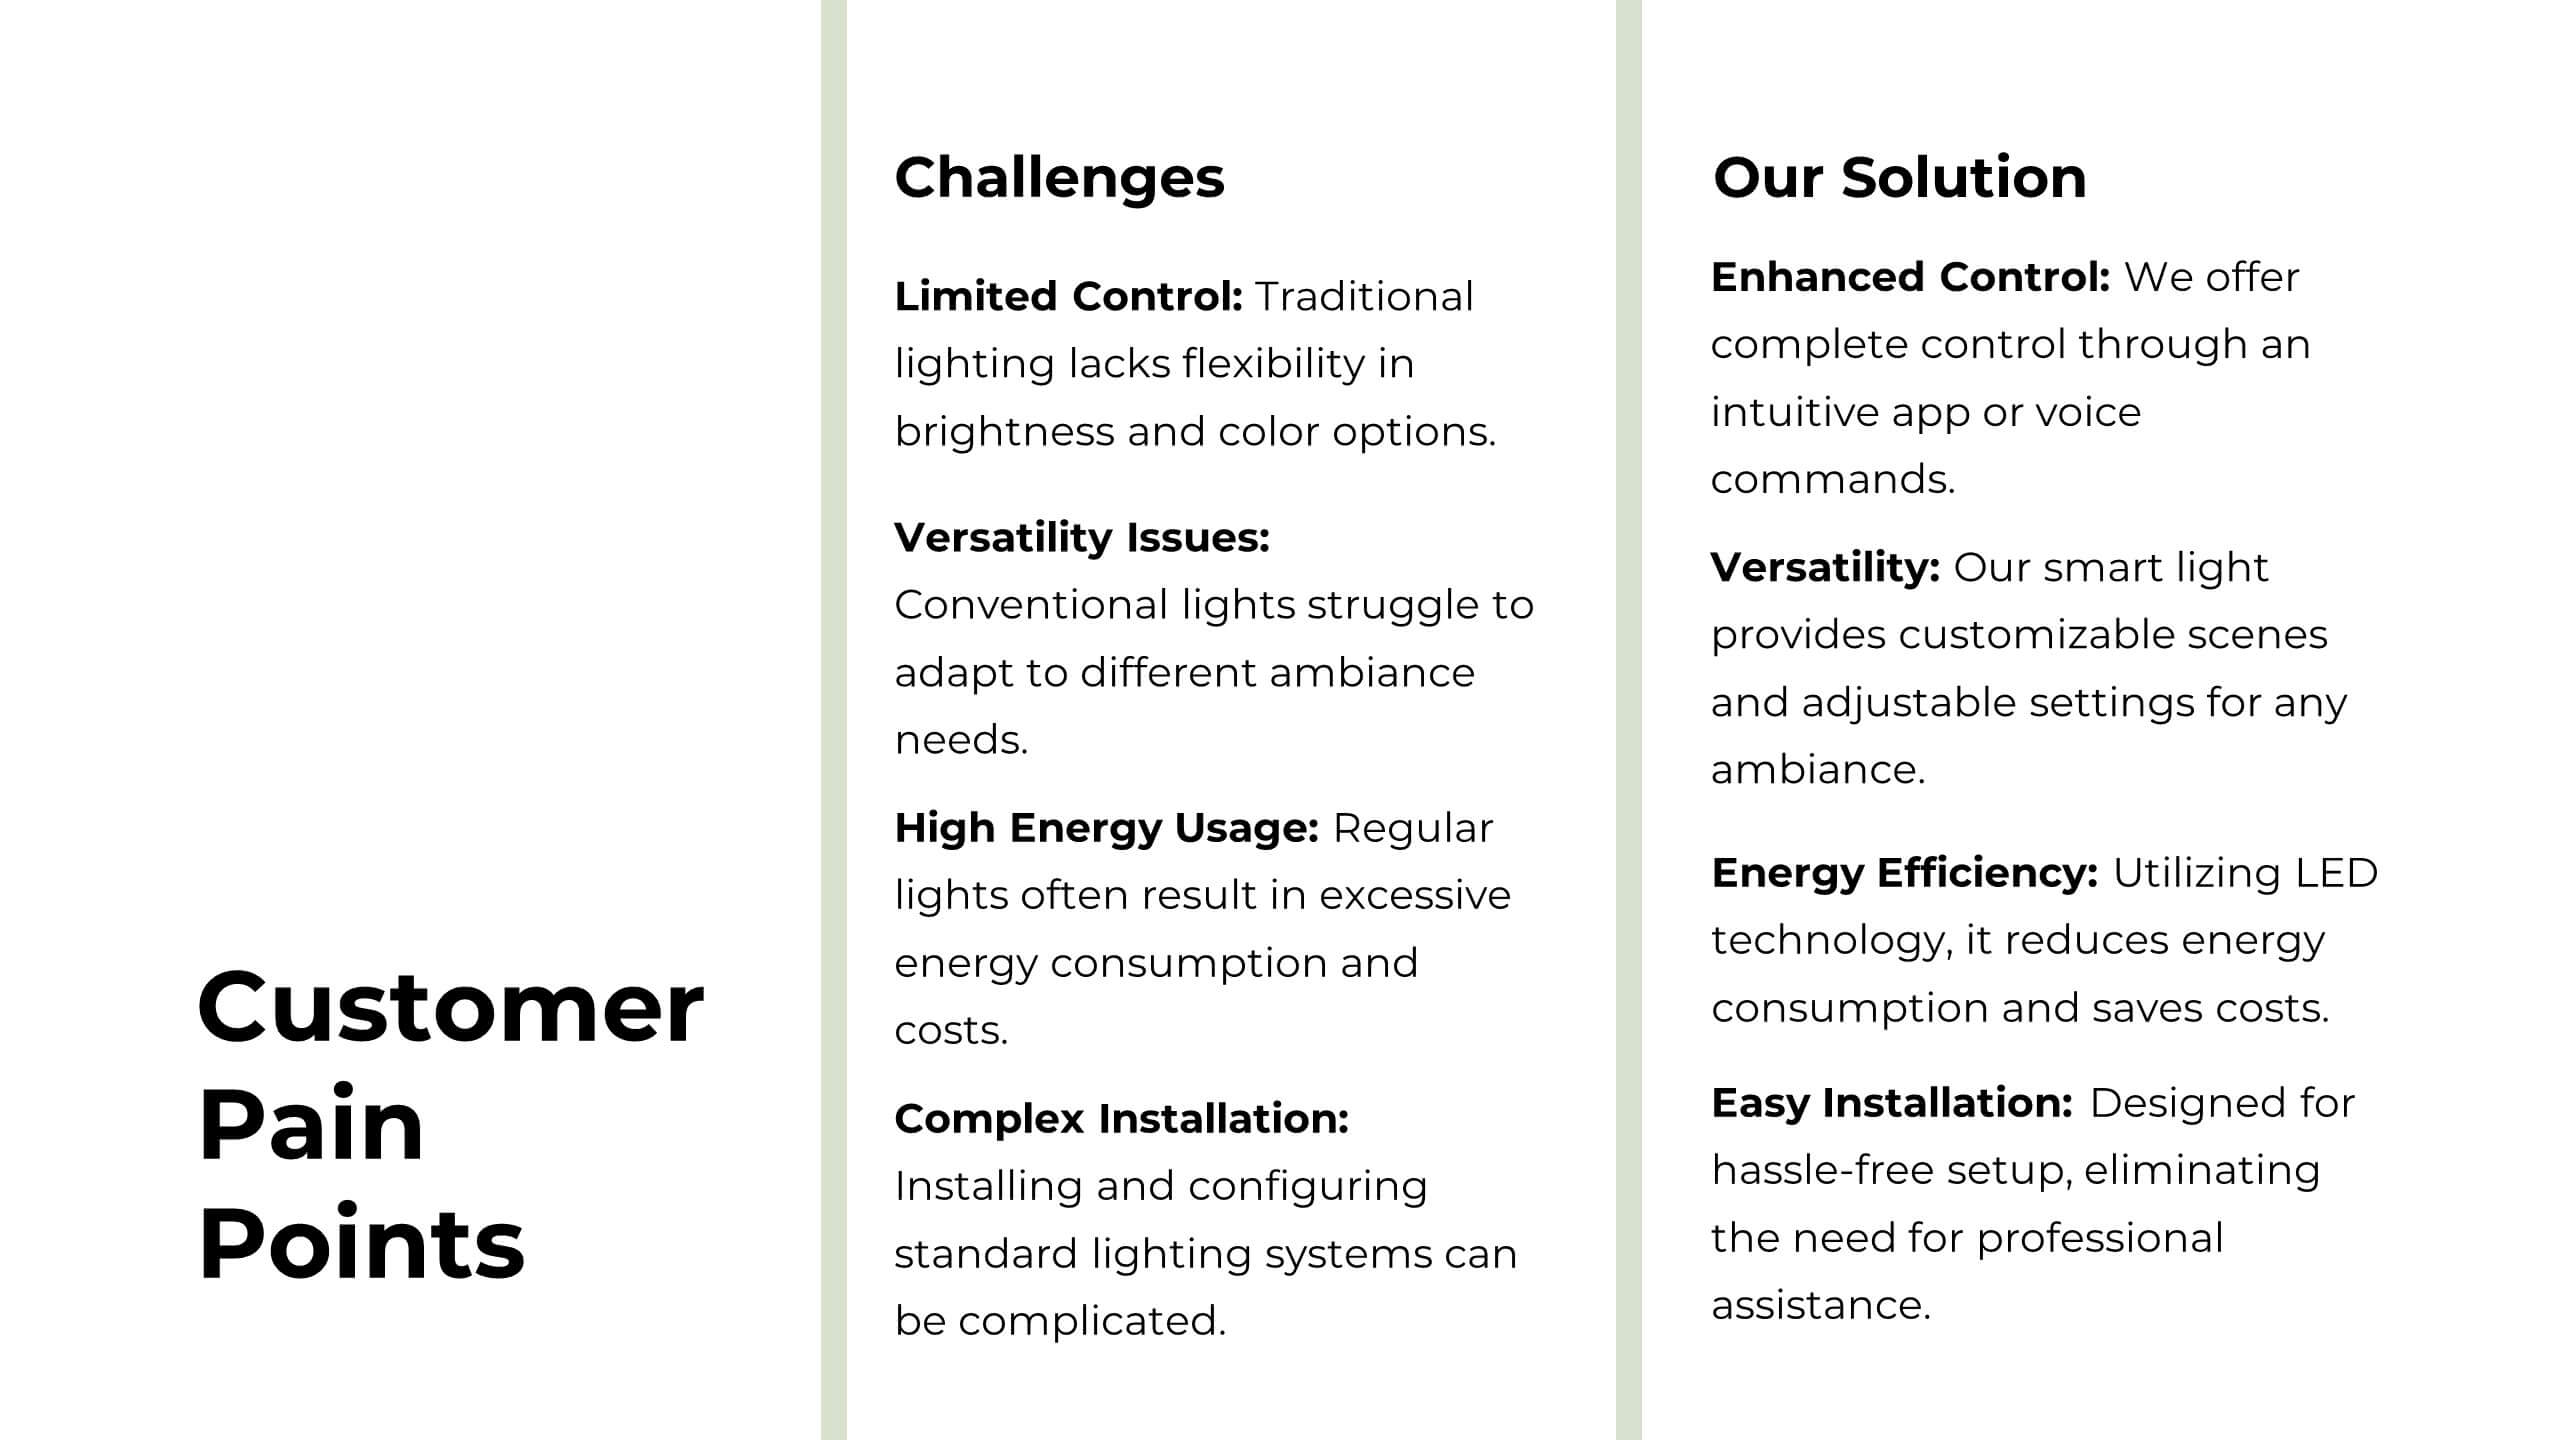
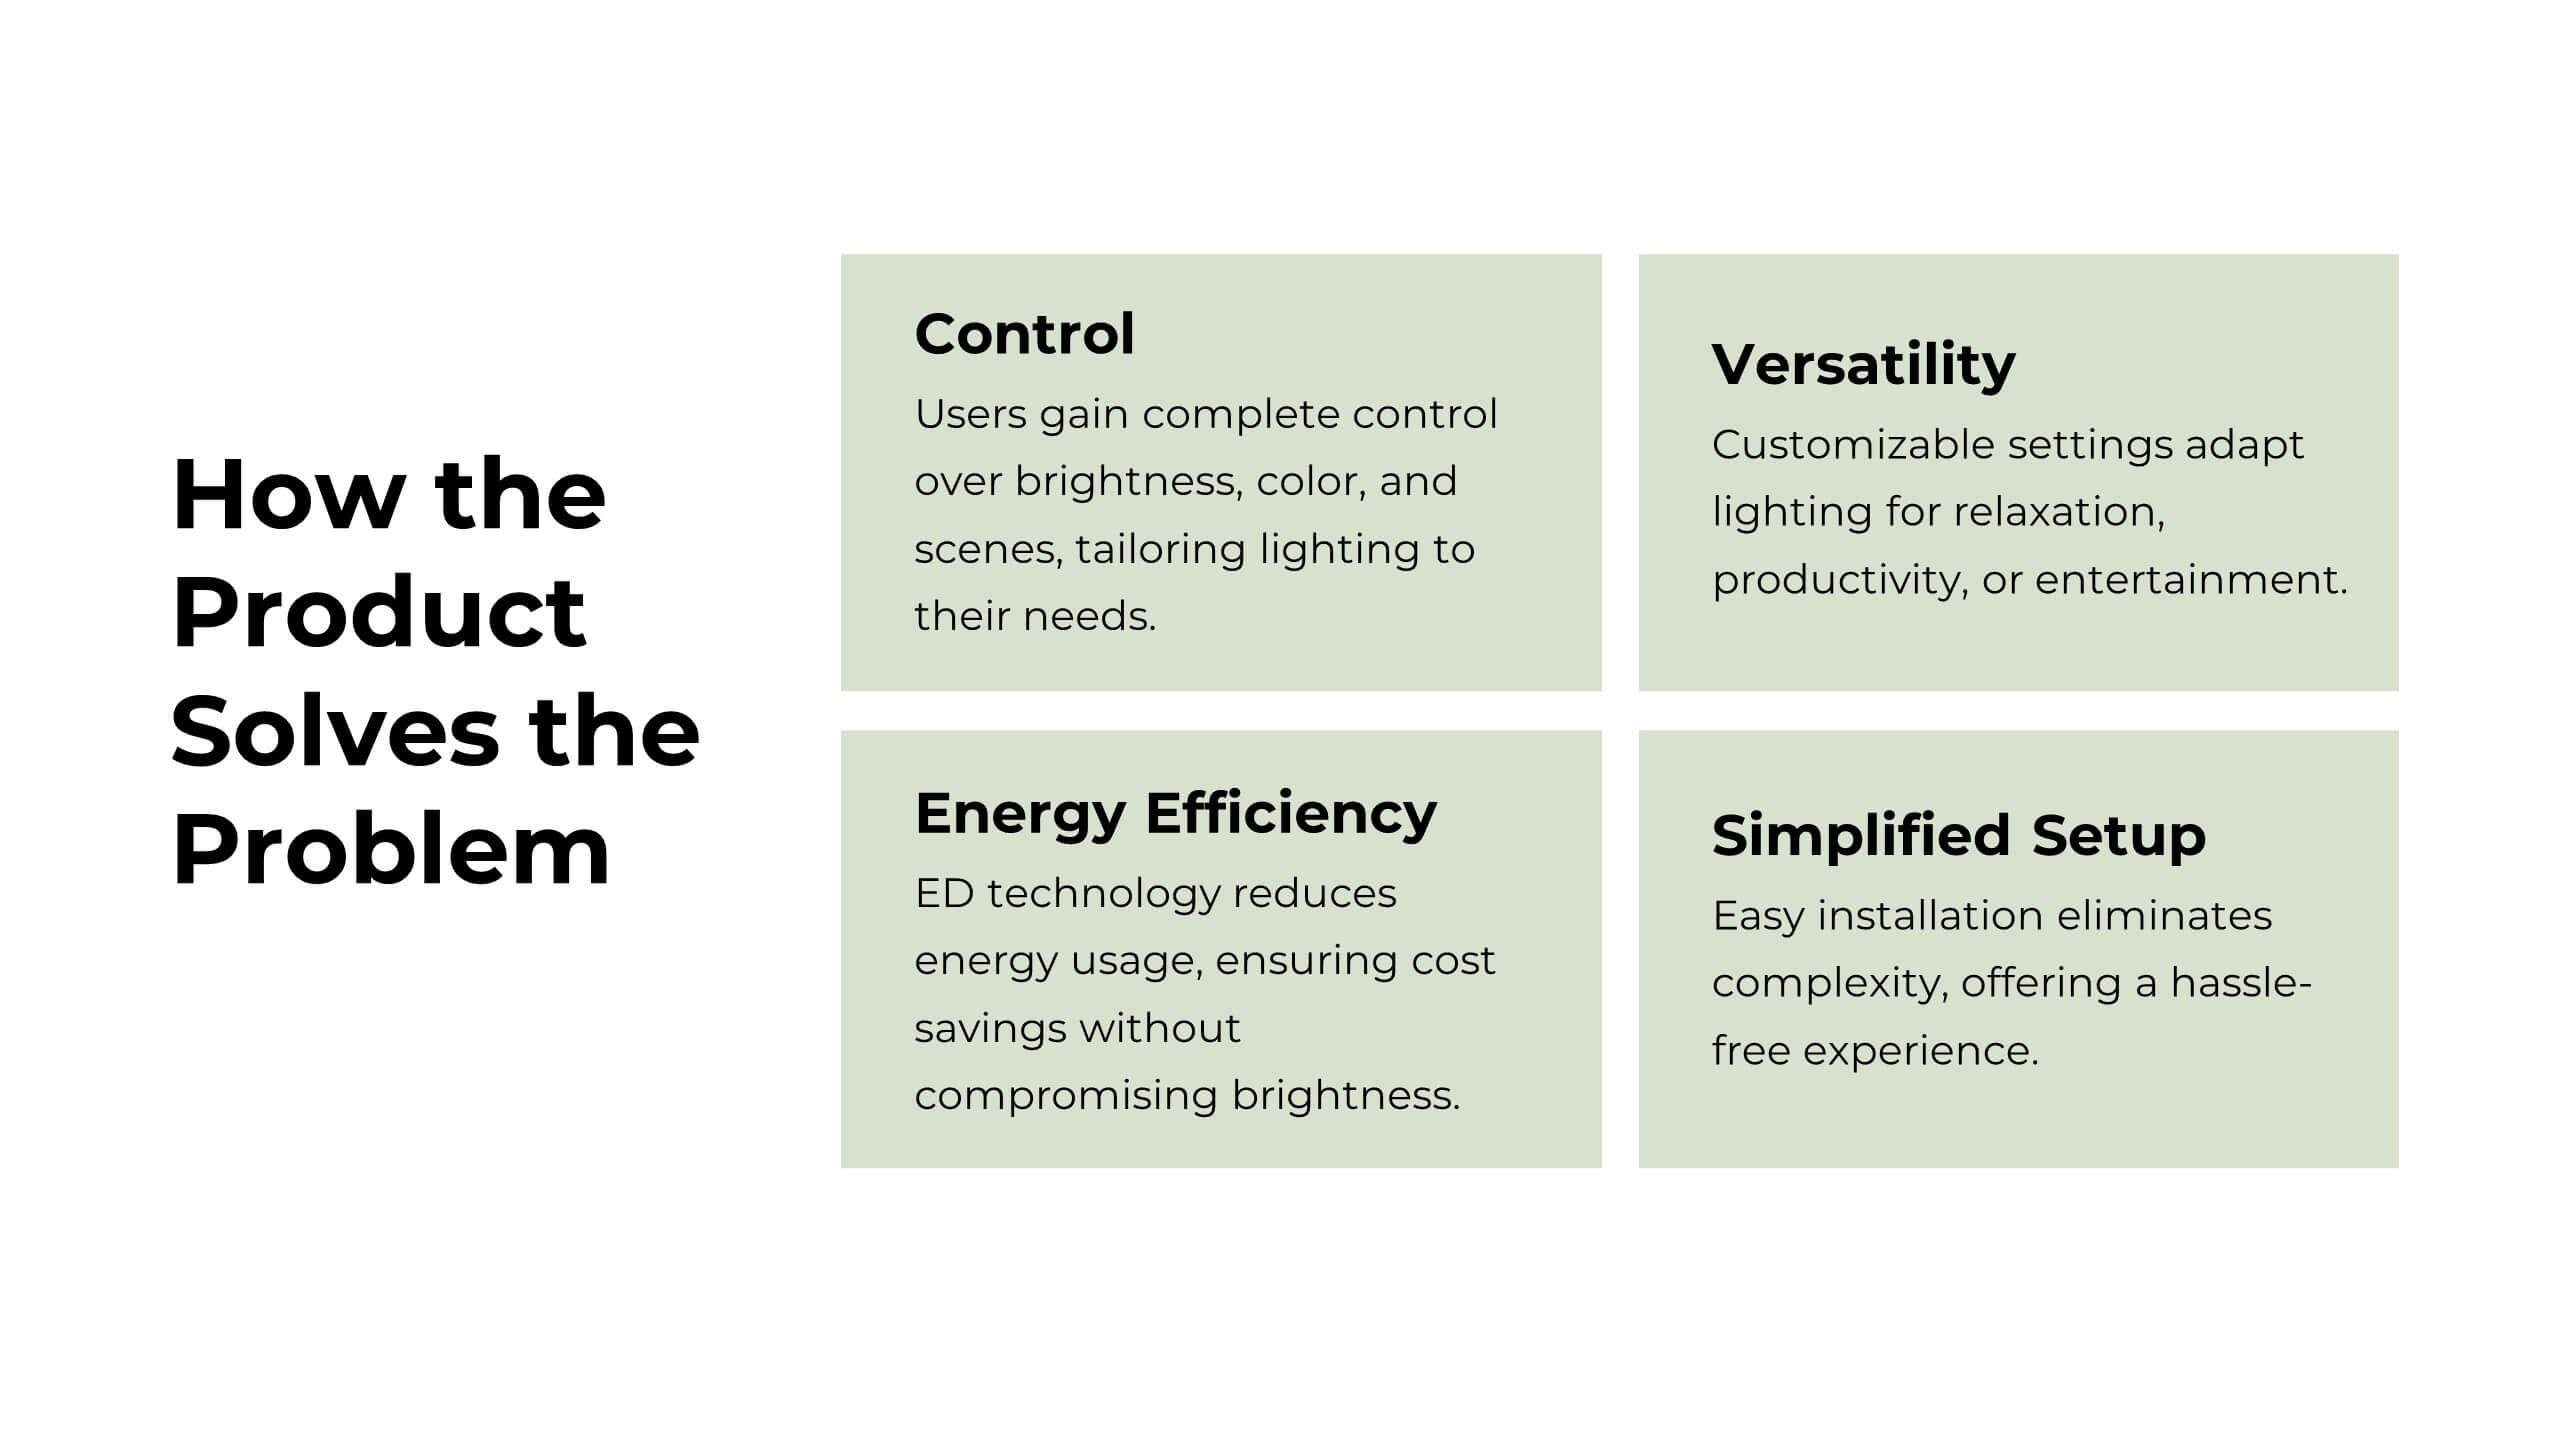
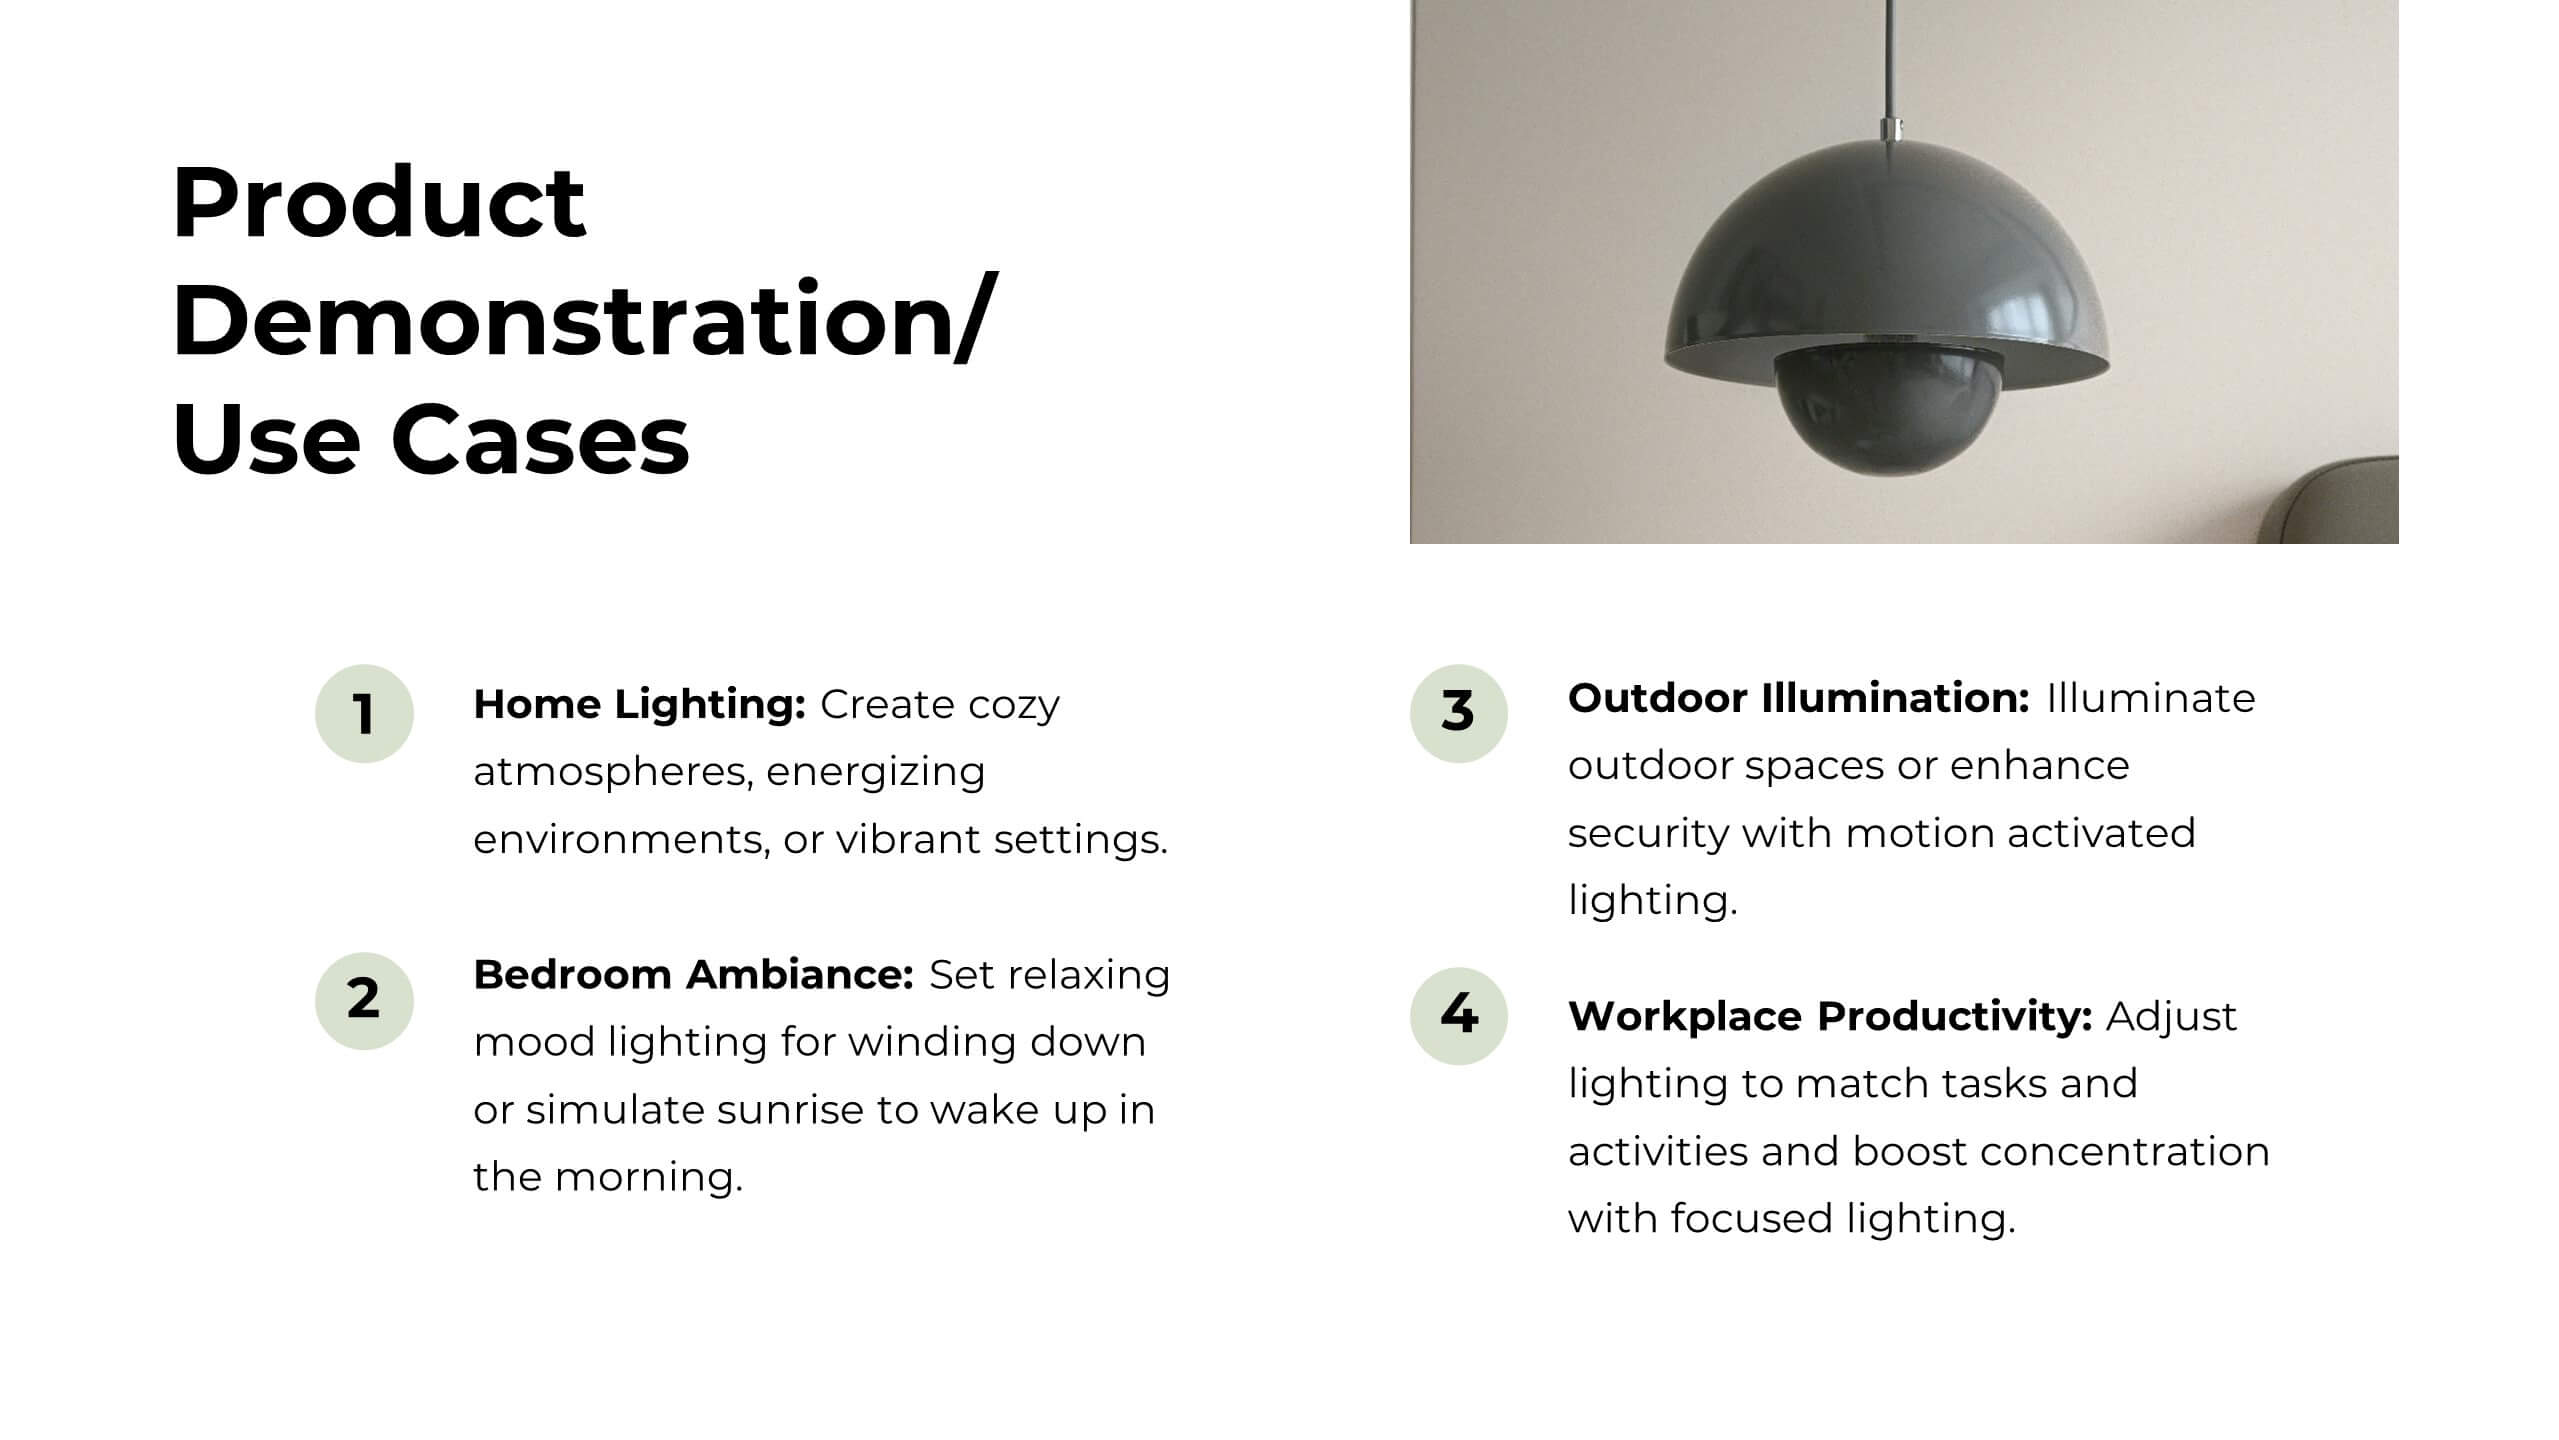
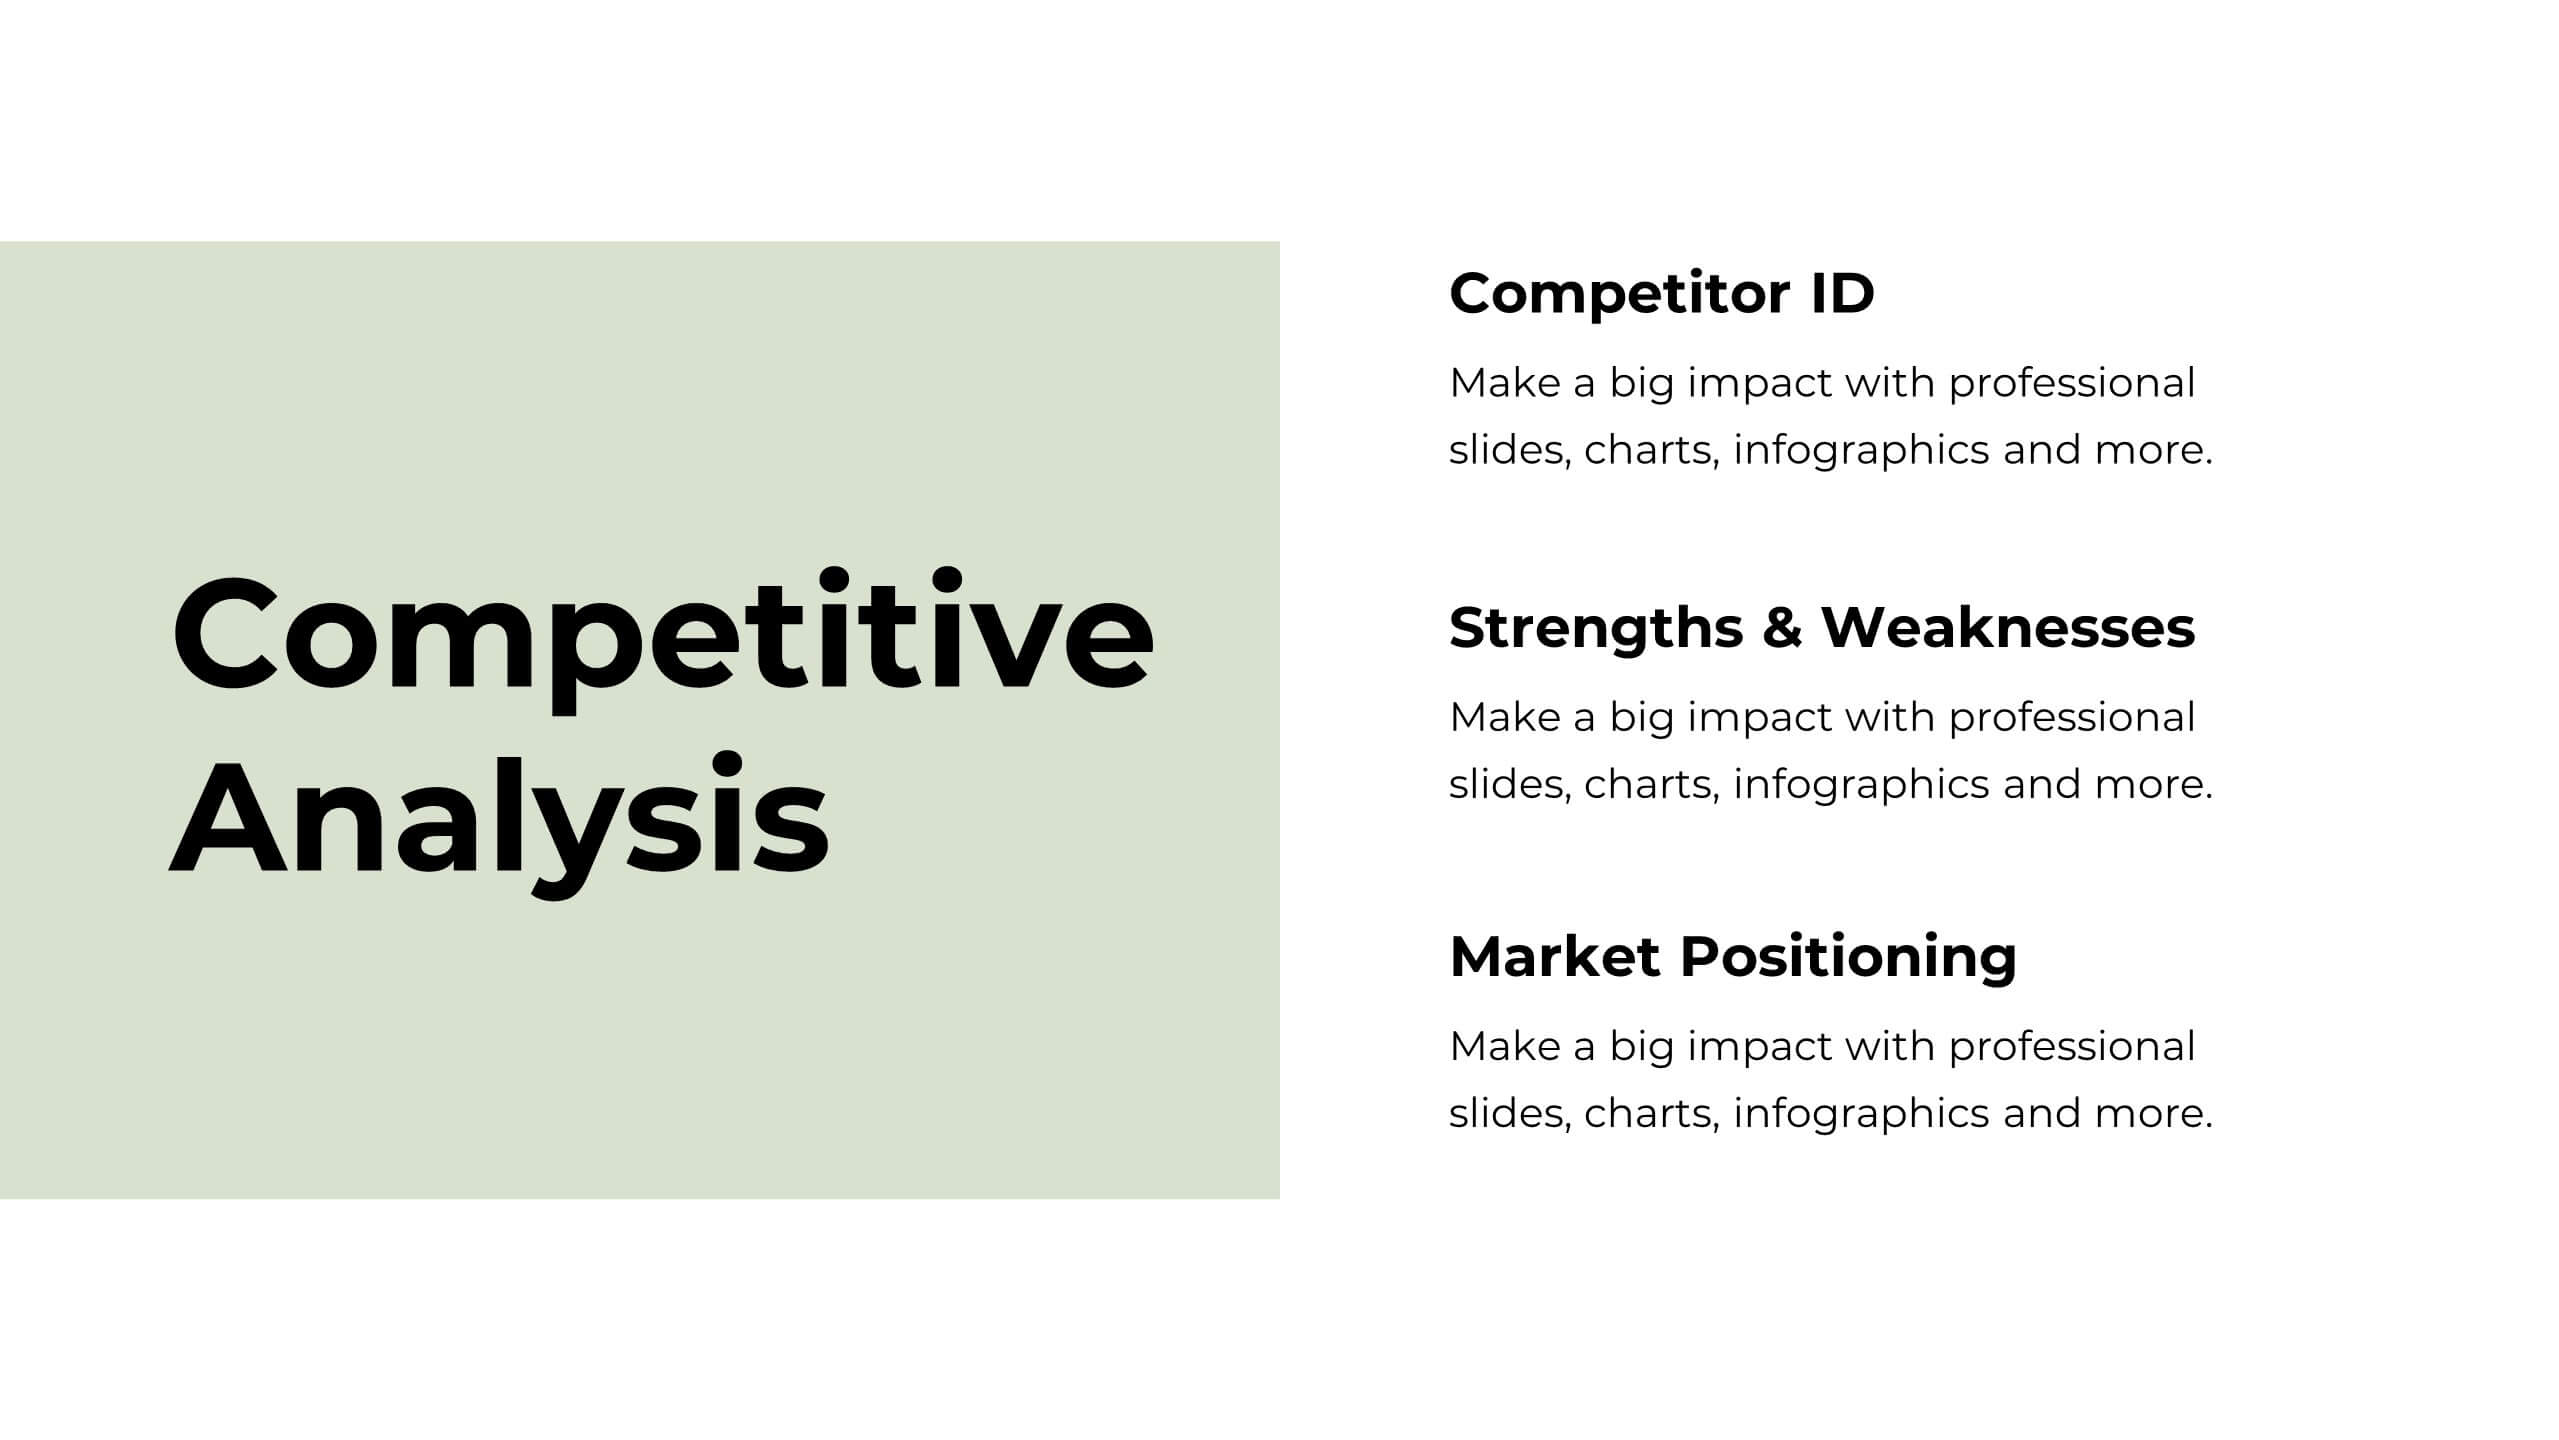
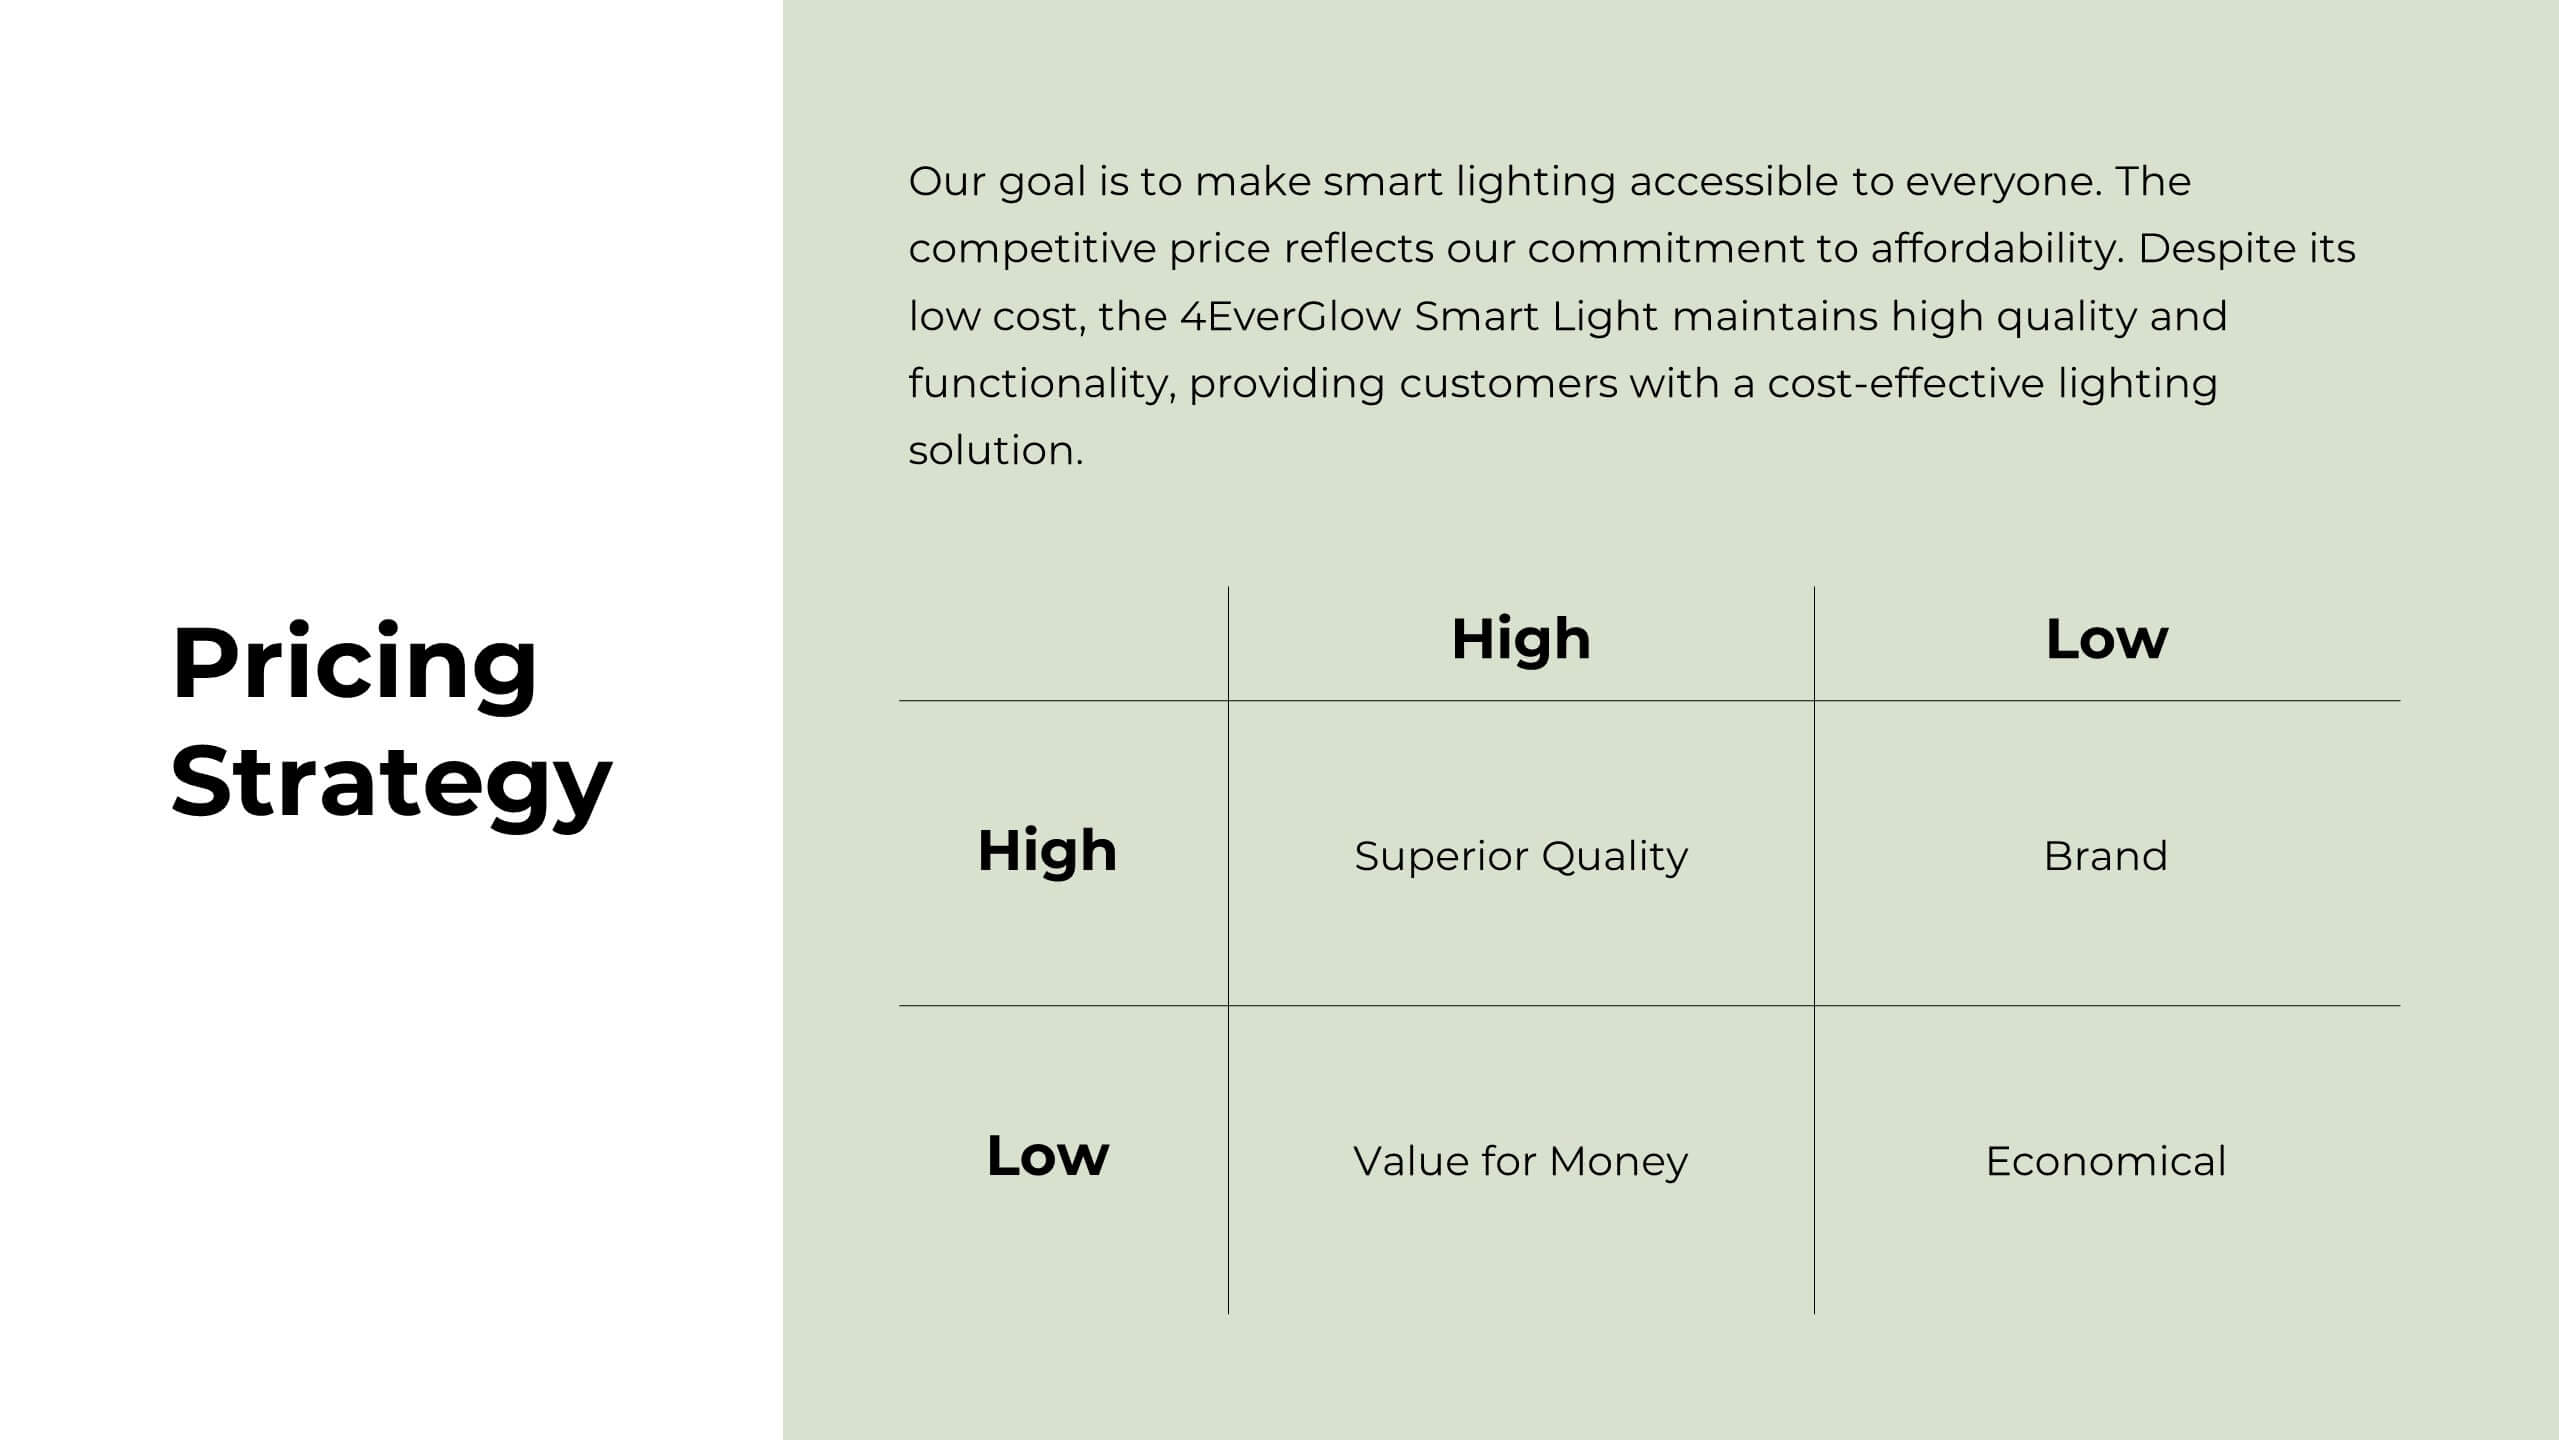
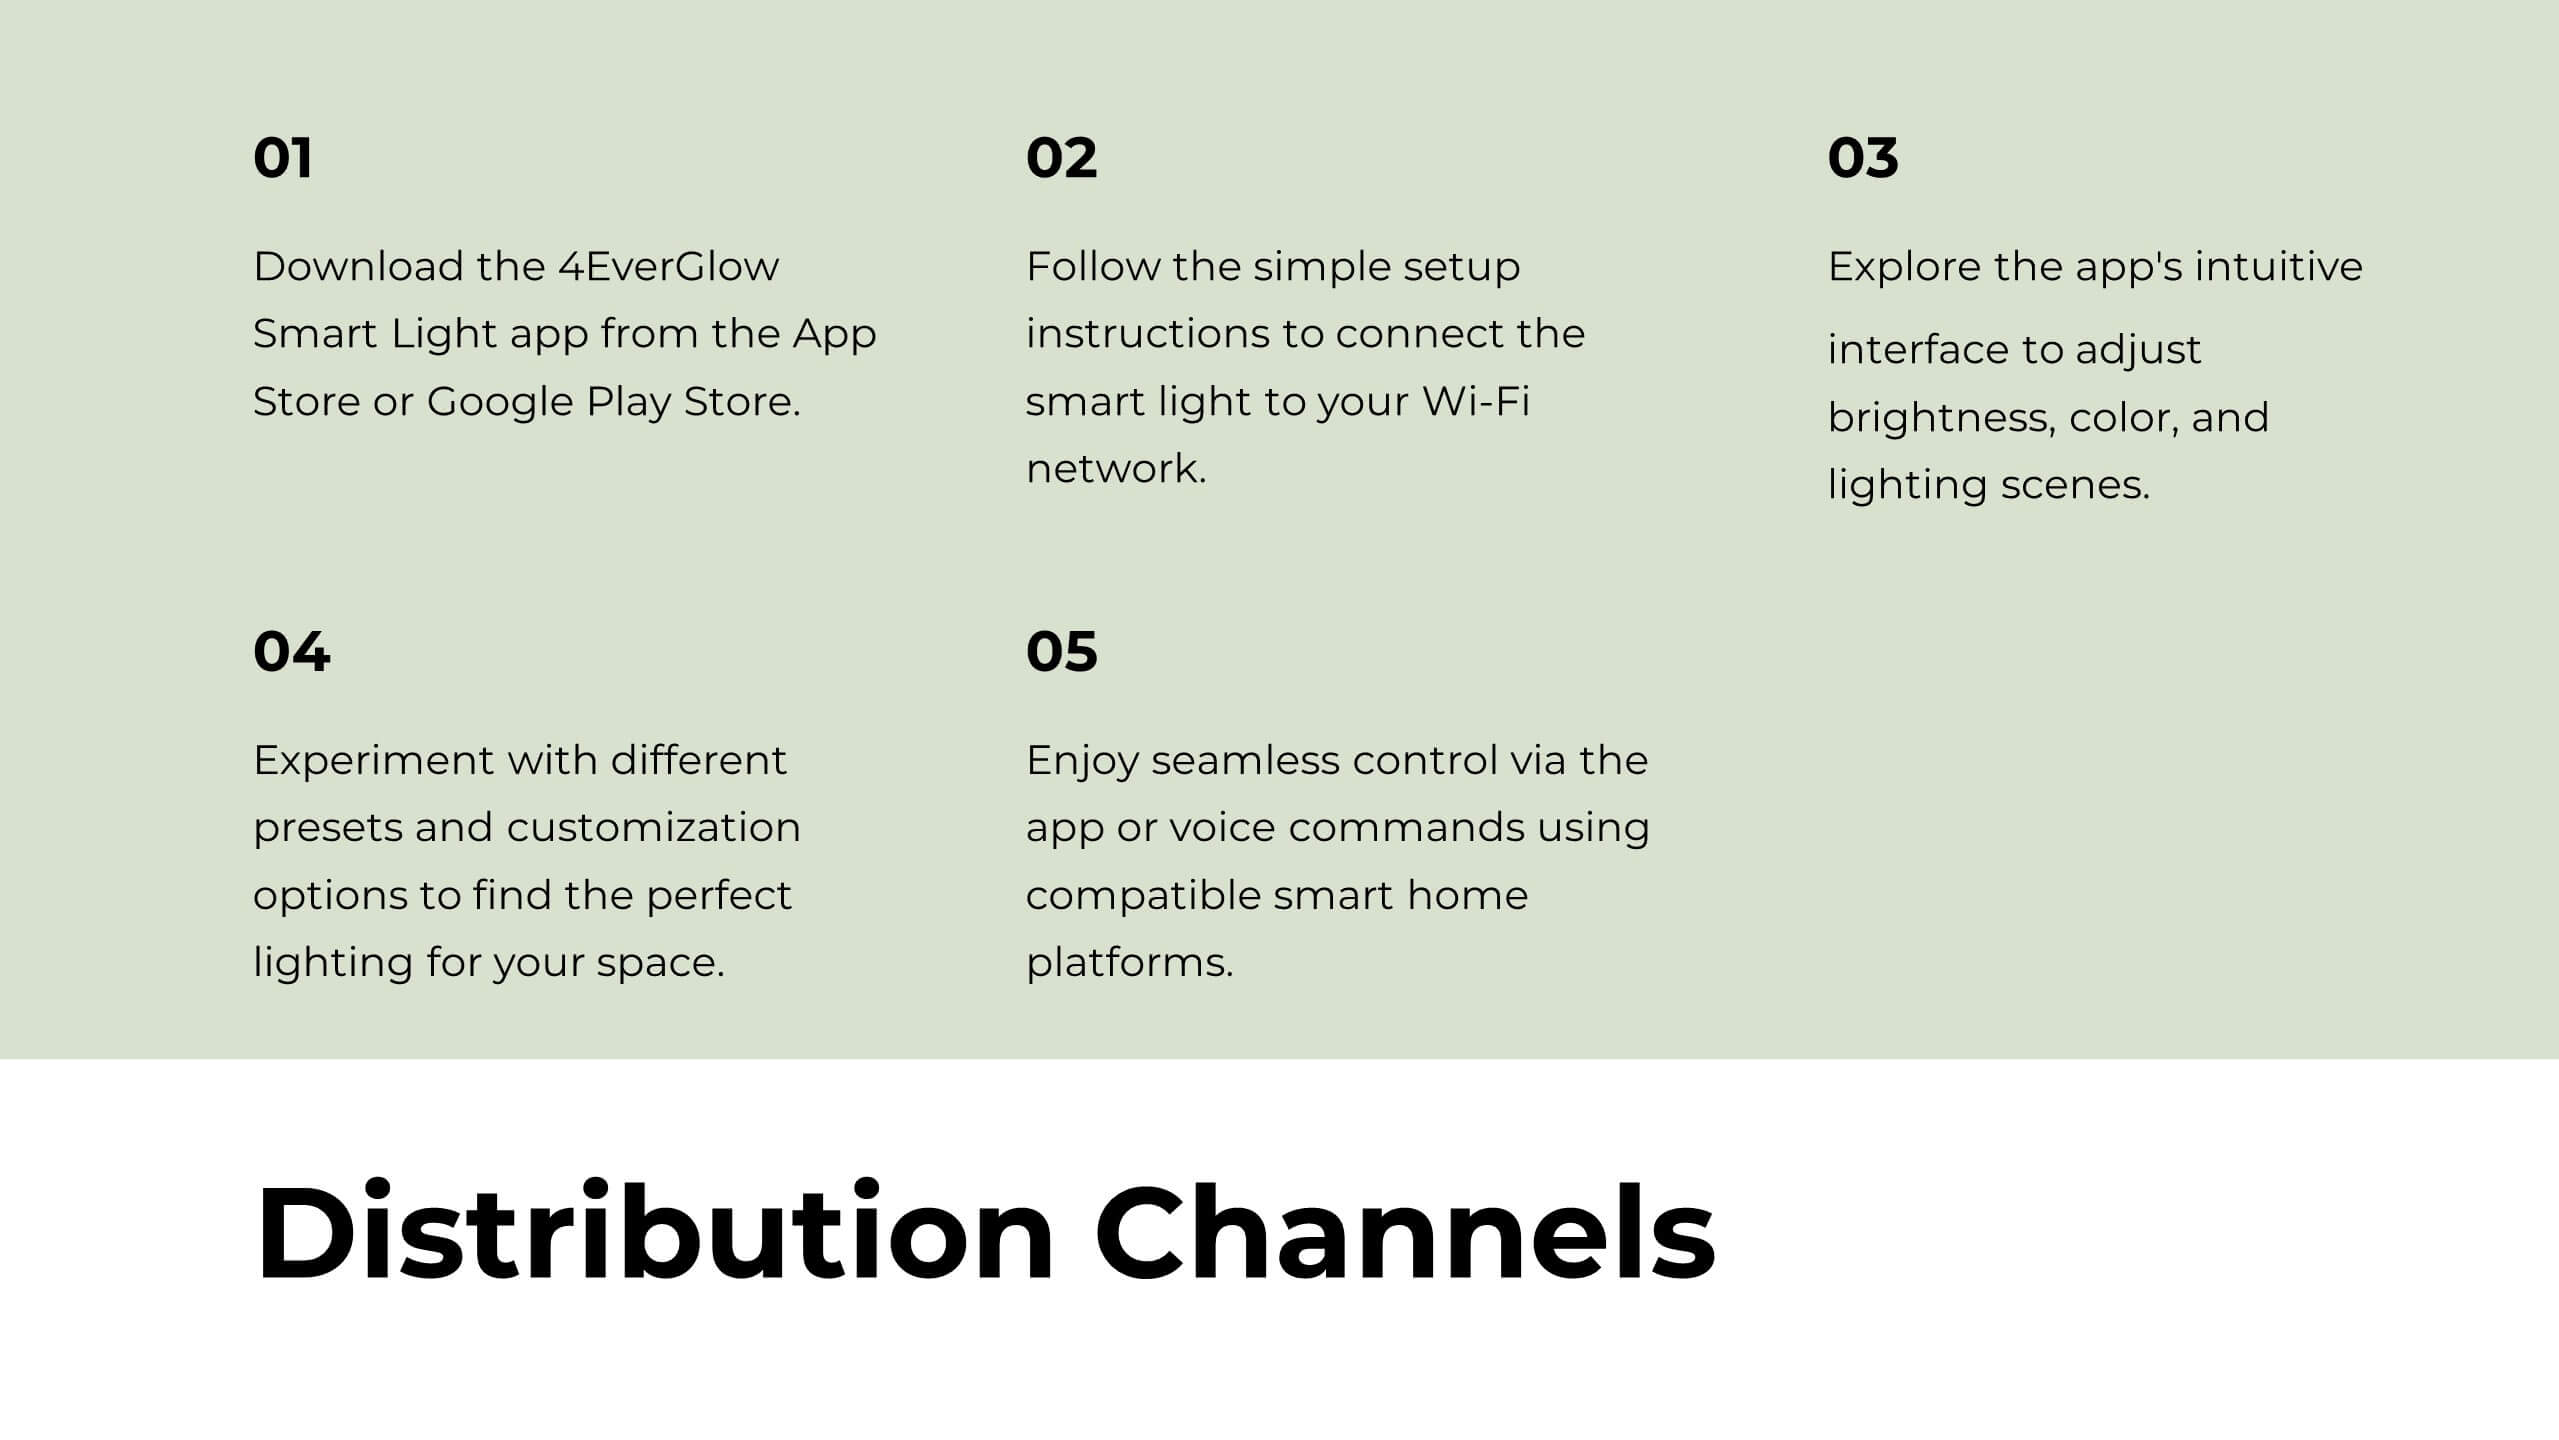
Harpy Product Development Plan Presentation
Present your product development plan with precision using this comprehensive and visually engaging template! It covers essential sections like product features, target market, pricing strategy, competitive analysis, and production process to ensure every aspect is communicated effectively. Perfect for product teams or client pitches, it’s fully compatible with PowerPoint, Keynote, and Google Slides.


20 diapositivas
Creative Marketing Proposal Presentation
Elevate your business proposals with this sleek marketing proposal template, designed in dynamic purple tones. It comprehensively covers everything from company overview to pricing structures, making it perfect for detailing your marketing strategies effectively. Compatible with PowerPoint, Google Slides, and Keynote, it's ideal for professionals aiming to impress clients and secure projects.

20 diapositivas
Glint Product Launch Presentation
Develop your product with confidence using this detailed product development plan template! Perfect for outlining features, market analysis, and competitive advantages. Ensure your team's efforts are aligned and maximize the impact of your product launch. Compatible with PowerPoint, Keynote, and Google Slides, it’s your ideal companion for successful product development.


4 diapositivas
Cybersecurity Risk Protection Plan Presentation
Secure your message with a fingerprint-inspired layout that stands out. This Cybersecurity Risk Protection Plan template breaks down risk mitigation strategies into four clear points—ideal for tech, IT, and compliance presentations. Showcase protocols and data protection methods effectively. Works seamlessly with PowerPoint, Keynote, and Google Slides.


6 diapositivas
Organizational Goals and SMART Objectives Presentation
Align your business vision with clarity using this Organizational Goals and SMART Objectives slide. Designed to visually represent each SMART component—Specific, Measurable, Achievable, Relevant, and Time-bound—it helps communicate strategic goals in a simple and effective format. Fully editable in Canva, PowerPoint, and Google Slides for maximum flexibility.
5 diapositivas
Performance Tracking via Dashboard Widgets Presentation
Visualize performance at a glance with the Performance Tracking via Dashboard Widgets Presentation. This slide layout blends progress tiles, bar charts, and dynamic line graphs to display key metrics over time. Ideal for showcasing reseller performance, goal progress, or trend comparisons in one compact dashboard view. Fully editable in PowerPoint, Google Slides, Keynote, and Canva


12 diapositivas
Quarterly Status Report Presentation
Crafted for clarity and impact, the Quarterly Status Report presentation template efficiently summarizes a period's achievements and insights. The opening slide immediately captivates the audience, clearly setting the stage for a comprehensive review. Subsequent slides meticulously organize critical data points, from financial forecasts to project milestones, allowing for a granular examination of past performance. The report not only reflects on the quarter's outcomes but also offers a well-defined path forward, with strategic recommendations and a thoughtful action plan. Concluding on a note of gratitude, the template acknowledges the audience's time and consideration, while the final credits slide ensures due recognition of all informational sources used throughout the presentation.


26 diapositivas
Networking for Success Presentation Template
Elevate your professional connections and opportunities with this sleek and impactful presentation template designed for networking success. Tailored for professionals, entrepreneurs, and career coaches, it features dynamic layouts for showcasing strategies, tools, and benefits of effective networking. The template includes sections for step-by-step guides, actionable tips, relationship-building techniques, and key metrics to measure success. With modern visuals and well-organized content, it ensures your message is both compelling and easy to follow. Highlight your ideas with infographics, timelines, and data charts to keep your audience engaged. Whether you’re conducting a workshop, pitching a business, or presenting at a seminar, this template adapts to various purposes with ease. Fully customizable and easy to edit, it ensures your presentation reflects your unique style and message. Compatible with PowerPoint, Keynote, and Google Slides, this template makes it simple to deliver a polished and professional presentation across any platform.


5 diapositivas
Defining Target Market and Audience Presentation
Identify and segment your ideal customer base with this visually structured pyramid slide. Designed to represent layered audience demographics or buyer personas, each level allows space for detailed insights and strategy alignment. The accompanying icons and side labels enhance clarity and storytelling for marketing, branding, or campaign planning presentations. Fully editable in PowerPoint, Keynote, and Google Slides to fit your branding and messaging needs.


6 diapositivas
Business Process Improvement via Six Sigma Presentation
Present your process improvement journey with clarity using the Business Process Improvement via Six Sigma Presentation. This linear DMAIC layout guides your audience through each essential phase—Define, Measure, Analyze, Improve, and Control—making it perfect for Lean Six Sigma professionals and operational efficiency teams. Fully editable in PowerPoint, Keynote, Canva, and Google Slides.


4 diapositivas
Types of Cloud Services Presentation
Turn technical concepts into clear, engaging visuals with this sleek and modern template. Perfect for showcasing digital platforms, cloud solutions, and service models, it helps you simplify complex data while maintaining a professional tone. Fully editable and compatible with PowerPoint, Keynote, and Google Slides for easy customization.


6 diapositivas
Clarifying Questions and Response Slide Presentation
Help your audience follow complex topics with the Clarifying Questions and Response Slide Presentation. Designed around a bold question mark layout, this slide format highlights five key clarifications or FAQs alongside thoughtful responses. Ideal for training, onboarding, or product demos, it enhances understanding and engagement. Fully editable in Canva, PowerPoint, Keynote, and Google Slides.


21 diapositivas
Thunderbird Small Business Pitch Deck Presentation
Take flight with this dynamic Thunderbird-inspired presentation, perfect for pitching your small business! Designed to highlight your business model, market potential, and financial projections, this template ensures your pitch is clear, compelling, and professional. Its bold visuals will help you soar. Compatible with PowerPoint, Keynote, and Google Slides.


5 diapositivas
Infographic Business Charts Presentation
Bring your data to life with a bold, visual storytelling layout designed to make insights instantly clear and impossible to ignore. This presentation highlights key metrics using clean, modern business charts that simplify comparisons and trends for any audience. Fully compatible with PowerPoint, Keynote, and Google Slides.


20 diapositivas
Elementra Marketing Proposal Presentation
Elevate your marketing initiatives with this professional and well-structured proposal template. Covering essential sections such as objectives, goals, budget breakdown, timeline, and pricing structure, this presentation helps you effectively communicate your strategy to stakeholders and clients. Its clean, modern design ensures clarity and engagement, making it ideal for pitching ideas and securing approvals. Fully customizable and compatible with PowerPoint, Keynote, and Google Slides.


4 diapositivas
Professional Business Meeting Agenda Presentation
Efficiently structure your next corporate gathering with the "Professional Business Meeting Agenda" presentation template. Its geometrically appealing layout organizes discussion points in a visually captivating manner, encouraging effective communication and engagement. Perfect for strategizing sessions, this template ensures that every item on your agenda is highlighted with clarity. Compatible across PowerPoint, Keynote, and Google Slides, it’s designed to make every meeting more productive.


8 diapositivas
Data Analytics Dashboard Slide Presentation
Turn raw data into visual insights with this clean and modern layout designed to simplify analytics reporting. Perfect for tracking performance metrics, KPIs, and progress updates, it helps make numbers easy to understand at a glance. Fully customizable and compatible with PowerPoint, Keynote, and Google Slides for effortless editing.