


Características


¿Tienes alguna pregunta?
Recomendar
22 diapositivas
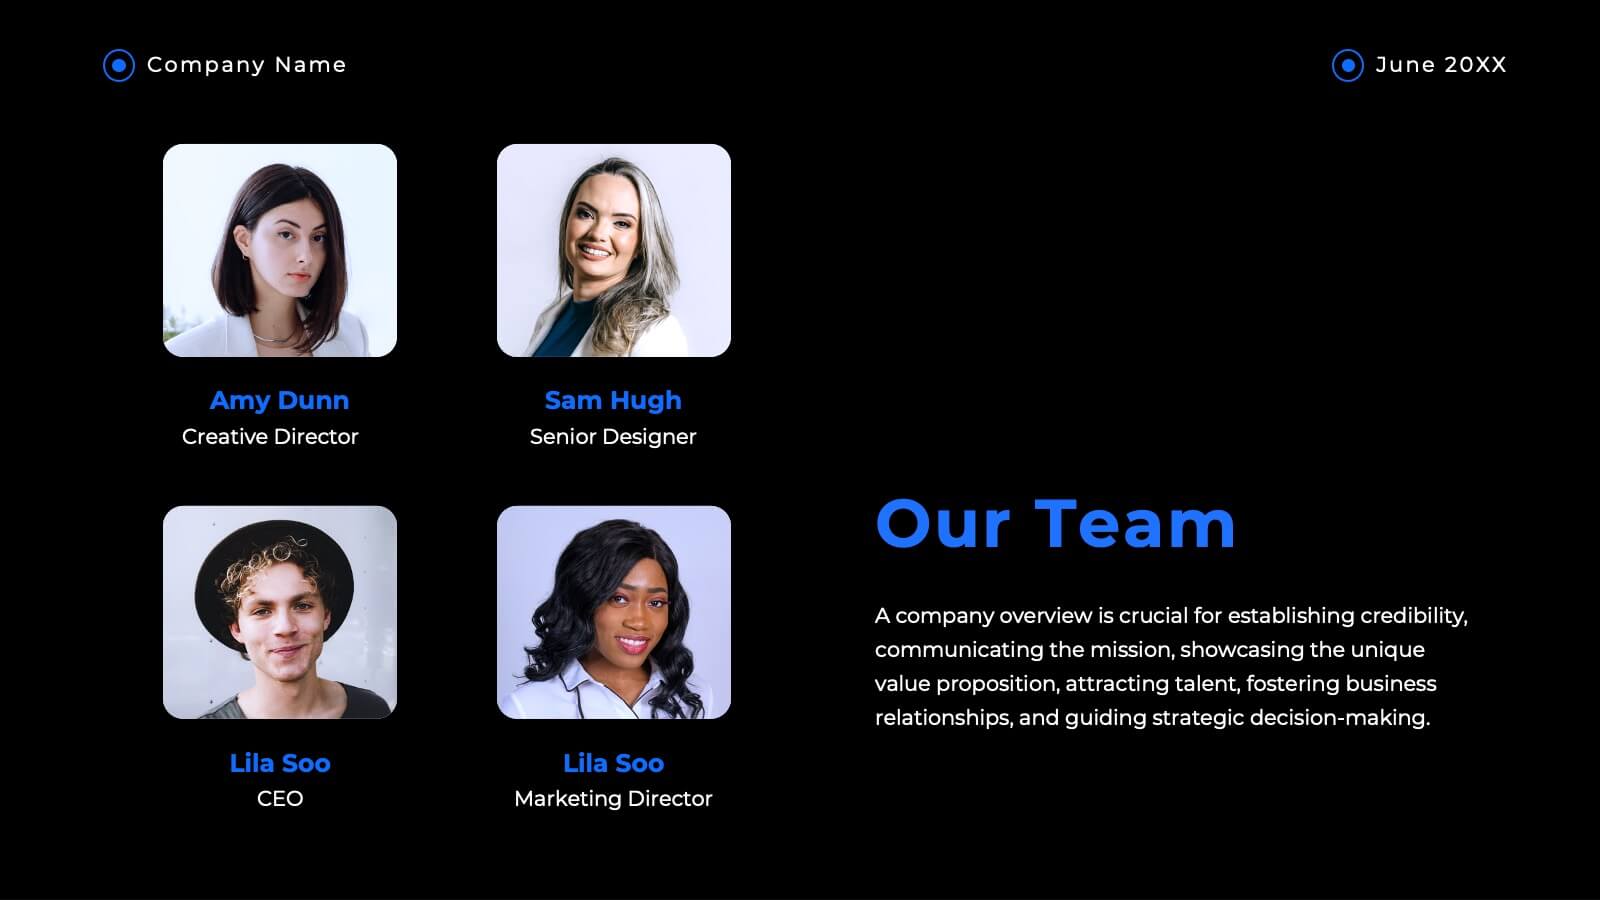
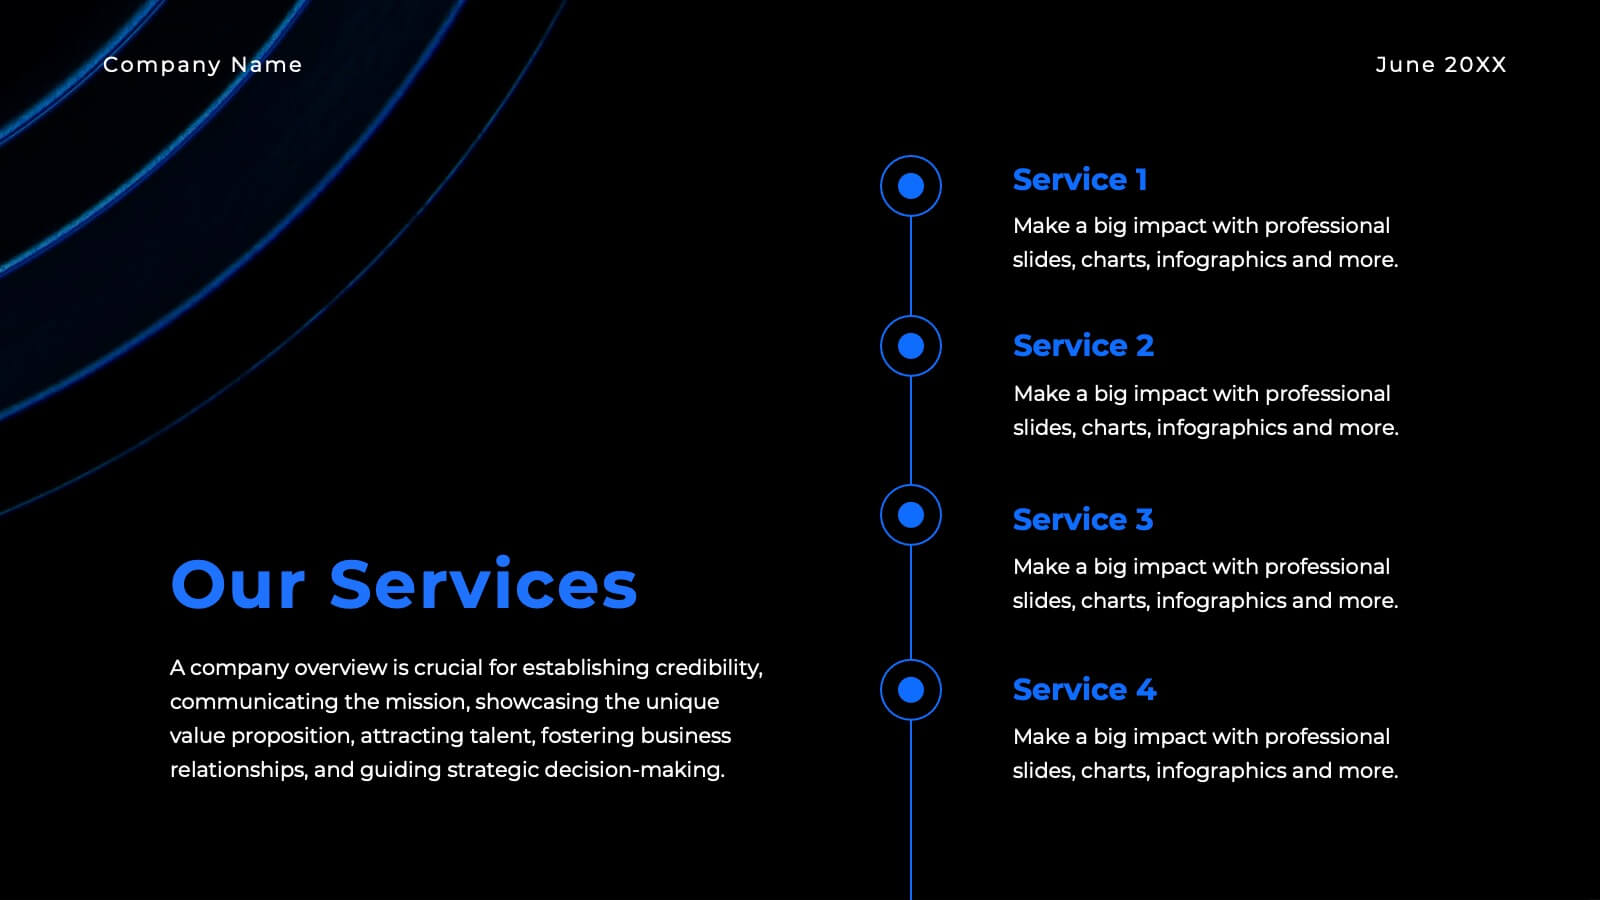
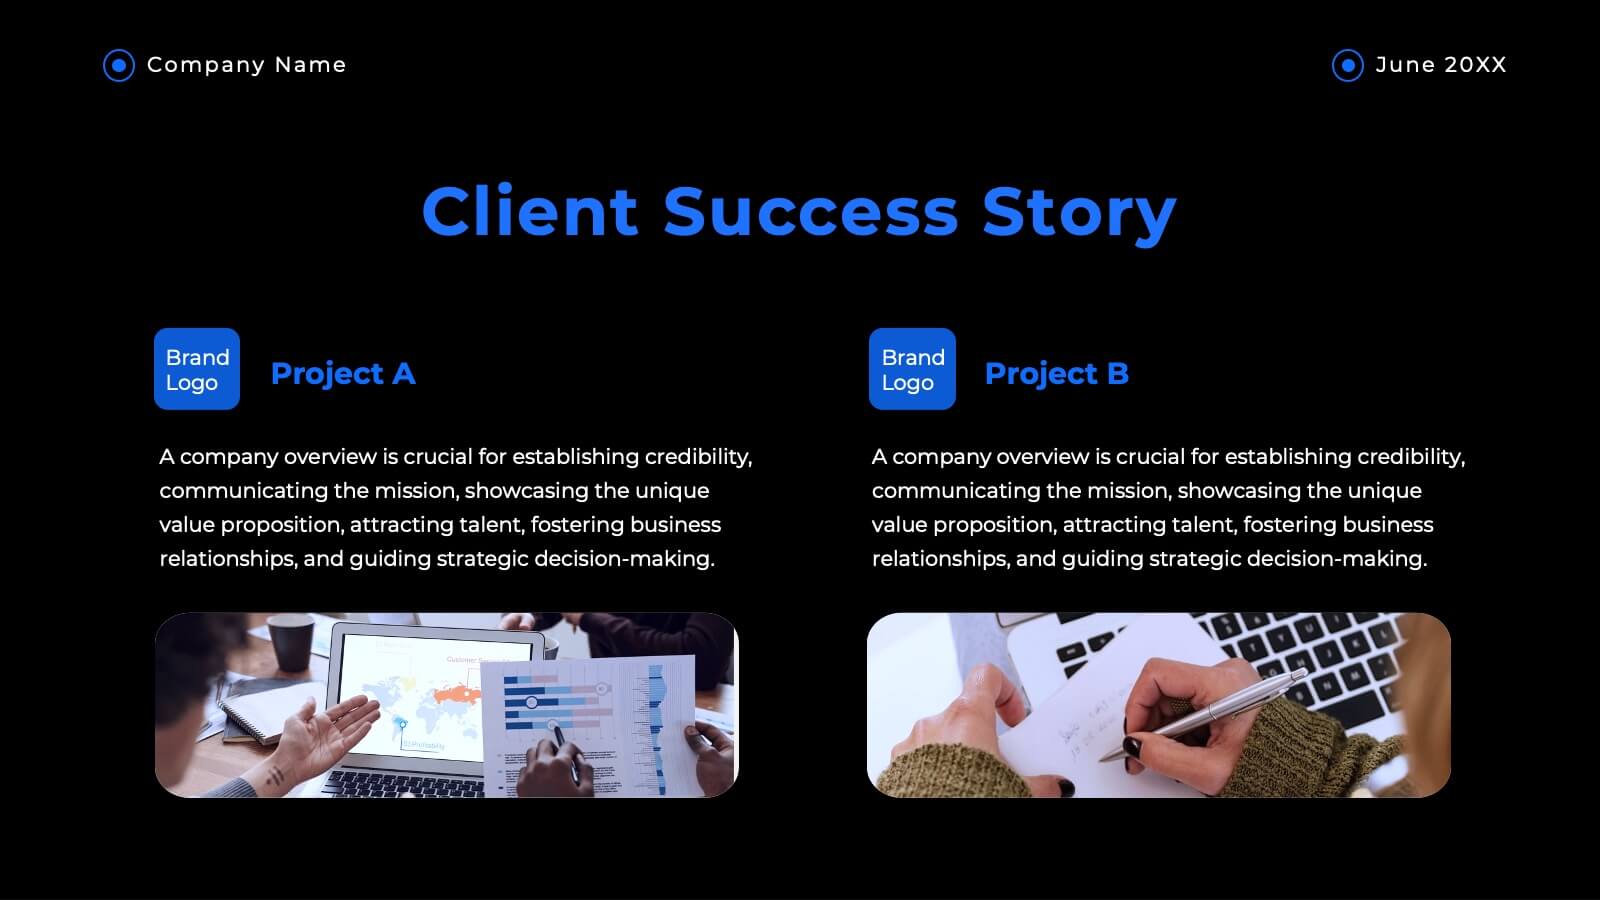
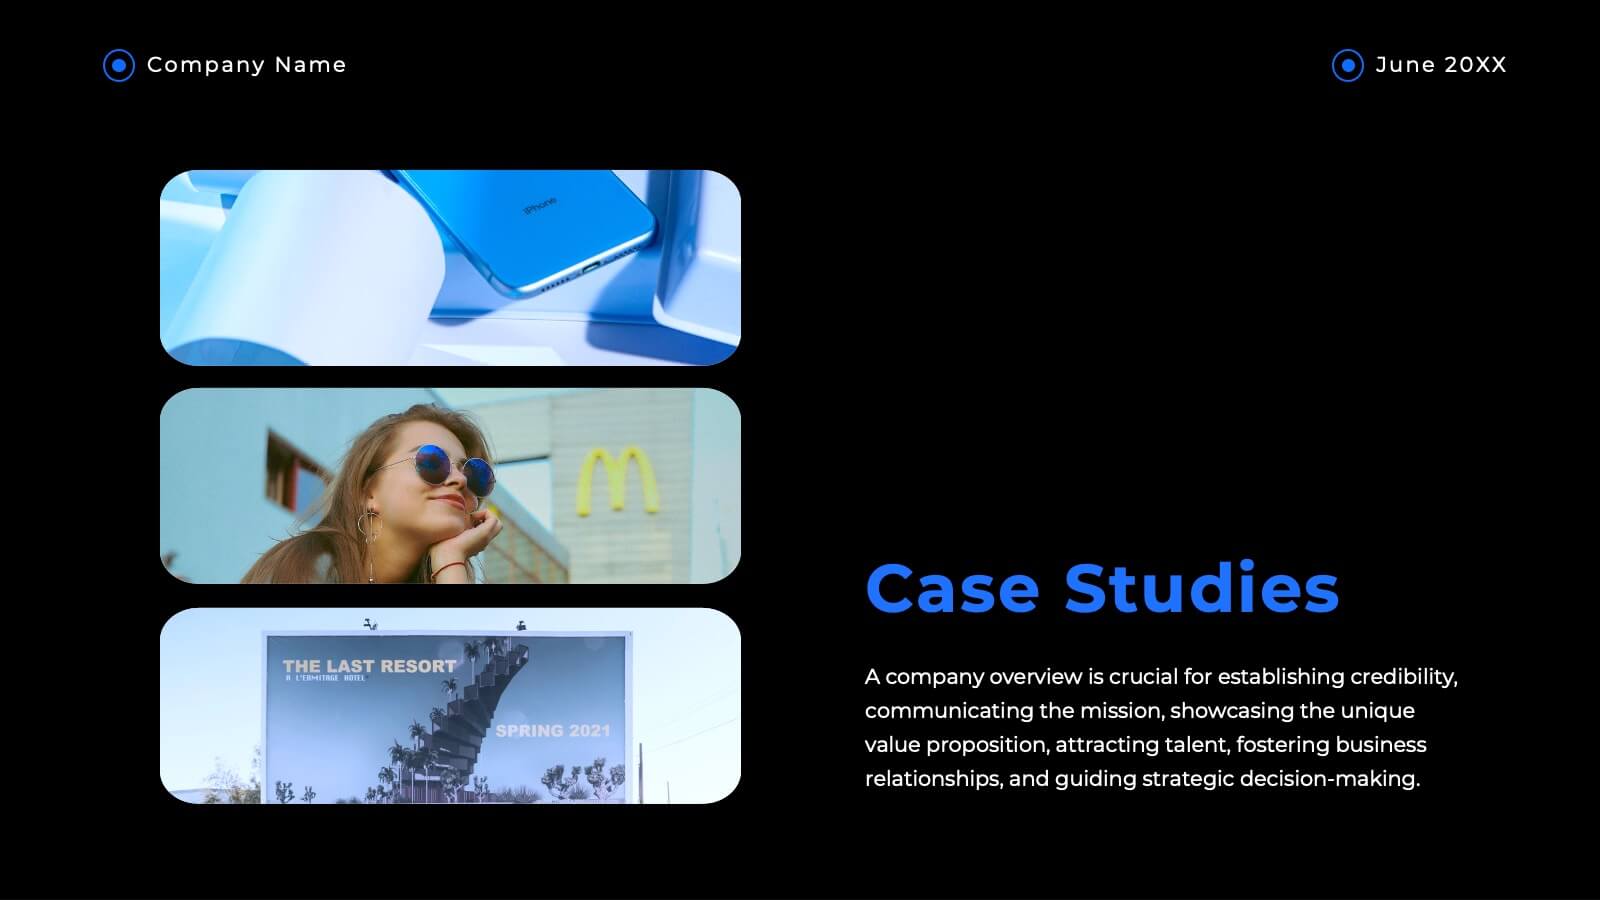
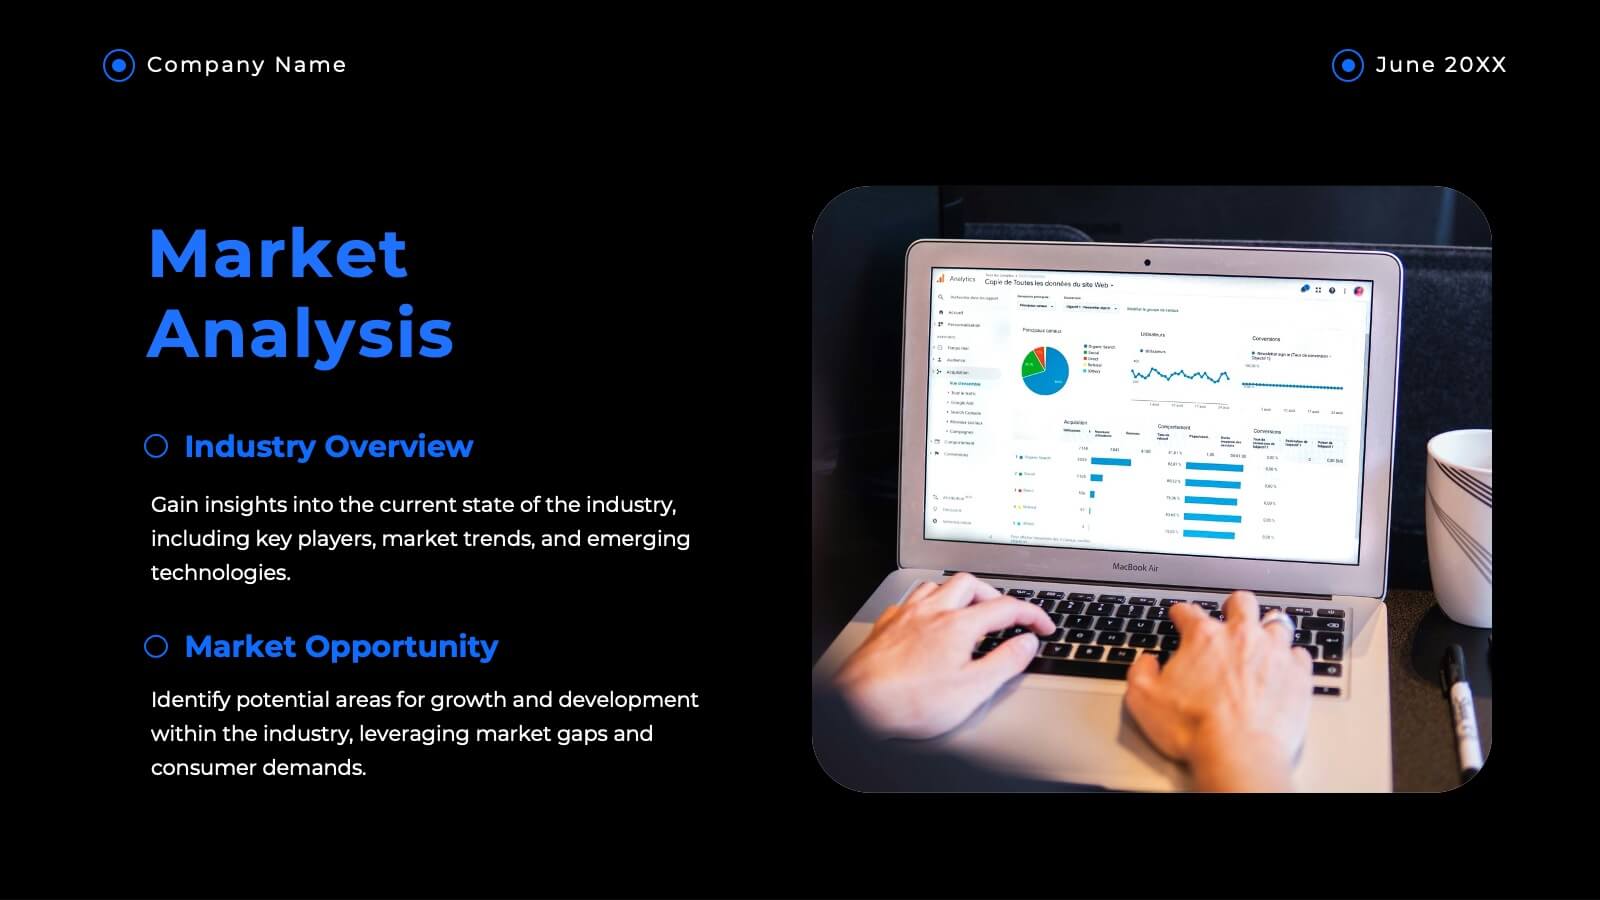
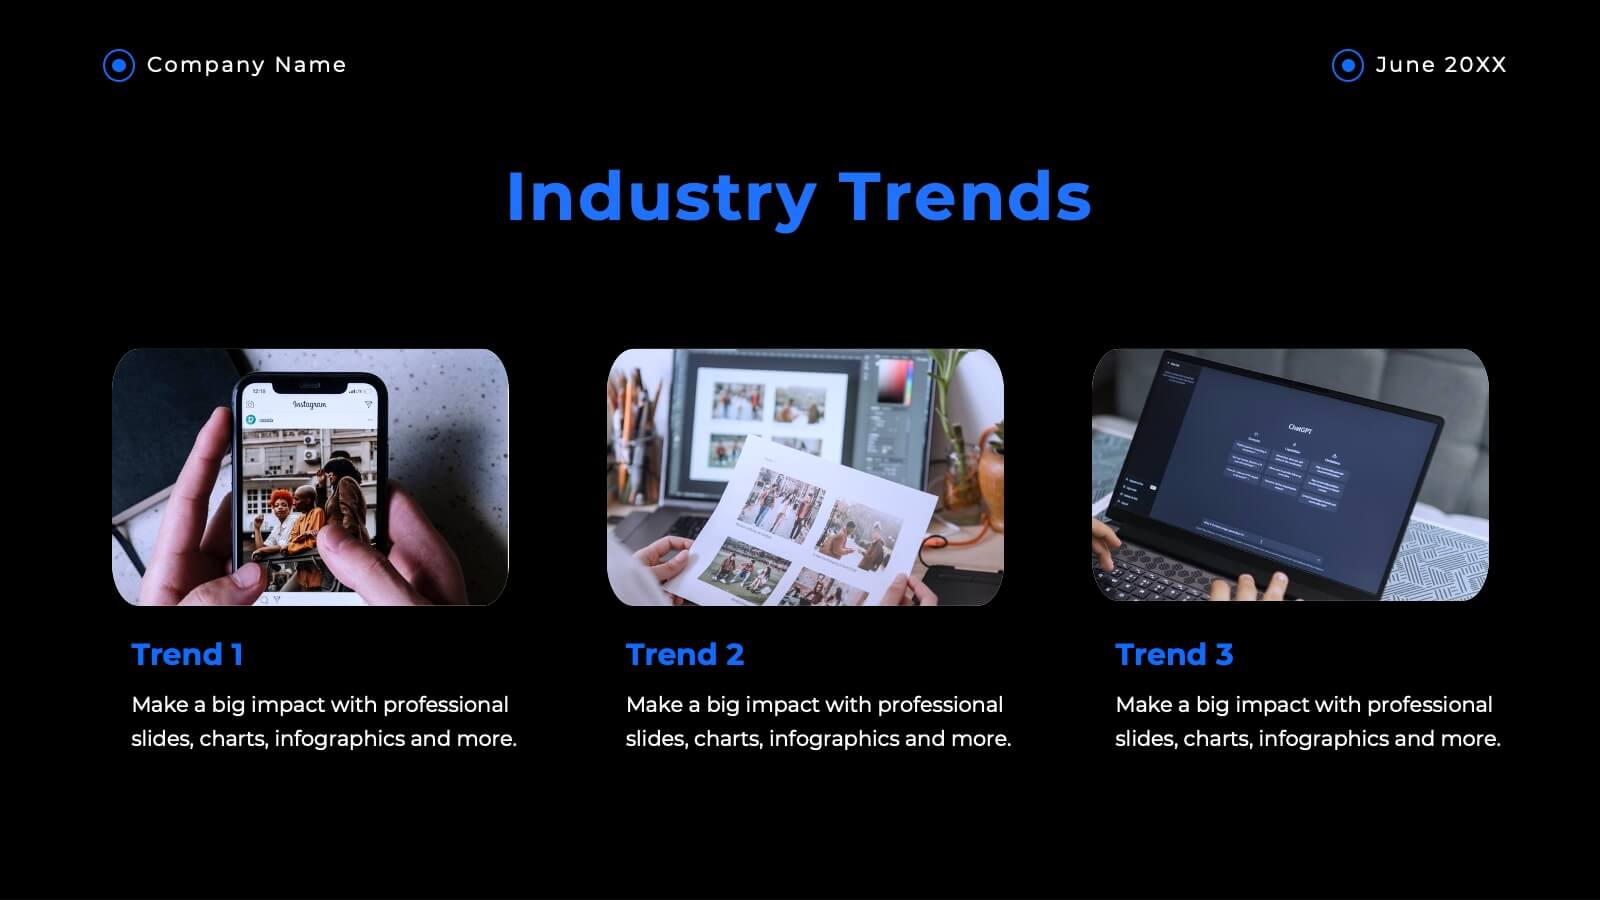
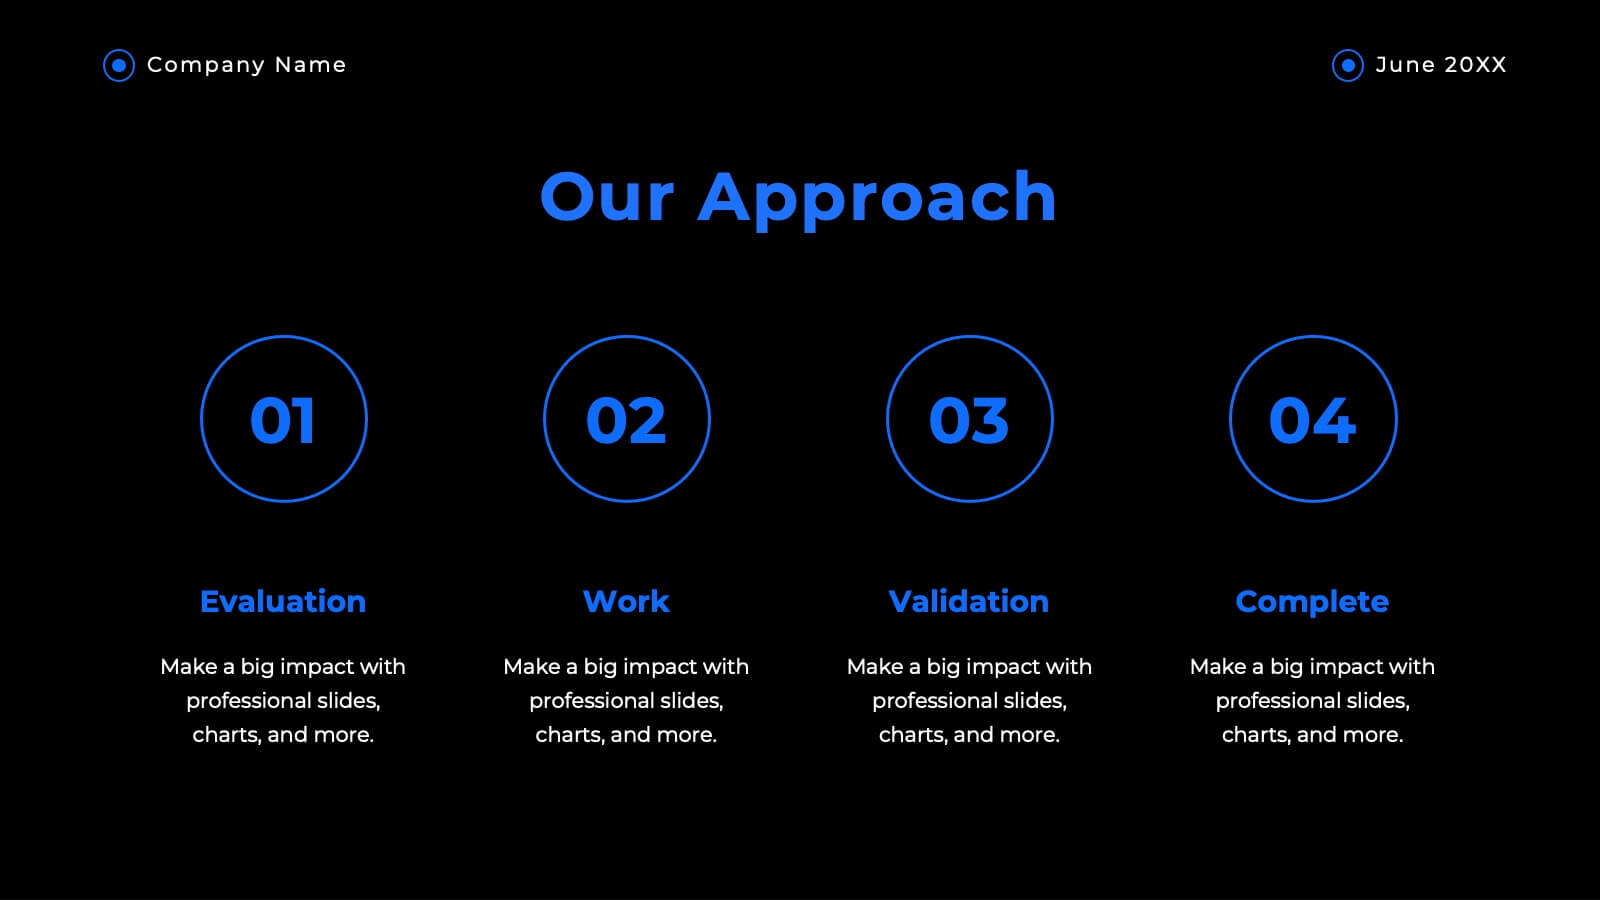
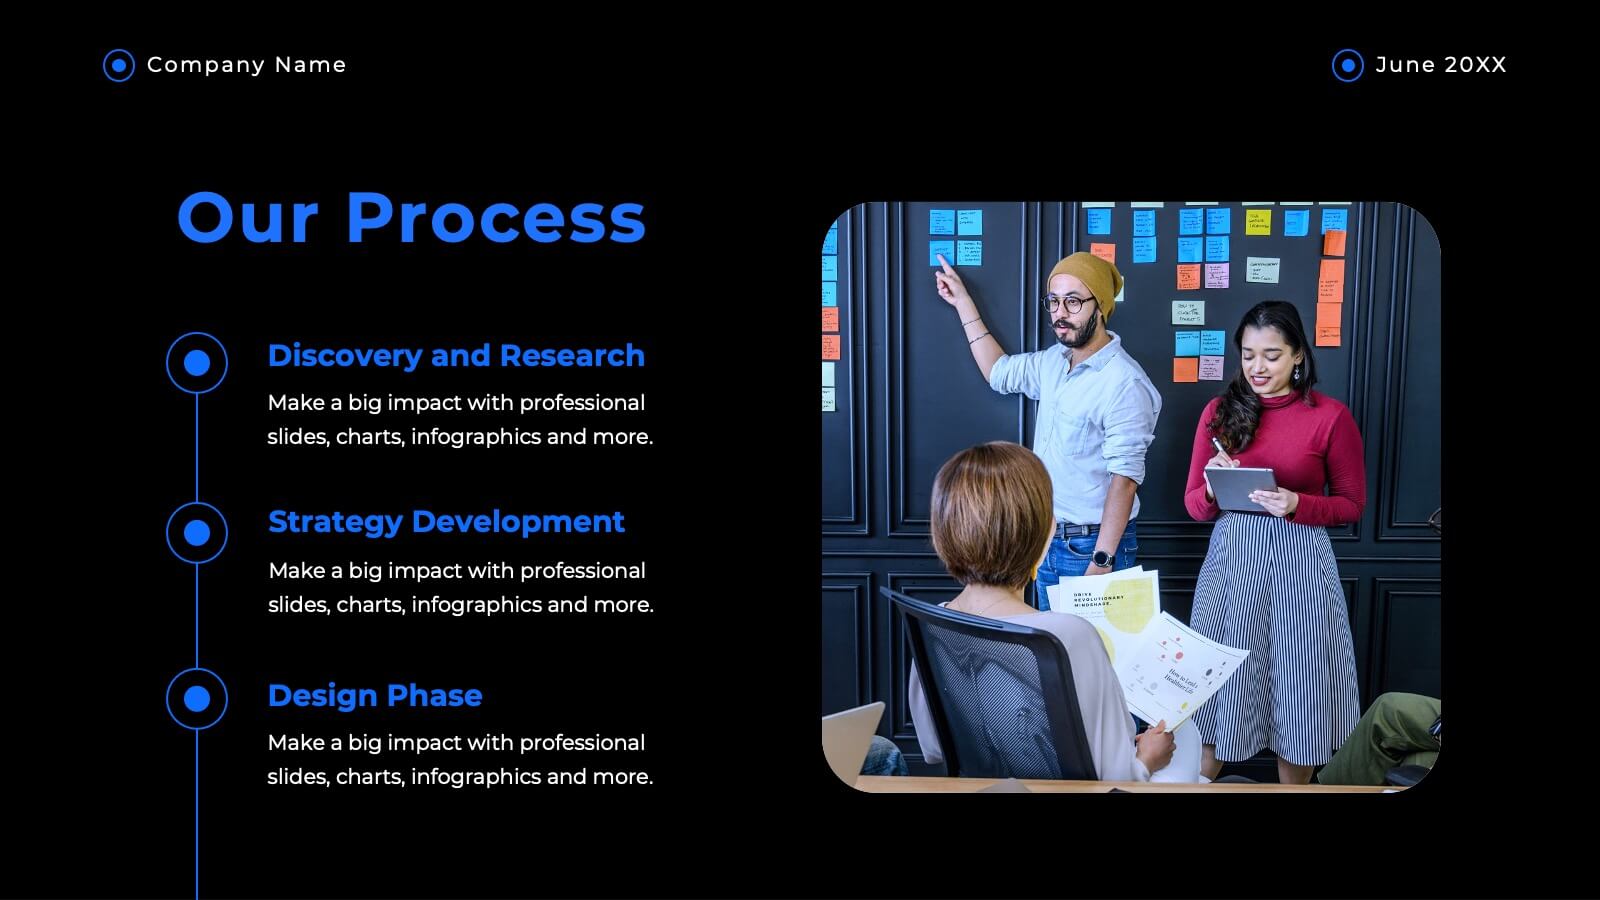
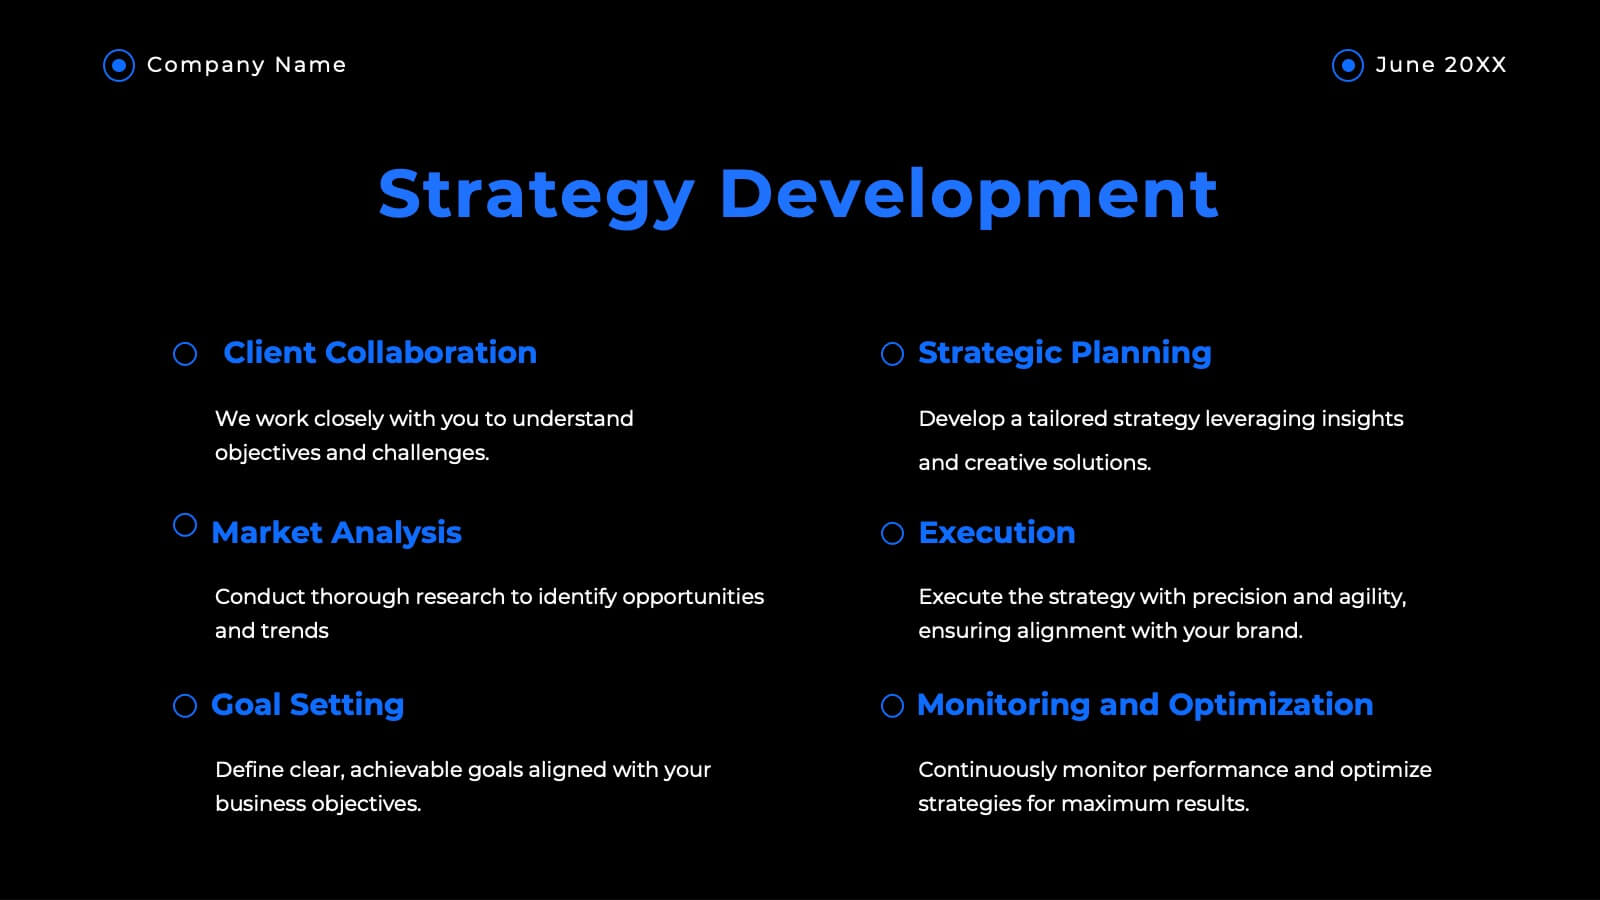
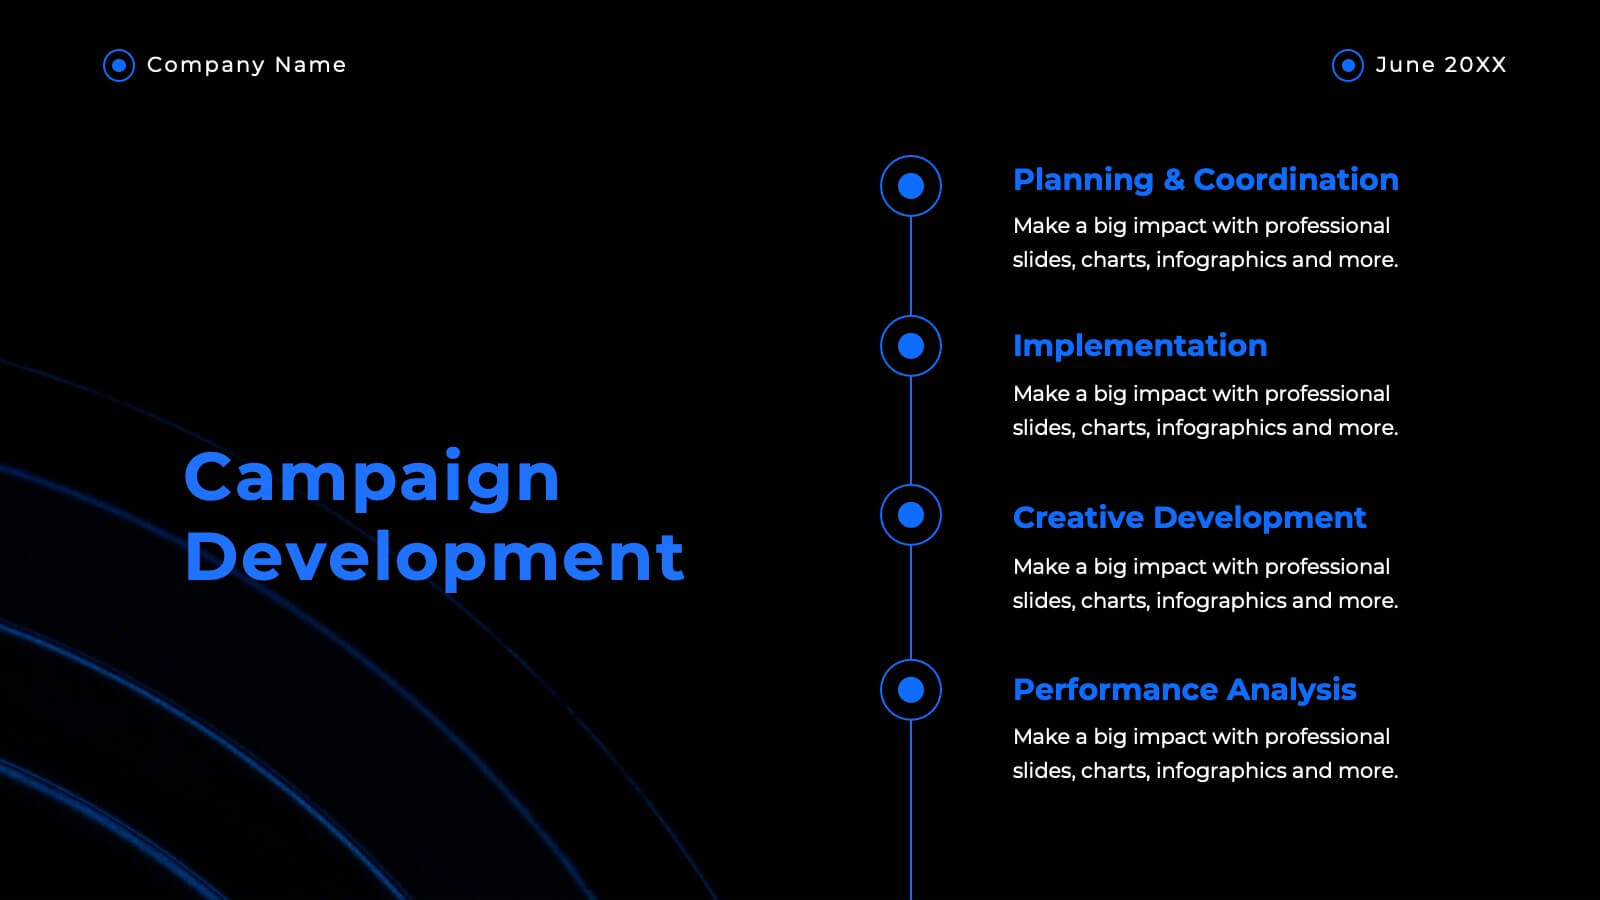
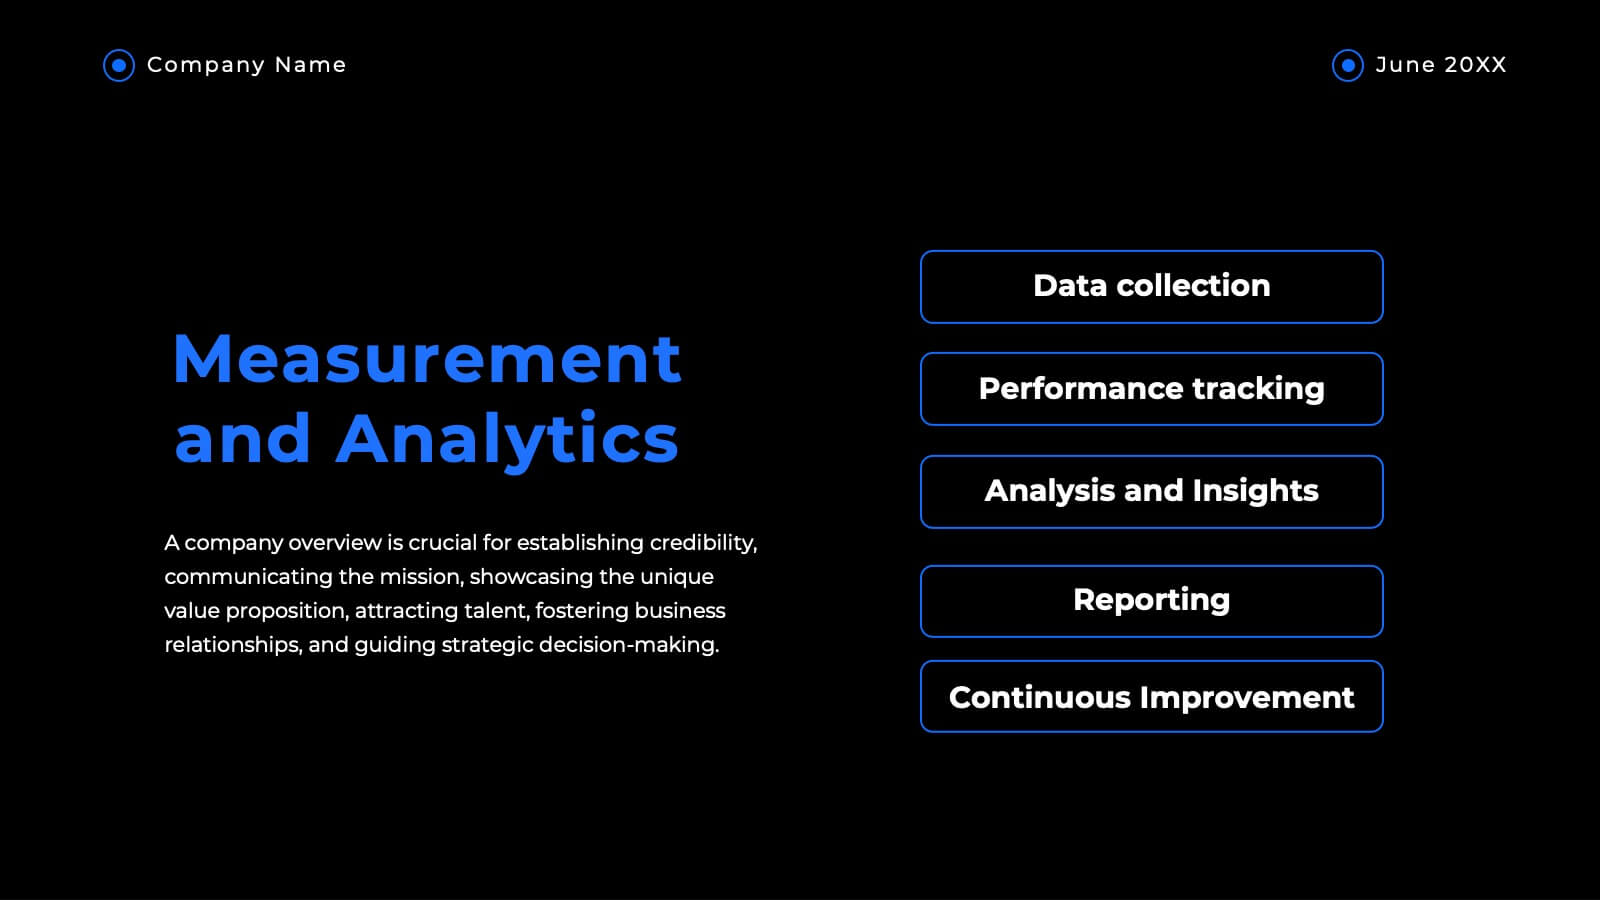
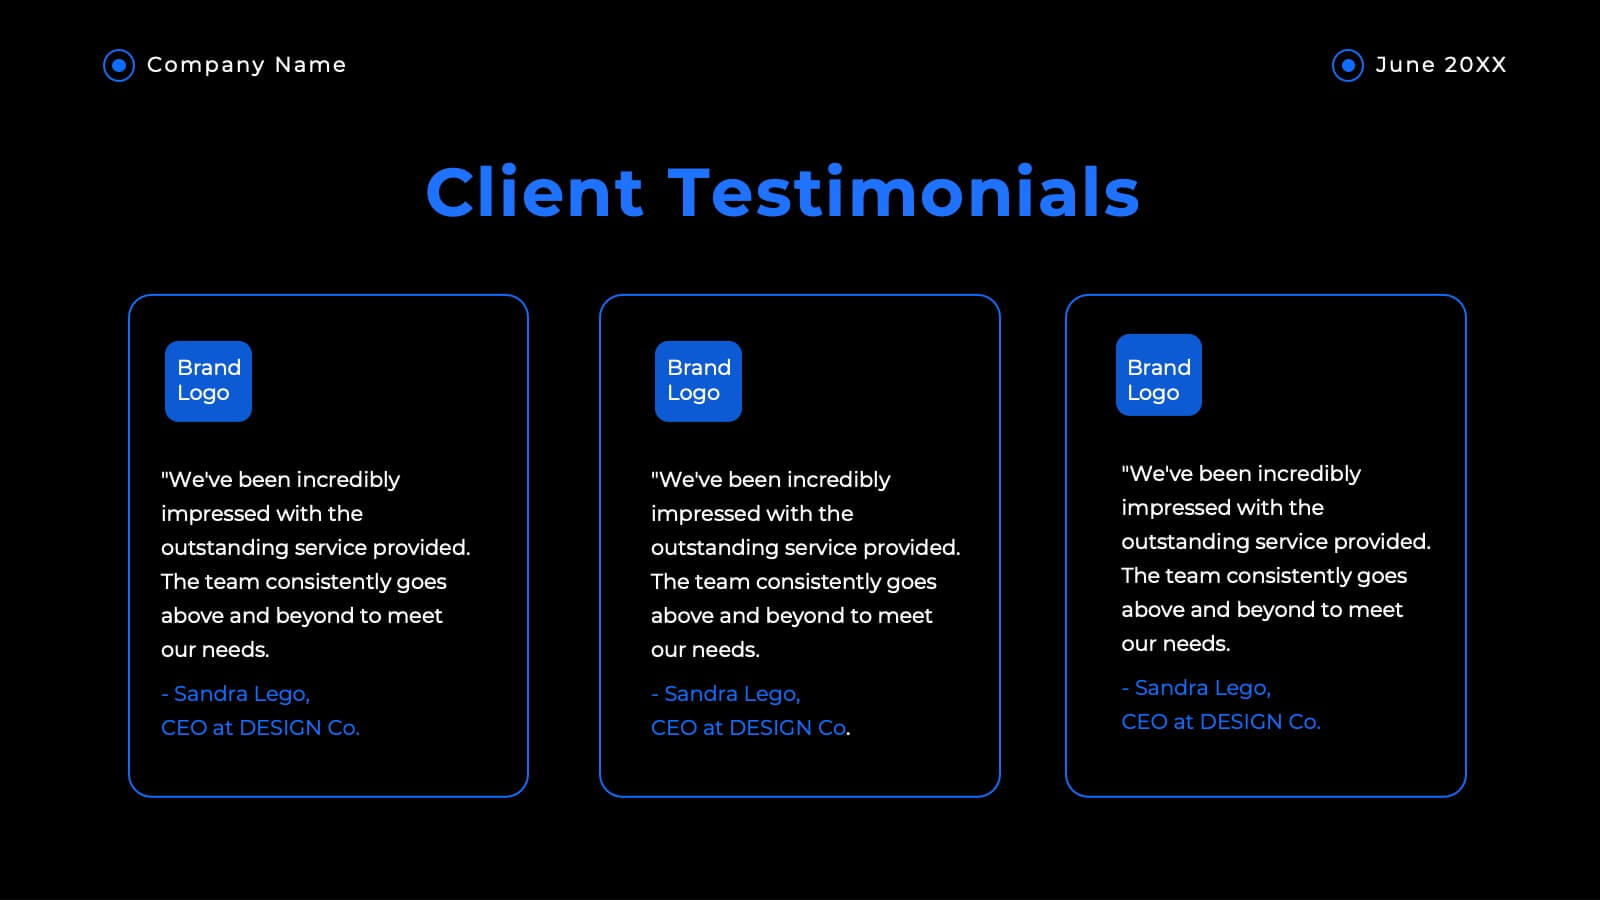
Haven Advertising Agency Proposal Presentation
Wow your clients with this sophisticated agency presentation template! Perfect for showcasing your services, client success stories, and market analysis. Ideal for agencies looking to impress and secure new business. Compatible with PowerPoint, Keynote, and Google Slides, this template ensures your proposals stand out with professional elegance. Perfect for any pitch or proposal.


6 diapositivas
Global Sourcing and Distribution Presentation
Present your supply strategy with clarity using the Global Sourcing and Distribution Presentation. This slide features a central sourcing hub with segmented groups to illustrate regional or functional distribution channels. Ideal for global logistics, procurement planning, or stakeholder reporting. Fully editable in PowerPoint, Keynote, and Google Slides.


5 diapositivas
New Hire Employee Onboarding Flow Presentation
Make a lasting first impression with a clear, engaging flow that guides new hires through every step of their onboarding journey. Perfect for HR teams and managers, this presentation simplifies complex processes with visual structure and clarity. Fully compatible with PowerPoint, Keynote, and Google Slides for easy customization and use.


23 diapositivas
Zenith Product Launch Pitch Deck Presentation
Launch your product successfully with this compelling pitch deck! Perfect for presenting company overview, problem statements, and market opportunities. Ideal for startups and entrepreneurs aiming to attract investors and stakeholders. Compatible with PowerPoint, Keynote, and Google Slides, this template ensures your pitch is clear, persuasive, and professional. Secure your product's success today!


6 diapositivas
Medical Technologies Infographics
Explore the forefront of medical technology with this informative and sleek infographic template, tailored for professionals and students in the medical field. This template effectively presents key advancements and projects in medical technology, using a modern and clear design that is easy to follow. The slides are organized to detail different aspects of technology in healthcare, such as innovation in patient care, technological integration into existing systems, and future trends in the industry. Each section uses vibrant graphics and concise text to highlight important data and statistics, ensuring the information is both accessible and engaging. The color scheme is professionally chosen to represent trust and clarity, utilizing shades of blue and red to differentiate topics effectively. This not only enhances readability but also aligns with the themes of healthcare and technology. This template is a perfect tool for presenting at conferences, in educational settings, or during professional meetings where understanding the impact of technology on healthcare is crucial. It helps to convey complex information in a structured and visually appealing manner, making it an invaluable resource for anyone involved in the health technology sector.


4 diapositivas
IT Infrastructure Overview Presentation
Map out your digital ecosystem with this IT Infrastructure Overview Presentation. Featuring a cloud-based diagram with interconnected folders and icons, this slide helps communicate key components of your organization’s infrastructure—from servers and databases to networks and cloud solutions. Great for explaining system architecture or IT service flows. Fully customizable in PowerPoint, Keynote, and Google Slides.


7 diapositivas
Loyalty Program Infographic Presentation Template
Loyalty programs are effective marketing tools that encourage consistent customers and offer an incentive for people to make more purchases from you. This template is perfect for you and your customers it helps present all your information in one presentation. This template is made to be displayed to your customers and workplace. You can use this to show your customers how they are given points or rewards every time they purchase from your store. The fun colorful illustrations used in this template are designed to help your customers understand how the program works and get them excited about it.


4 diapositivas
Business Growth and Strategy Plan Presentation
Showcase your company’s path forward with this Business Growth and Strategy Plan Presentation. Designed with a curved arrow layout, it visually maps out three key milestones or initiatives. Ideal for strategic roadmaps, planning sessions, or executive updates. Fully editable in Canva, PowerPoint, or Google Slides.


34 diapositivas
Bootstrapping Pitch Deck
Introducing our Bootstrapping Pitch Deck presentation! This template is designed to help you create a compelling pitch deck for your startup or business. With its minimal and modern design, this template will help you communicate your approach and showcase your business to potential investors, partners, or stakeholders. The slides are designed with a minimalist layout that allows for easy comprehension and emphasizes the key points of your pitch. The visuals, such as charts, graphs, and icons, are strategically used to convey information in a visually engaging manner and support your key messages. This template is fully customizable.


4 diapositivas
Empathy Mapping for Product Development Presentation
Strengthen user understanding with the Empathy Mapping for Product Development Presentation. This template helps teams visualize what users think, feel, say, and do—essential for creating intuitive products and experiences. Ideal for design sprints, UX workshops, and product planning sessions. Fully editable in PowerPoint, Keynote, Canva, and Google Slides.


4 diapositivas
Interactive Learning Models Presentation
Illustrate step-by-step learning journeys with this creative, hand-drawn infographic layout. Ideal for training modules, course planning, or educational workflows, this slide highlights three key insights with interactive appeal. Fully editable in PowerPoint, Keynote, and Google Slides—perfect for educators, trainers, and instructional designers looking to boost engagement.


20 diapositivas
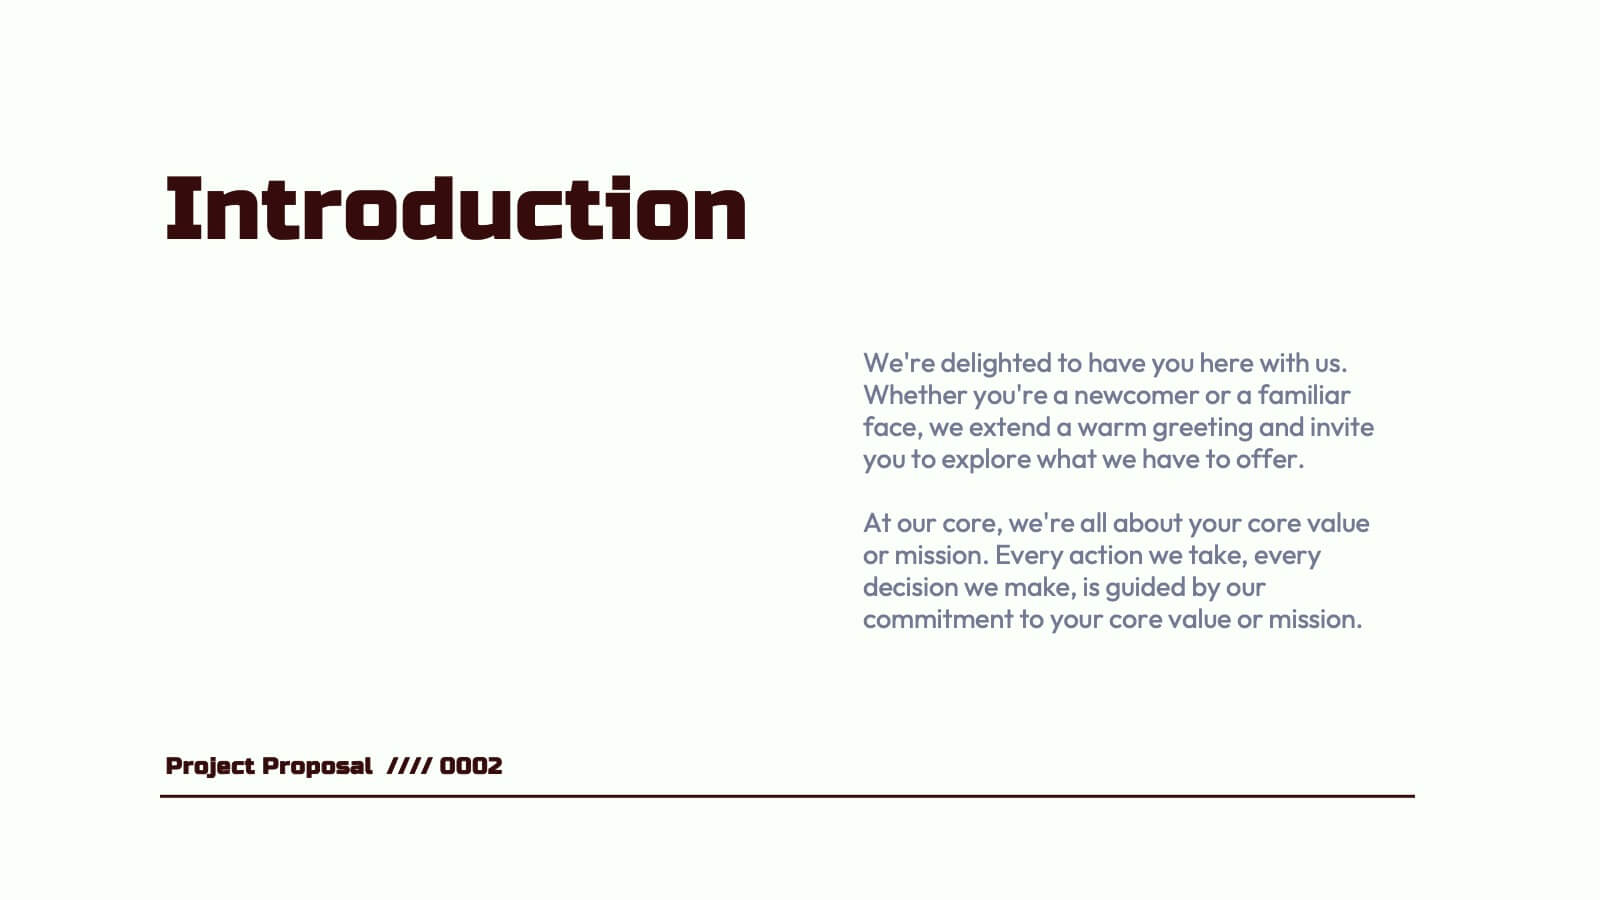
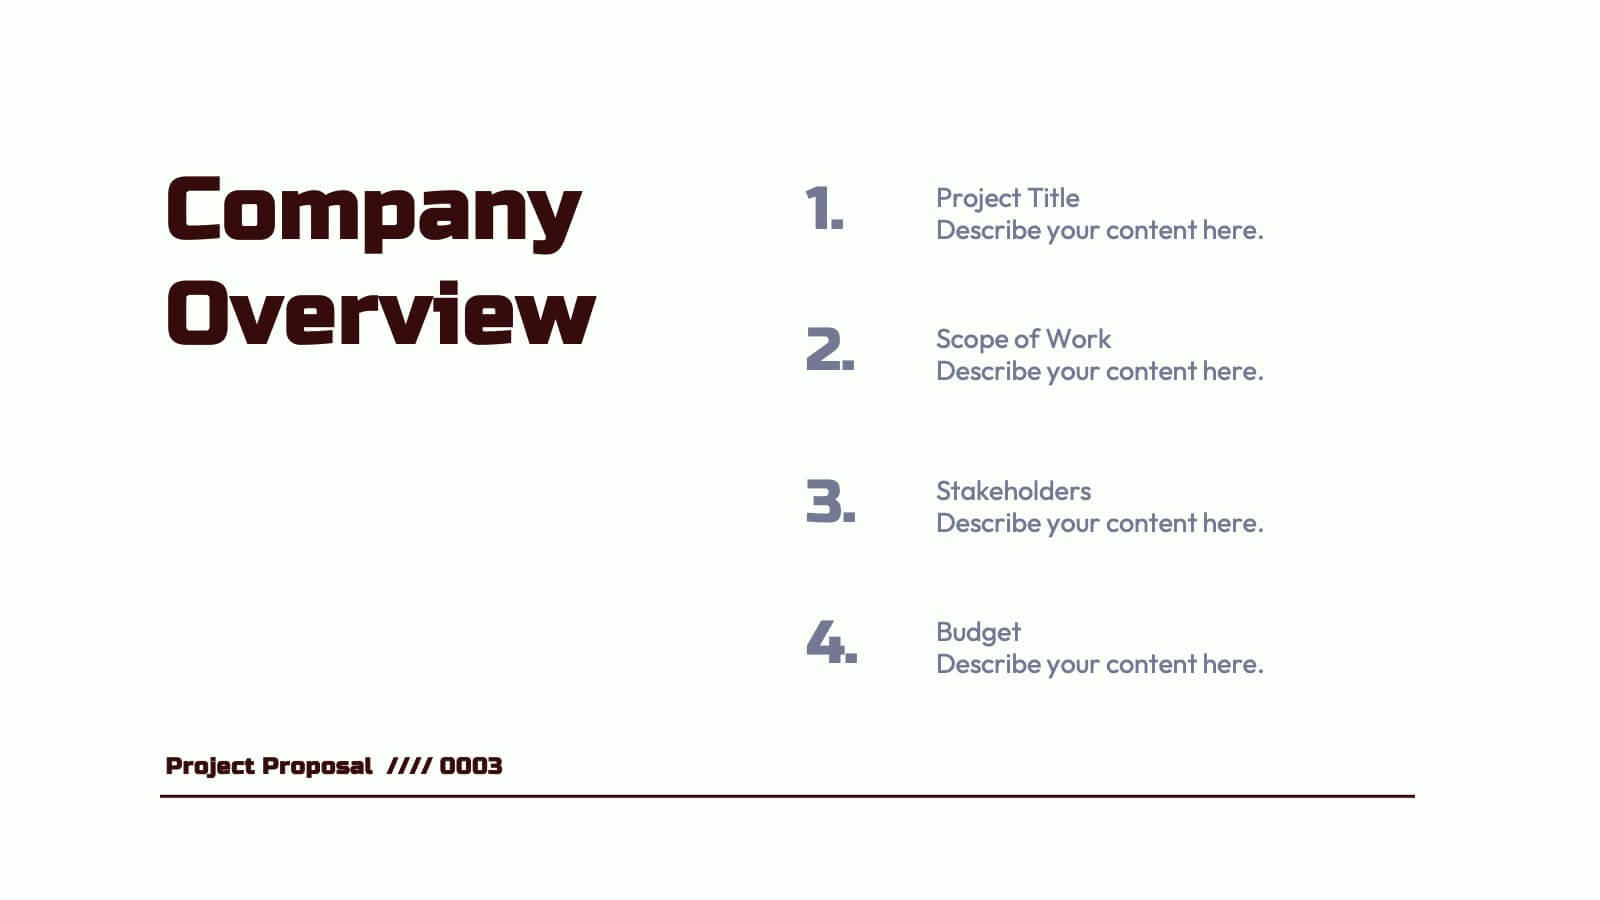
Nebula Project Proposal Presentation
Create a compelling project proposal with this structured, professional template! It includes sections for problem statements, proposed solutions, goals, timelines, and pricing. Perfect for organizing your ideas clearly and professionally, it's fully customizable and compatible with PowerPoint, Keynote, and Google Slides. This template makes it easy to present your proposals effectively and win clients.


21 diapositivas
Auster Financial Report Presentation
Present financial insights with clarity using this comprehensive report template. Highlight key metrics, performance, project progress, competitor analysis, and strategic initiatives. Includes sections for team productivity, market trends, goals, and recommendations. Perfect for business reviews and updates. Fully customizable for PowerPoint, Keynote, and Google Slides.


6 diapositivas
Project Planning and Task Allocation Presentation
Streamline your project timelines with the Project Planning and Task Allocation Presentation. This template uses a clear horizontal flow to map out six key tasks or stages, making it ideal for visualizing schedules, assigning responsibilities, or showcasing milestones. Fully editable in PowerPoint, Google Slides, Keynote, and Canva.


6 diapositivas
Ideal Buyer Persona Customer Profile Presentation
Define your perfect customer with the Ideal Buyer Persona Customer Profile Presentation. This clear and visually structured layout helps you map out key traits, behaviors, and needs of your target audience. Easy to edit in Canva, PowerPoint, or Google Slides—ideal for marketing teams, strategists, and business development presentations.


5 diapositivas
Investment Opportunity Business Case
Visualize the value behind your proposal with this key-themed layout, ideal for presenting compelling reasons to invest. Each section highlights a unique point, making it easy to walk stakeholders through critical benefits and insights. Fully editable and compatible with PowerPoint, Keynote, and Google Slides.


6 diapositivas
Corporation Schedule Infographics
Elevate your corporate presentations with our Corporation Schedule infographic, expertly designed for compatibility with Powerpoint, Keynote, and Google Slides. This practical and polished infographic is an exceptional resource for managers, team leads, and event coordinators planning and presenting schedules, timelines, and agendas. The infographic is structured to visually organize and communicate a corporation's schedule, making it an invaluable tool for outlining project timelines, meeting agendas, or corporate event itineraries. Its clear, concise format is specifically tailored to the business environment, where readability and quick comprehension are paramount. Integrating this infographic into your presentation will not only enhance its professional appearance but also facilitate effective time management and ensure alignment across teams. Whether you’re detailing a week-long conference schedule or outlining a project’s phases, this infographic provides a streamlined approach to sharing that information with your audience. It’s a strategic way to keep everyone informed and focused on the company's key timeframes and objectives.