


Características


¿Tienes alguna pregunta?
Recomendar


6 diapositivas
6-Factor PESTEL Analysis Slide Deck Presentation
Spark fresh strategic insights with a vibrant hexagon layout that turns complex external factors into a clear, engaging story. This presentation helps teams explore key influences, compare trends, and guide smarter decision-making with confidence. Easy to edit and fully compatible with PowerPoint, Keynote, and Google Slides.


2 diapositivas
Designer Portfolio for Client Showcase Presentation
Showcase your creative work with the Designer Portfolio for Client Showcase Presentation. This sleek layout emphasizes visual storytelling, making it ideal for graphic designers, illustrators, and creatives presenting to potential clients. Highlight your projects in a clean, modern format. Compatible with Canva, PowerPoint, Keynote, and Google Slides for full customization.


21 diapositivas
Polaris Startup Strategy Presentation
Set your startup on a path to success with this bold and dynamic strategy presentation template. Featuring key sections like mission and vision, market analysis, business model, and growth plans, it’s perfect for entrepreneurs and teams. Fully compatible with PowerPoint, Keynote, and Google Slides for a seamless presentation experience.


7 diapositivas
Annual Summary Infographic
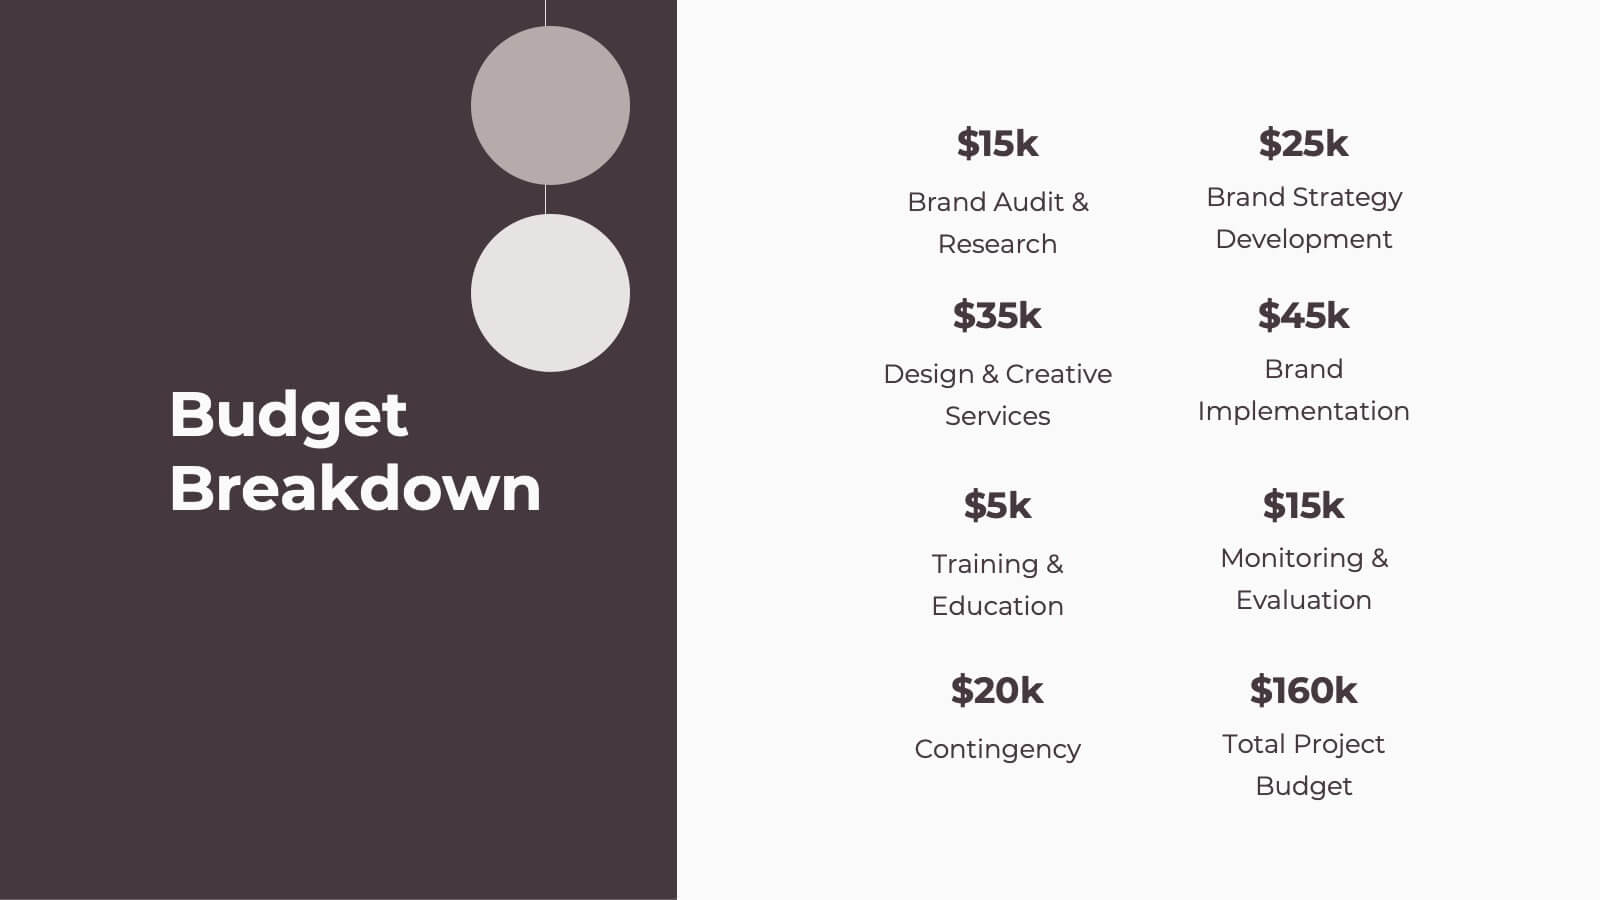
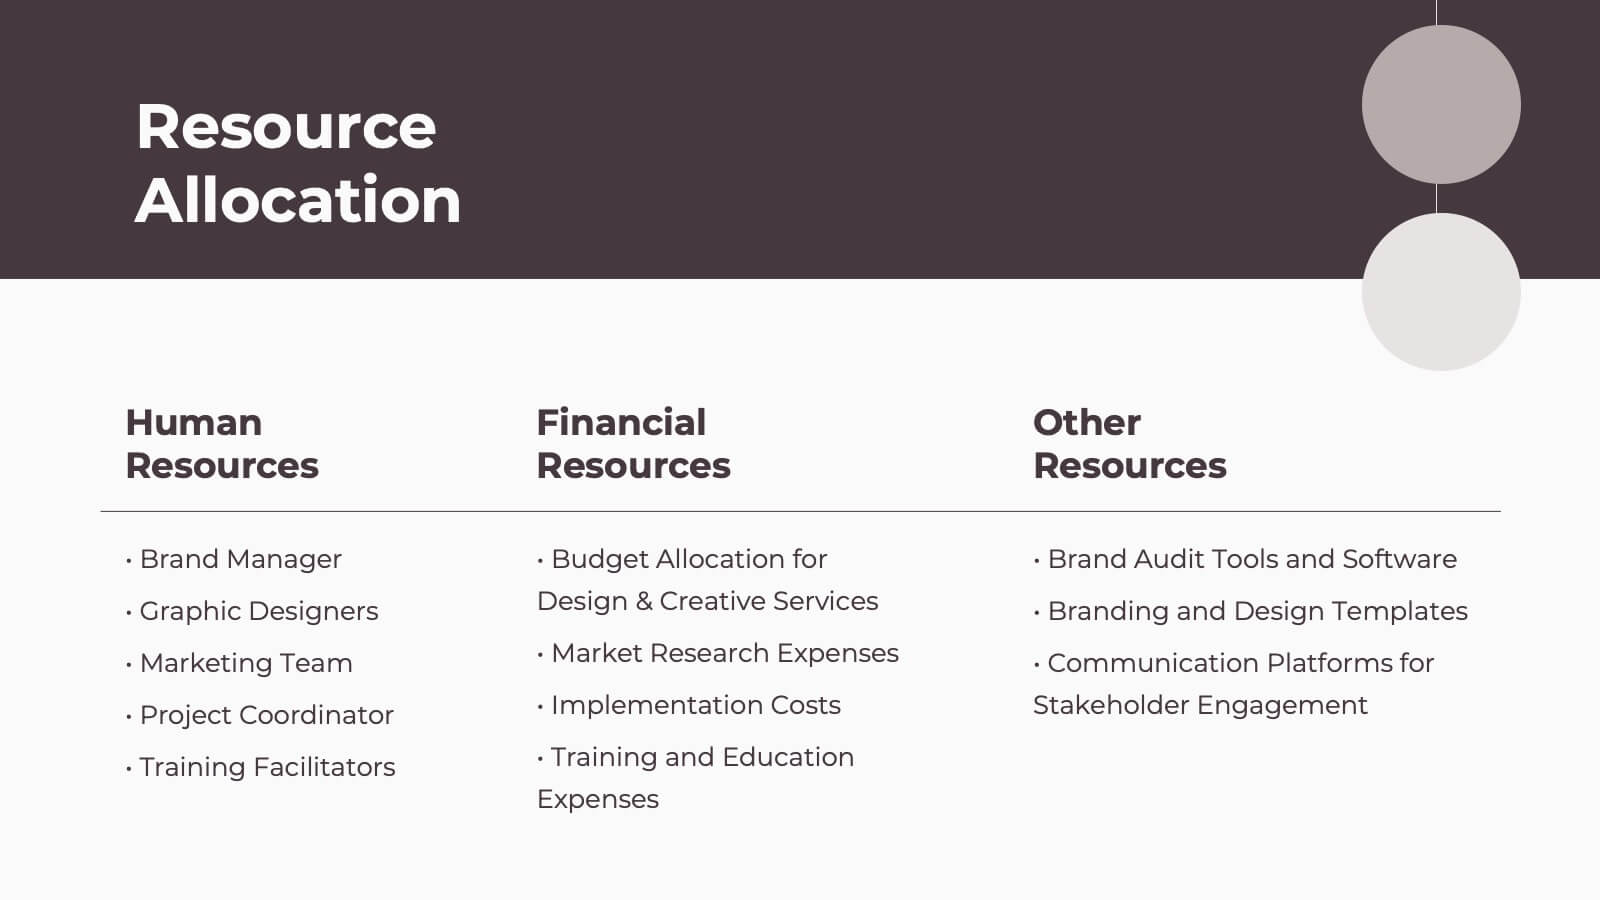
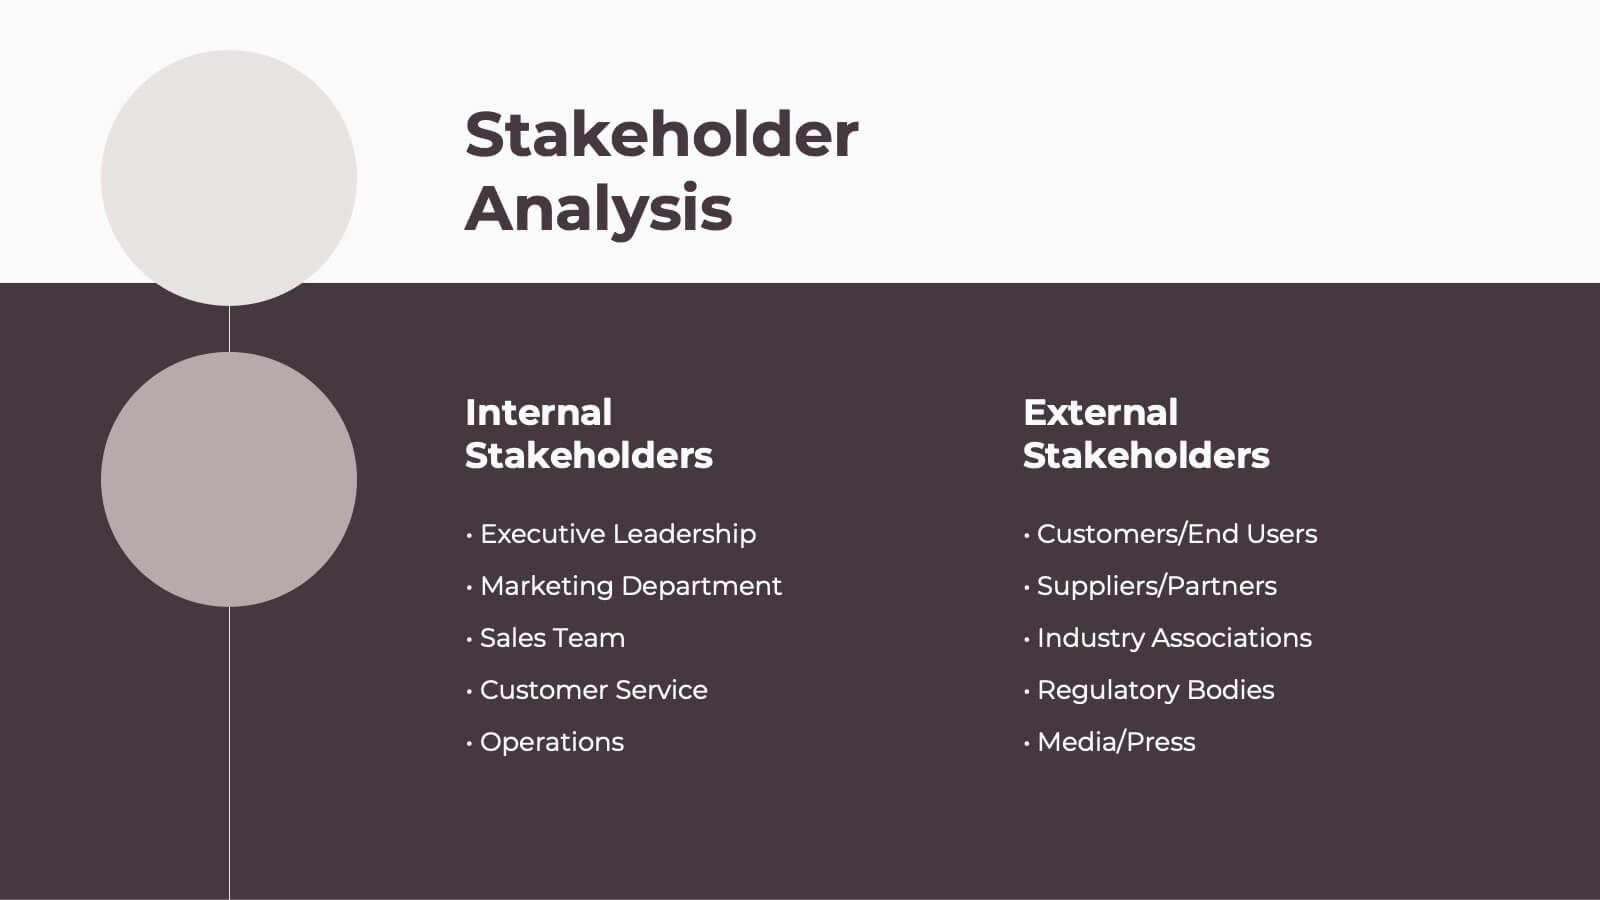
Revitalize your year-end reports with our expertly designed Infographic Templates! Tailored for professionals keen on showcasing annual achievements and insights, this collection offers a dynamic array of layouts that cater to varied presentation needs. From streamlined bar graphs and intricate circle diagrams to engaging icon lists, these templates are engineered to translate complex annual data into digestible, visually appealing content. Customize colors, fonts, and text to mirror your organization’s branding, ensuring a consistent and professional appearance across all communications. Compatible with PowerPoint, Google Slides, and Keynote, our templates simplify the creation of presentations that not only inform but inspire. Ideal for executives, team leaders, and marketers, these templates are indispensable tools for illustrating yearly progress, highlighting significant outcomes, and strategizing for future success. Enhance your professional presentations and make your annual summary not just seen, but remembered.


12 diapositivas
Project Completion Checklist
Streamline project tracking with this clean and functional project completion checklist slide. Ideal for task management and progress reporting, it includes editable sections for task descriptions, process stages, current status, and additional notes. With toggles like “In Process,” “On Hold,” “Complete,” and “Overdue,” this layout is perfect for keeping teams aligned. Fully editable in PowerPoint, Keynote, and Google Slides.


21 diapositivas
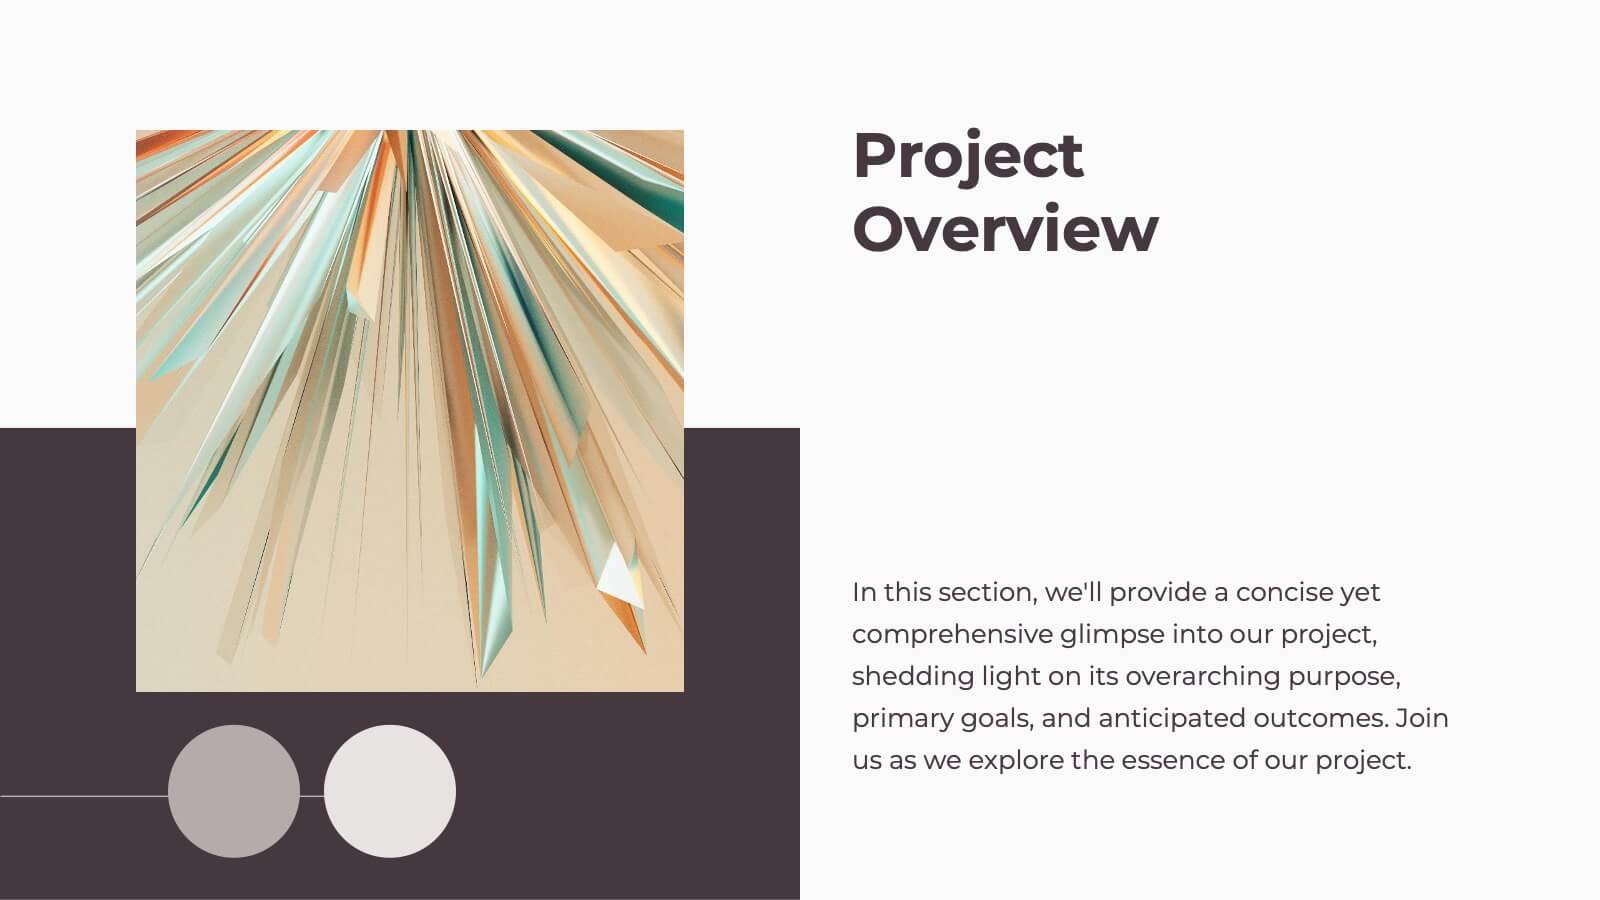
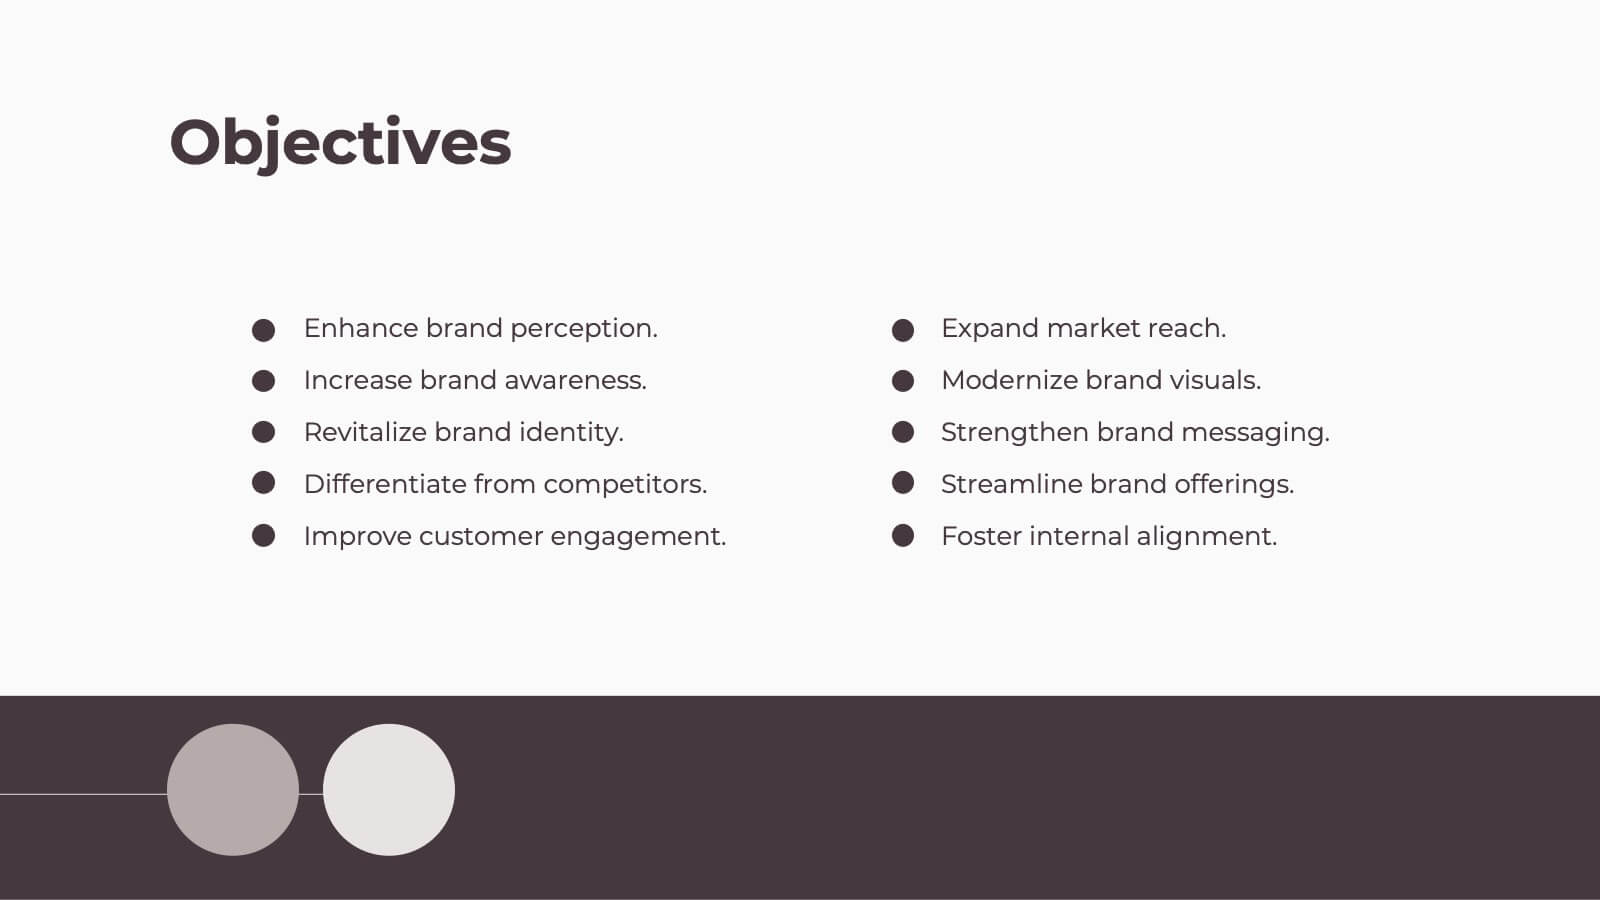
Spectrum Project Timeline Presentation
Plan and execute your projects with precision using this detailed project plan template! Perfect for outlining objectives, timelines, and resource allocation. Ideal for project managers and teams aiming to ensure successful project delivery. Compatible with PowerPoint, Keynote, and Google Slides, this template keeps your project organized, clear, and on track. Ensure project success!


6 diapositivas
Six Sigma Process Improvement Presentation
Dive into efficiency with our Six Sigma Process Improvement template! This presentation guide maps out each step from Define to Control, ensuring your project targets are met with precision. Ideal for quality assurance and process optimization, it's compatible with PowerPoint, Keynote, and Google Slides. Perfect for professionals keen on streamlining operations and enhancing productivity.


7 diapositivas
Root Cause Protocol Infographic Presentation
A Root Cause Infographic is a visual tool that is used to analyze and identify the underlying causes of a problem or issue. This template is perfect to use for quality control, project management, or problem-solving processes to help organizations identify the root cause of an issue and develop effective solutions. This infographic includes a series of interconnected elements or components, with the central element representing the problem or issue being analyzed. This template includes text, icons, and other graphic elements to help illustrate the relationships between different components.


4 diapositivas
School Administration and Curriculum Planning Presentation
Streamline academic operations with the School Administration and Curriculum Planning Diagram. This structured template helps educators, administrators, and school leaders effectively visualize curriculum structures, plan schedules, and organize school management tasks. Designed for clarity and efficiency, it ensures a seamless planning experience for any educational institution. Fully customizable and compatible with PowerPoint, Keynote, and Google Slides.


6 diapositivas
Harvey Ball Assessment Infographics
Evaluate performance or satisfaction with our Harvey Ball Assessment infographic template. This template is fully compatible with popular presentation software like PowerPoint, Keynote, and Google Slides, allowing you to easily customize it to represent and communicate assessment results using Harvey Balls. The Harvey Ball Assessment infographic template offers a visually engaging platform to visually depict evaluations, ratings, or levels of satisfaction using Harvey Balls. Whether you're a manager, HR professional, or evaluator, this template provides a user-friendly canvas to create informative presentations and reports to convey assessment outcomes effectively. Enhance your assessment reporting with this SEO-optimized Harvey Ball Assessment infographic template, thoughtfully designed for clarity and ease of use. Customize it to showcase assessment data, ratings, and scores, making it a valuable tool for sharing performance or satisfaction levels with your audience. Start crafting your personalized infographic today to communicate your assessment results efficiently.


4 diapositivas
Creative Thinking and Brain Functions Presentation
Illuminate cognitive processes with the Creative Thinking and Brain Functions Presentation. Featuring a clean mind map-style layout with illustrated heads and title blocks, this slide is ideal for showcasing mental models, decision paths, or concept relationships. Fully editable in PowerPoint, Canva, and Google Slides for effortless customization.


4 diapositivas
3-Circle Overlap Venn Layout
Visually break down relationships and intersections with the 3-Circle Overlap Venn Layout Presentation. This sleek, minimalist diagram is ideal for illustrating shared values, cross-functional strategies, or concept intersections. Each circle is color-coded with space for clear titles and concise explanations. Great for strategy discussions, branding, or stakeholder presentations. Fully editable in PowerPoint, Keynote, and Google Slides.


4 diapositivas
Cost Comparison Analysis Chart Presentation
Turn your price evaluations into something visually compelling with this sleek and modern layout. Perfect for showcasing product features, service packages, or market comparisons, it simplifies decision-making with a clear side-by-side design. Fully editable and compatible with PowerPoint, Keynote, and Google Slides for effortless customization.


22 diapositivas
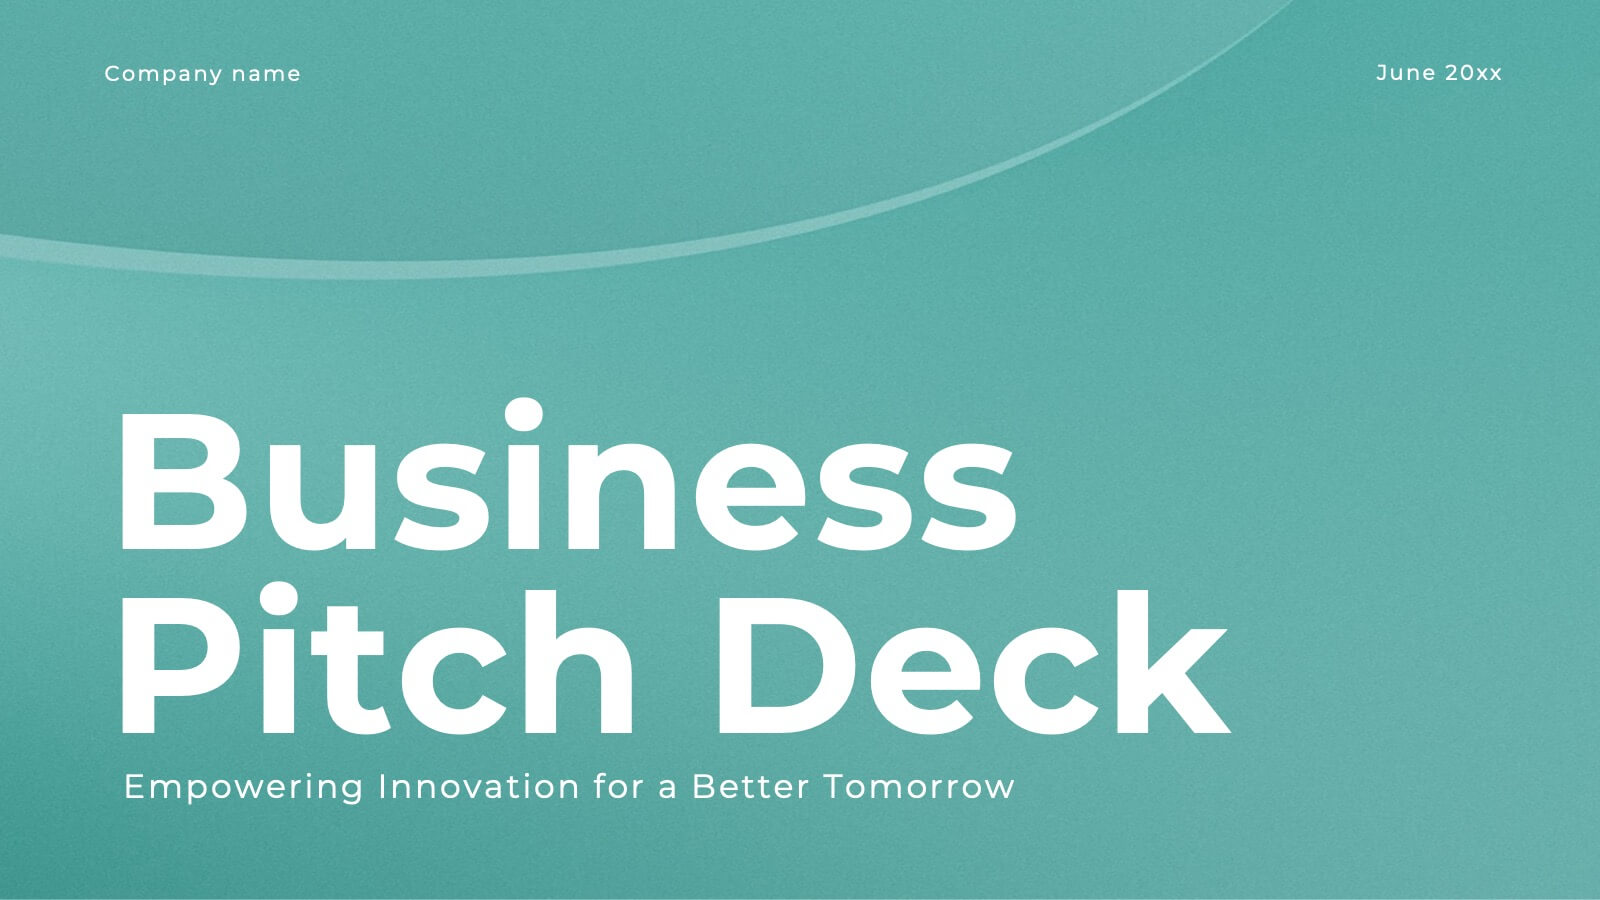
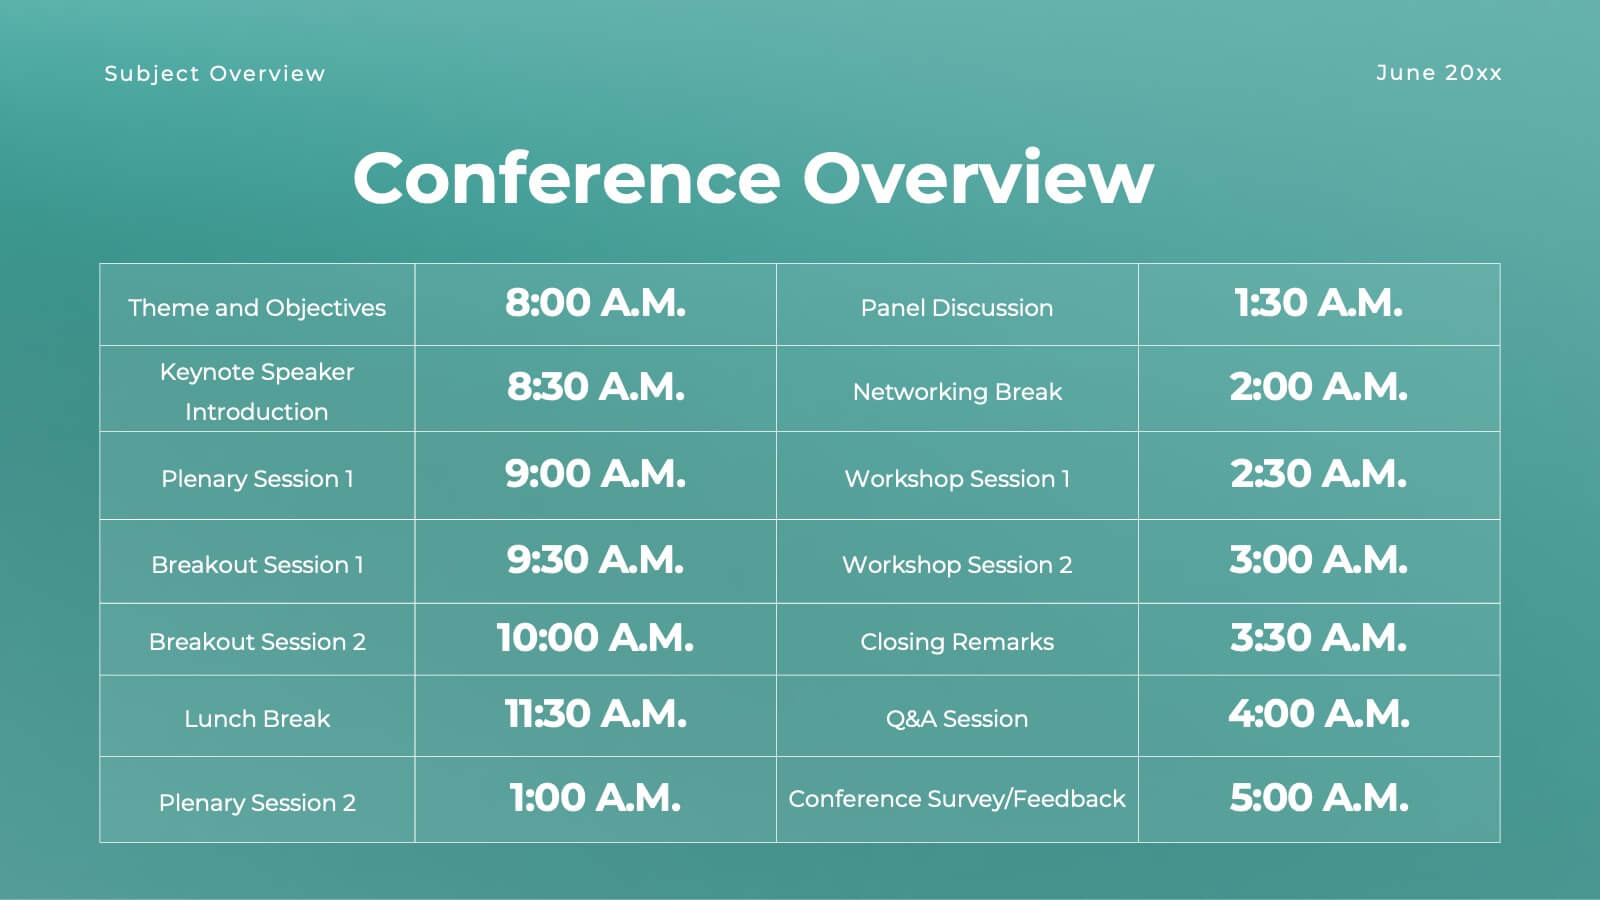
Halo Small Business Pitch Deck Presentation
Streamline your business presentations with this versatile pitch deck template! Ideal for conferences and meetings, it includes slides for objectives, session details, keynote speakers, and panel discussions. Keep your audience engaged with professional design and clear, structured content. Compatible with PowerPoint, Keynote, and Google Slides for seamless presentations on any platform.


12 diapositivas
Customer Support Common Questions Presentation
Enhance customer support efficiency with this modern and structured presentation slide. Featuring a head silhouette with question marks, this template effectively represents customer inquiries and problem-solving processes. Perfect for help desk teams, customer service training, and support workflow presentations, it is fully editable, allowing you to customize text, colors, and layout for a tailored experience. Compatible with PowerPoint, Keynote, and Google Slides for seamless integration.


7 diapositivas
RACI Matrix Infographic Presentation Template
A RACI Matrix Infographic is a visual representation of the RACI model, which is used to clarify roles and responsibilities in an organization. The RACI model stands for Responsible, Accountable, Consulted, and Informed, and is a framework for defining the relationships between individuals and tasks in a project. This infographic displays a visual representation of the RACI matrix, showing the roles and responsibilities of each topic in a clear and organized manner. This Infographic can serve as a useful tool for managers and teams, as it can help to ensure clear communication and organization.


4 diapositivas
Virtual Learning Experience Design Presentation
Bring your online classroom ideas to life with this modern and visual-first design! This infographic presentation breaks down the key components of virtual learning experience design—perfect for mapping student touchpoints, engagement strategies, and content flow. Fully editable and easy to use in PowerPoint, Keynote, and Google Slides for fast customization.