


Características


¿Tienes alguna pregunta?
Recomendar


20 diapositivas
Air Slash Artist Portfolio Template Presentation
The Air Slash Artist Portfolio template is your perfect canvas for showcasing creativity and professionalism! Designed with a minimalist yet dynamic aesthetic, this template helps you present your projects and artistic journey with flair. Start with a compelling introduction and an "About Me" section that tells your story, followed by a detailed portfolio overview. Highlight your best work with project showcases, and explain your unique style and creative process. The template also features dedicated sections for collaborations, client testimonials, awards, and recognitions, ensuring you capture every aspect of your creative achievements. With slides for services offered, pricing, and contact information, you can connect with potential clients effortlessly. Whether you're a freelance artist, designer, or creative professional, this template is fully customizable and compatible with PowerPoint, Keynote, and Google Slides, making it a versatile choice for all your presentation needs.


7 diapositivas
KPI Software Dashboard Infographic
Maximize the effectiveness of your performance analysis with our KPI Software Dashboard infographic, optimized for use in Powerpoint, Keynote, and Google Slides. This dynamic infographic is an indispensable tool for business analysts, project managers, and data-driven professionals seeking to present key performance indicators (KPIs) in an insightful and engaging manner. Our KPI Software Dashboard infographic offers a clear, visual representation of critical data points that influence business decisions. With its diverse array of charts, graphs, and meters, it provides an at-a-glance overview of company performance across various metrics. The design is tailored to enhance readability and comprehension, allowing your audience to quickly grasp complex data trends and patterns. Whether you're reviewing sales figures, monitoring customer satisfaction, or tracking project progress, this infographic is designed to streamline the presentation of your data. The compatibility with popular presentation platforms ensures a smooth integration into your slide deck, making it a breeze to communicate the insights that matter. Utilize this infographic to turn your KPI data into compelling narratives that drive strategic business actions.


5 diapositivas
Experience-Based Smile Scorecard Presentation
Measure sentiment with ease using this Experience-Based Smile Scorecard slide. Designed with a vertical battery-style layout, each tier represents a distinct emotional level—from dissatisfied to happy. Ideal for visualizing user experiences, customer feedback, or service quality. Fully editable and compatible with PowerPoint, Canva, and Google Slides.


7 diapositivas
Business Plan Strategy Infographic
A business plan is a written document that outlines a company's goals and the strategy it will use to achieve those goals. This infographic template is a comprehensive roadmap for how a business intends to operate, grow, and succeed in its market. Compatible with Powerpoint, Keynote, and Google Slides. This template is meticulously designed to help you craft a well-structured business plan, empowering entrepreneurs and professionals to navigate their journey to success. Let this be your compass as you navigate the complexities of entrepreneurship and strive for business excellence!


21 diapositivas
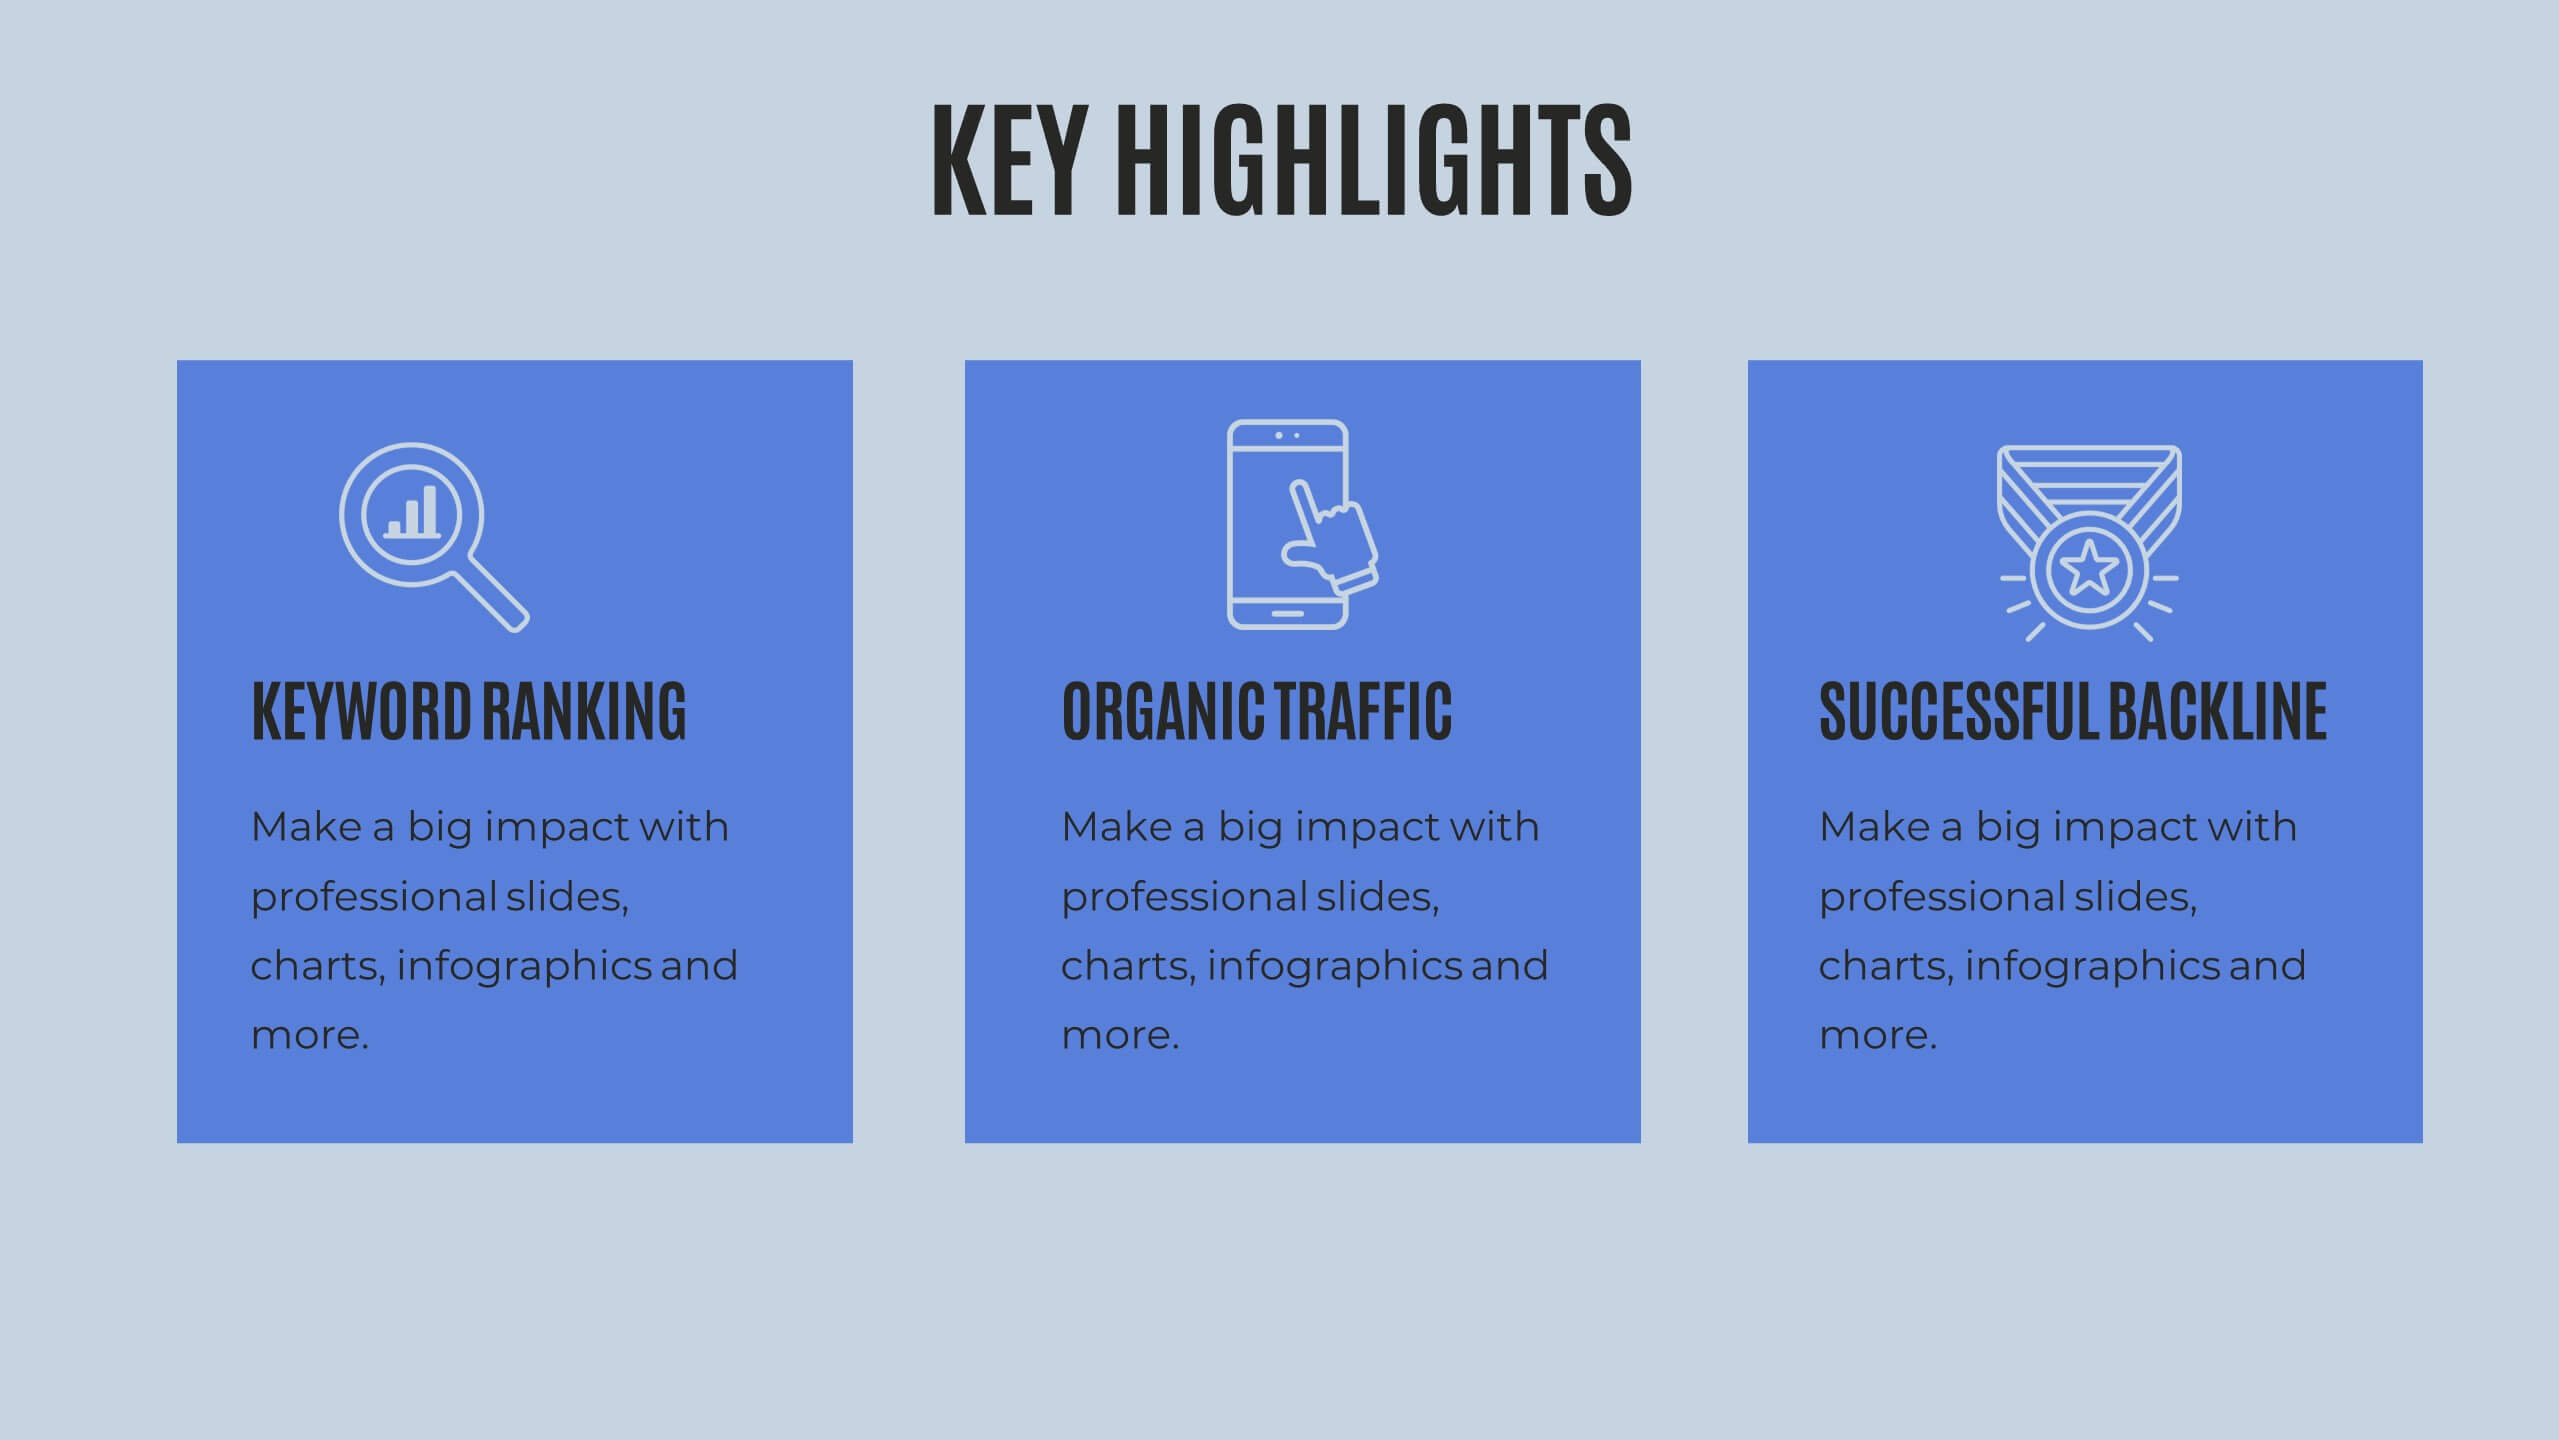
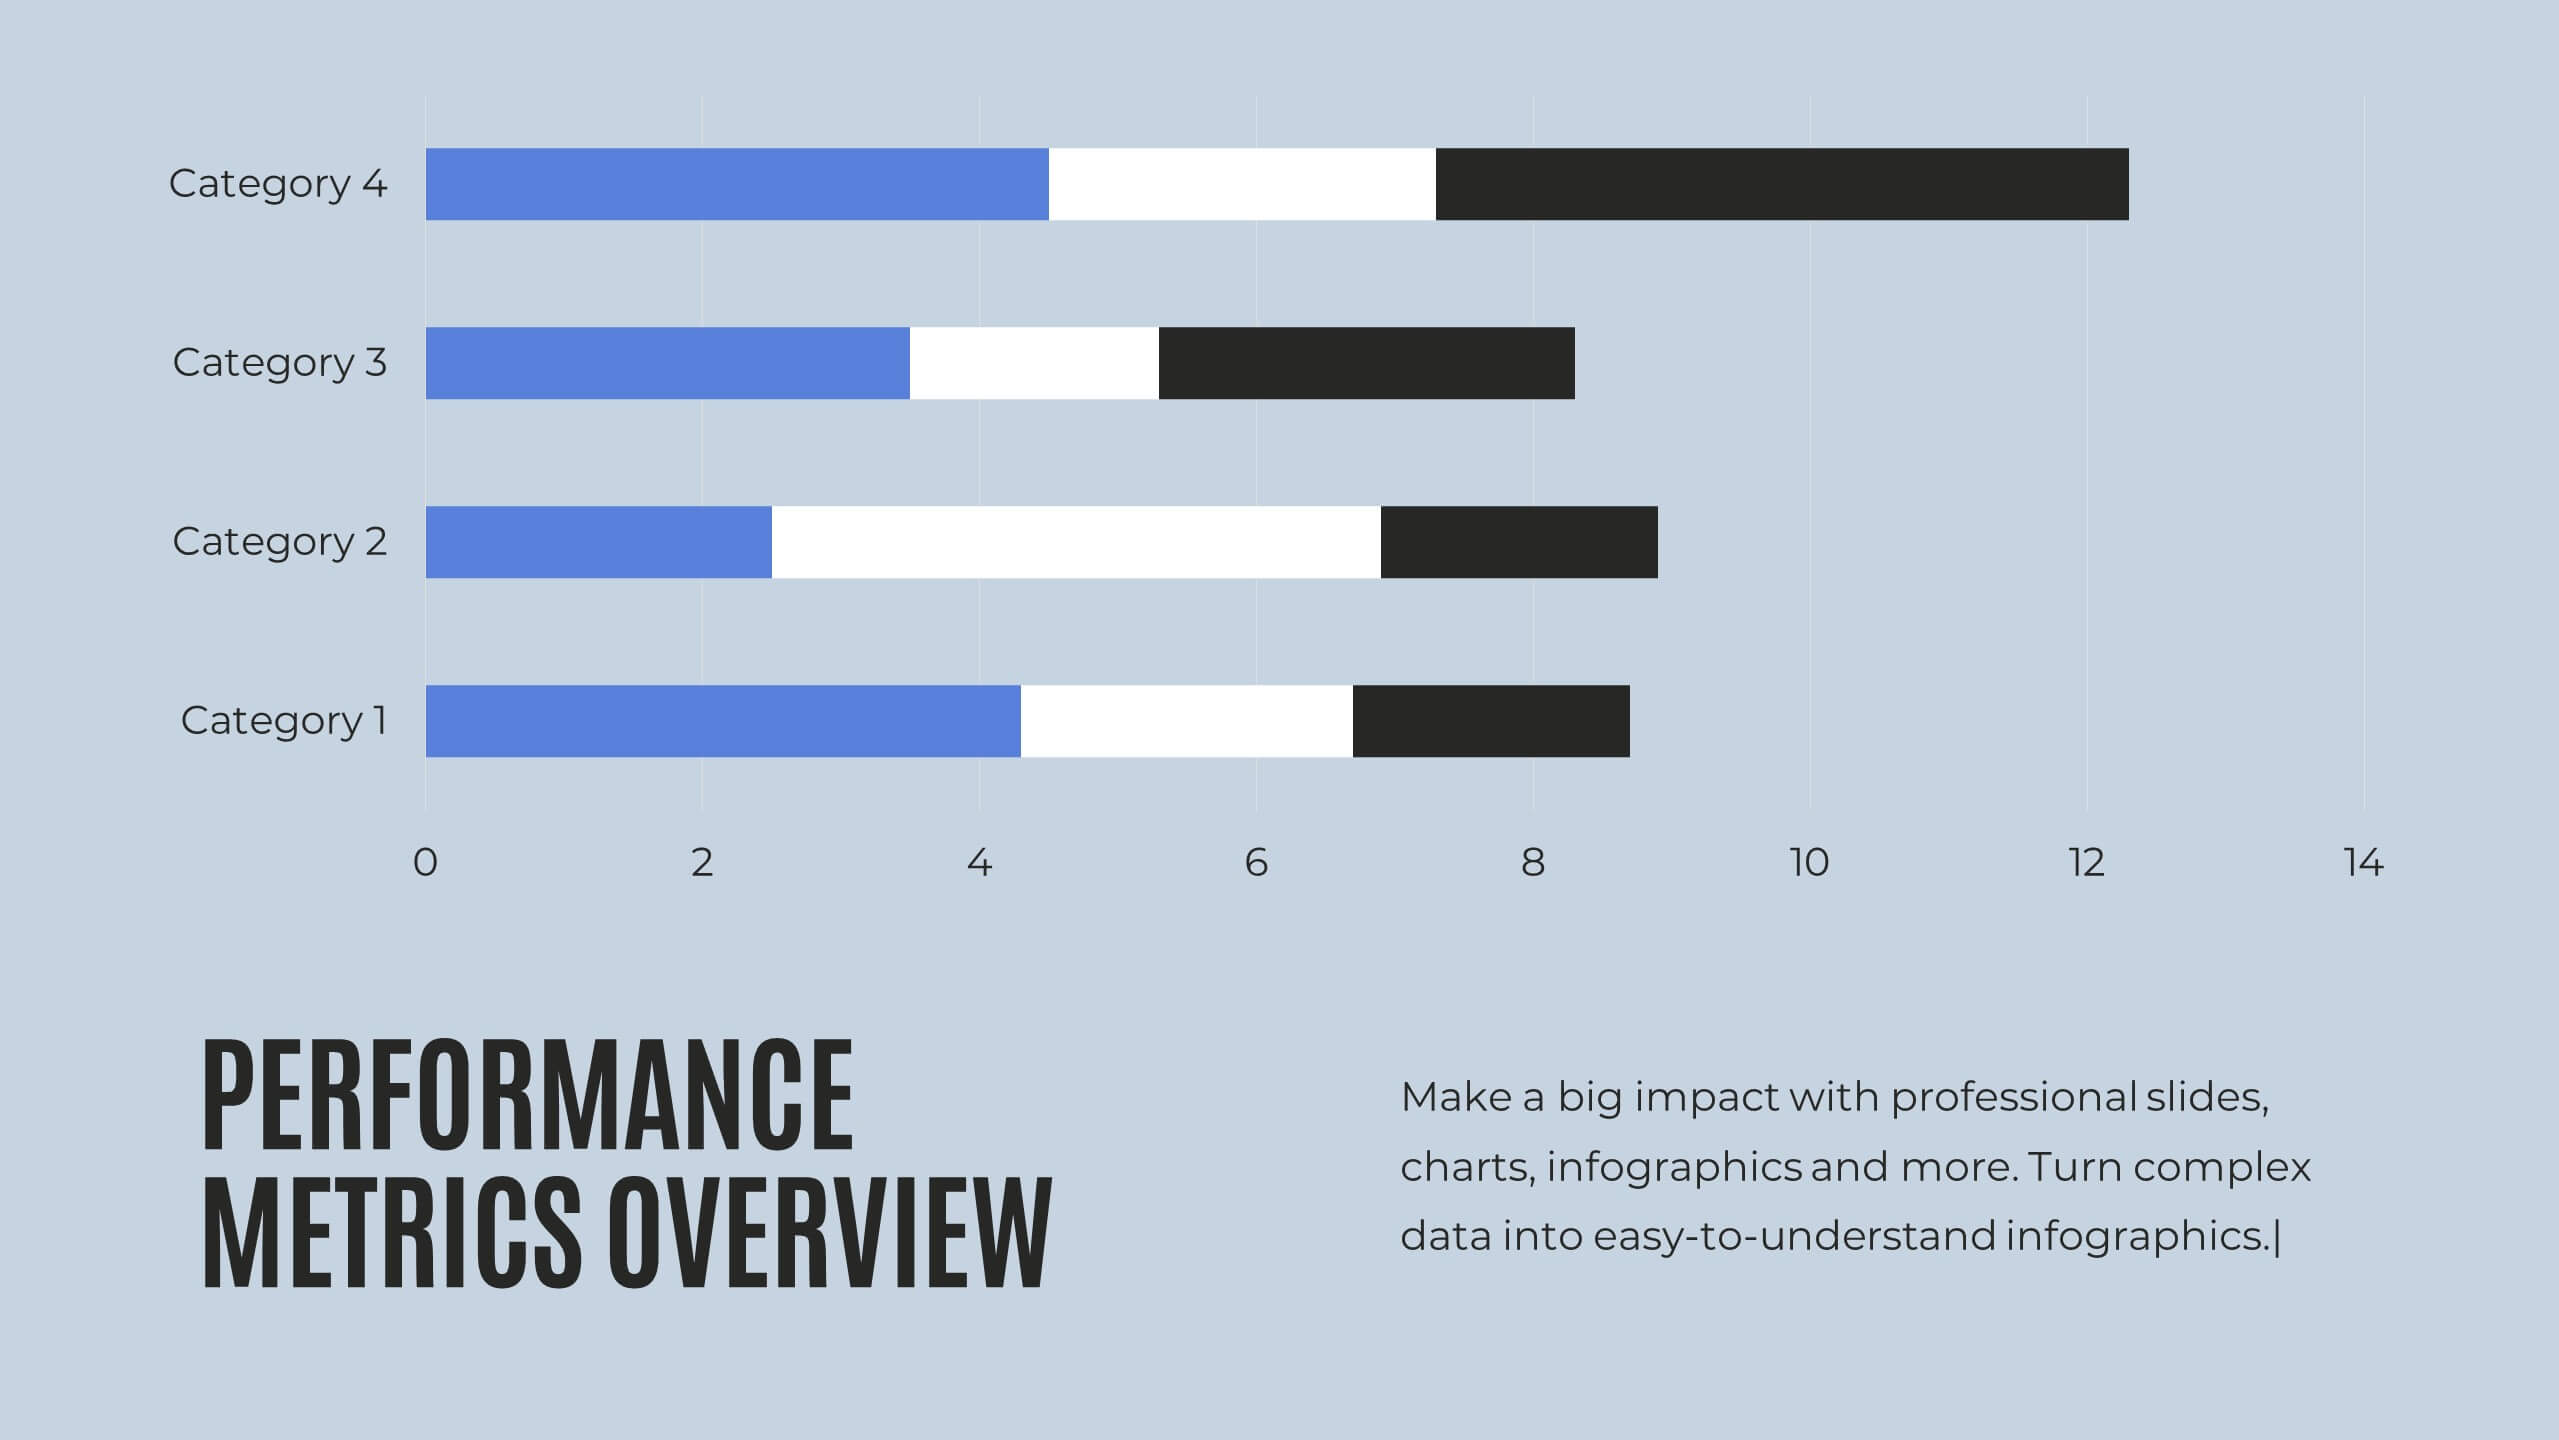
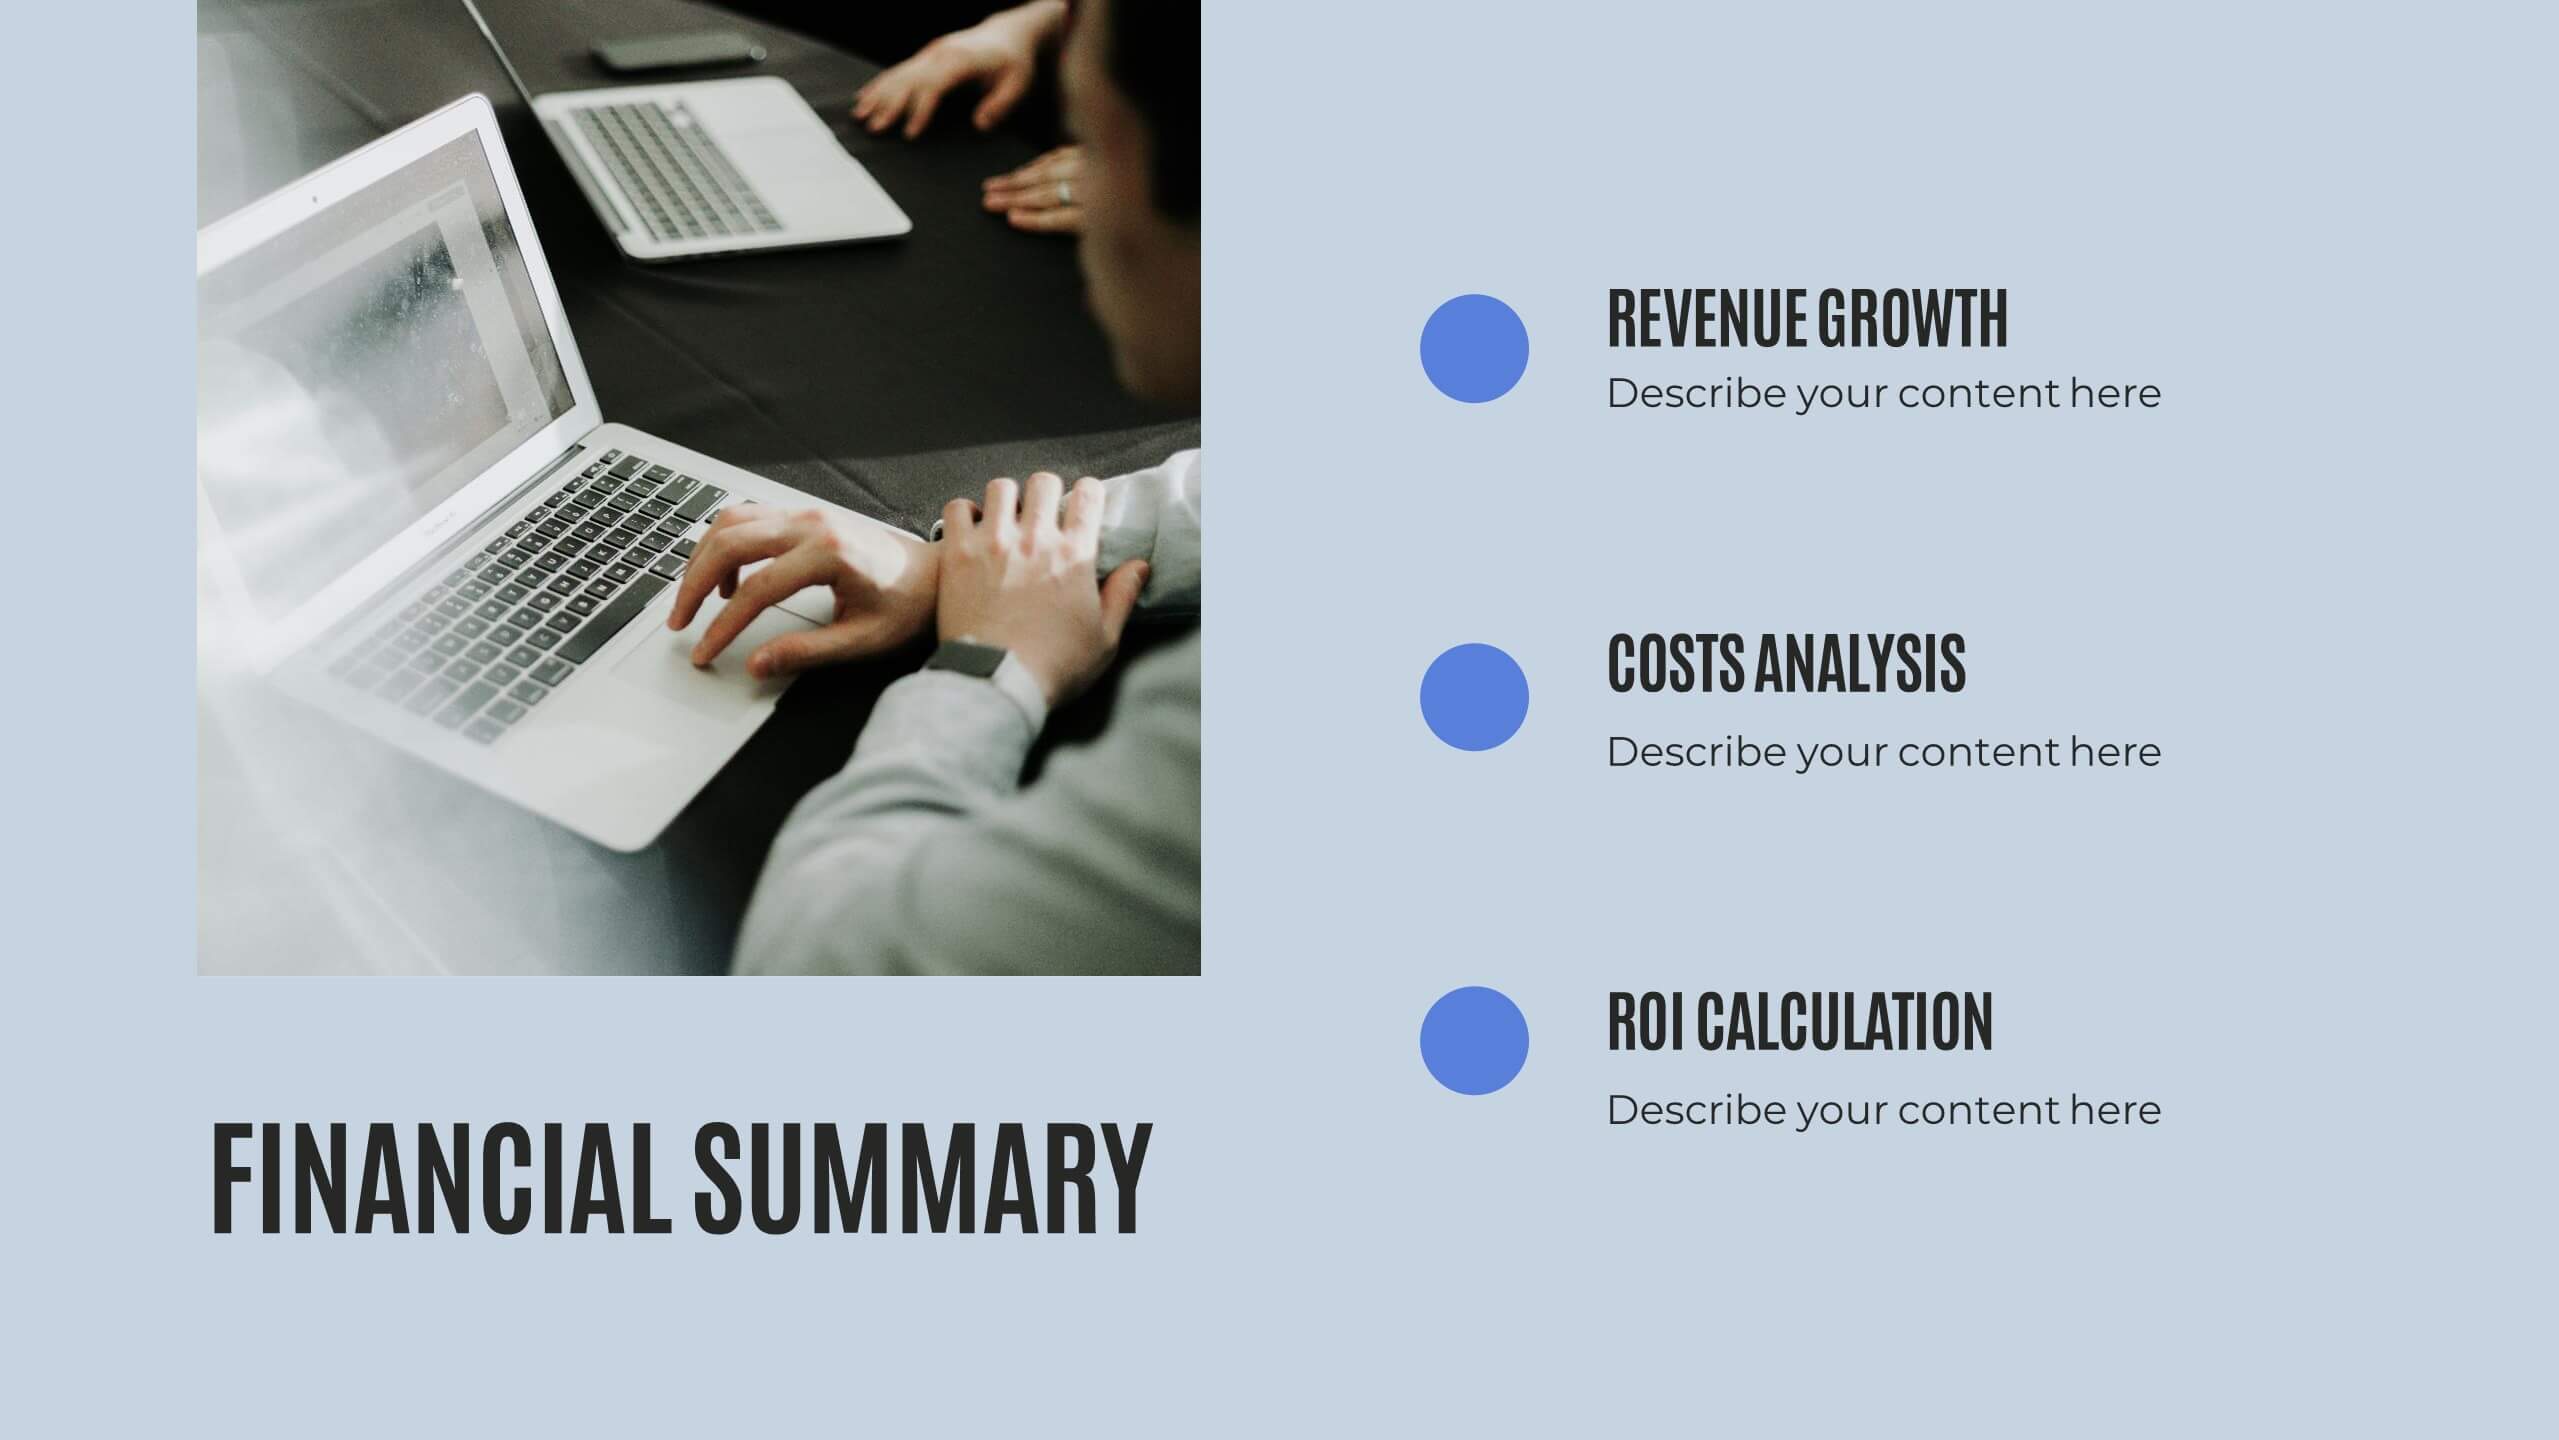
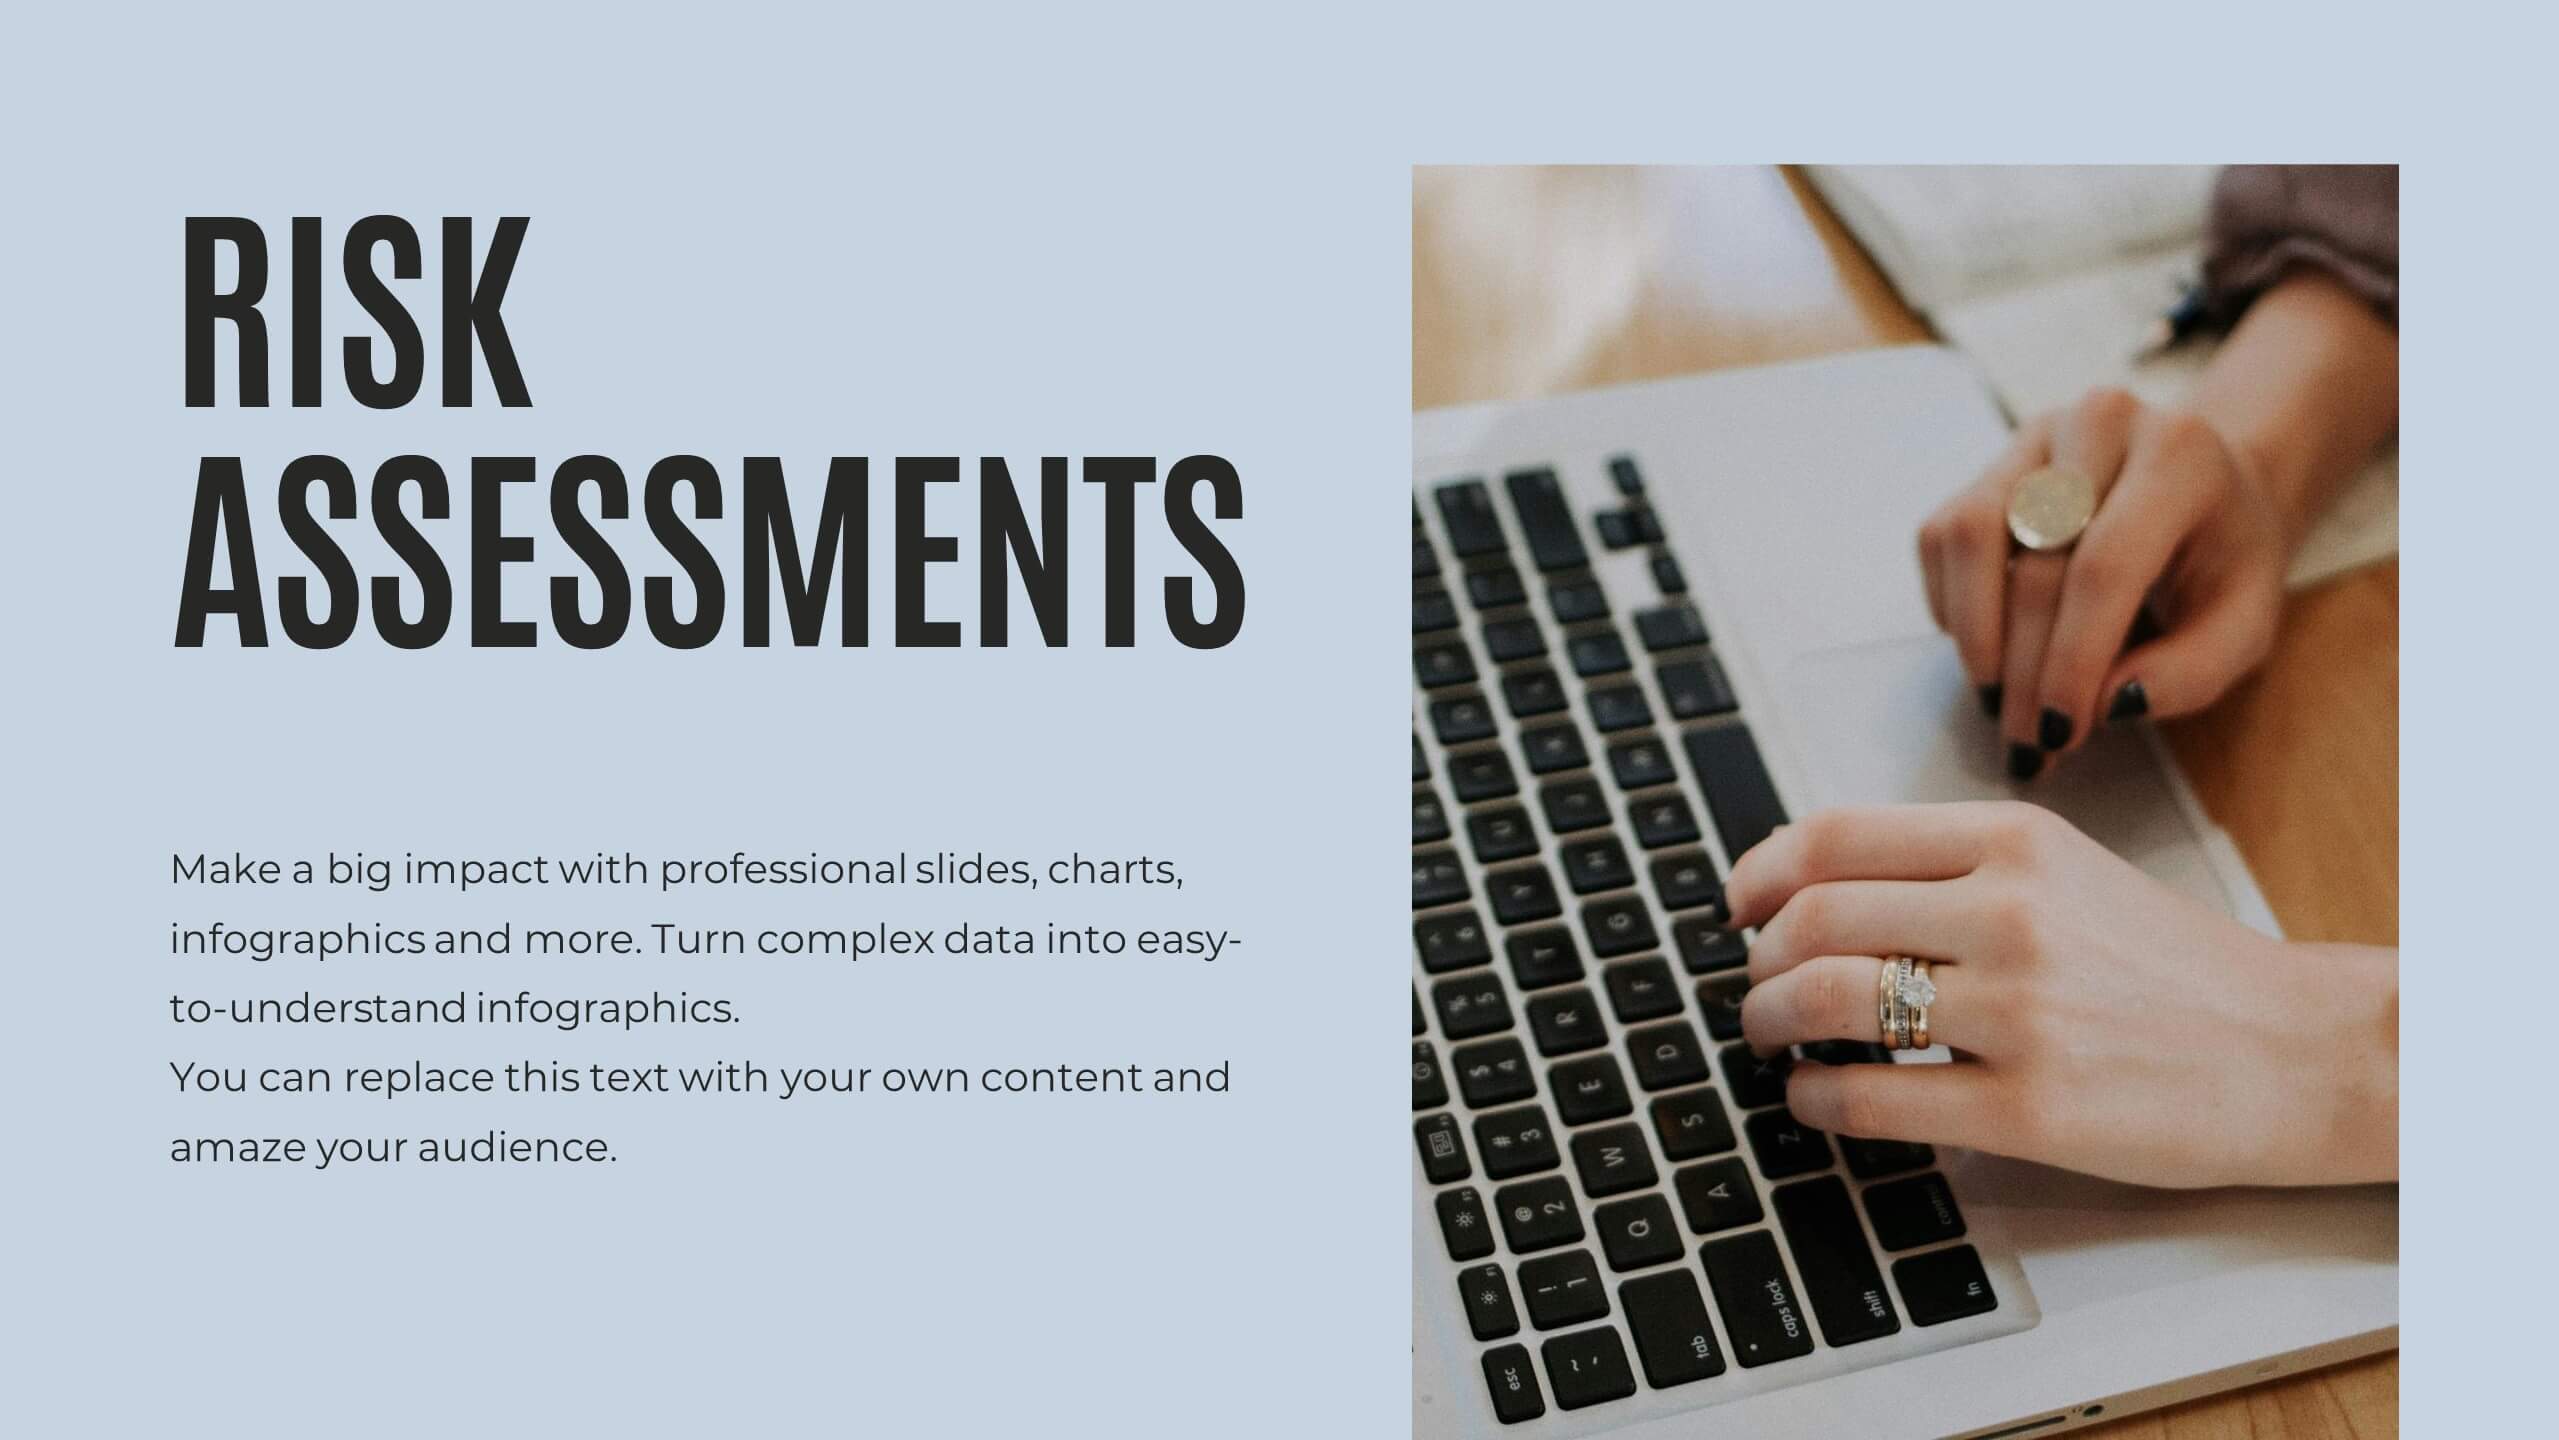
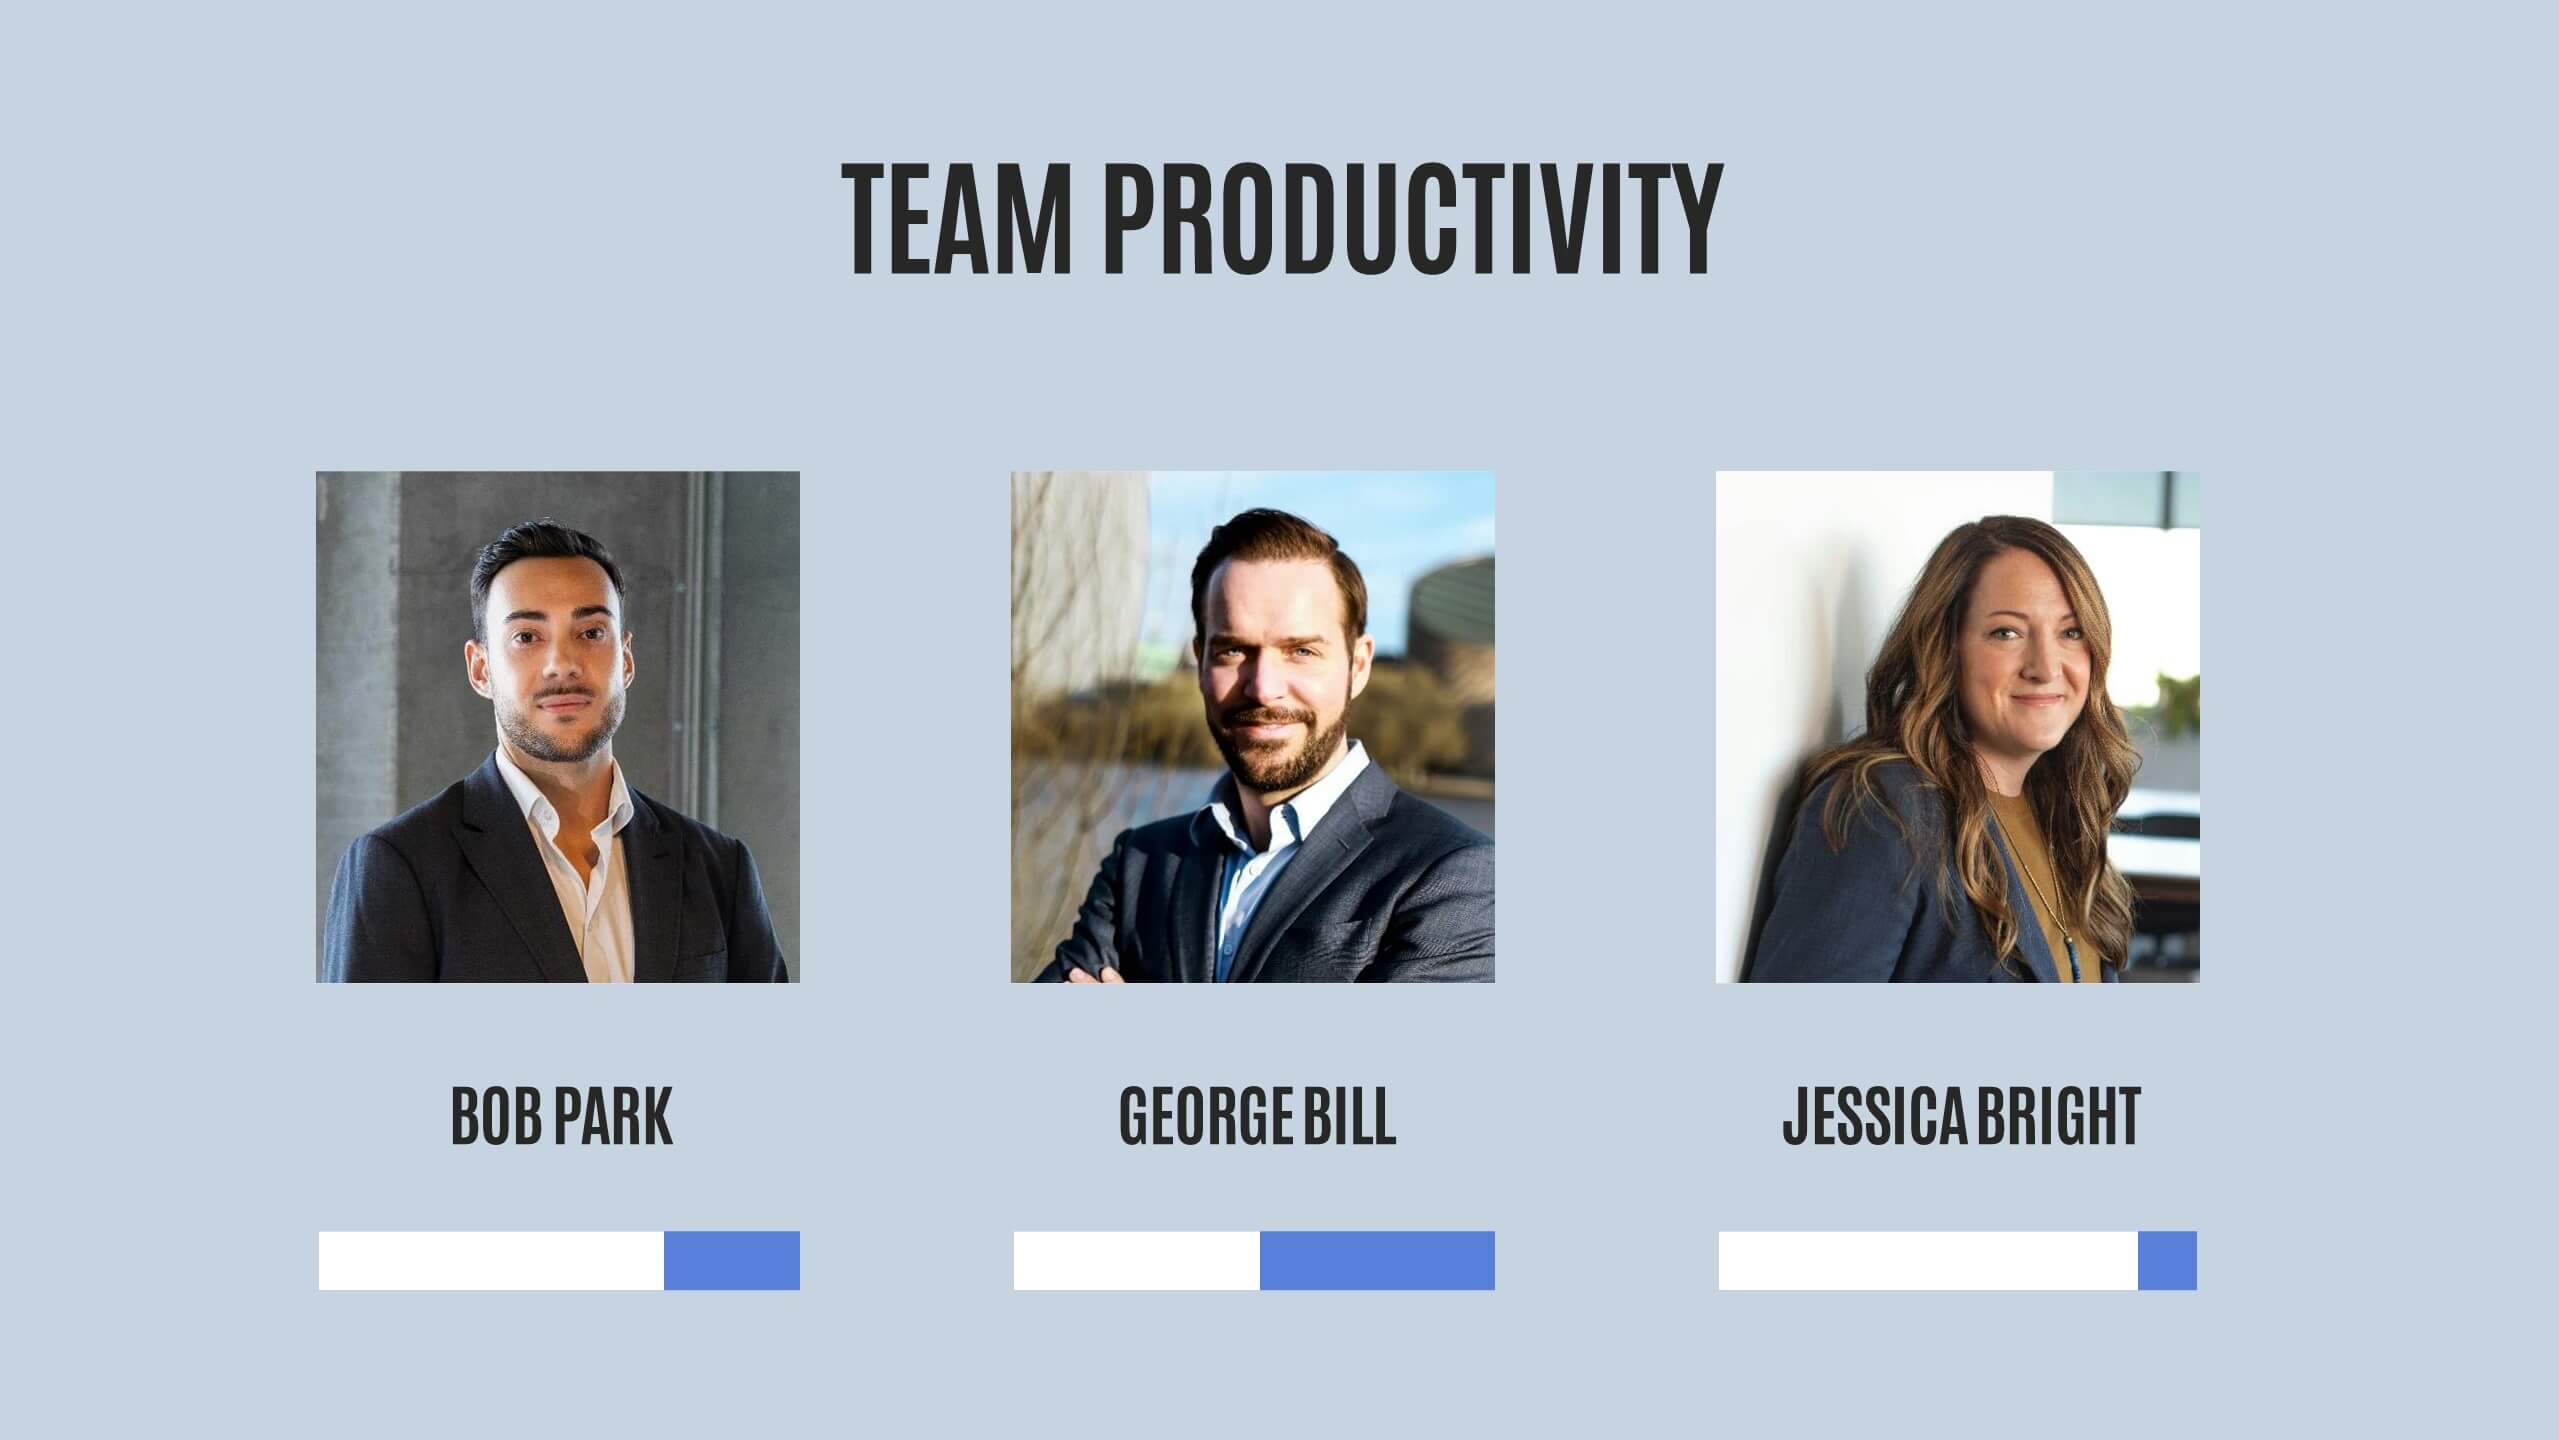
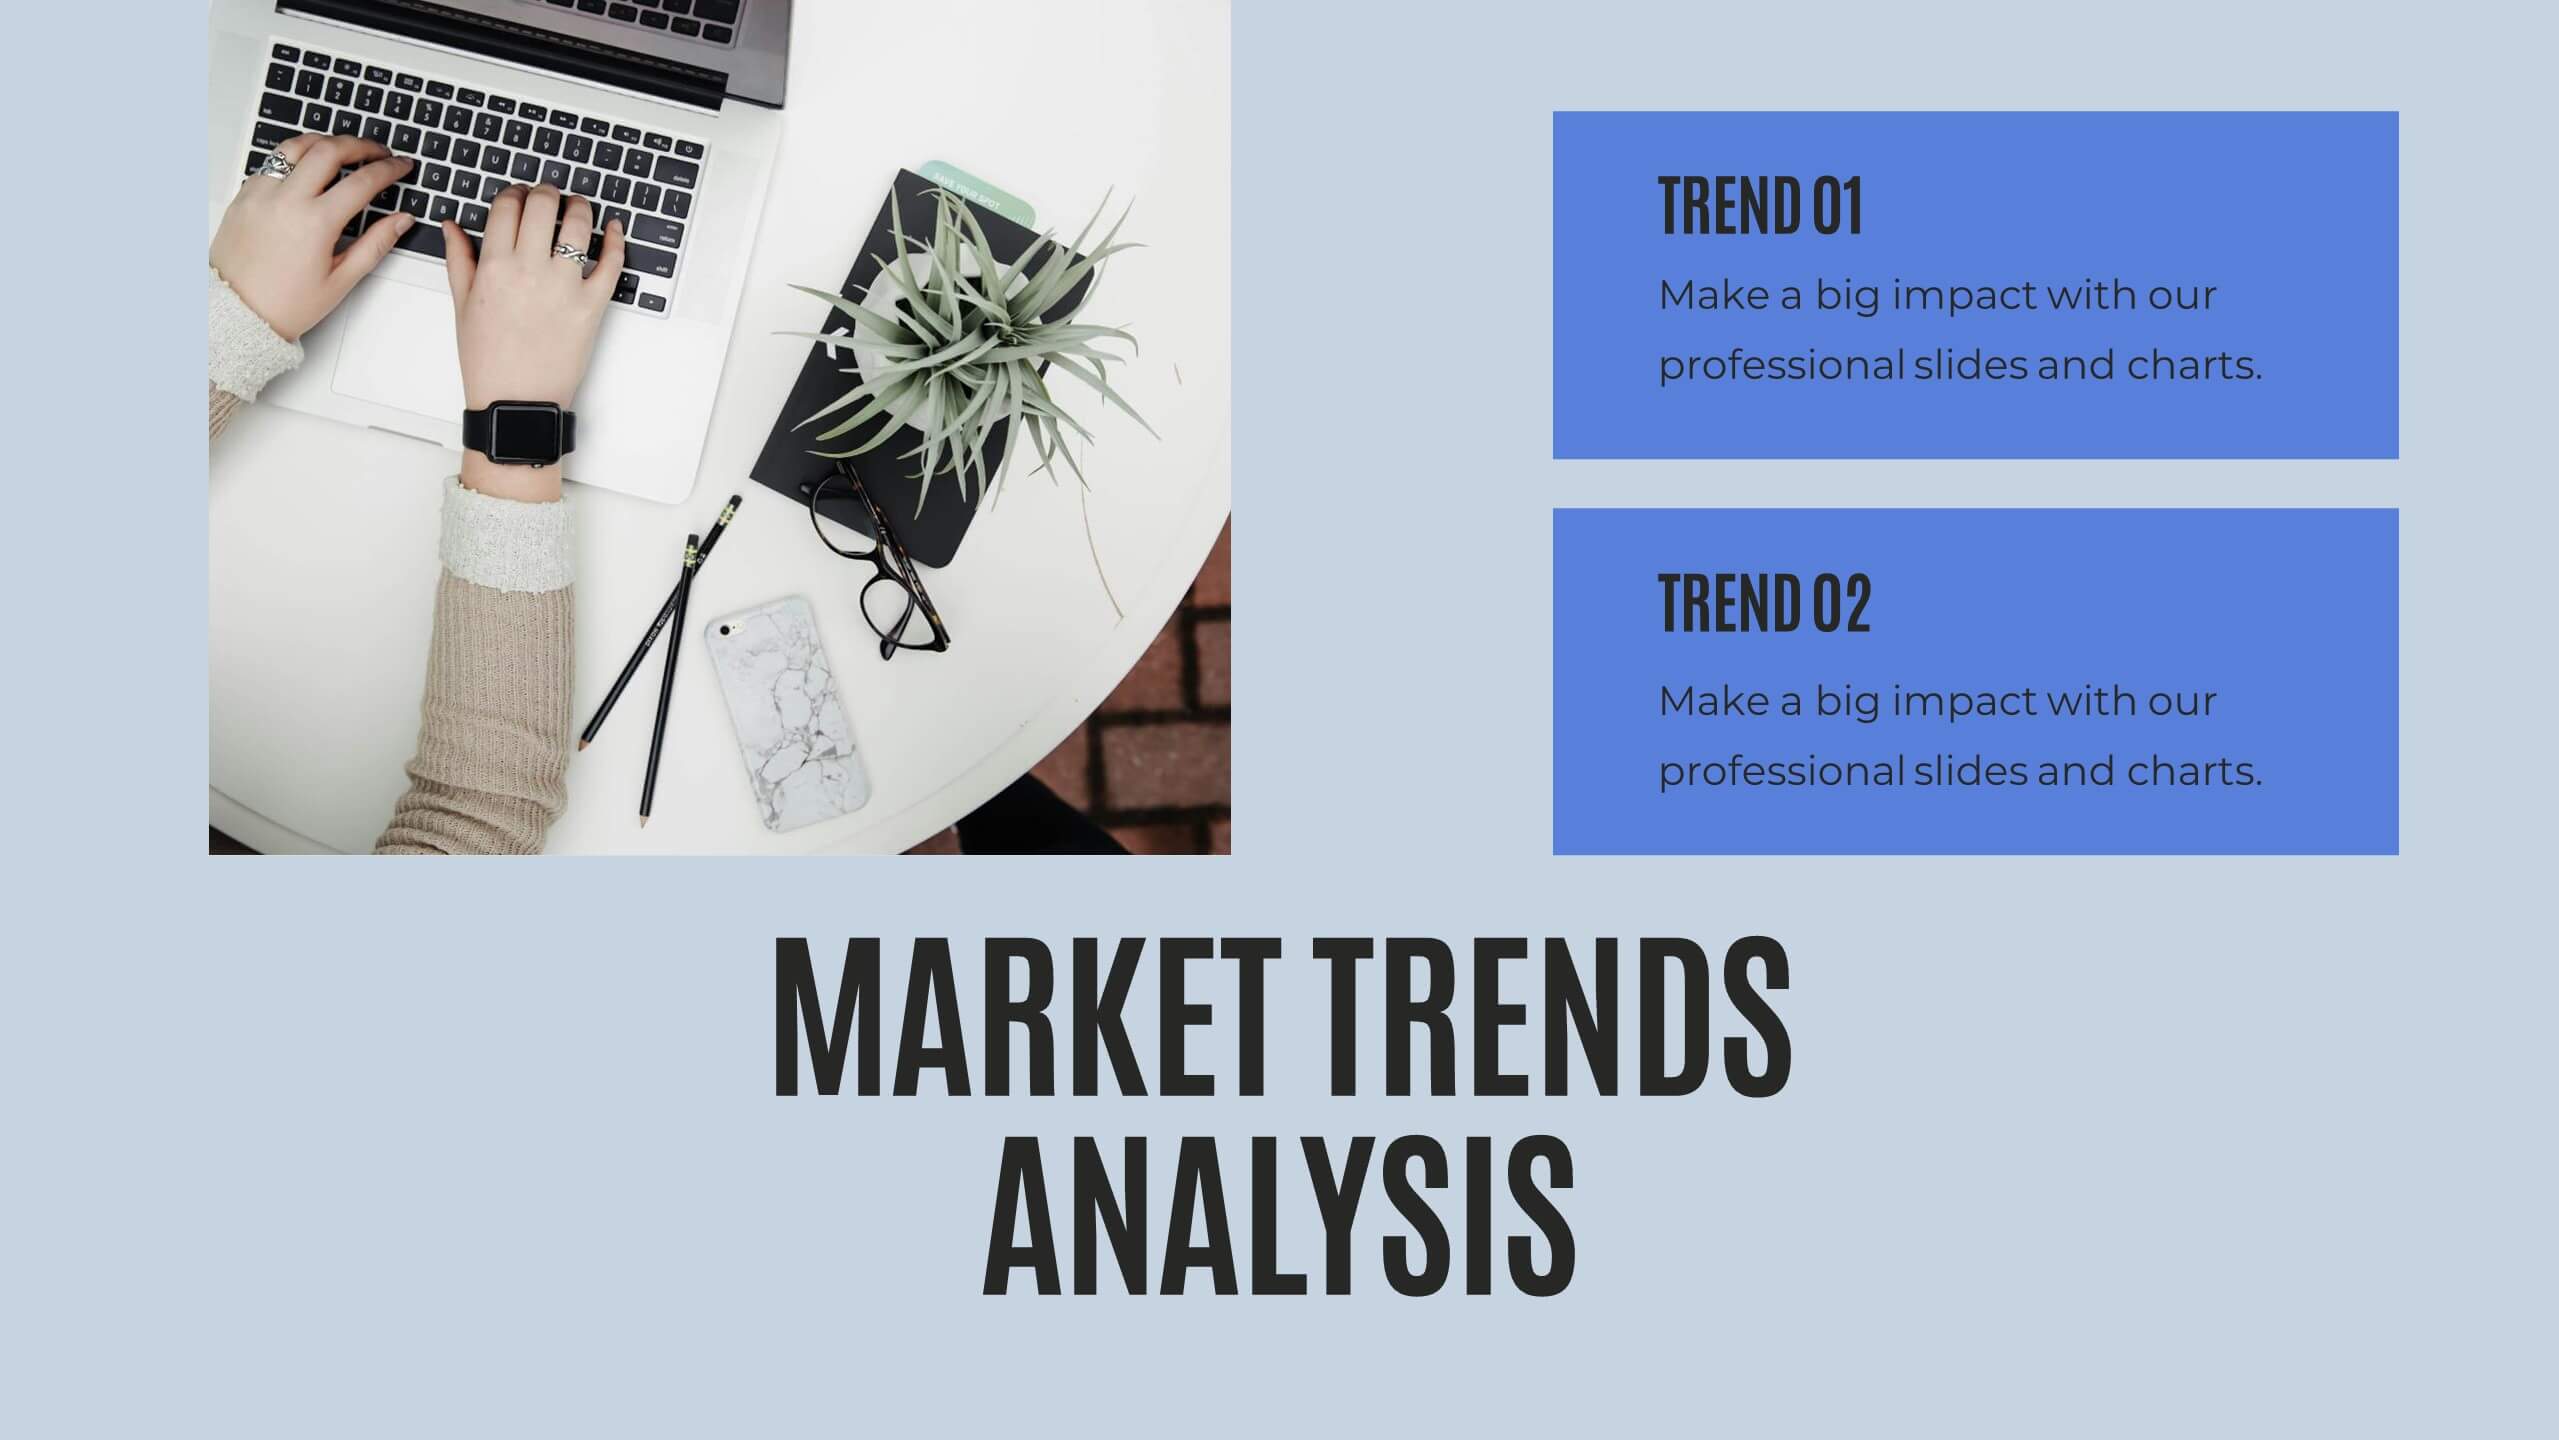
Quill Research Findings Report Presentation
Illuminate your findings with this comprehensive research report template! Perfect for presenting key highlights, performance metrics, and financial summaries, it features professional slides for project progress, risk assessments, and market trends analysis. Engage your audience with clear visuals and detailed content. Compatible with PowerPoint, Keynote, and Google Slides for seamless presentations on any platform.


4 diapositivas
Design and Project Work Samples Presentation
Showcase your creative projects with this visually structured layout. Featuring a bold title area and three image slots for key works, it’s perfect for portfolios, proposals, or pitch decks. Fully editable in PowerPoint, Keynote, and Google Slides to suit your brand and project presentation needs.


24 diapositivas
Minerva UX Design Presentation
Elevate your UX design presentations with this comprehensive template, featuring sections for project overview, user research, wireframes, prototyping, and usability testing. Showcase design systems, branding guidelines, and accessibility considerations with ease. Perfect for demonstrating a user-centered approach. Compatible with PowerPoint, Keynote, and Google Slides for seamless customization.


21 diapositivas
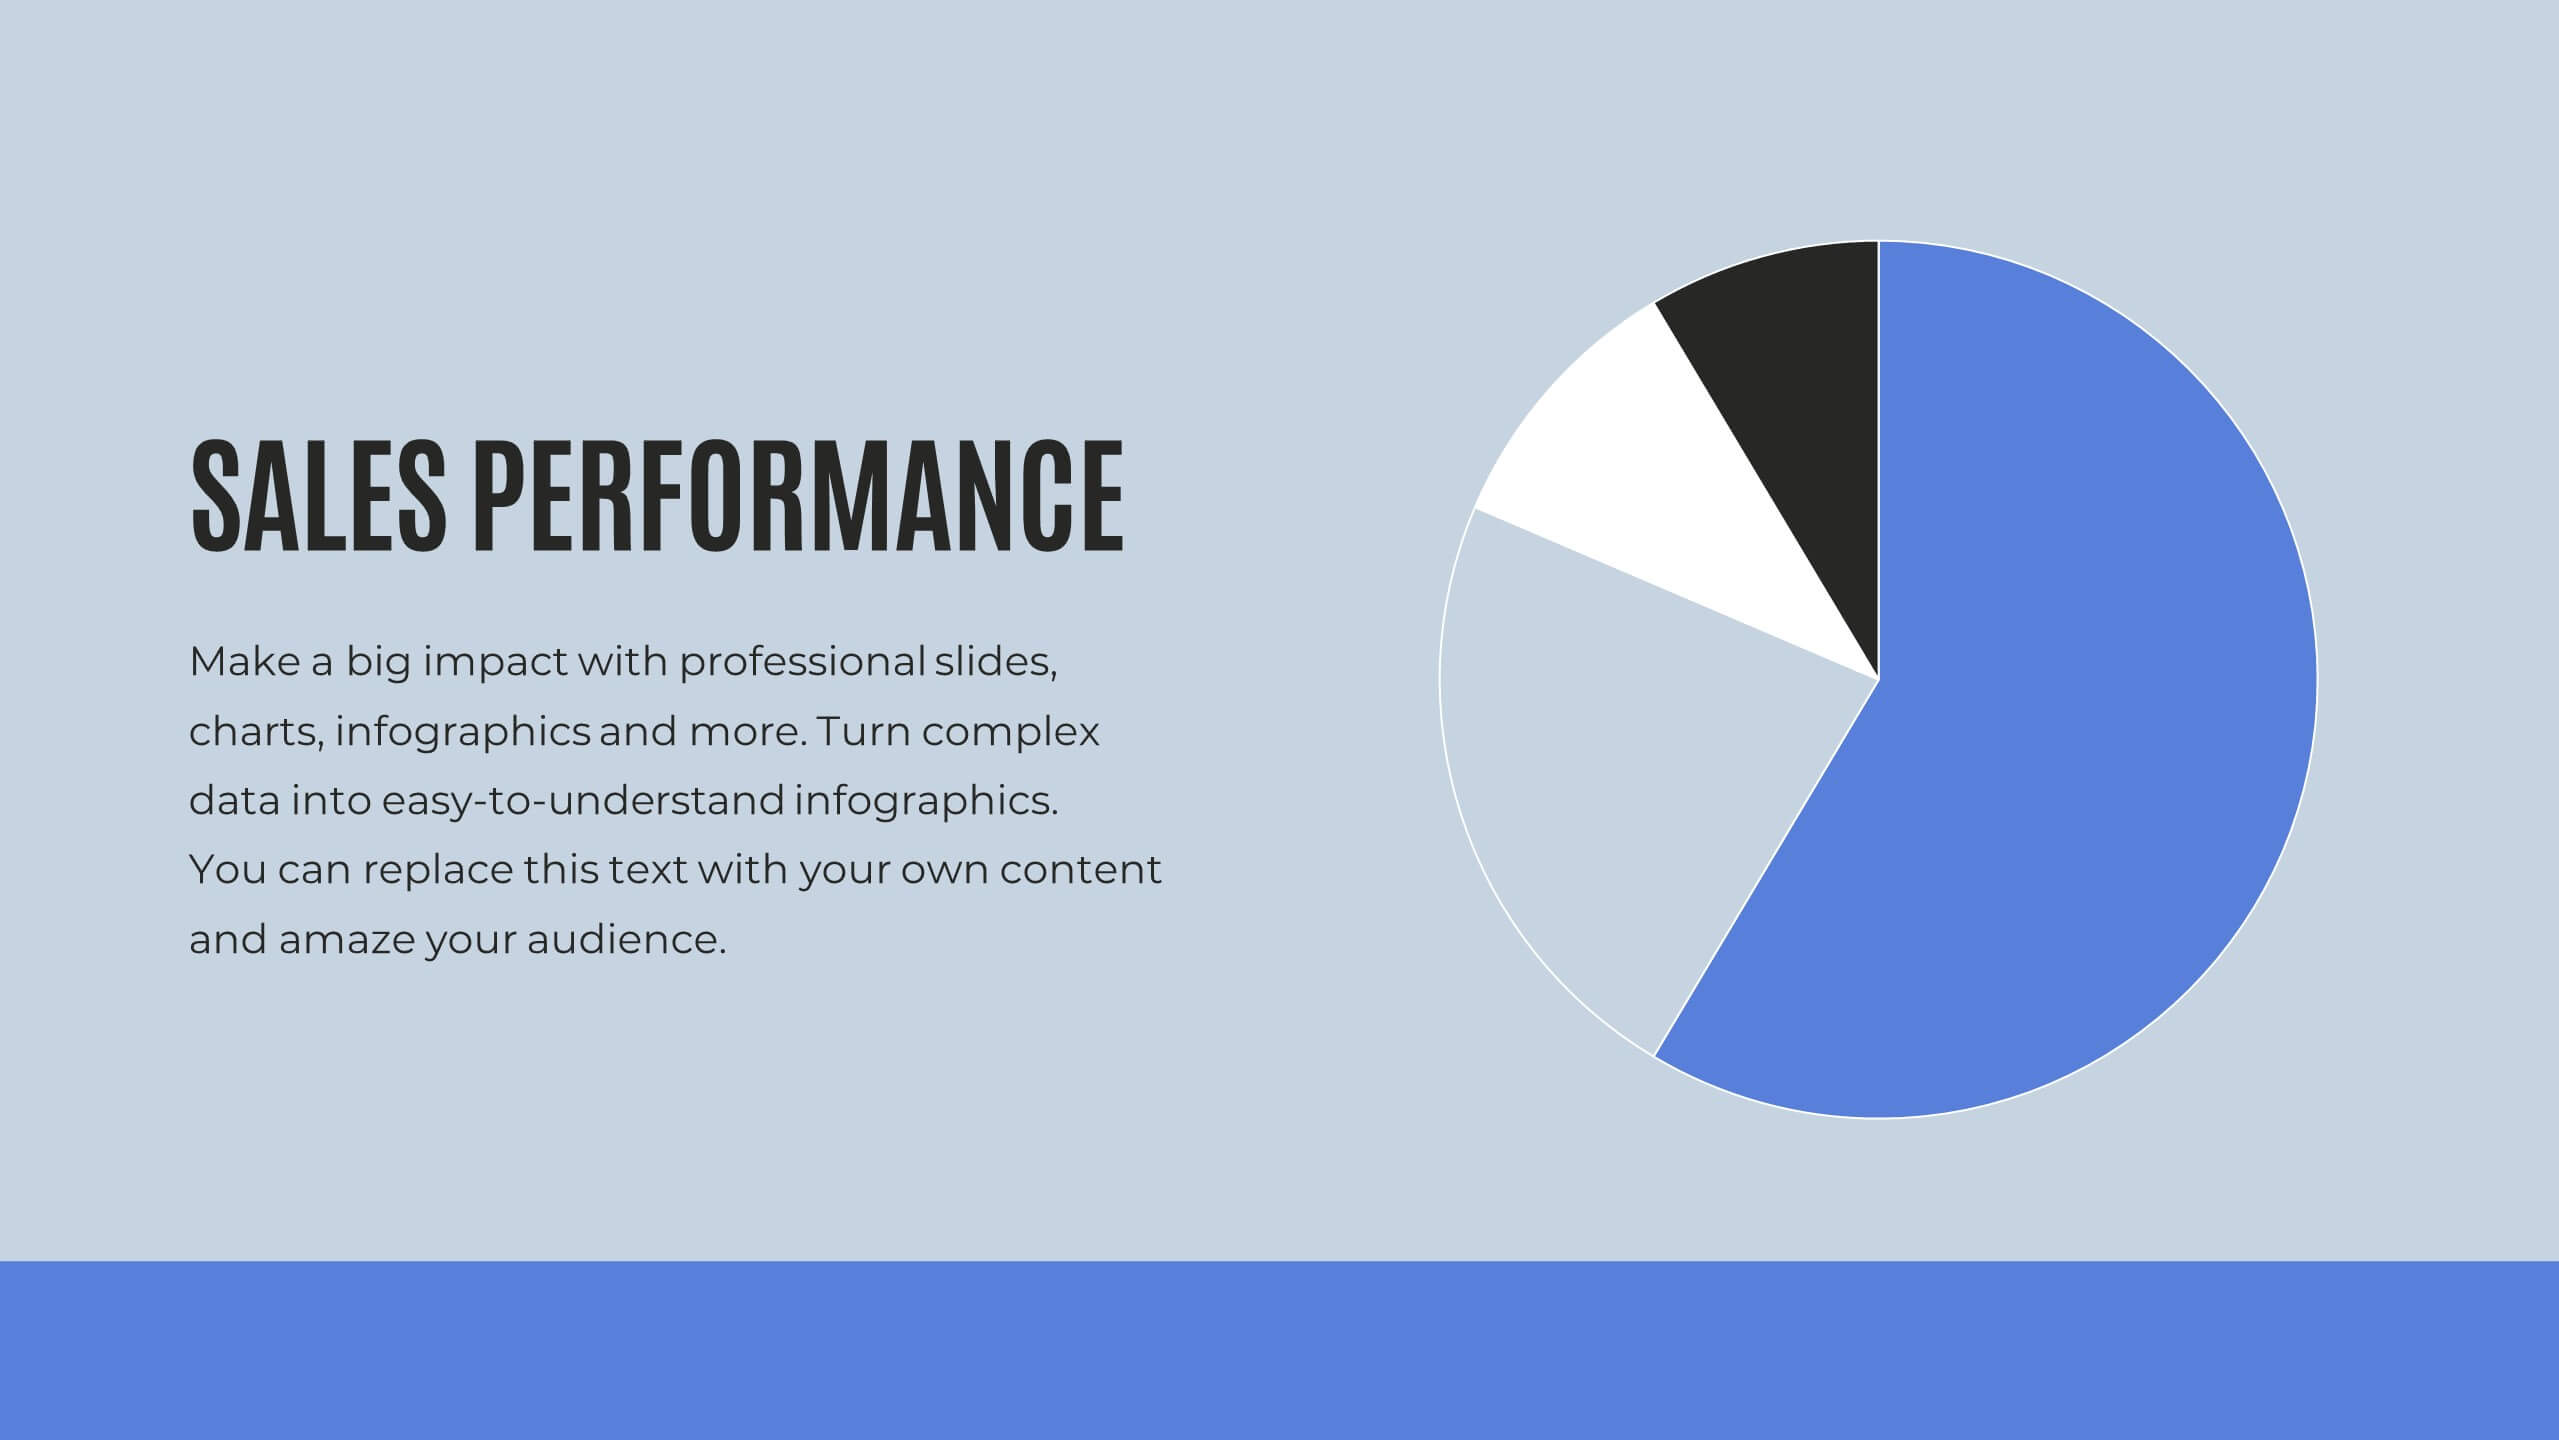
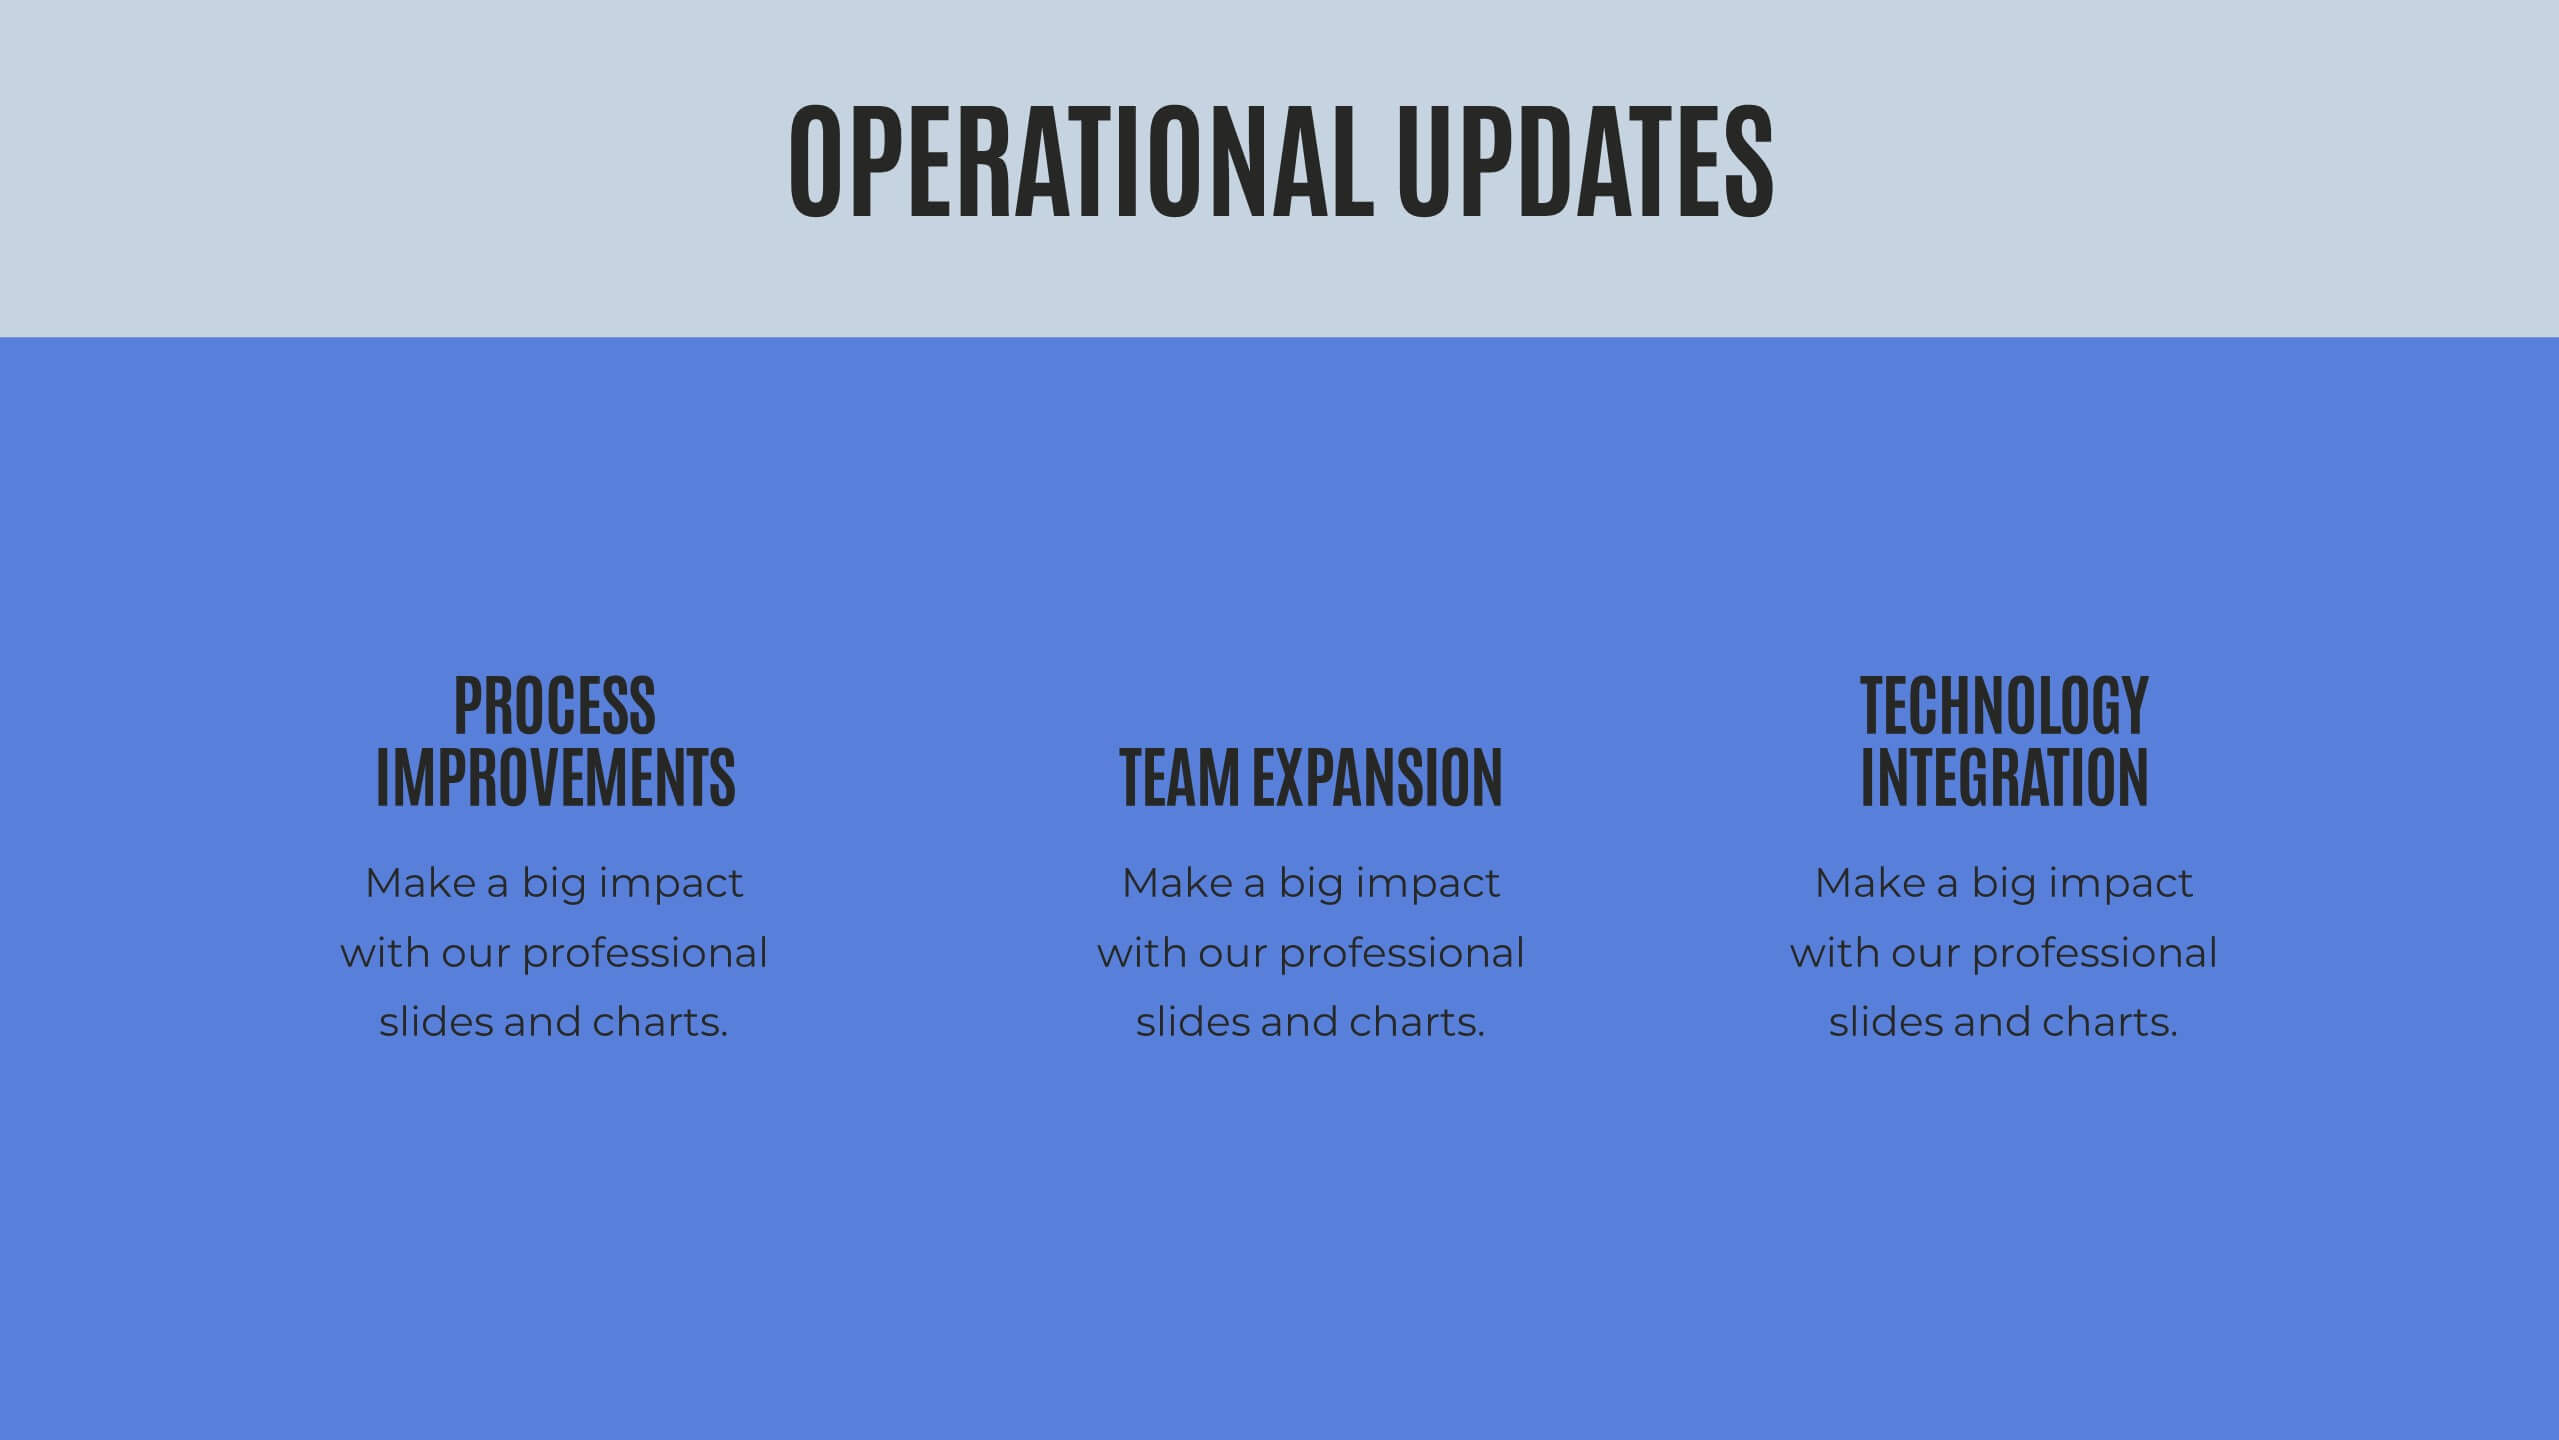
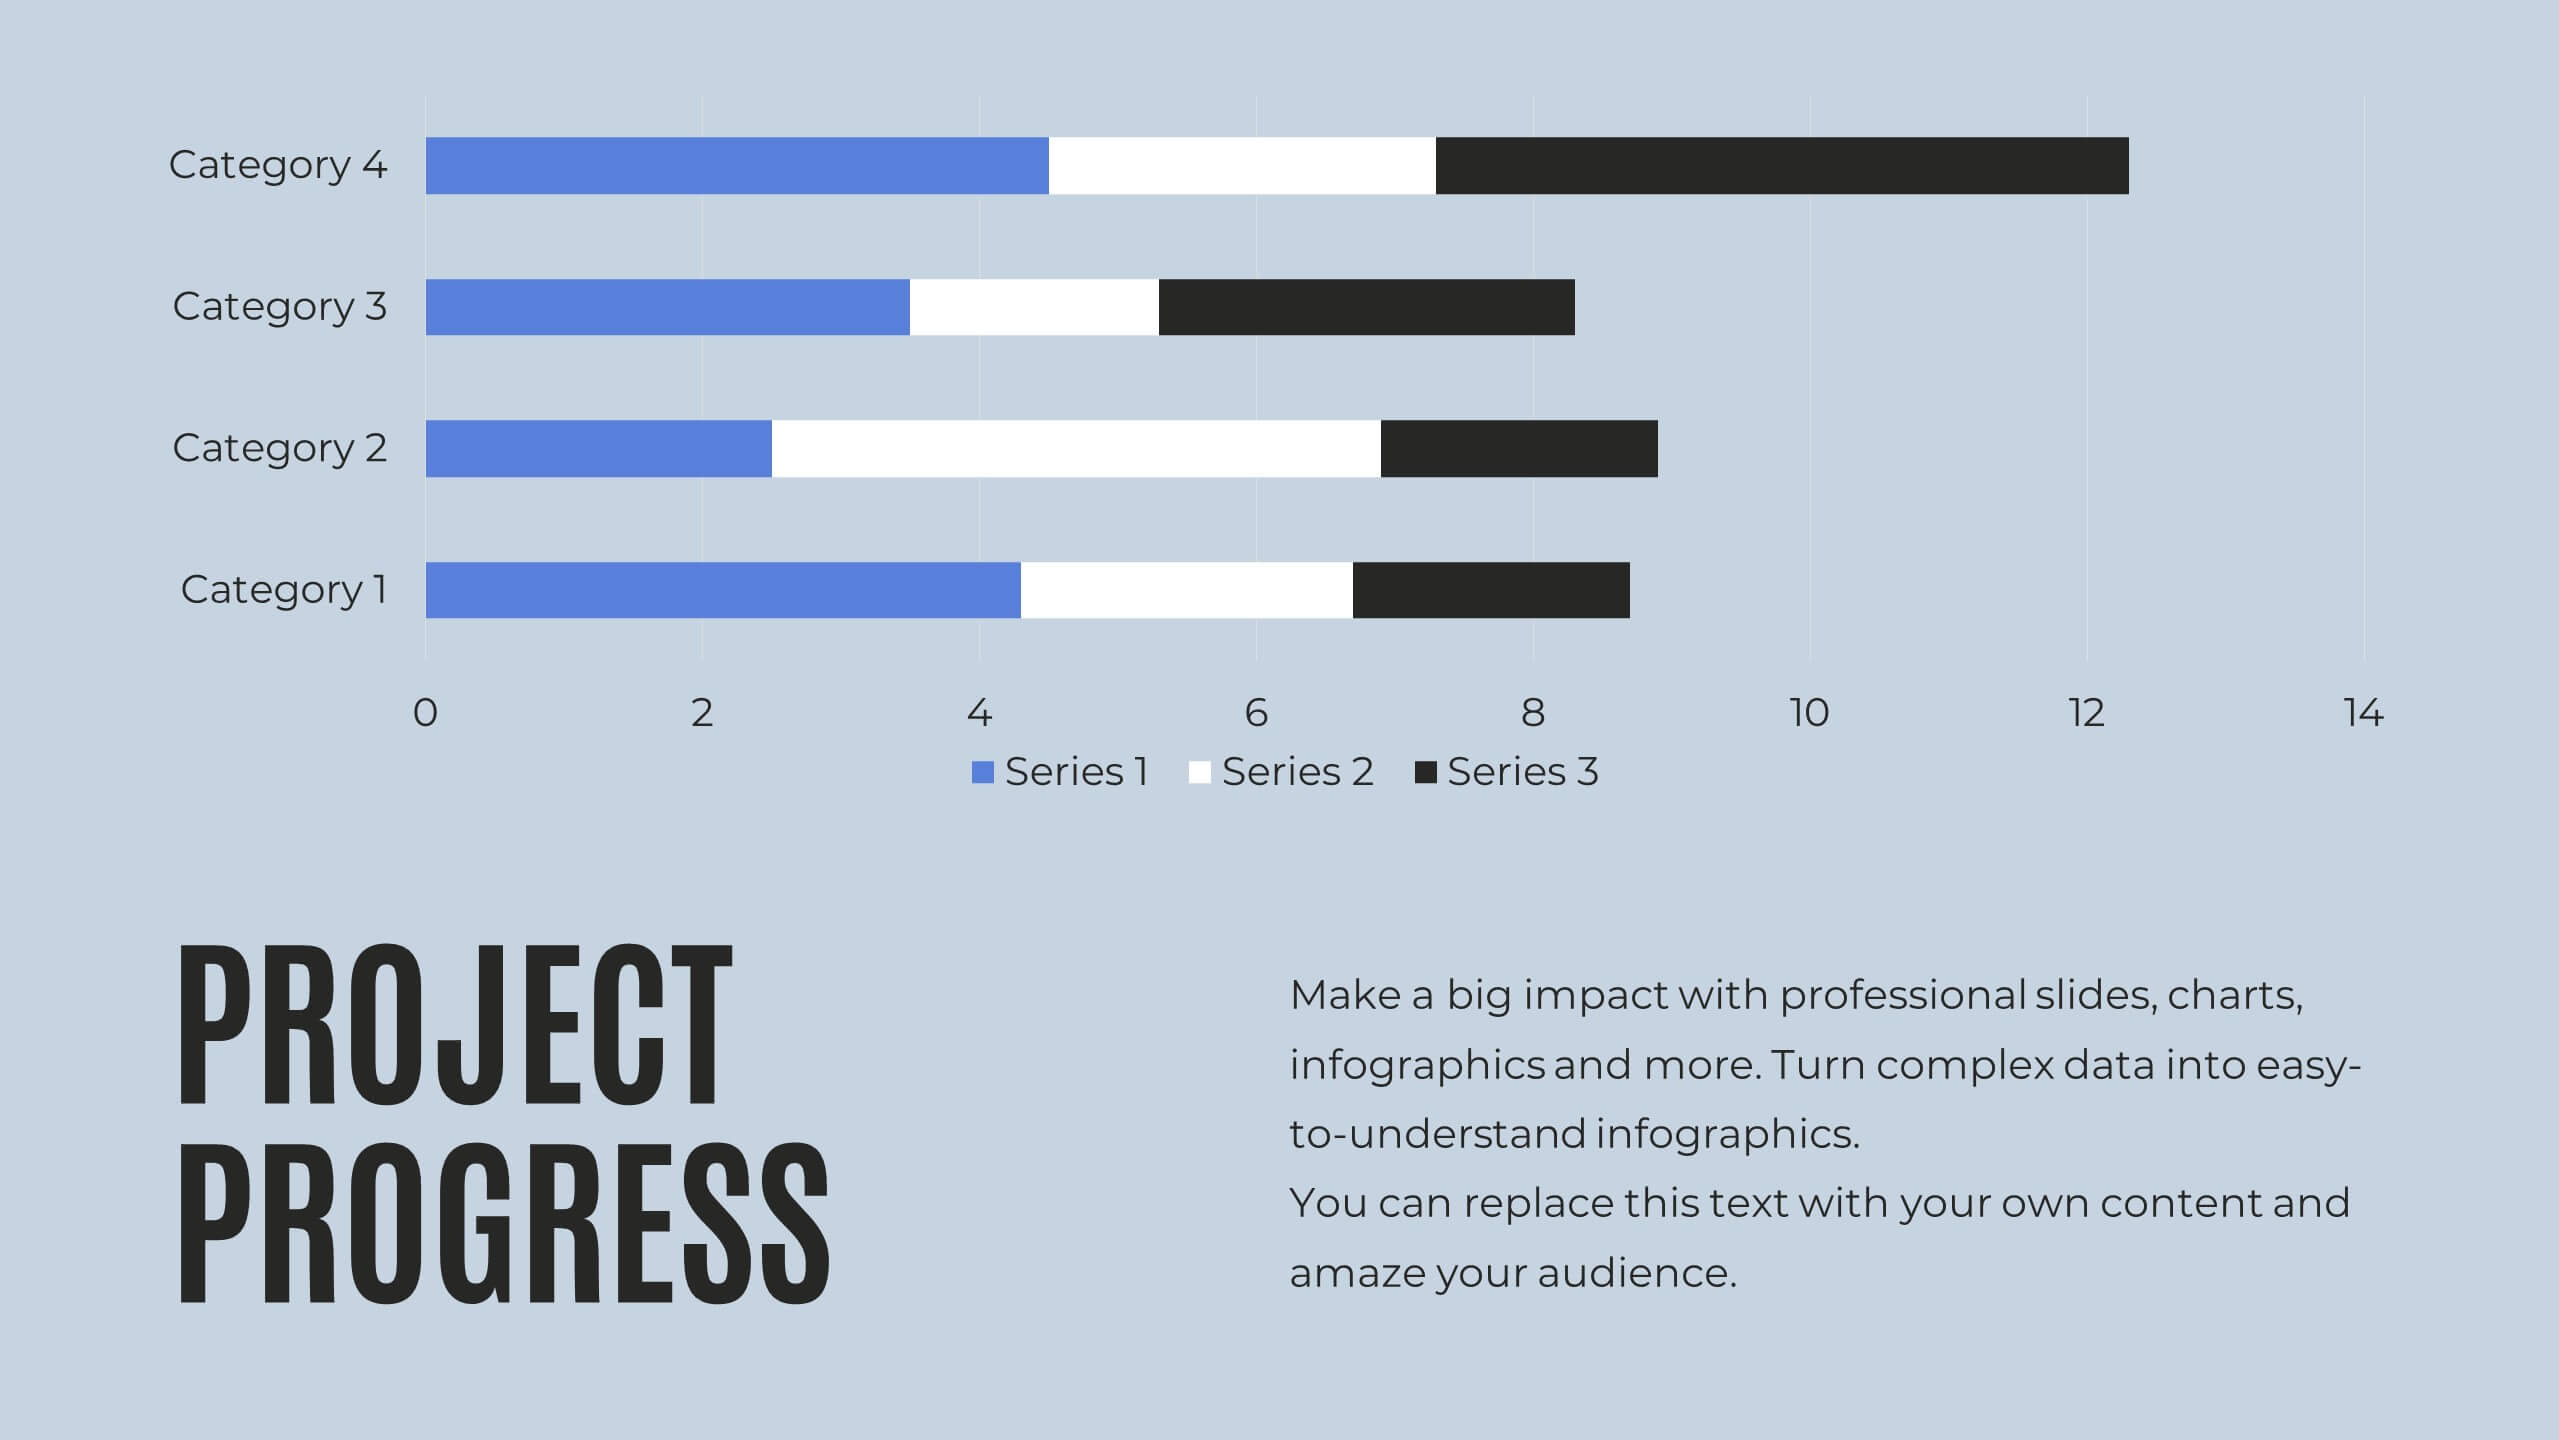
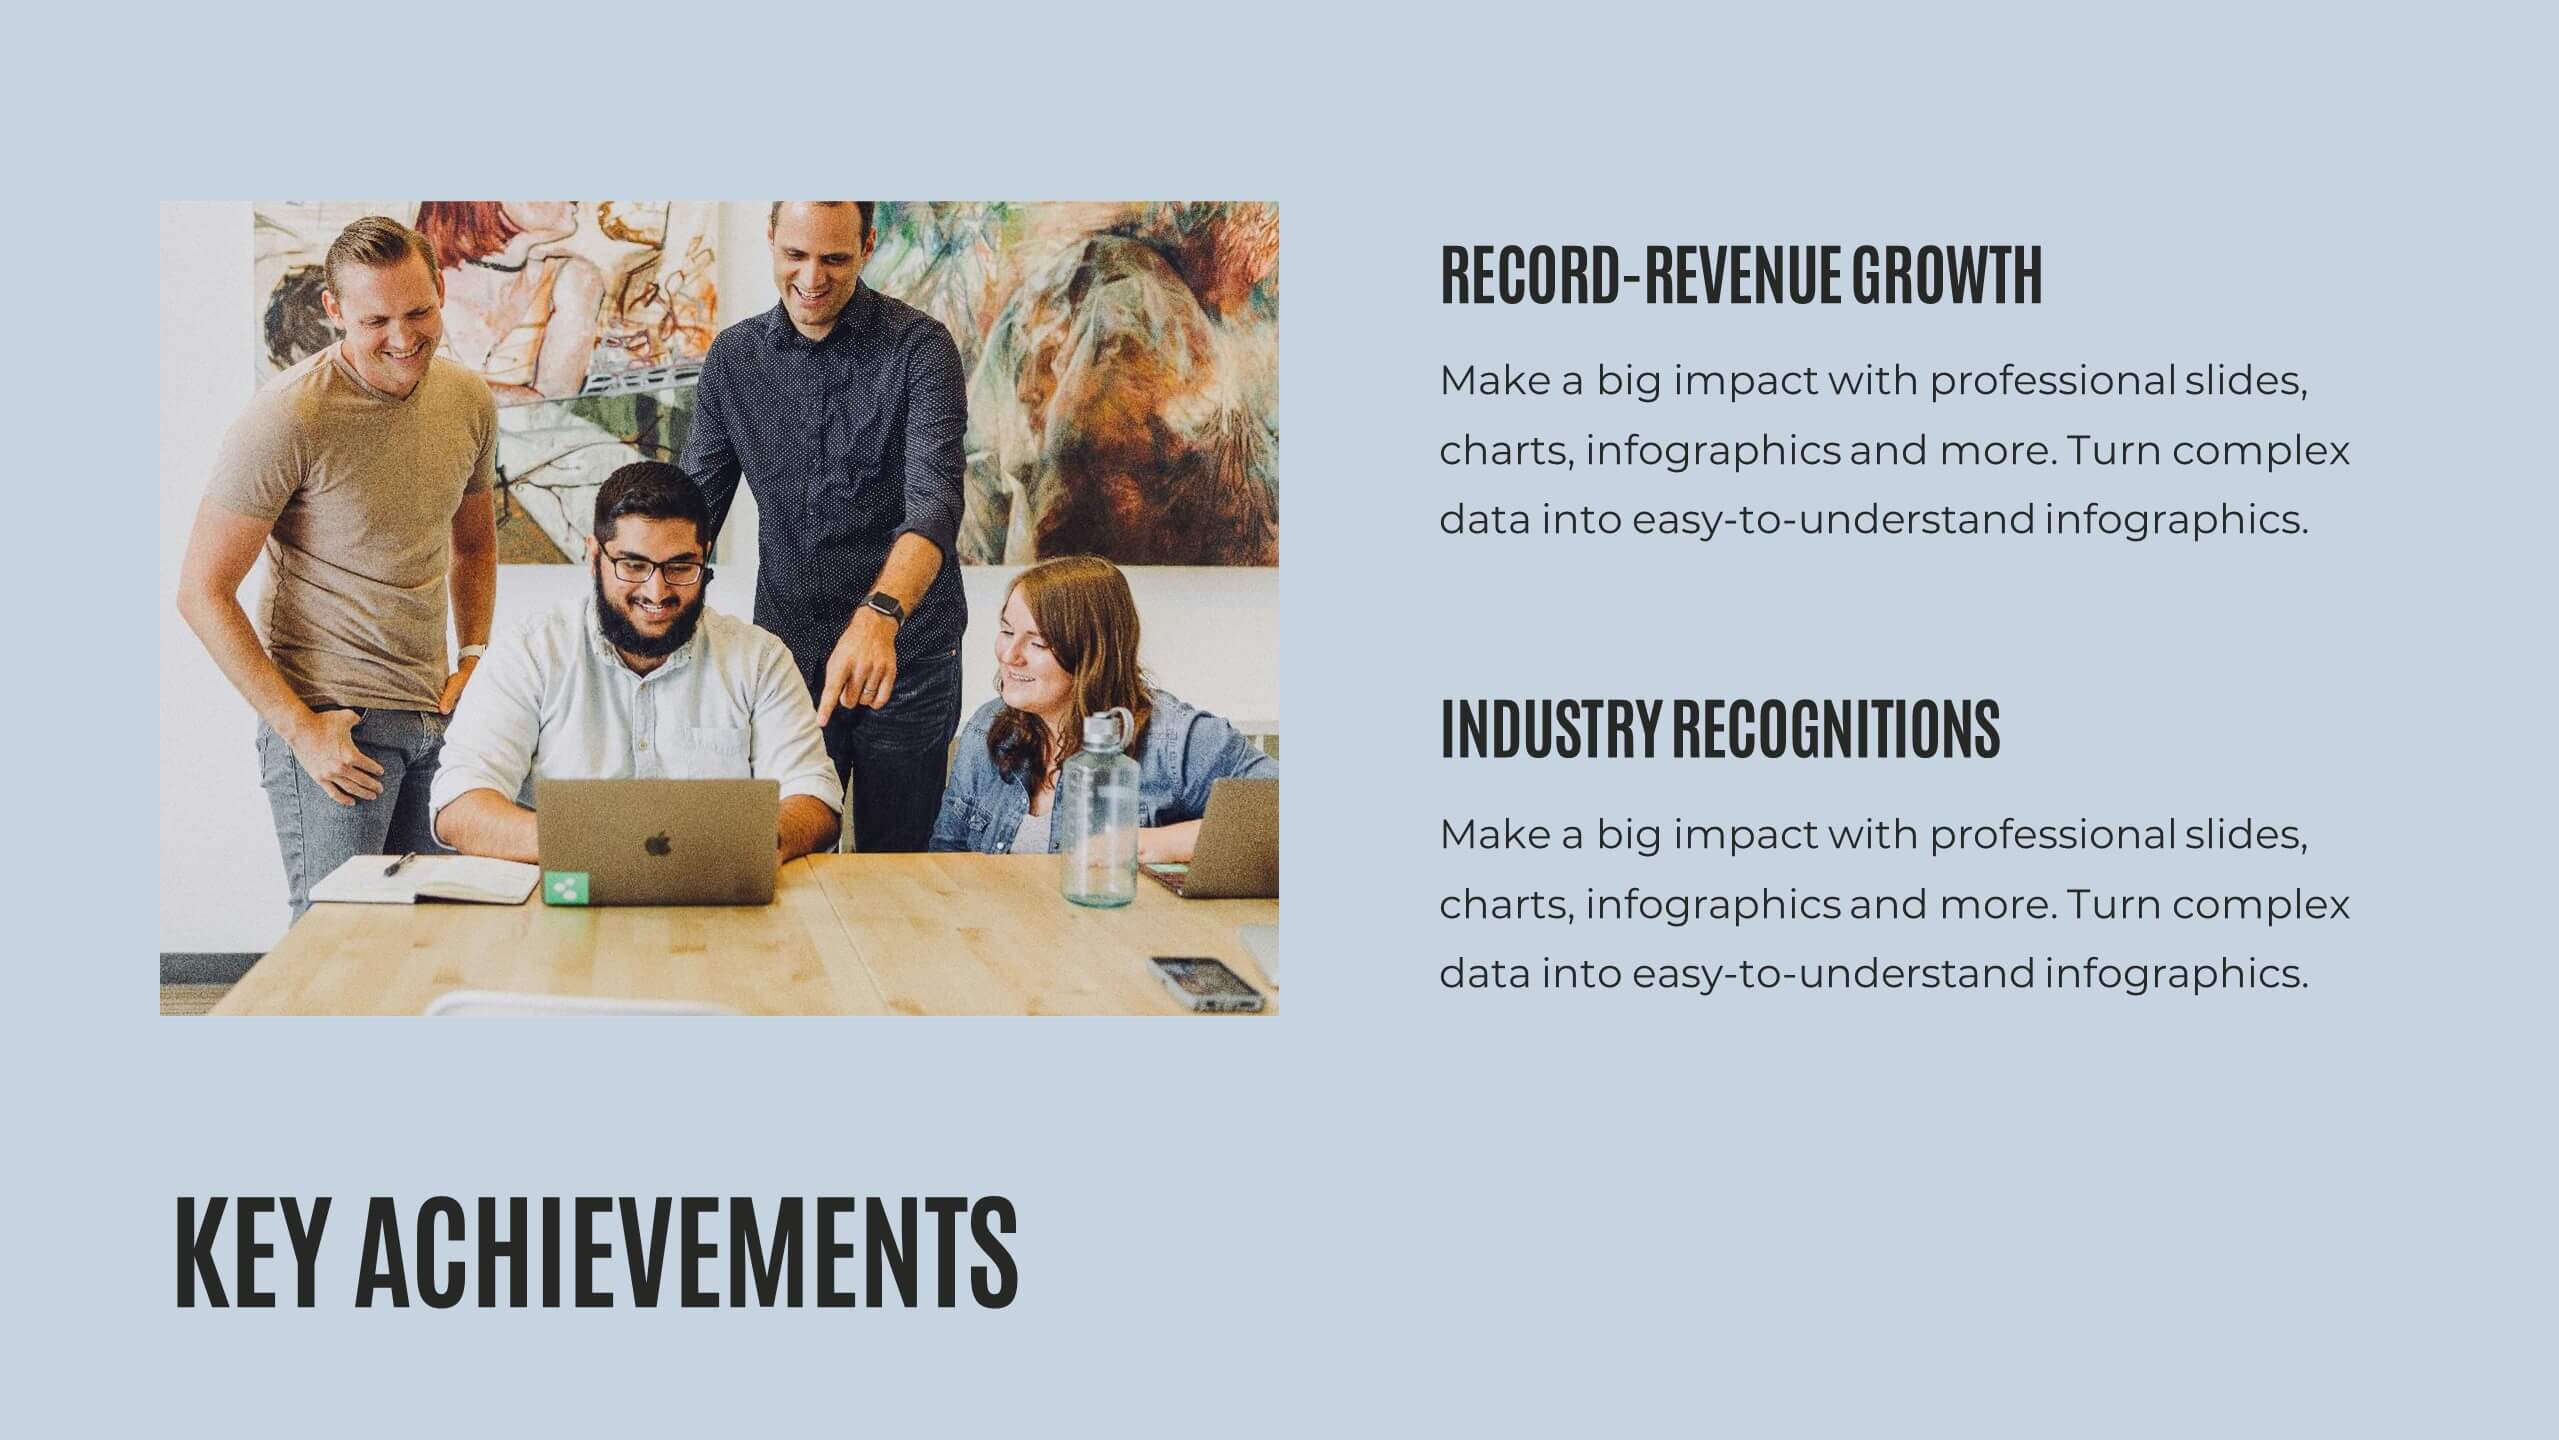
Synergywave Financial Report Presentation
Deliver your financial insights with clarity using this comprehensive report presentation! It covers key sections like performance metrics, sales updates, market trends, and strategic initiatives, ensuring all critical data is well-organized. Whether for stakeholders or internal reviews, this template ensures seamless communication. Fully compatible with PowerPoint, Keynote, and Google Slides.


5 diapositivas
Product Marketing Slide Presentation
Spark interest instantly with a bold, circular layout that transforms product insights into a clean, memorable story. This presentation helps you explain features, audience needs, and value propositions in an organized, visual flow that keeps attention on what matters most. Fully customizable for PowerPoint, Keynote, and Google Slides.


5 diapositivas
Employee Onboarding 30-60-90 Day Plan
Set new hires up for success with this visual 30-60-90 Day Plan tailored for employee onboarding. Featuring progress-style gauges and clear milestone breakdowns, this template helps HR teams and managers communicate expectations, goals, and achievements across each phase. Fully customizable in PowerPoint, Keynote, and Google Slides.


6 diapositivas
Closing Summary and Key Takeaways Presentation
Wrap up your presentation with clarity using the Closing Summary and Key Takeaways Presentation. This slide features a semi-circular segmented layout, ideal for highlighting 3–5 final points, action steps, or reflections. Clean, modern, and easy to customize in PowerPoint, Keynote, Google Slides, or Canva—perfect for impactful conclusions.


19 diapositivas
Sales Proposal Presentation
Secure your next big deal with our Sales Proposal presentation template, tailored to make your pitch unforgettable. It's a comprehensive toolkit for sales professionals designed to address every aspect of your offering. The slides smoothly guide your audience through your company overview, mission, product or service features, and the solutions you provide to the client's problems. They are meticulously structured to help you outline your value proposition, address customer pain points, and present a convincing case with customer testimonials. The design is not just visually appealing but also conducive to narrative flow, presenting cost and pricing details with clarity, and allowing room for engaging Q&A sessions. This template is ideal for sales pitches, adaptable across PowerPoint, Keynote, and Google Slides. It helps you build a persuasive argument for why your solution is the best fit for the client, providing a professional edge in a competitive marketplace.


23 diapositivas
Quest Qualitative Research Findings Presentation
This dynamic and sleek research template presents qualitative findings with style and clarity. Dive into research objectives, data collection, key findings, and future directions, all showcased with a minimalist black-and-white design. Perfect for impactful presentations, this template is compatible with PowerPoint, Keynote, and Google Slides, making it versatile for any audience!


6 diapositivas
Professional Meeting Agenda Presentation
Plan your meetings with clarity and structure using the Professional Meeting Agenda Presentation. This clean, 5-step layout visually organizes agenda items alongside bold numbers and relevant icons to guide discussion. Perfect for team syncs, business reviews, or project briefings. Fully customizable in PowerPoint, Keynote, and Google Slides.


7 diapositivas
Project Proposal Structure Infographic
Optimize your project planning and presentation with this professional set of project proposal structure templates. Each slide is designed to systematically display project details, from the introduction and objectives to the detailed work plan and budget. These templates are essential tools for project managers, strategists, and business analysts aiming to convey comprehensive project proposals. Structured to support clear communication, the templates feature a logical flow that guides viewers through each critical component of the proposal. The use of a consistent blue color palette and clean typography helps maintain focus on the content, while graphical elements like charts and timelines visually break down complex information, making it easily digestible for stakeholders. Fully customizable, these templates allow for easy adaptations to specific project needs, enabling precise tailoring of text, color, and design elements. Whether for internal project approval or external client pitches, these slides will help you present a clear, structured, and persuasive project proposal.


26 diapositivas
Briarfall Rebranding Project Plan Presentation
This Brand Presentation Template offers a modern and structured approach to showcasing your brand identity, values, and strategic direction. Covering essential elements like audience personas, brand positioning, touchpoints, and performance metrics, it's fully customizable and perfect for businesses looking to strengthen their brand presence. Compatible with PowerPoint, Keynote, and Google Slides.


20 diapositivas
Galaxion Marketing Proposal Presentation
This Marketing Proposal Presentation template offers a comprehensive structure to showcase your strategies, goals, and financial plans effectively. Covering key sections such as objectives, budget breakdown, and timeline, it's perfect for making a strong impression. Fully customizable and compatible with PowerPoint, Keynote, and Google Slides for seamless adaptation to your needs.