


Características


¿Tienes alguna pregunta?
Recomendar


6 diapositivas
Bubble Diagram for Idea Development
Streamline your brainstorming sessions and visualize concept progression with this Bubble Diagram for Idea Development presentation. Featuring a circular, color-coded layout from A to F, it’s ideal for mapping interconnected ideas, workflows, or innovation cycles. Easily editable in PowerPoint, Keynote, and Google Slides.


7 diapositivas
Sports Infographic Presentation Template
A sports infographic is a visual representation of information or knowledge related to a sport or sporting event. This template allows you to include statistics, performance metrics, records, and other relevant data that helps to explain and showcase the sport. Our sports infographic also include images, illustrations, and other graphic elements that can help to tell a story. They can be used in a variety of settings. The goal of this sports infographic is to present your information in a clear and engaging way, and to help your audience understand and appreciate the sport more deeply.


6 diapositivas
Best Pricing Tables Infographics
Maximize your product or service presentation with our Best Pricing Tables infographic template. This template is fully compatible with popular presentation software like PowerPoint, Keynote, and Google Slides, allowing you to easily customize it to showcase your pricing structures effectively. The Best Pricing Tables infographic template offers a visually appealing platform to display different pricing tiers, features, and benefits. Whether you're a business owner, marketer, or sales professional, this template provides a user-friendly canvas to create pricing tables that captivate your audience. Optimize your pricing strategy with this SEO-optimized Best Pricing Tables infographic template, thoughtfully designed for clarity and ease of use. Customize it to highlight competitive advantages, discounts, and special offers, helping you convert potential customers into loyal clients. Start crafting your personalized pricing tables today to boost your sales and revenue!


21 diapositivas
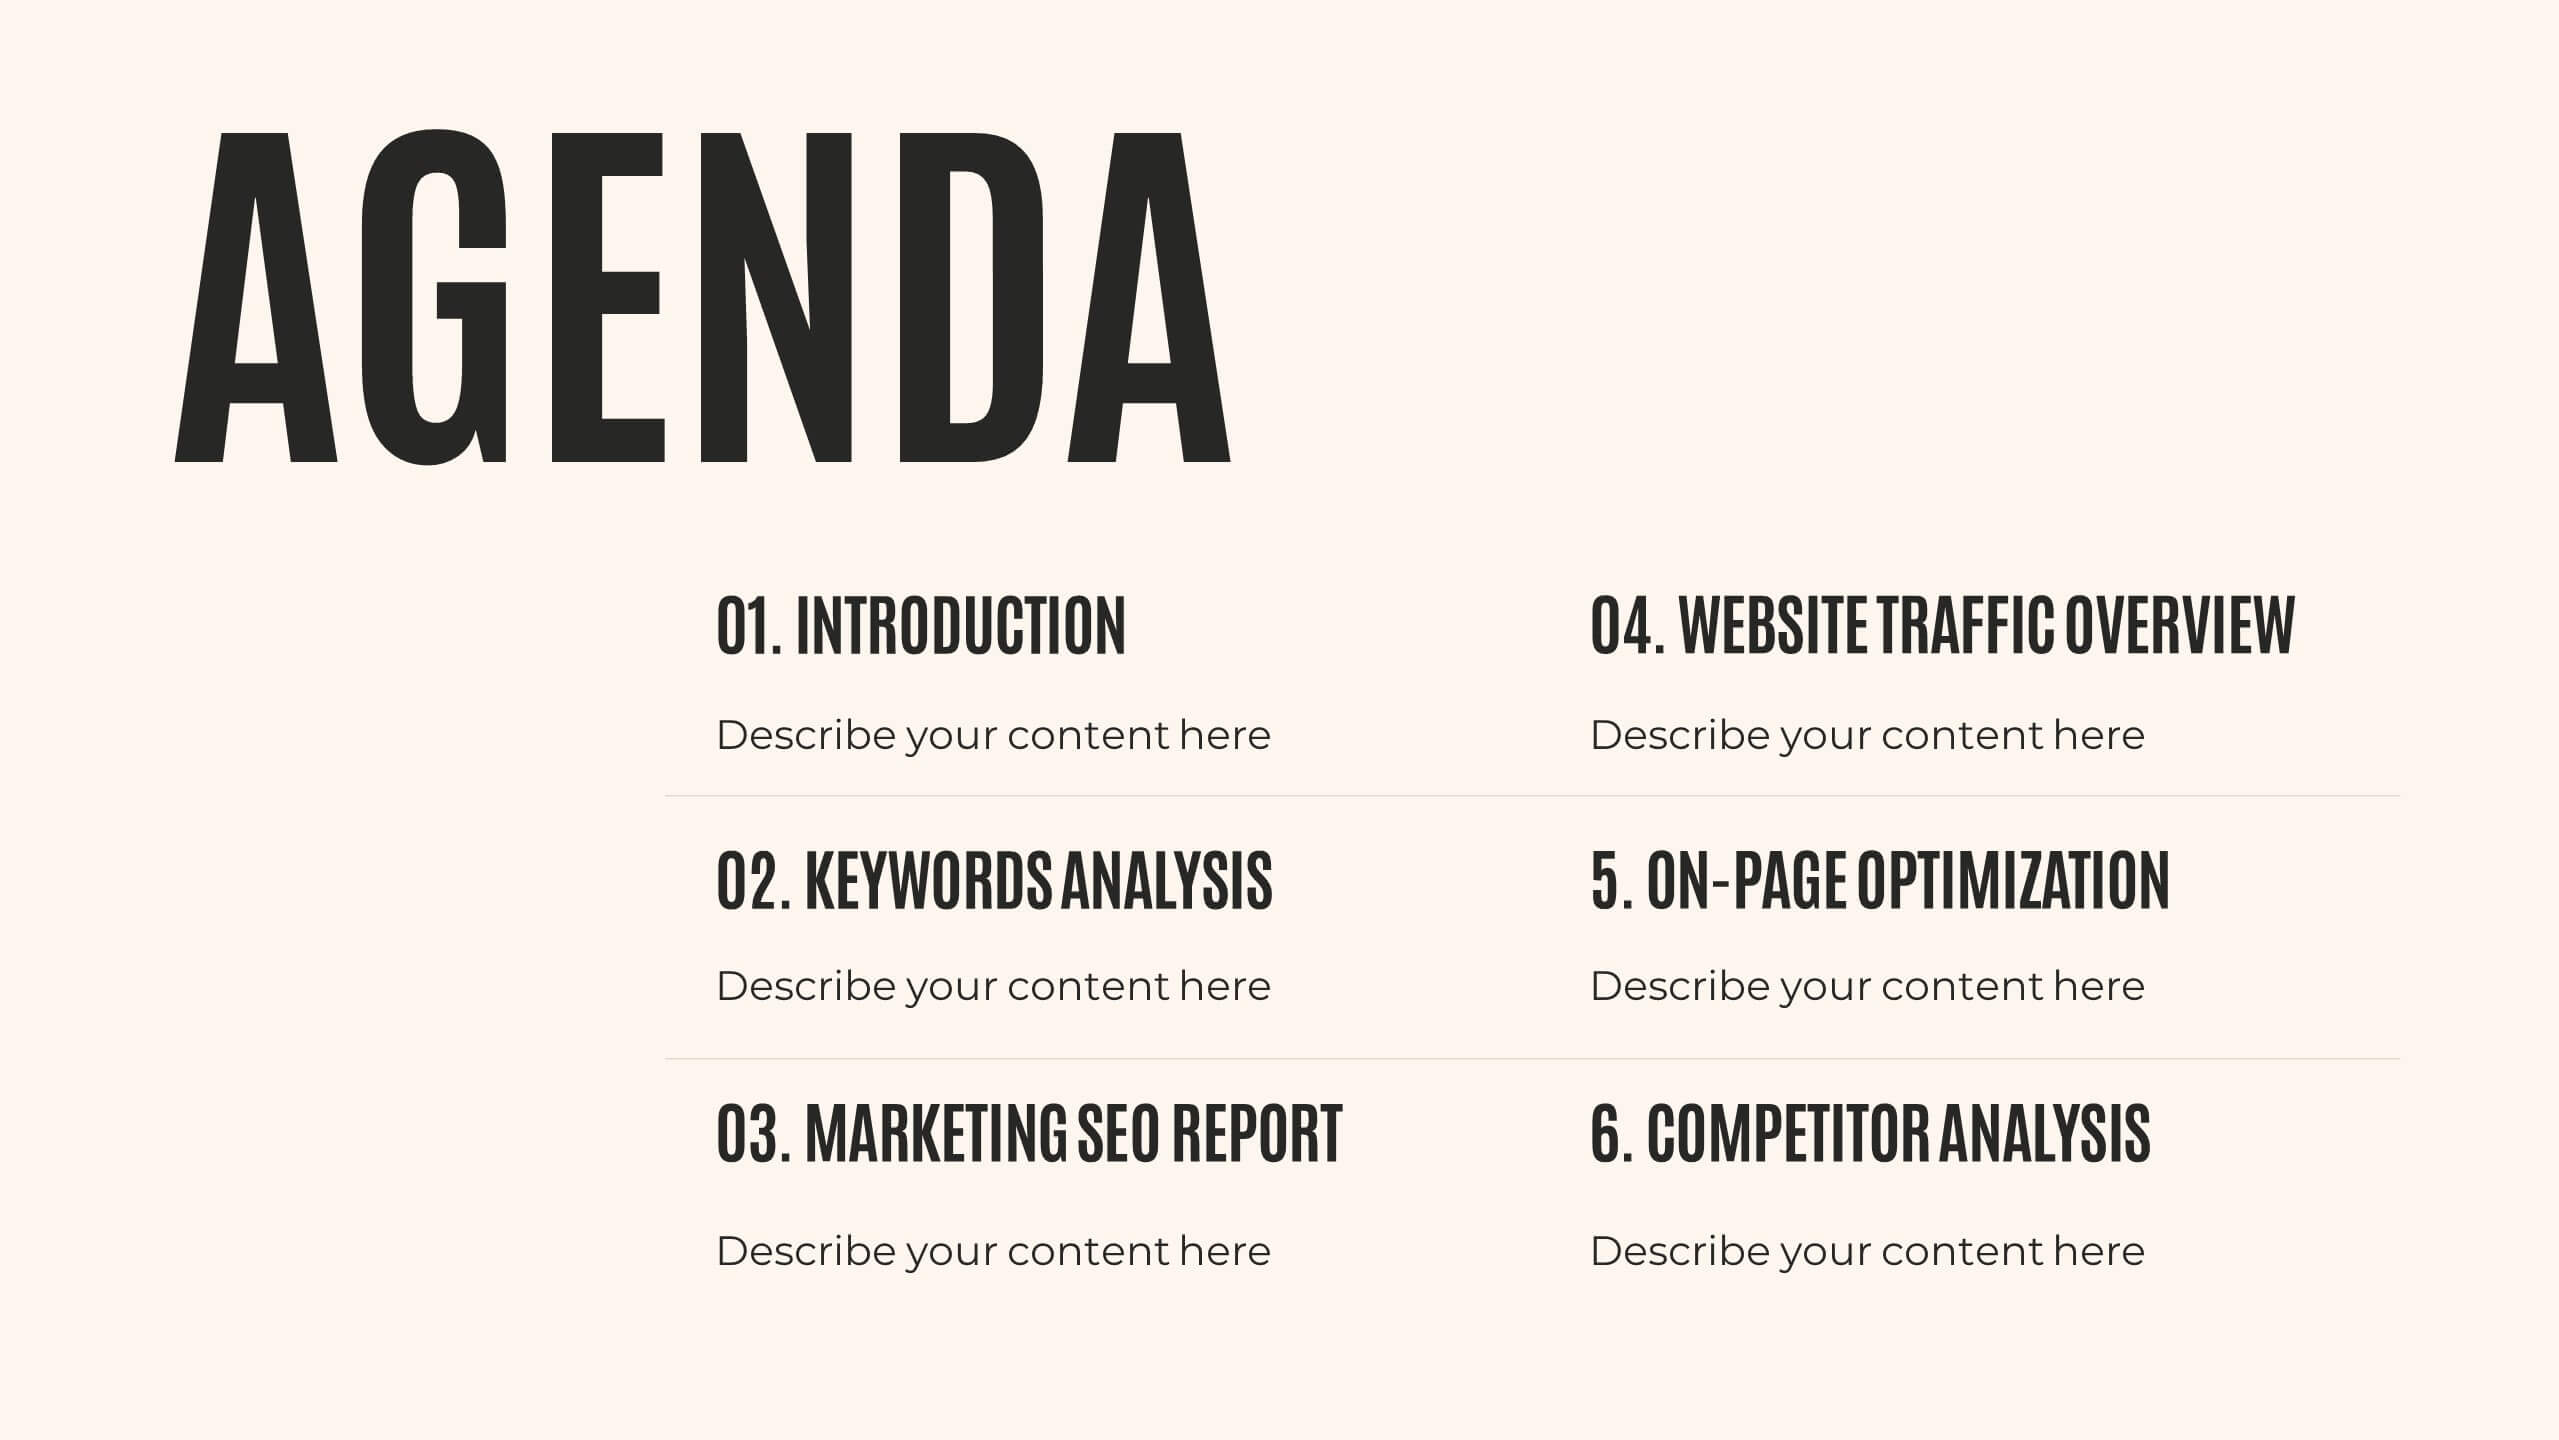
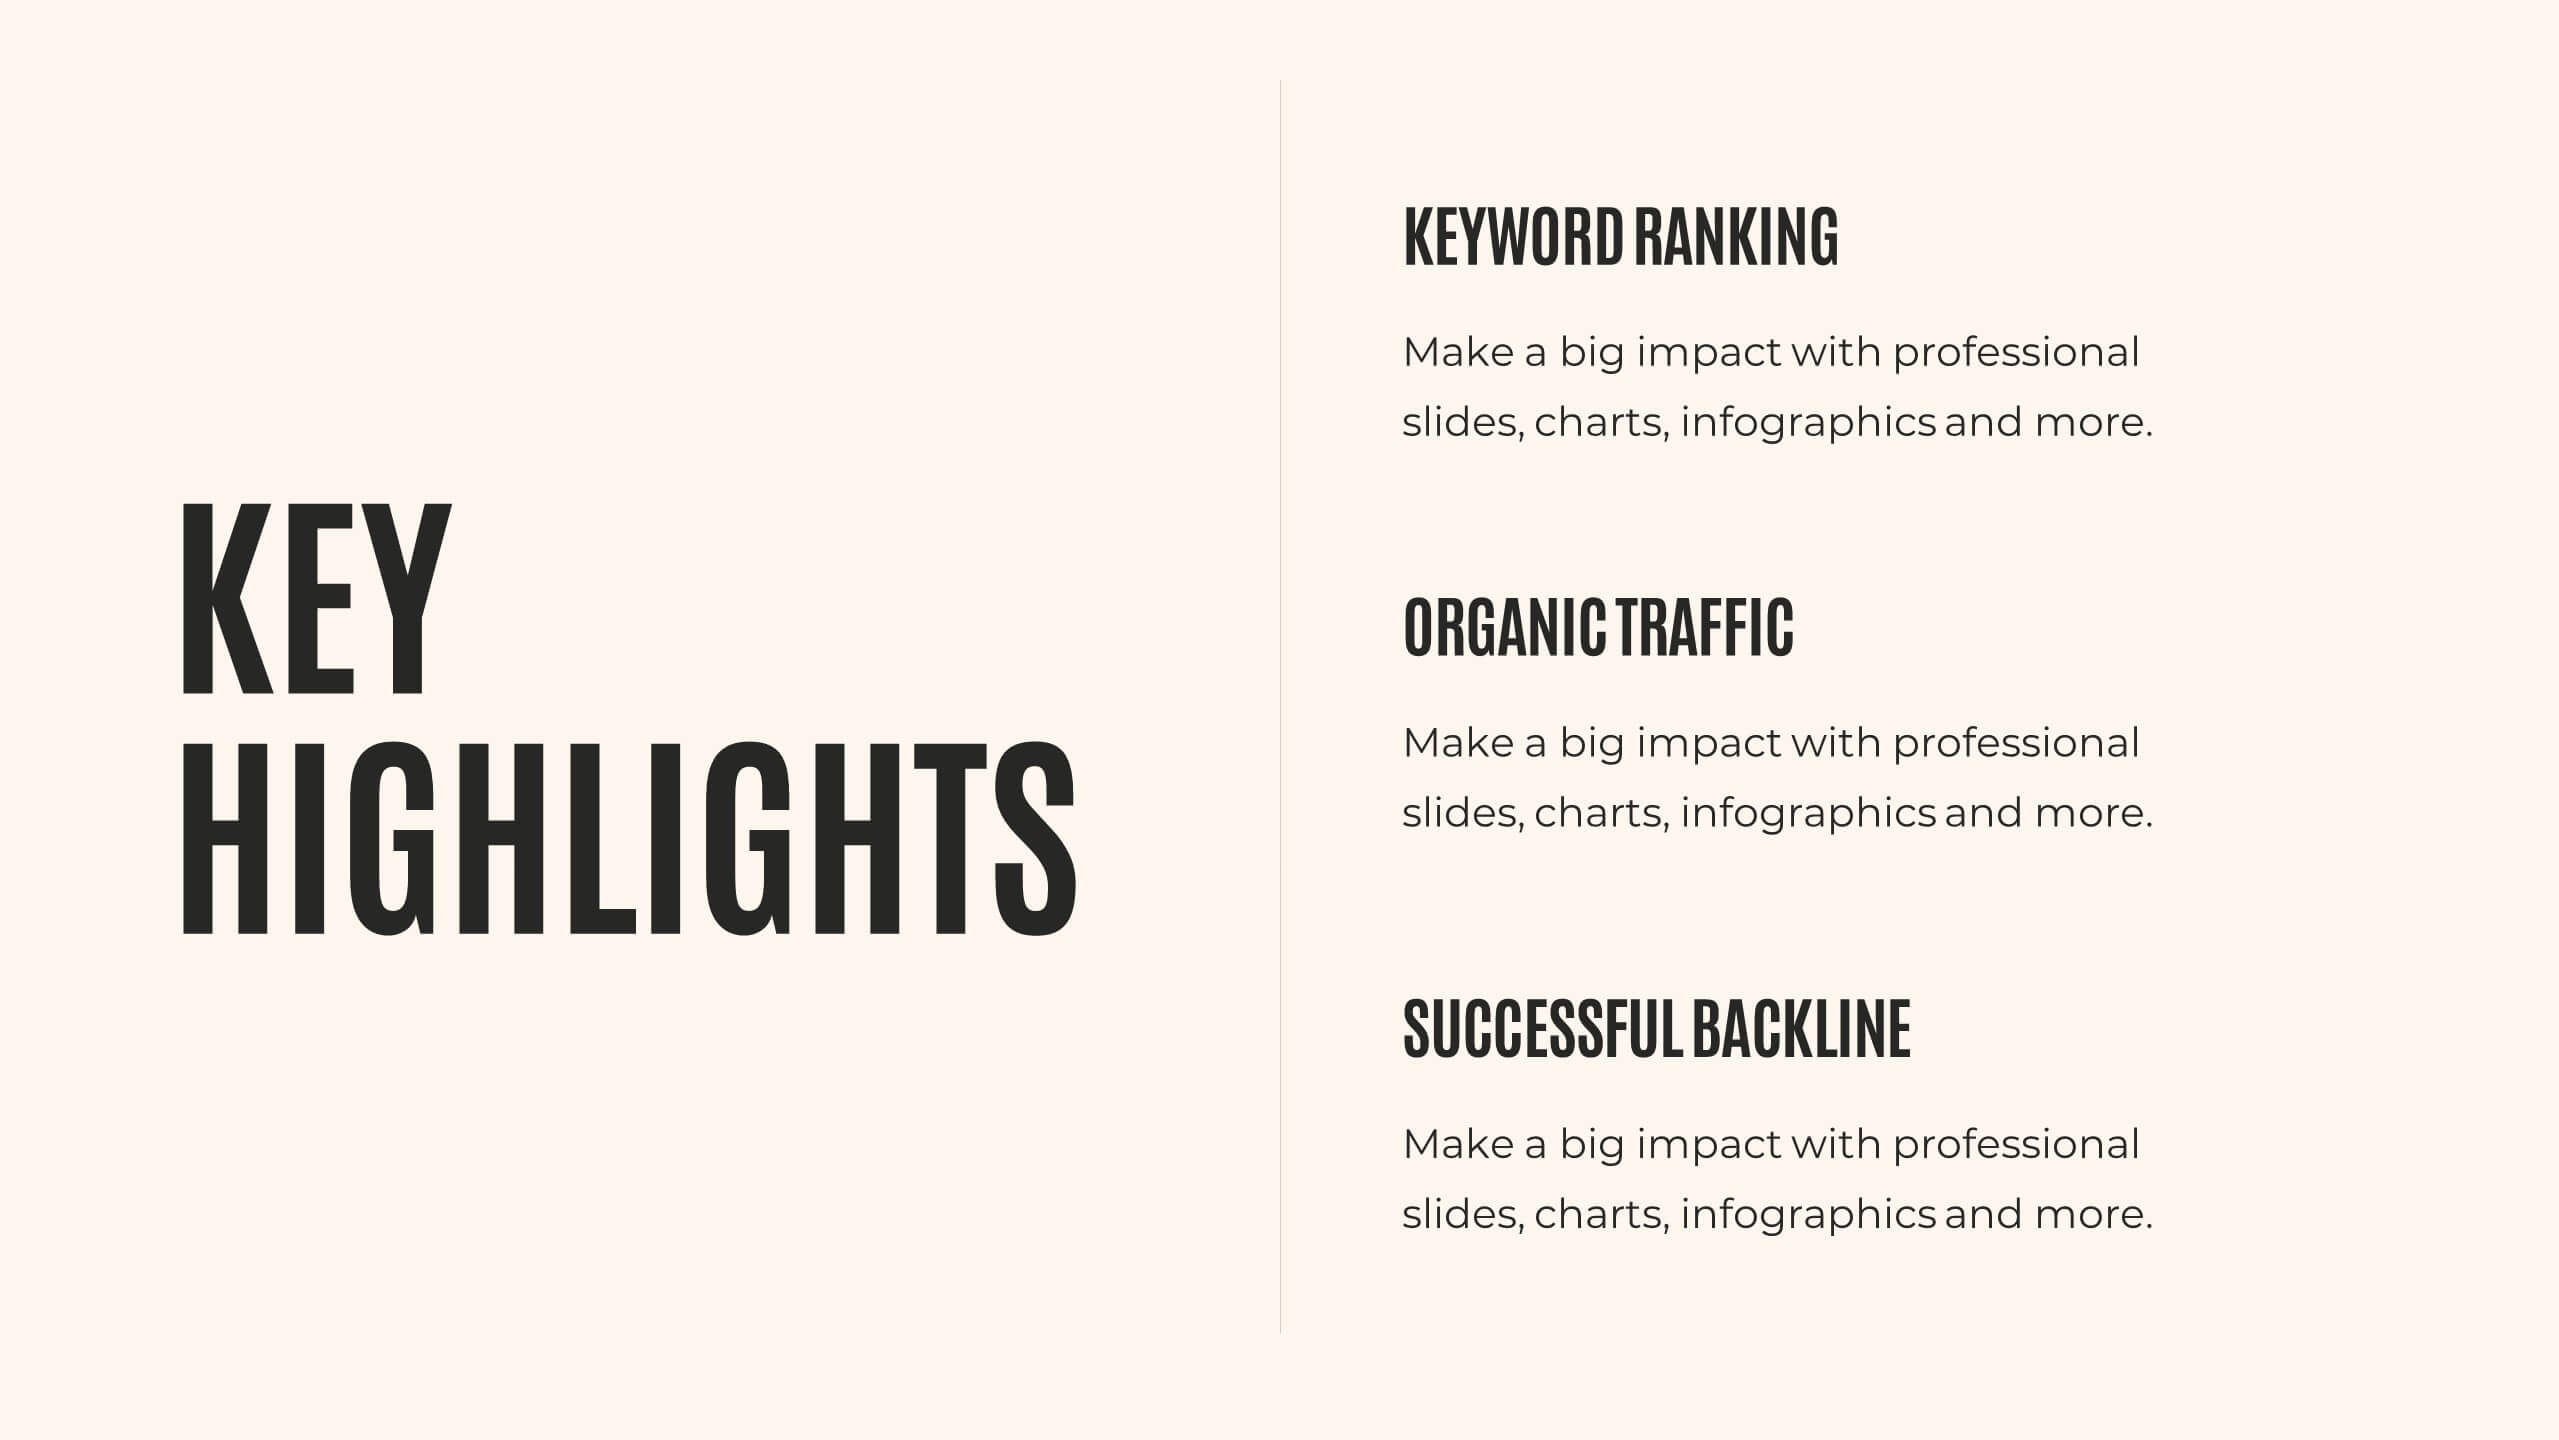
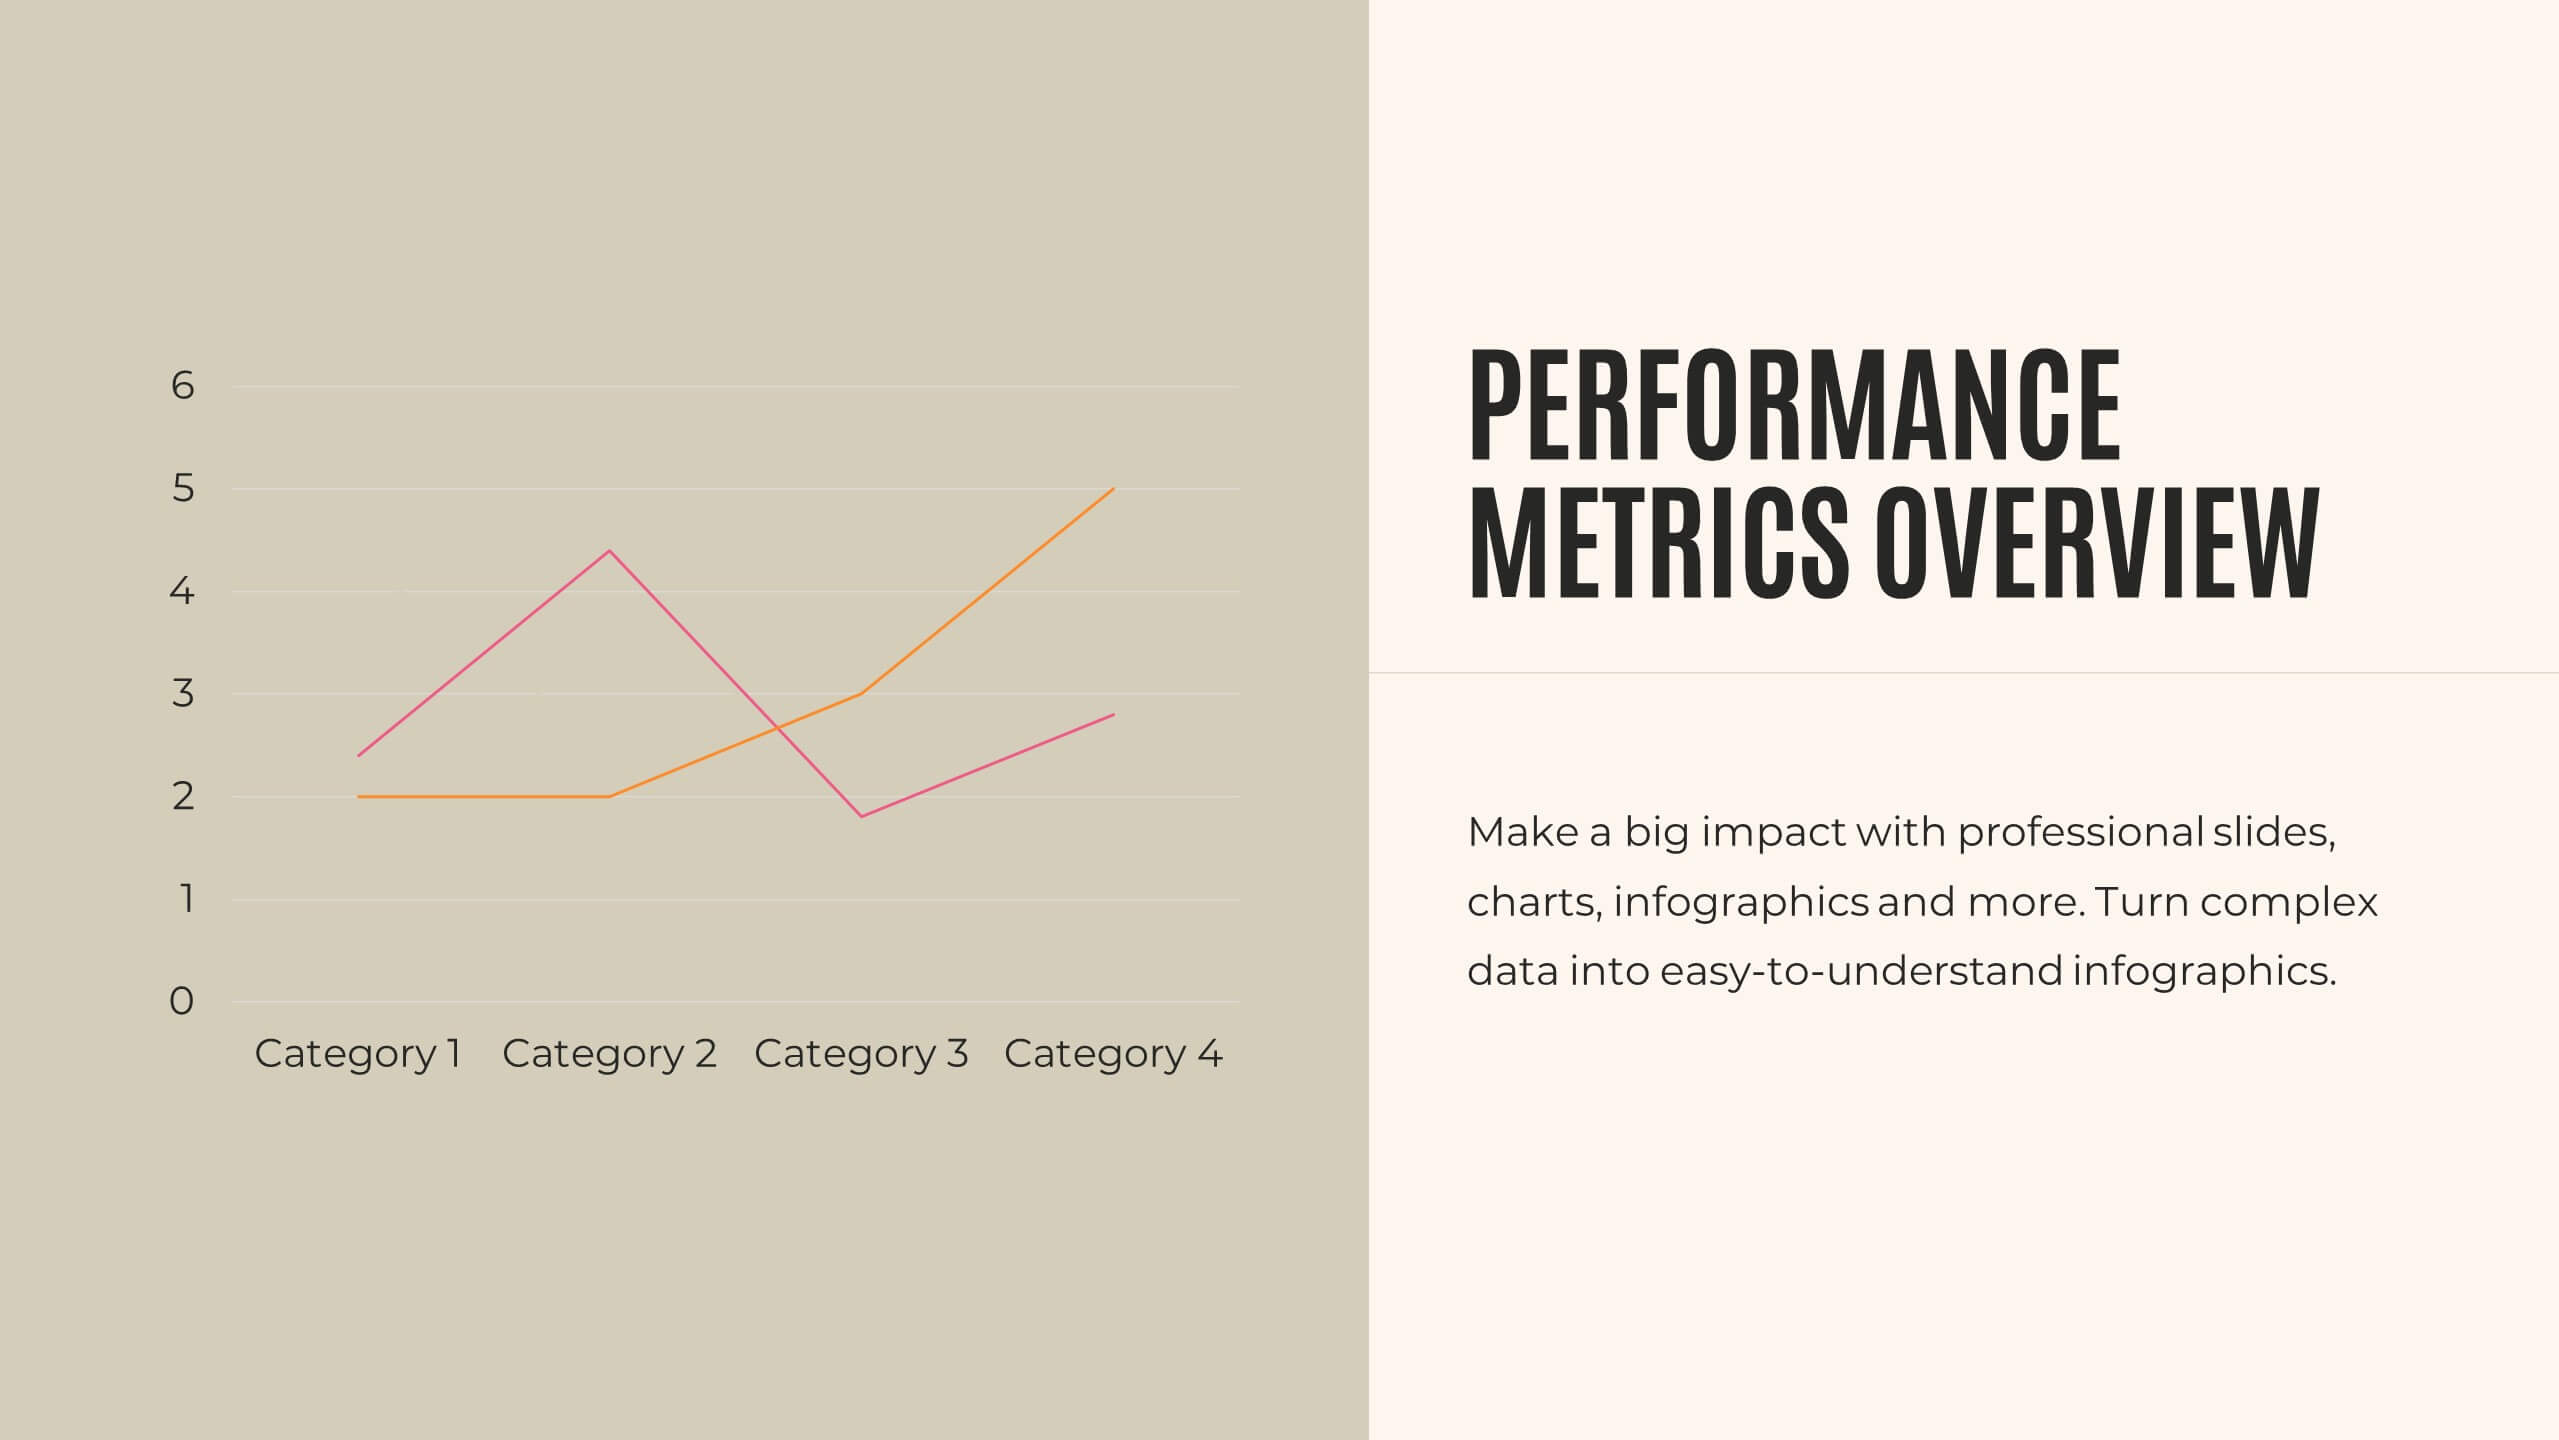
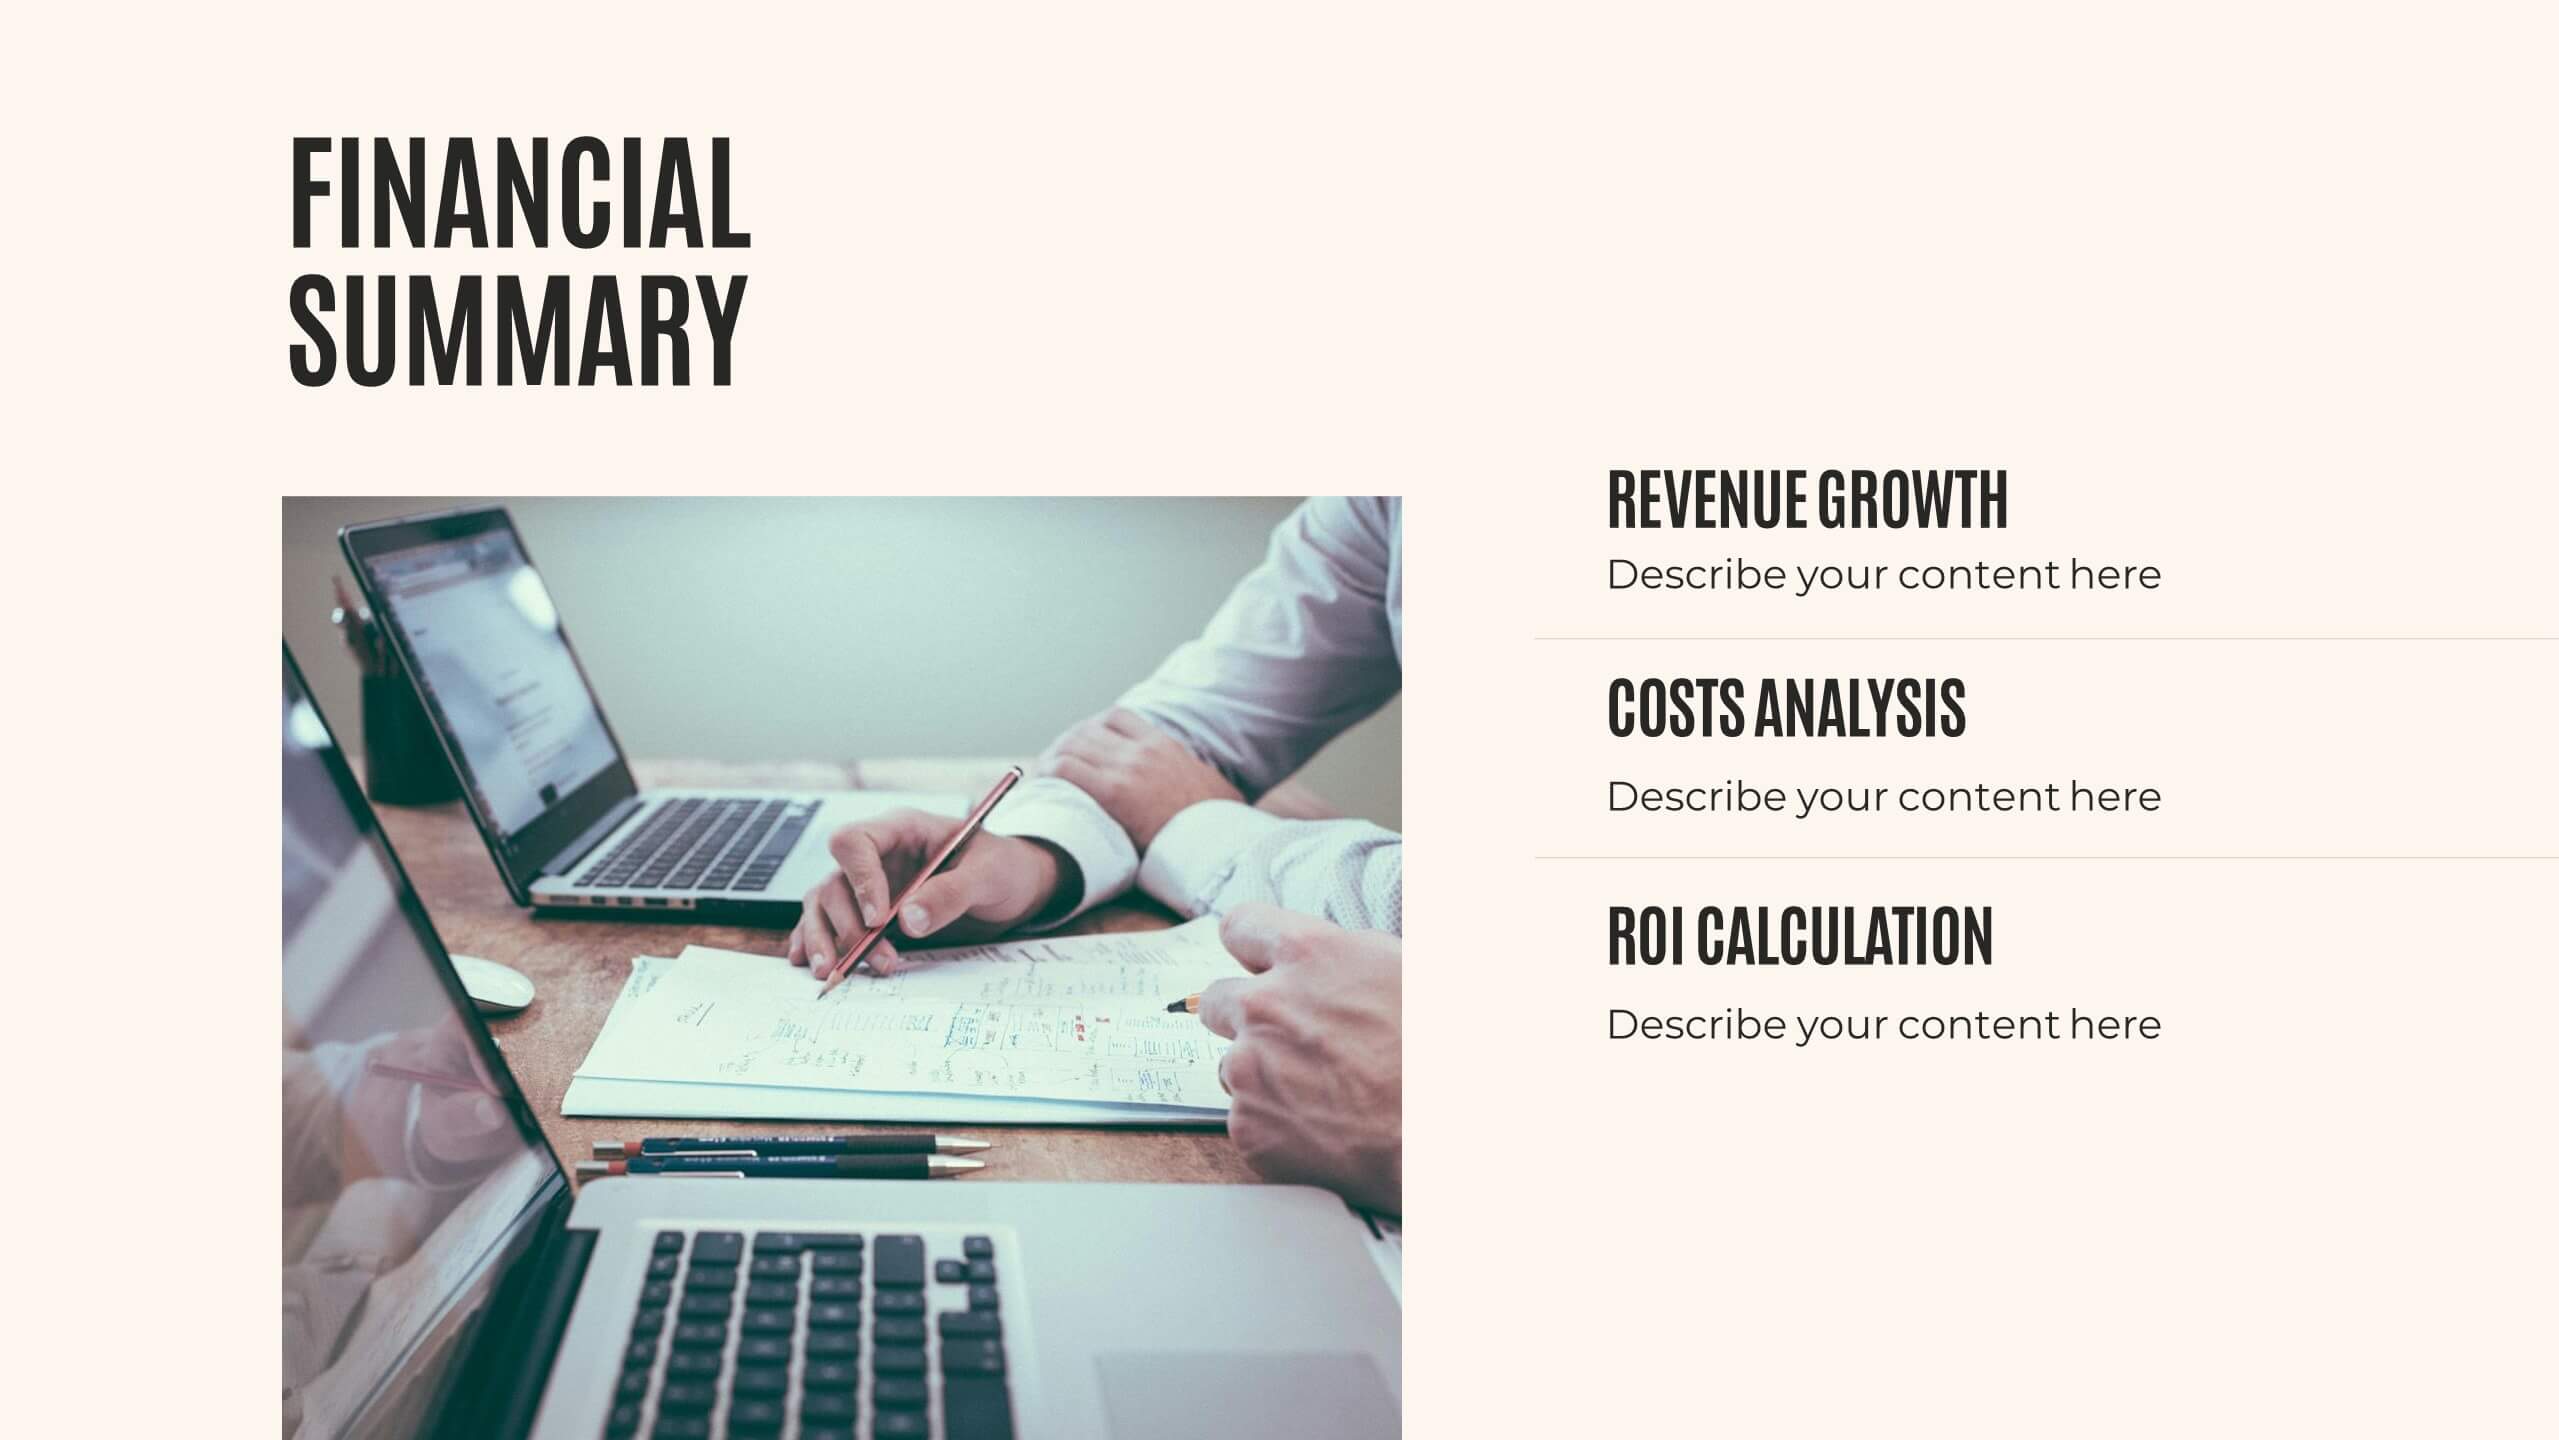
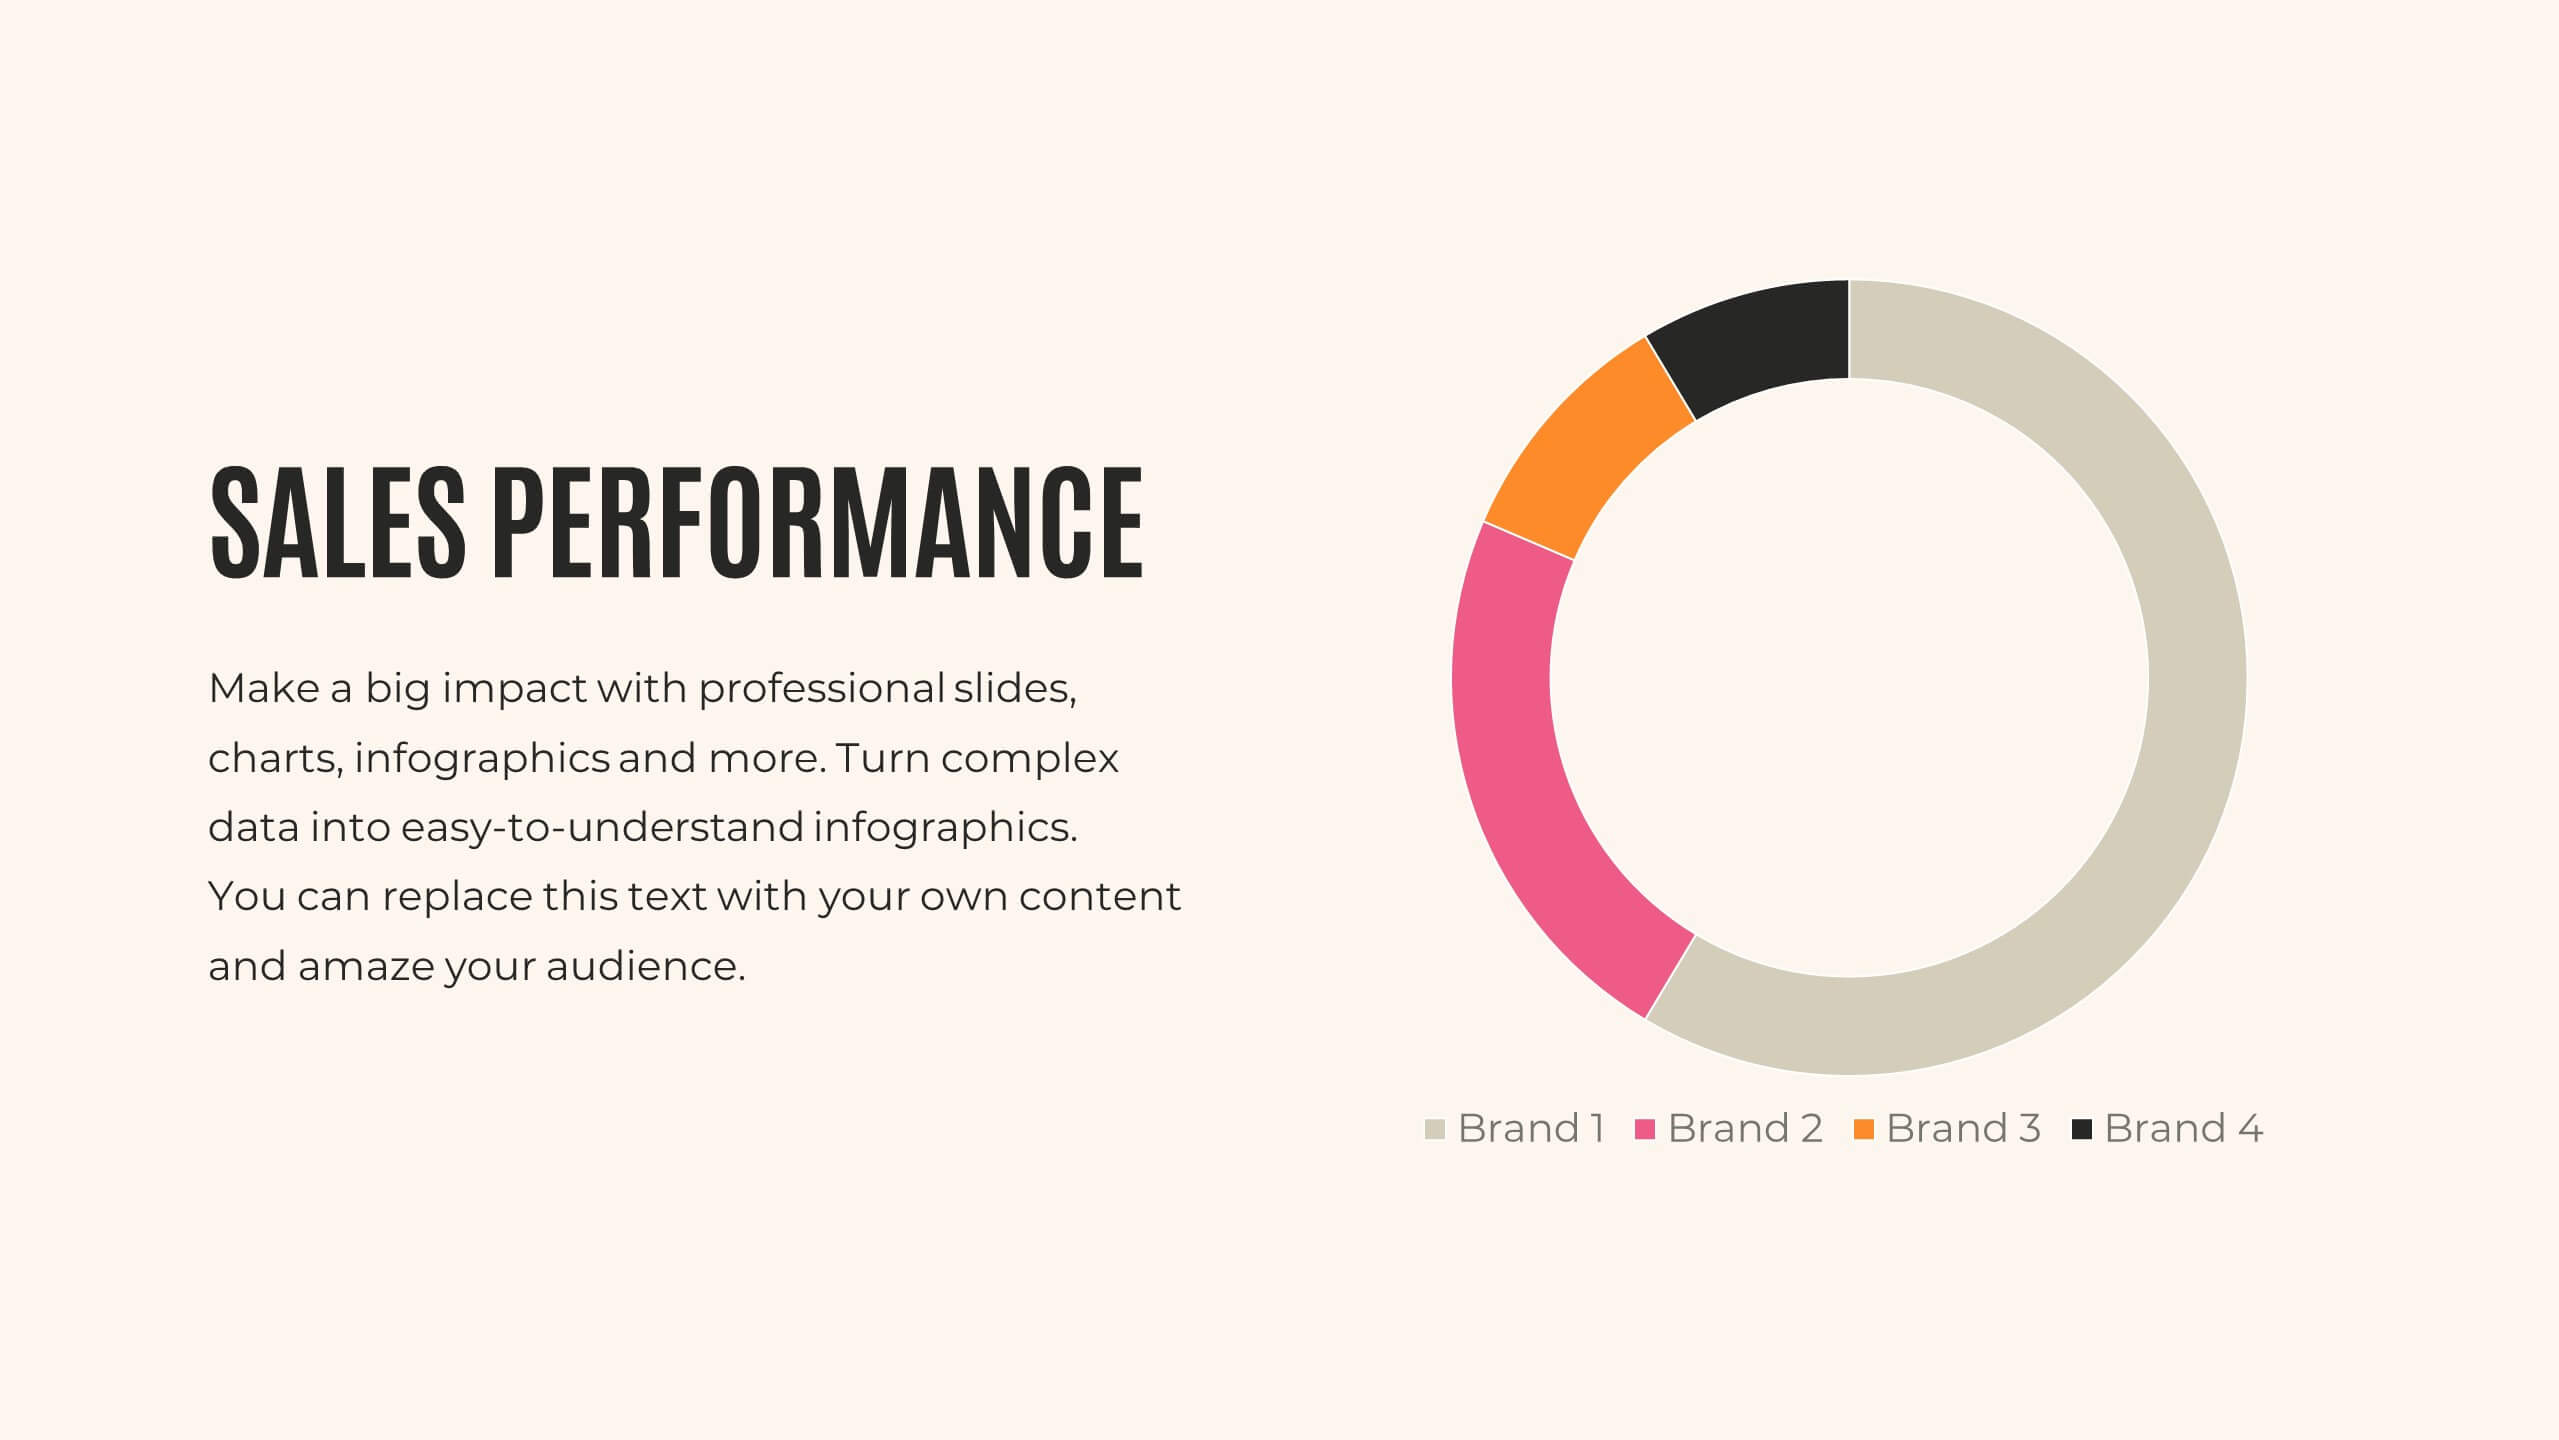
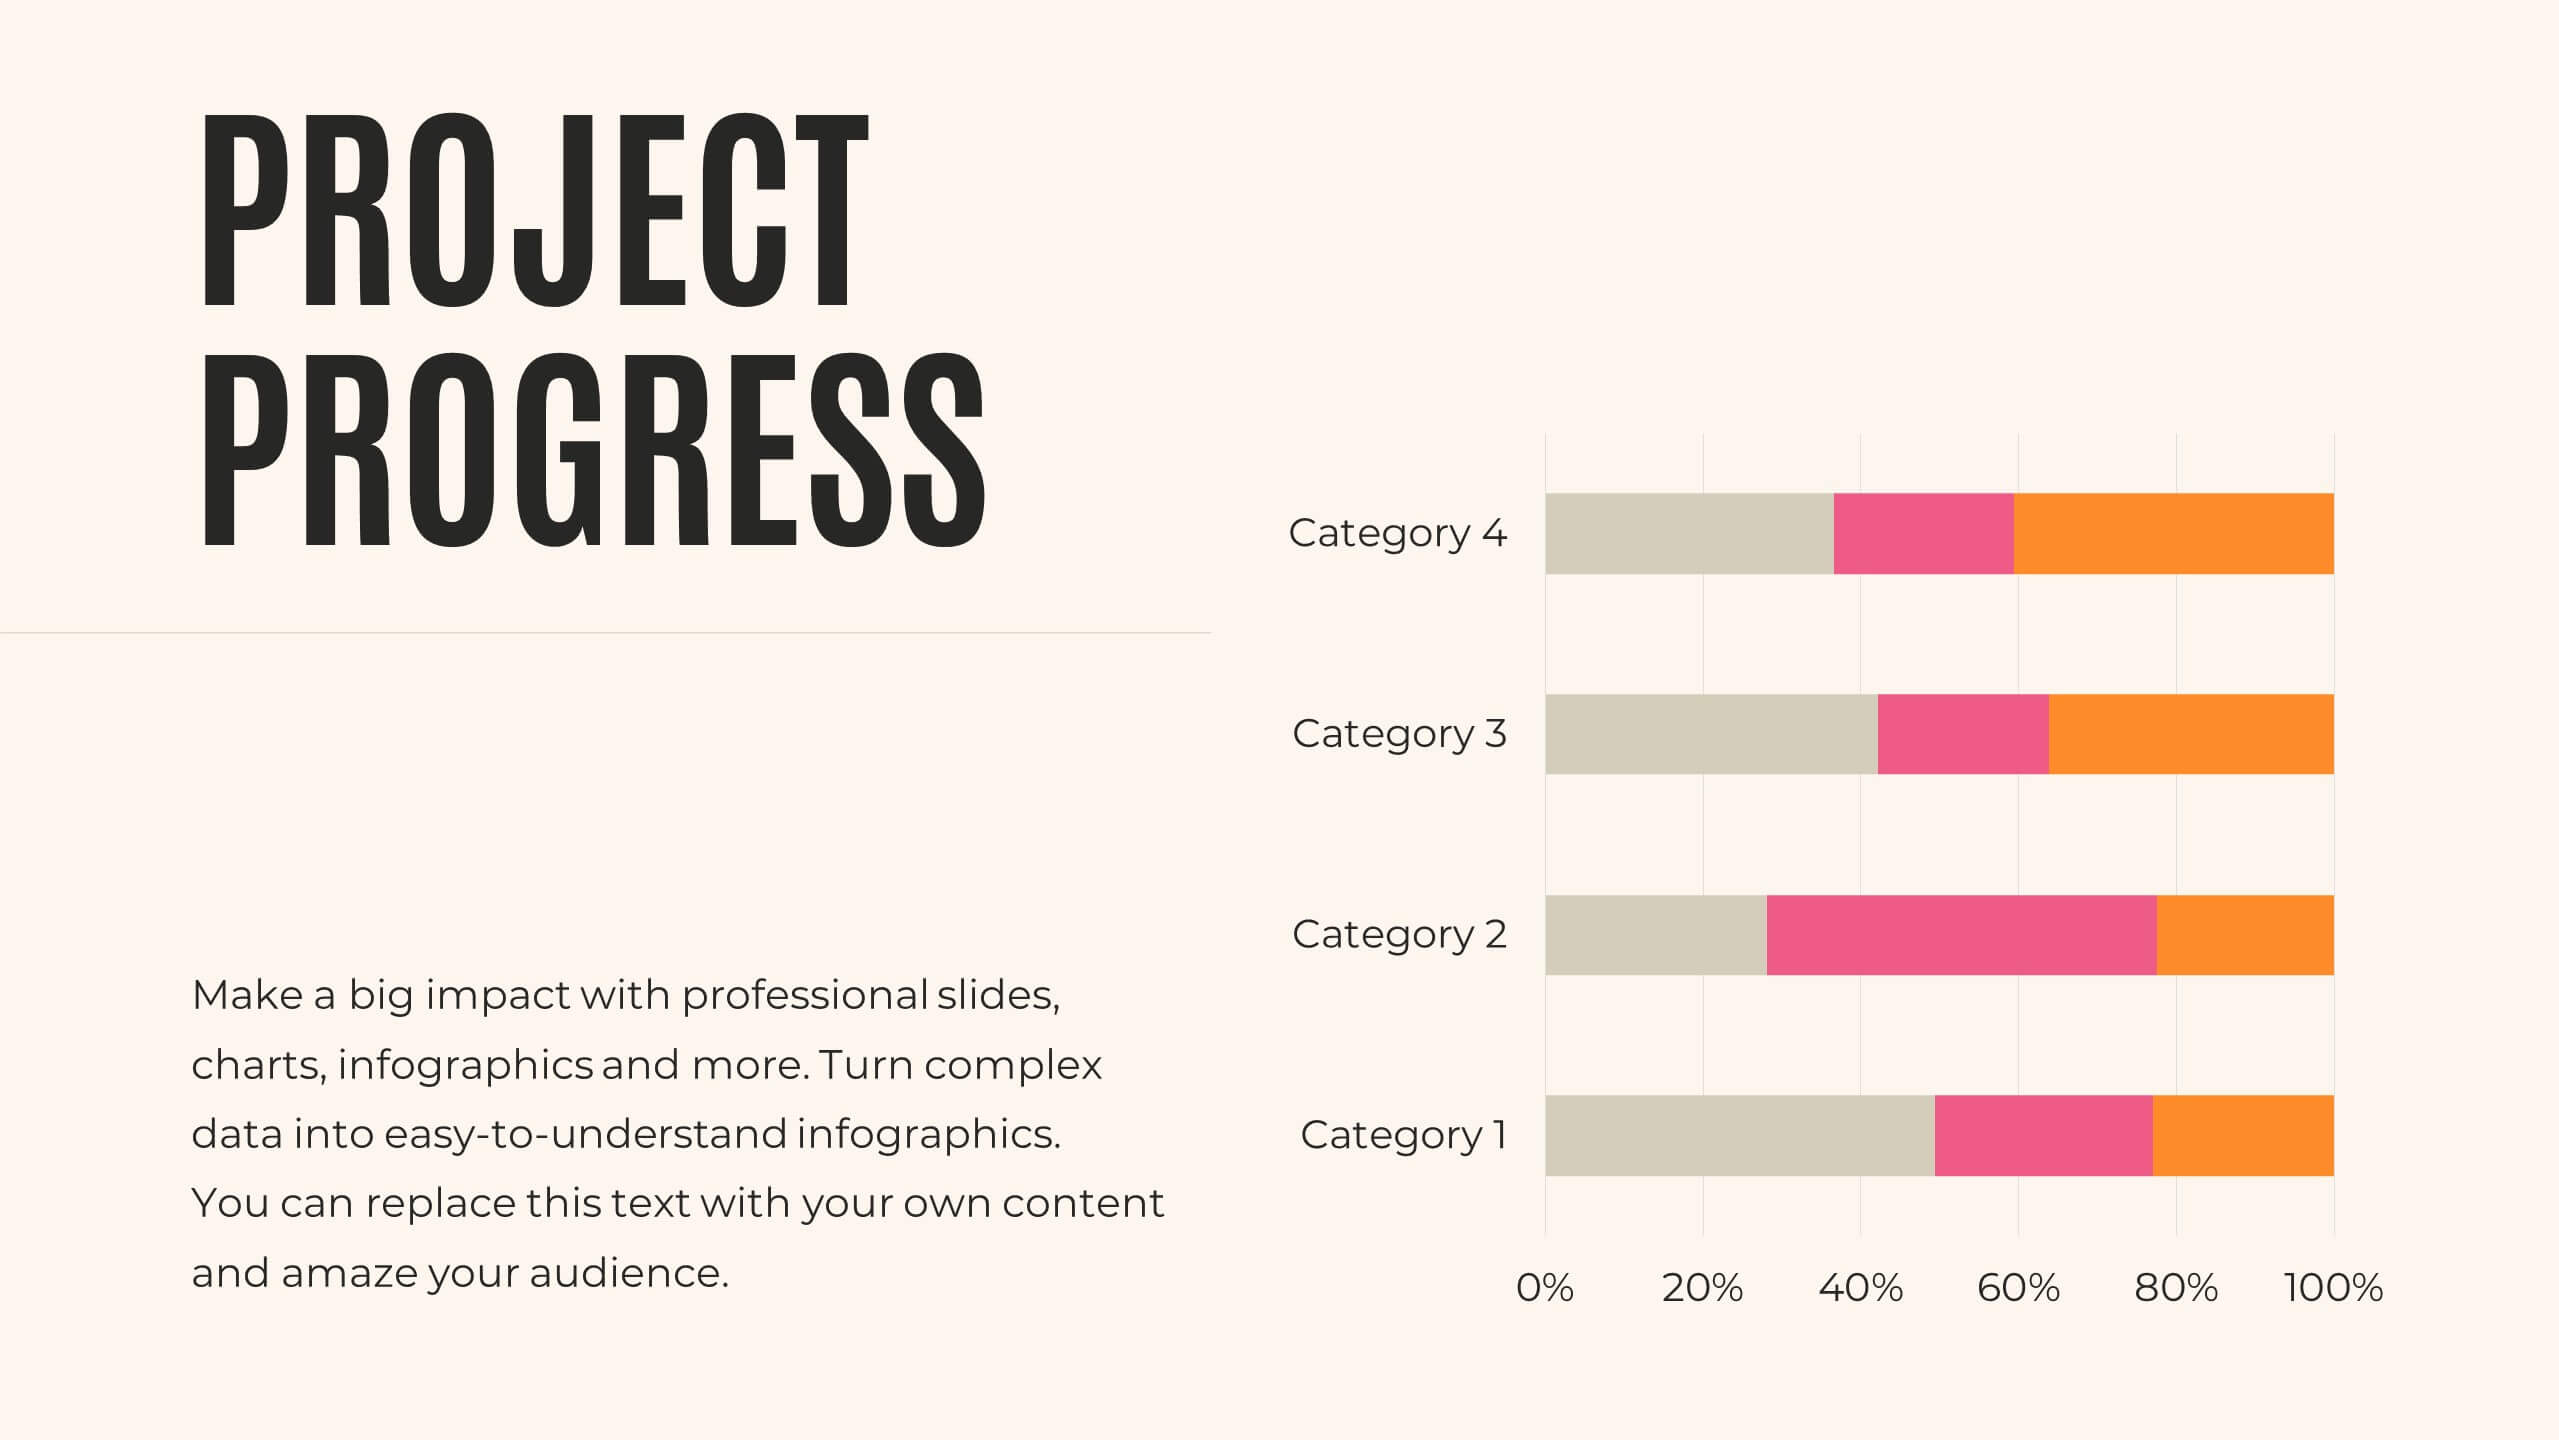
Journey Annual Report Presentation
Present your annual report with clarity and impact! This template covers agenda, key highlights, financial summary, sales performance, and project progress. Ideal for detailing achievements, insights, and future priorities. Compatible with PowerPoint, Keynote, and Google Slides, it ensures your data is visually compelling and easy to understand. Showcase your success effortlessly!


23 diapositivas
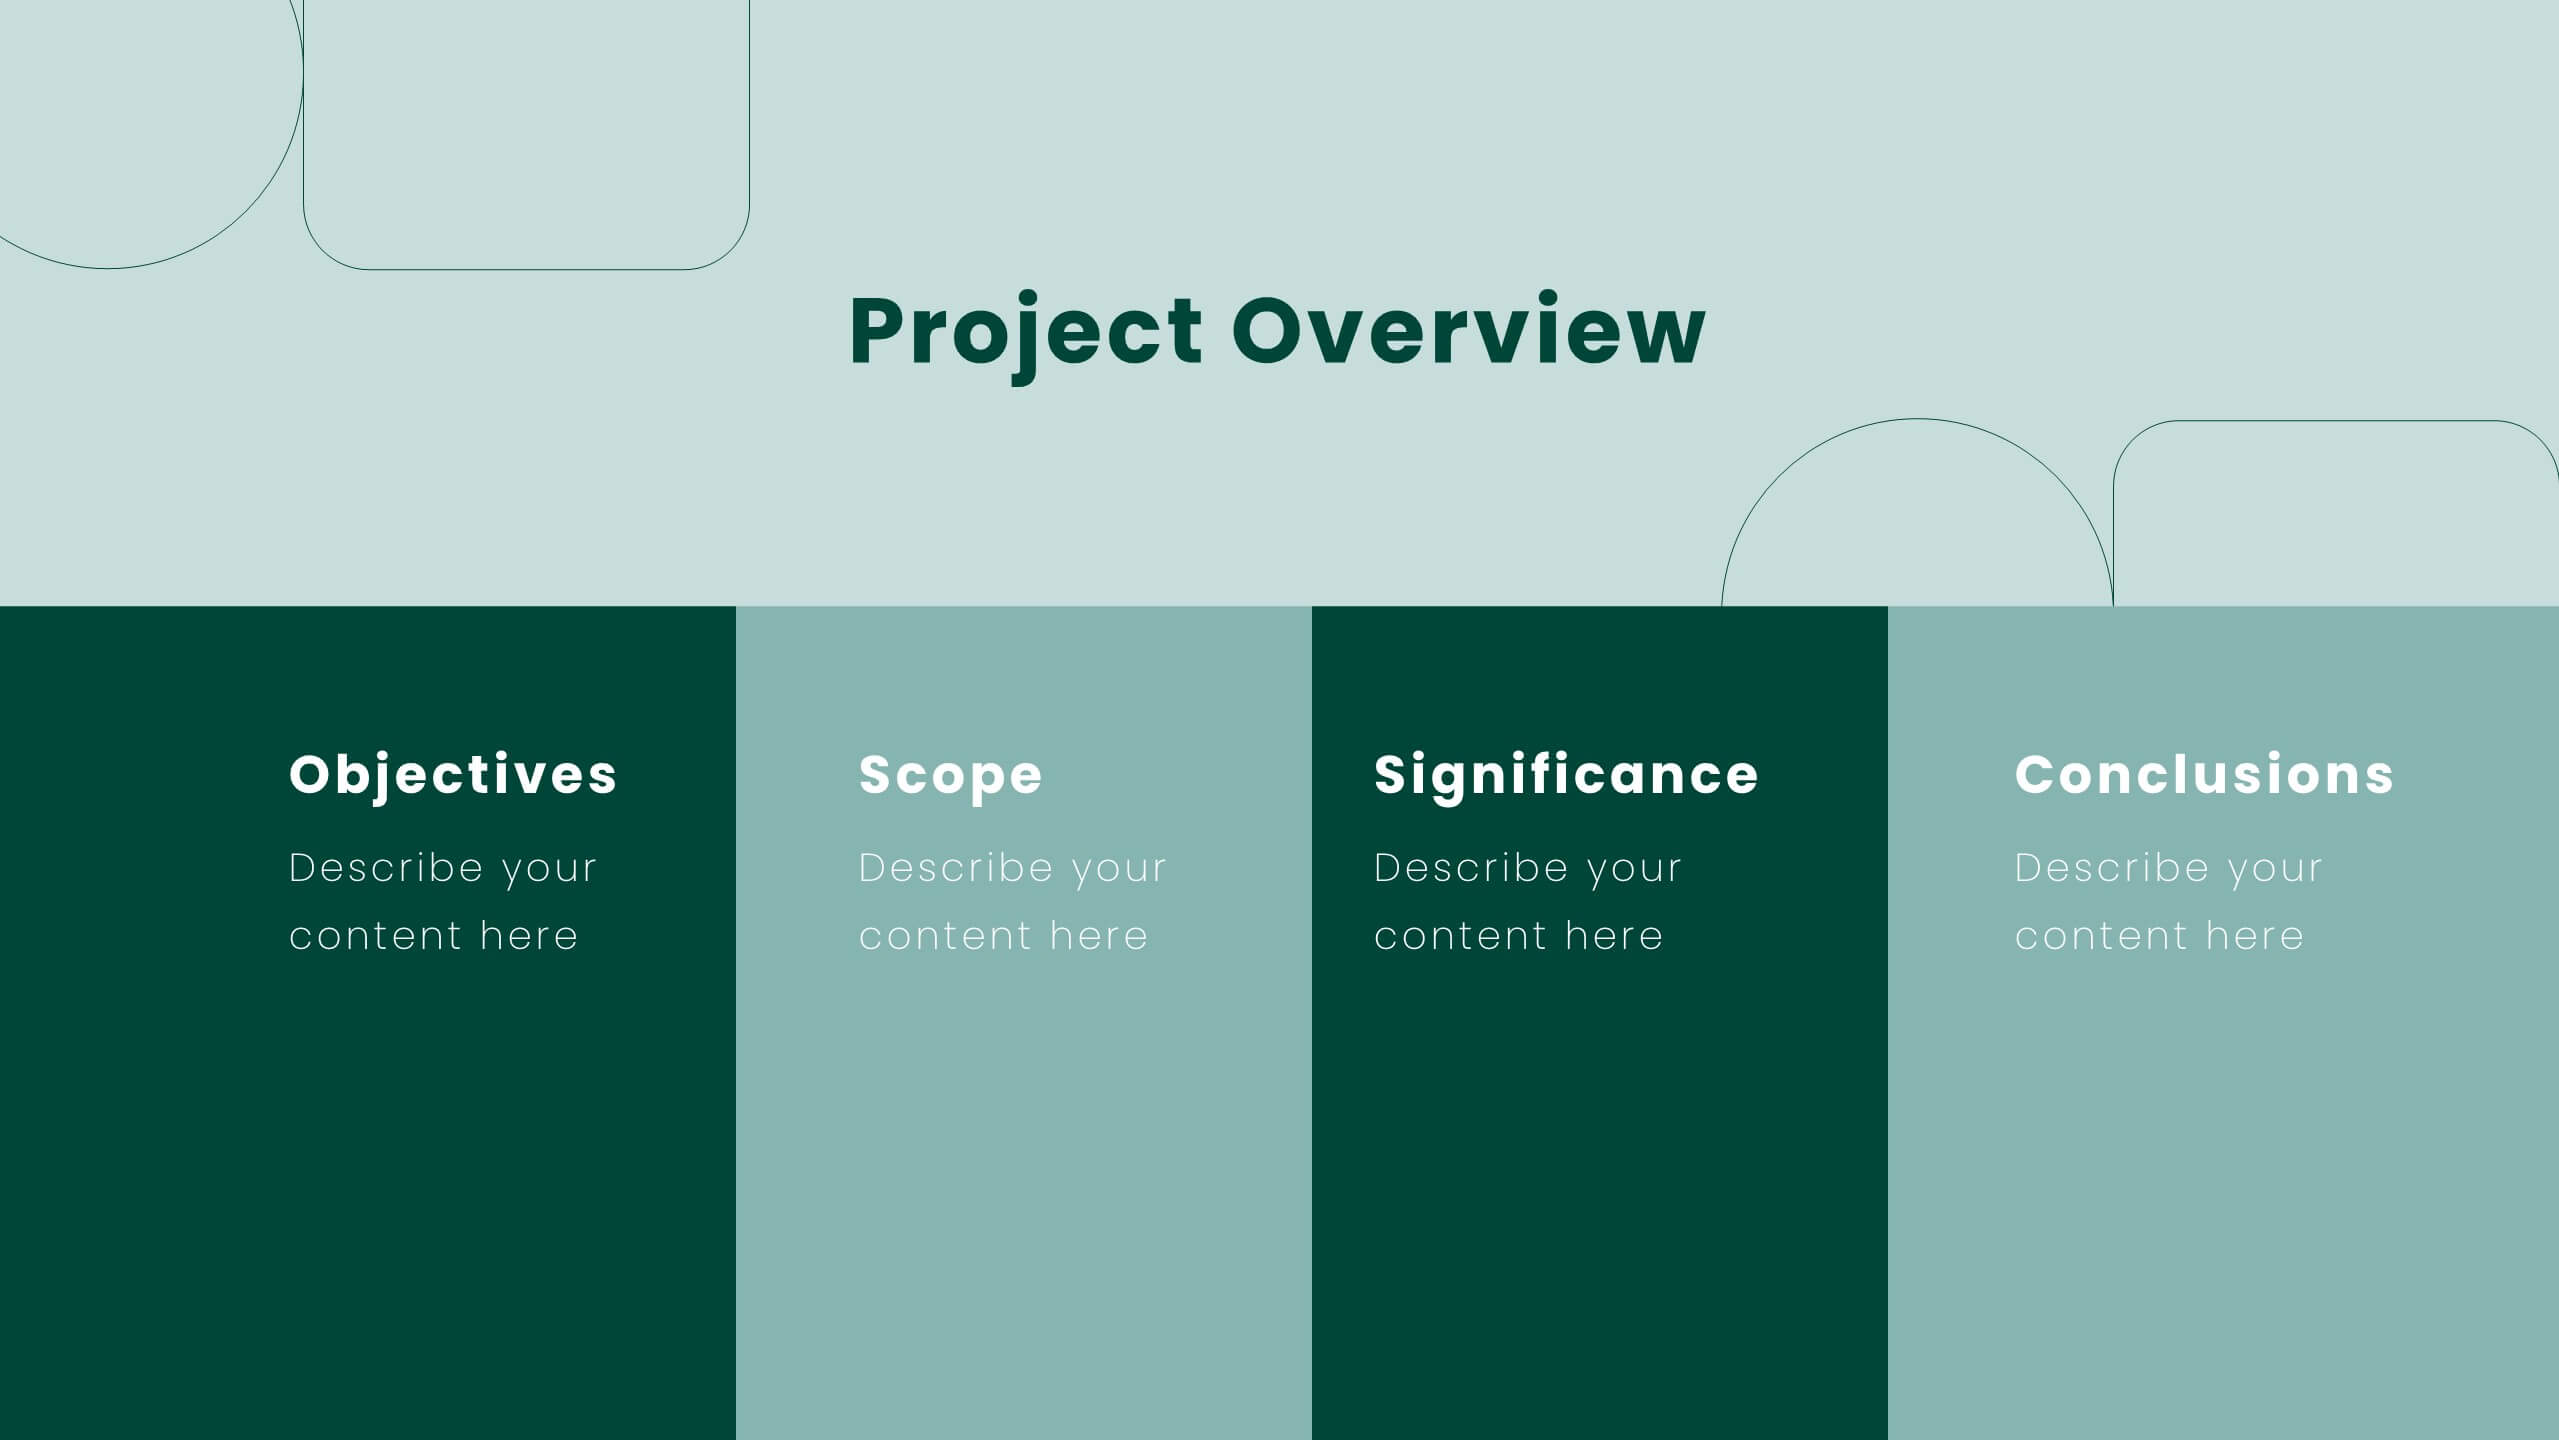
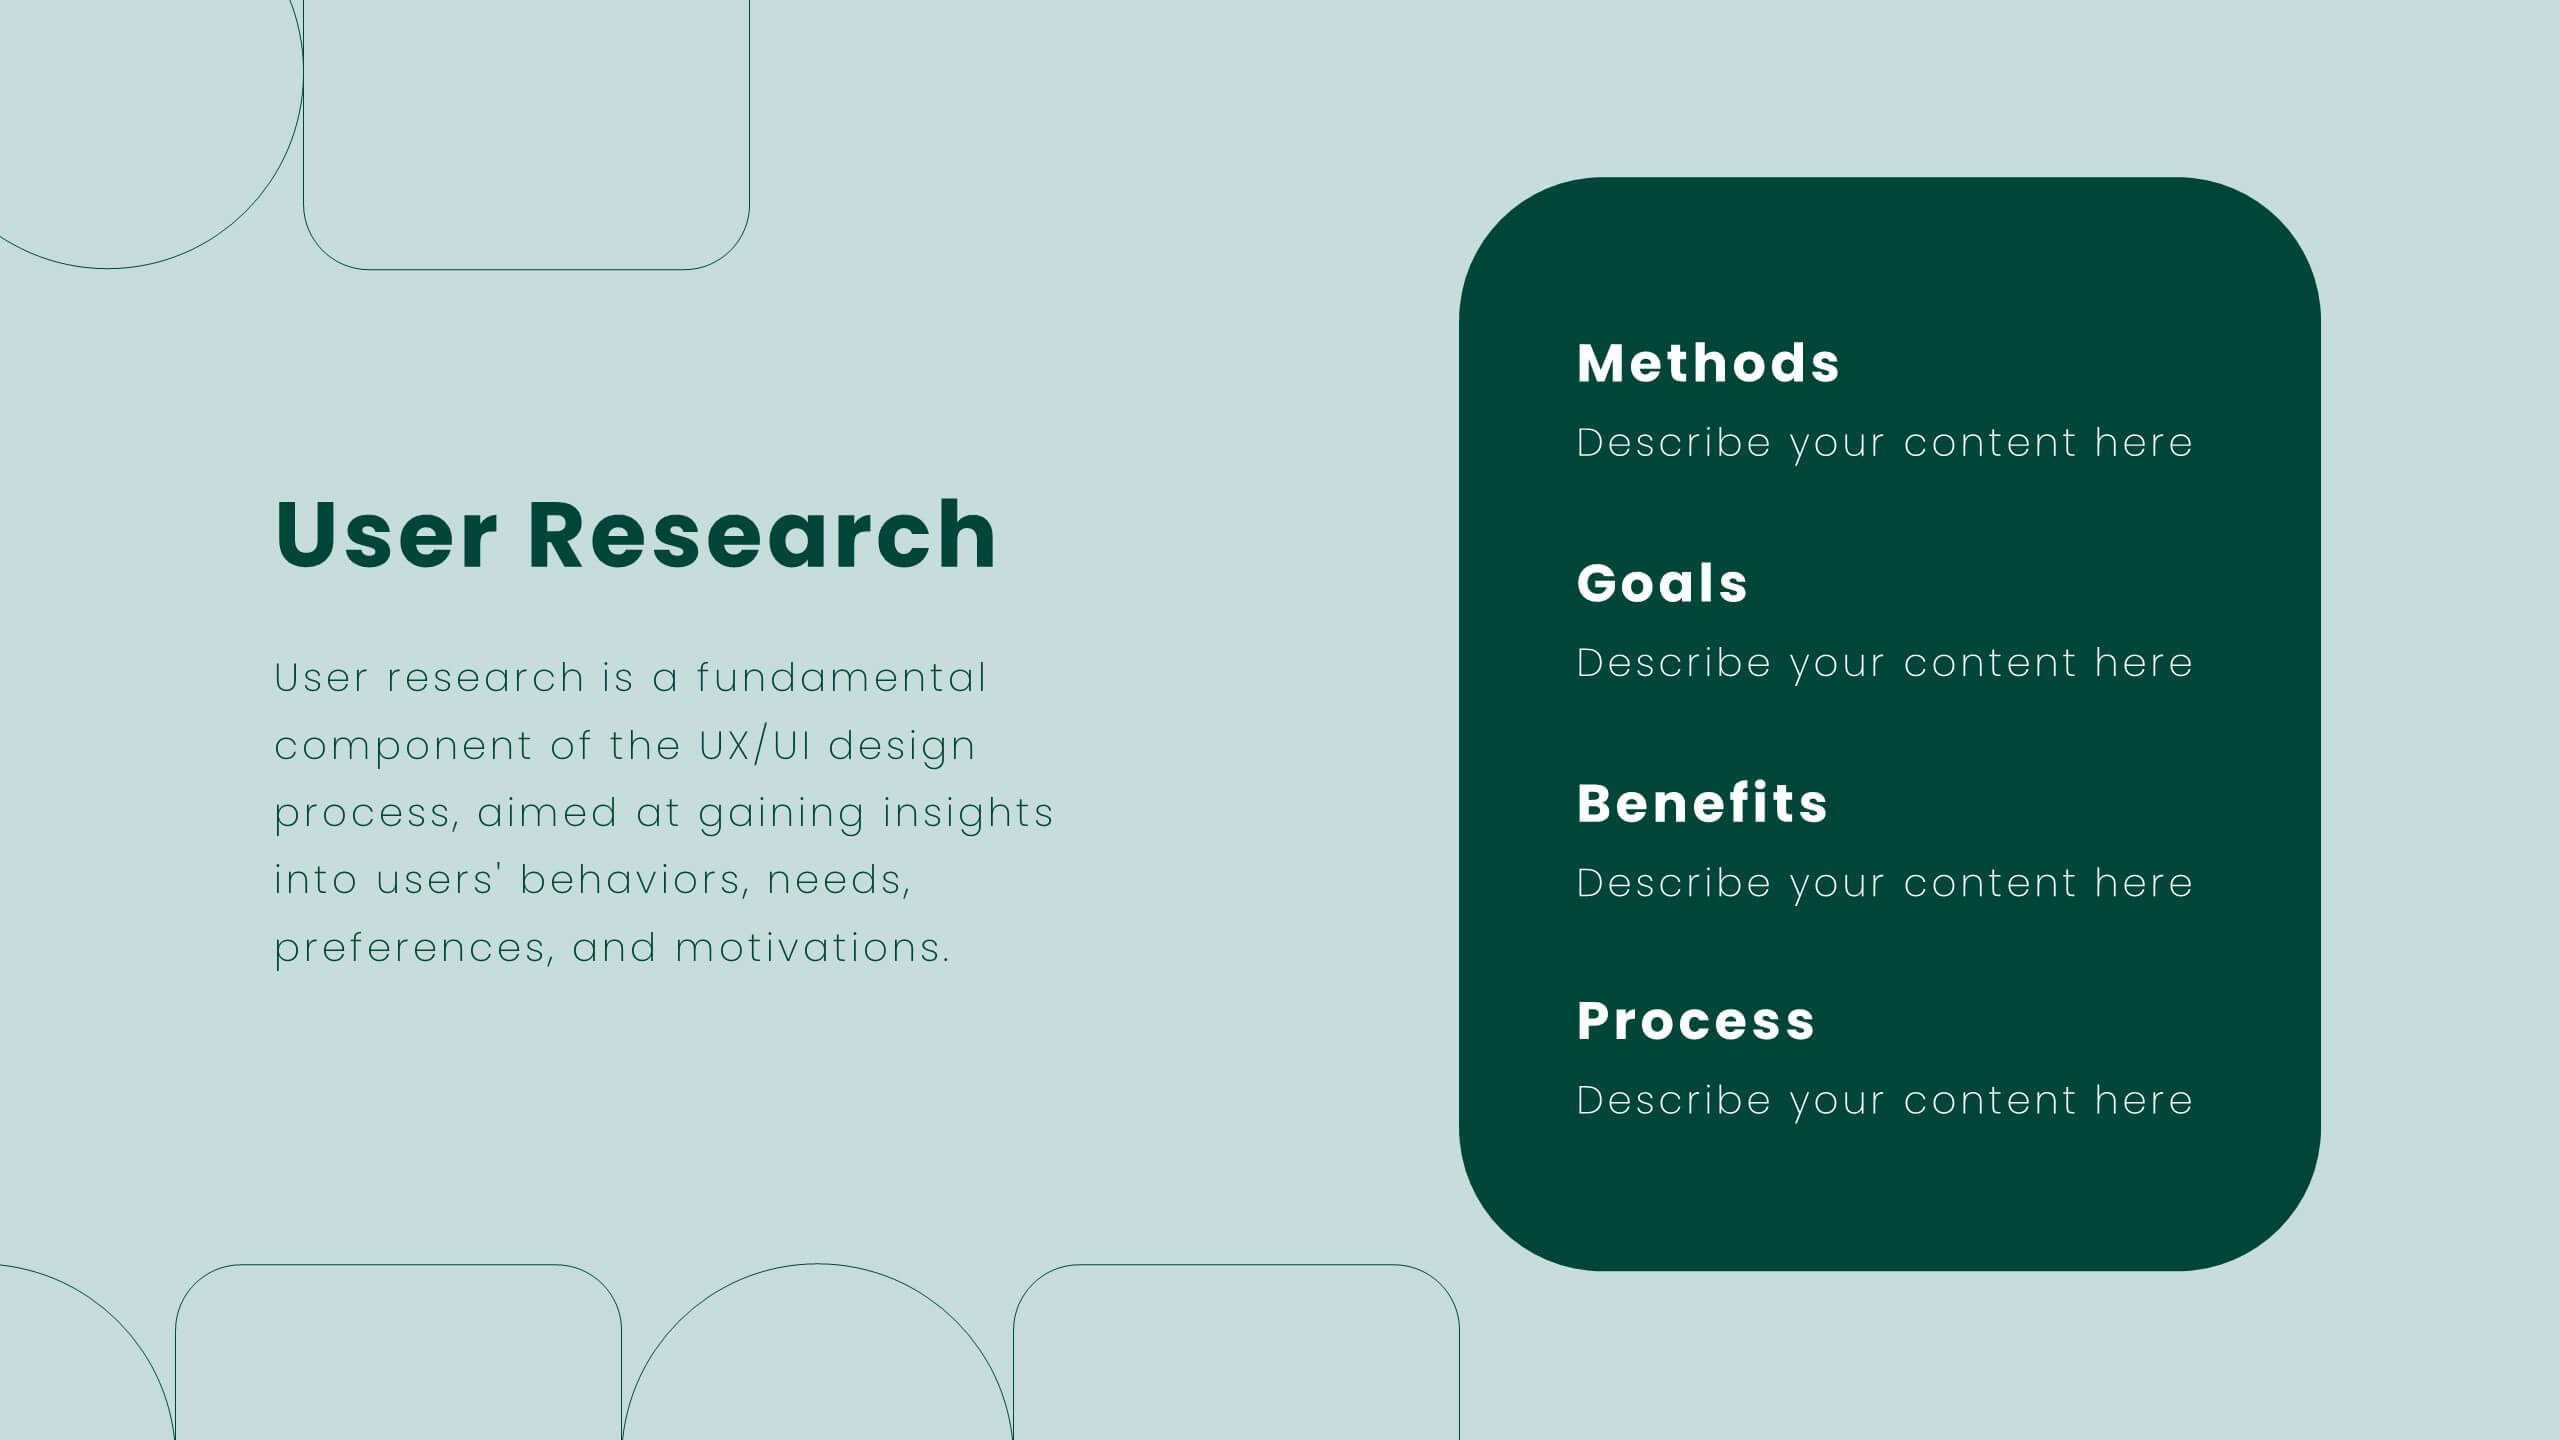
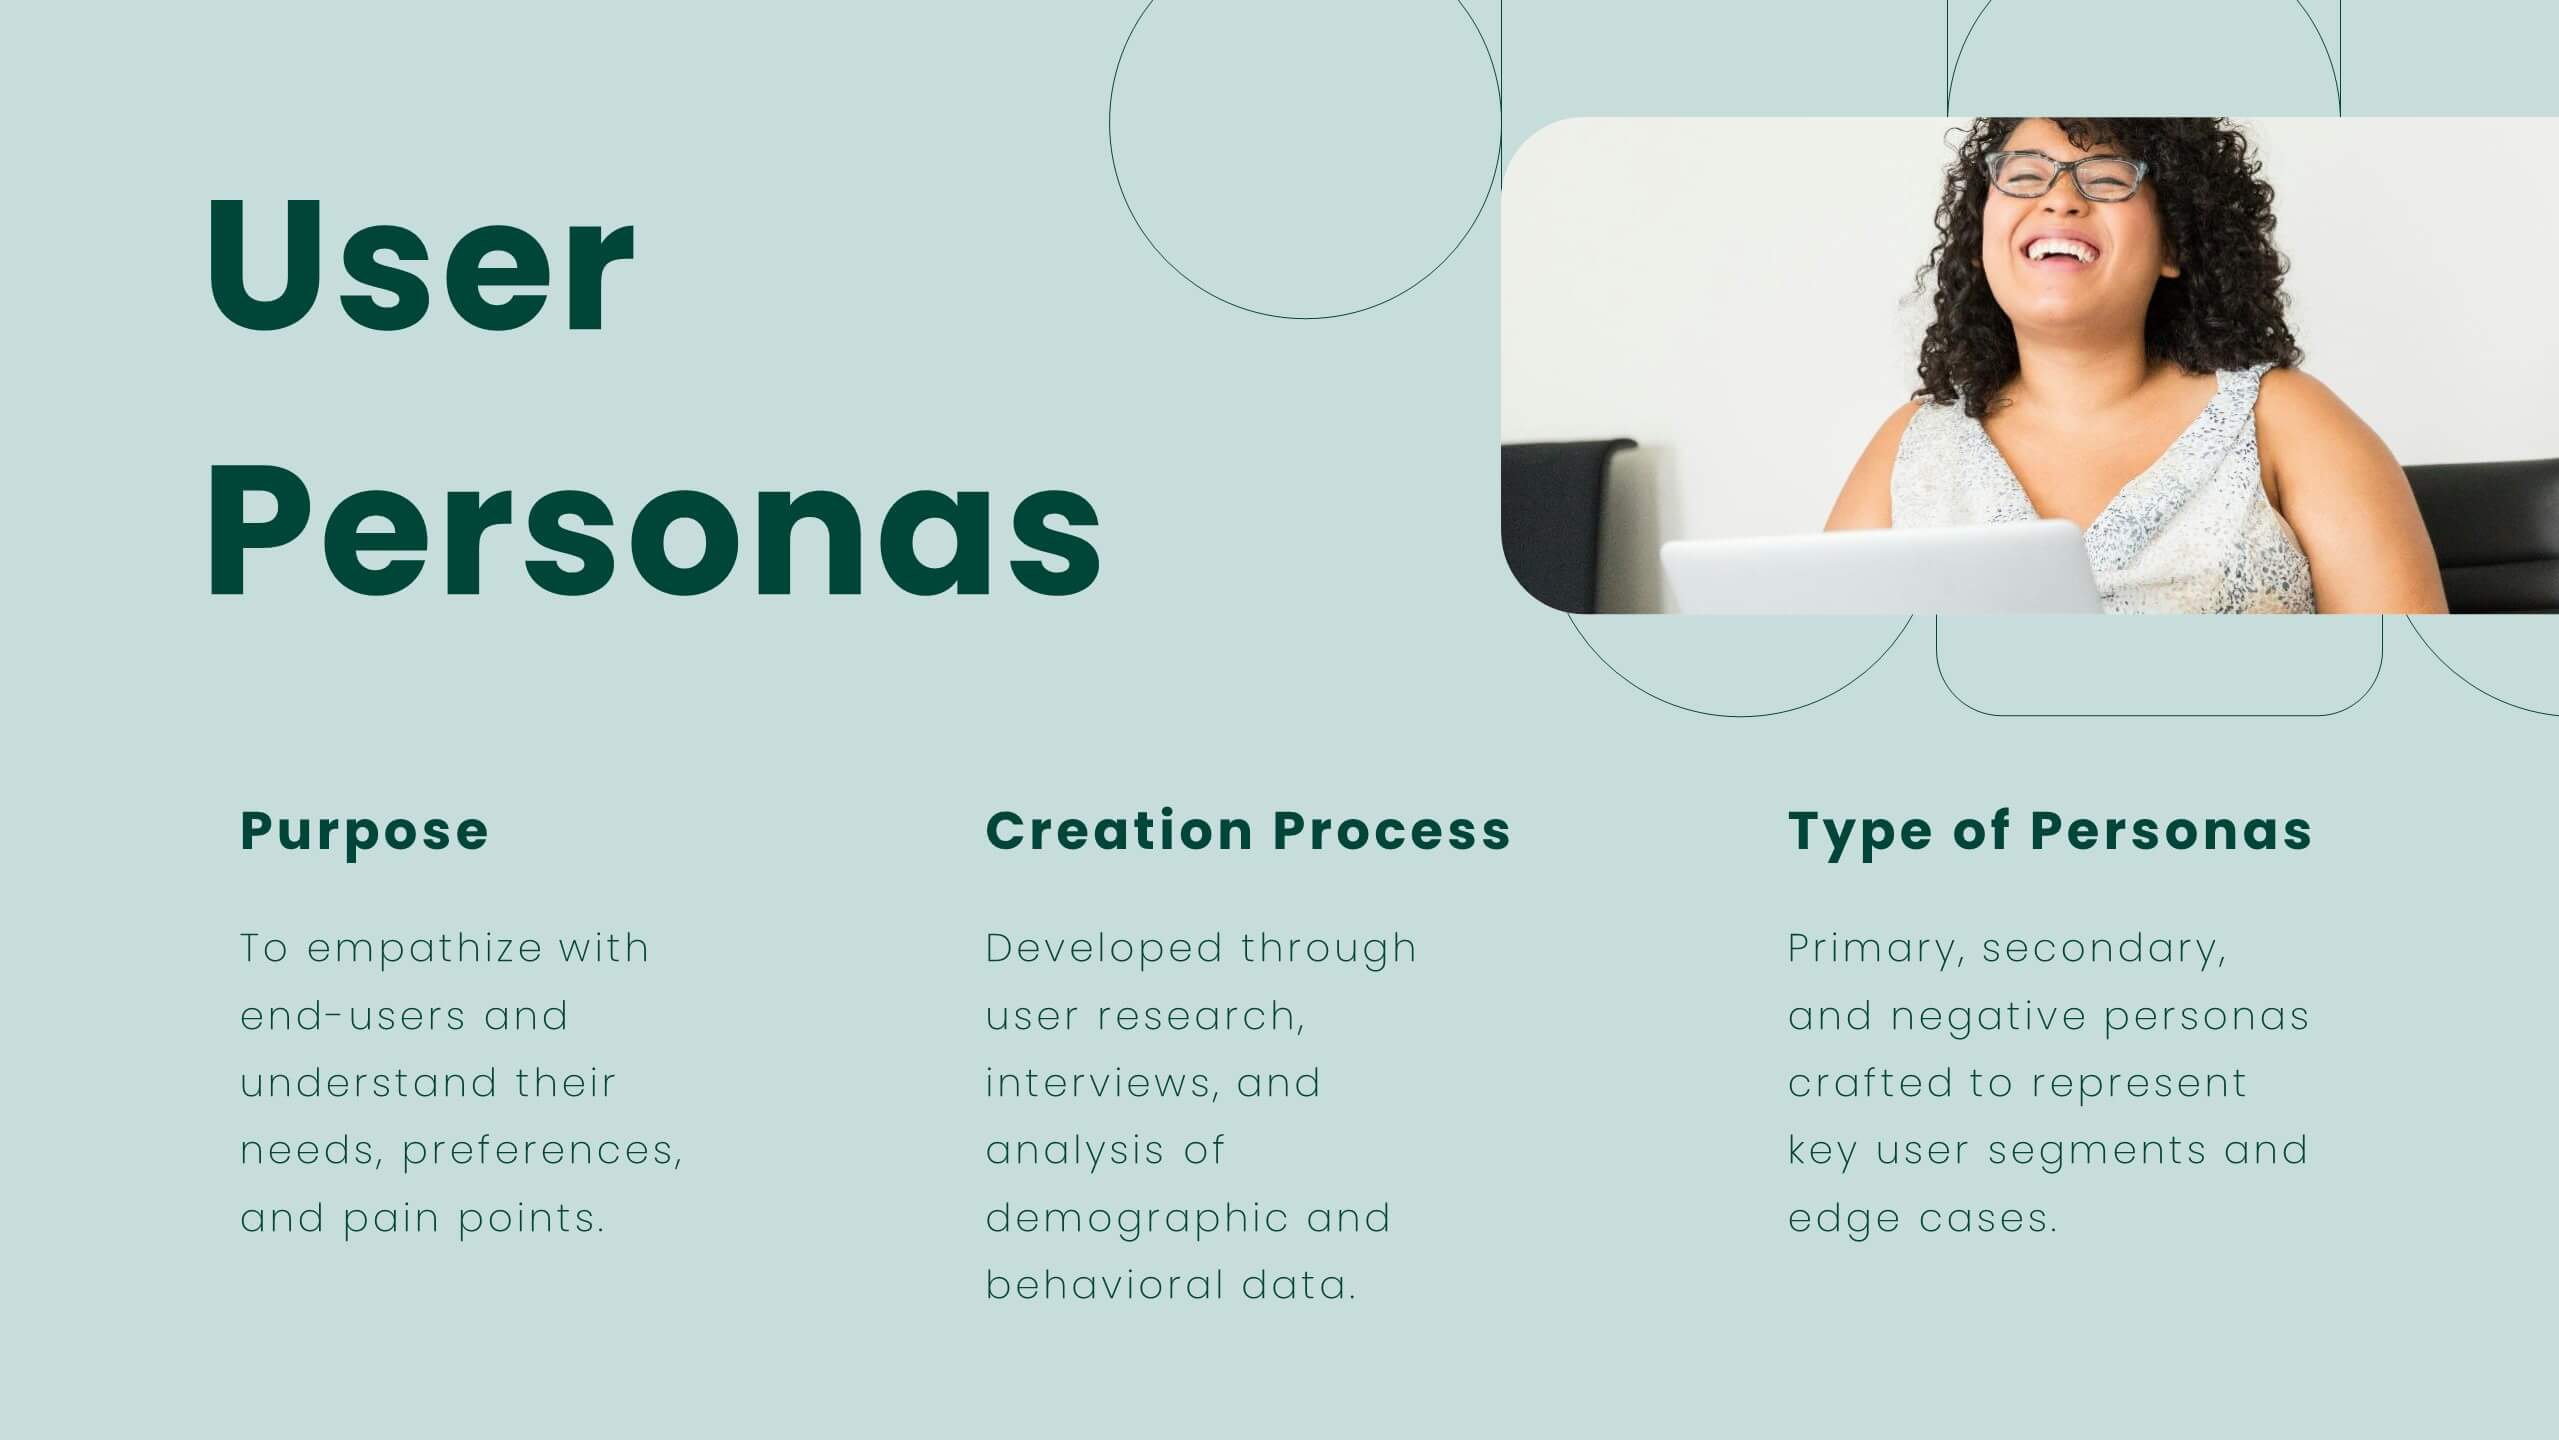
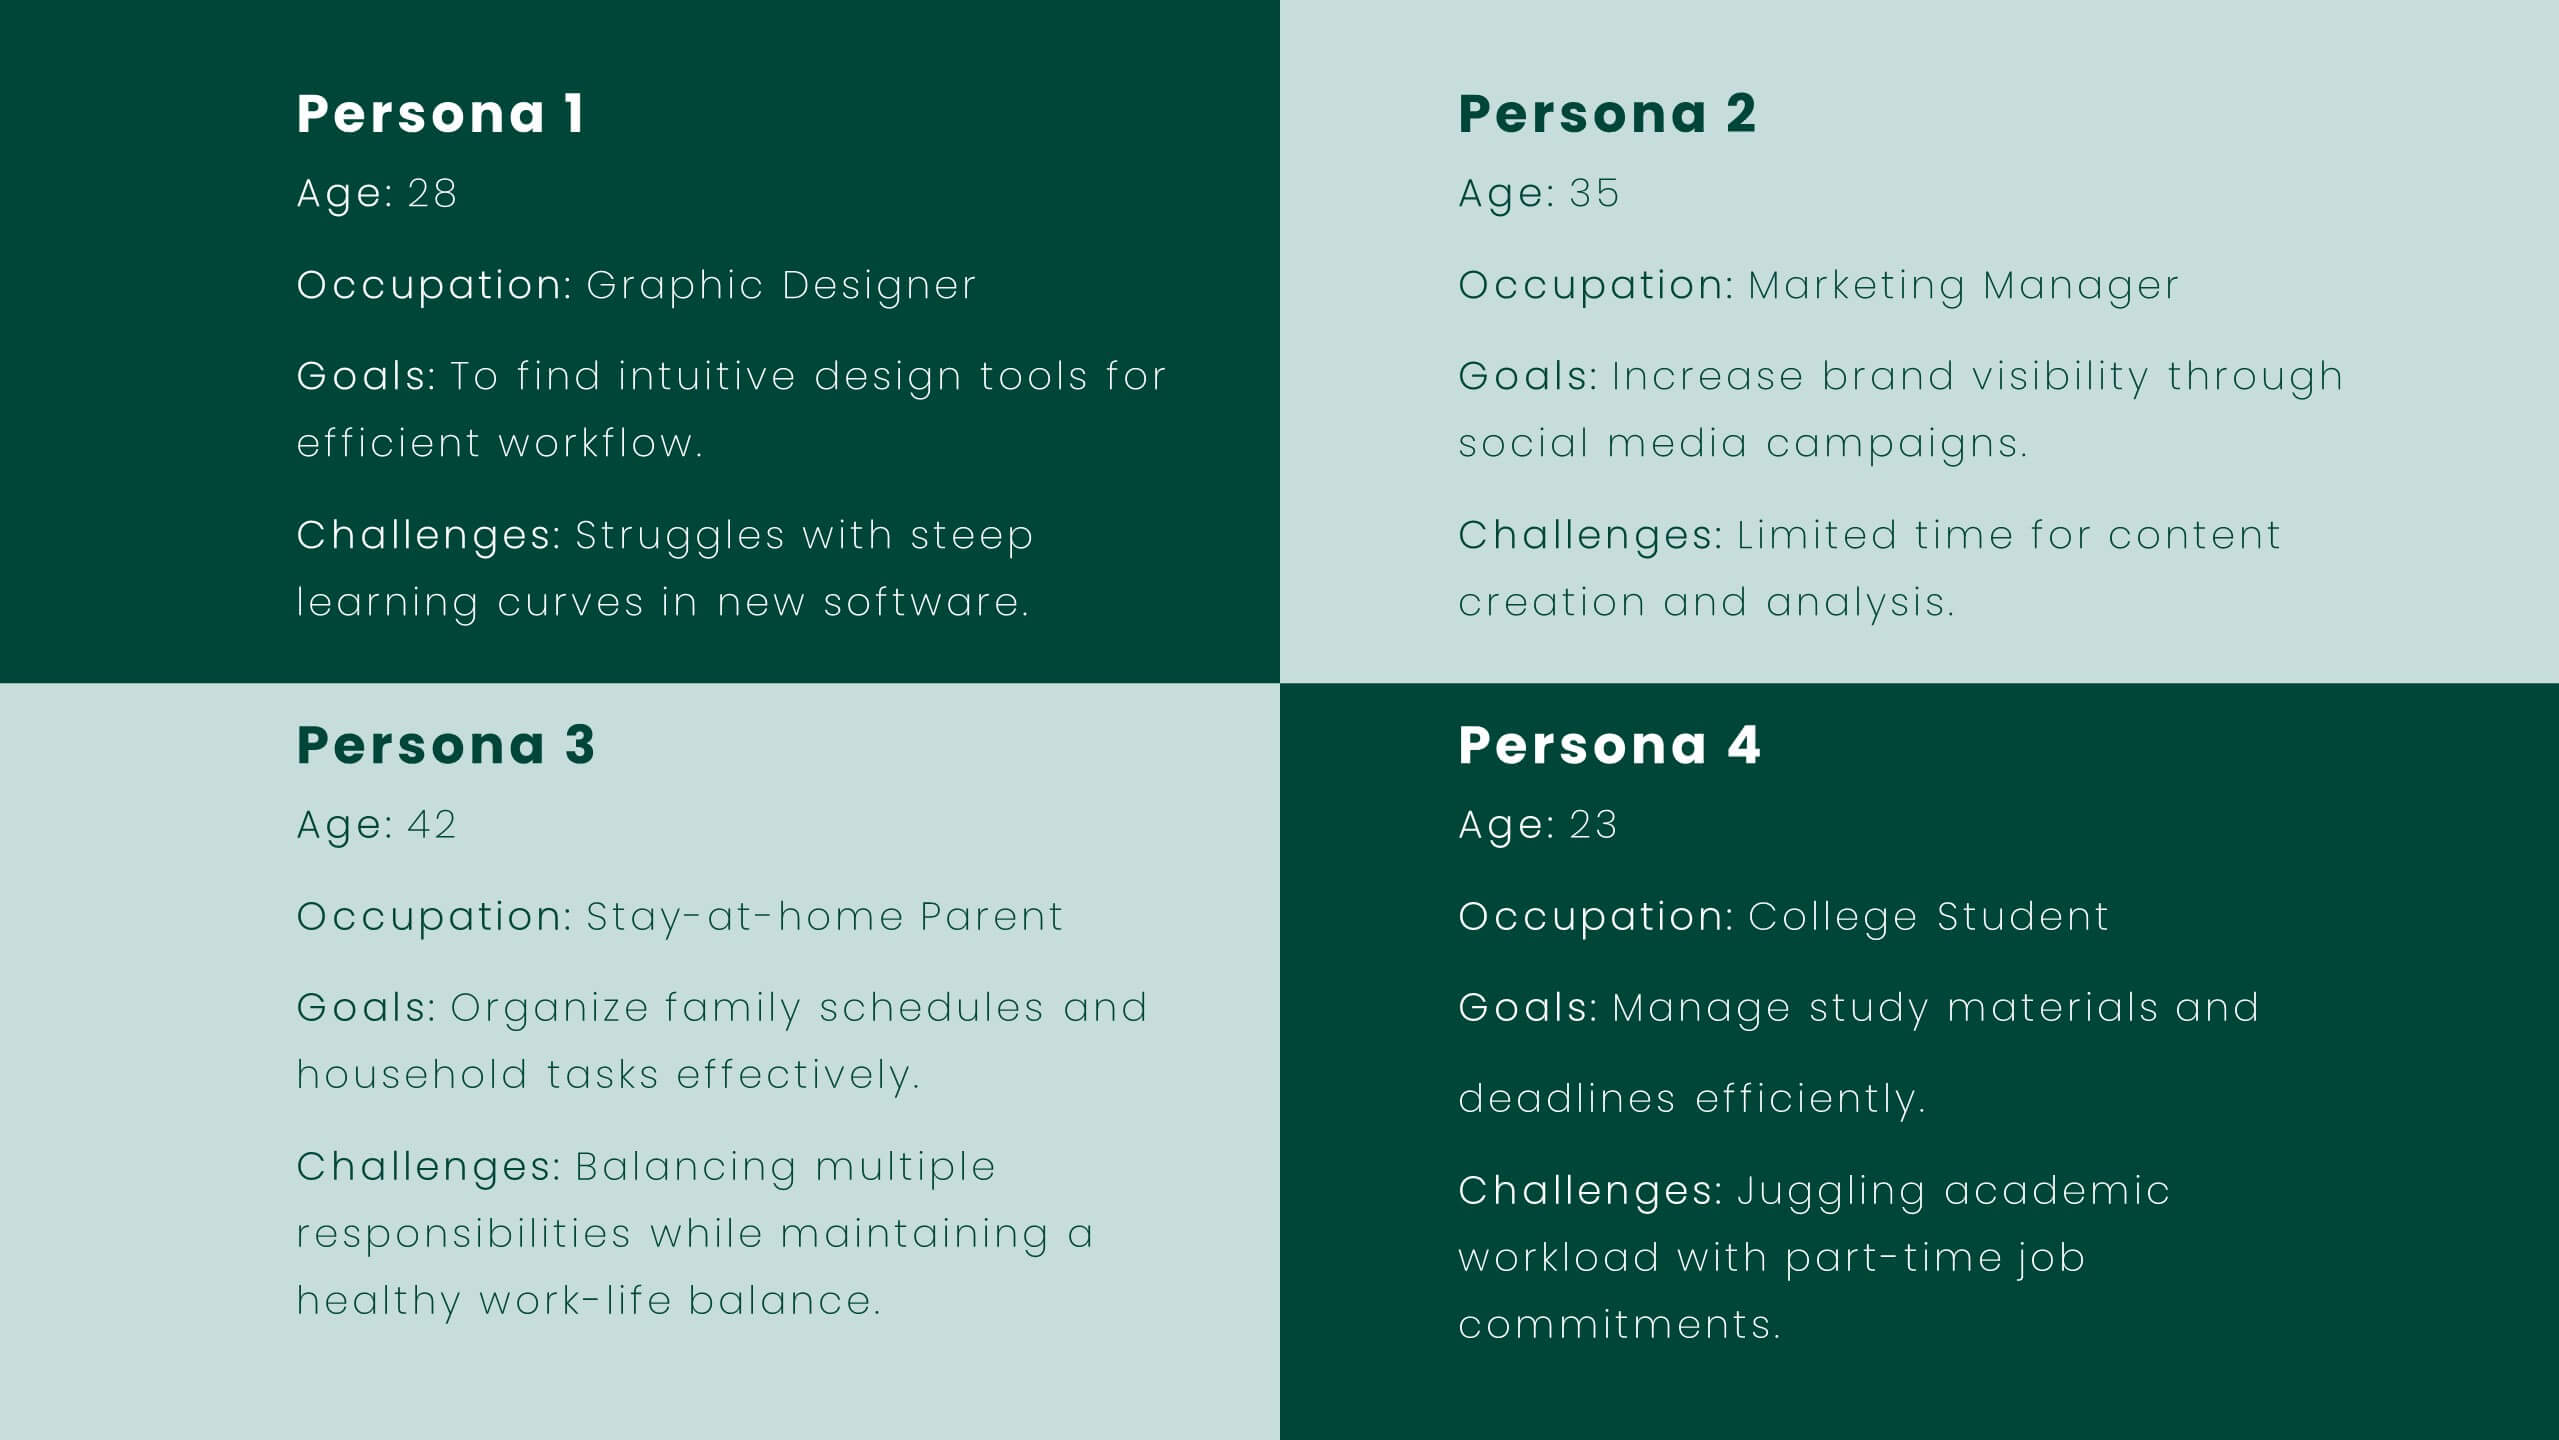
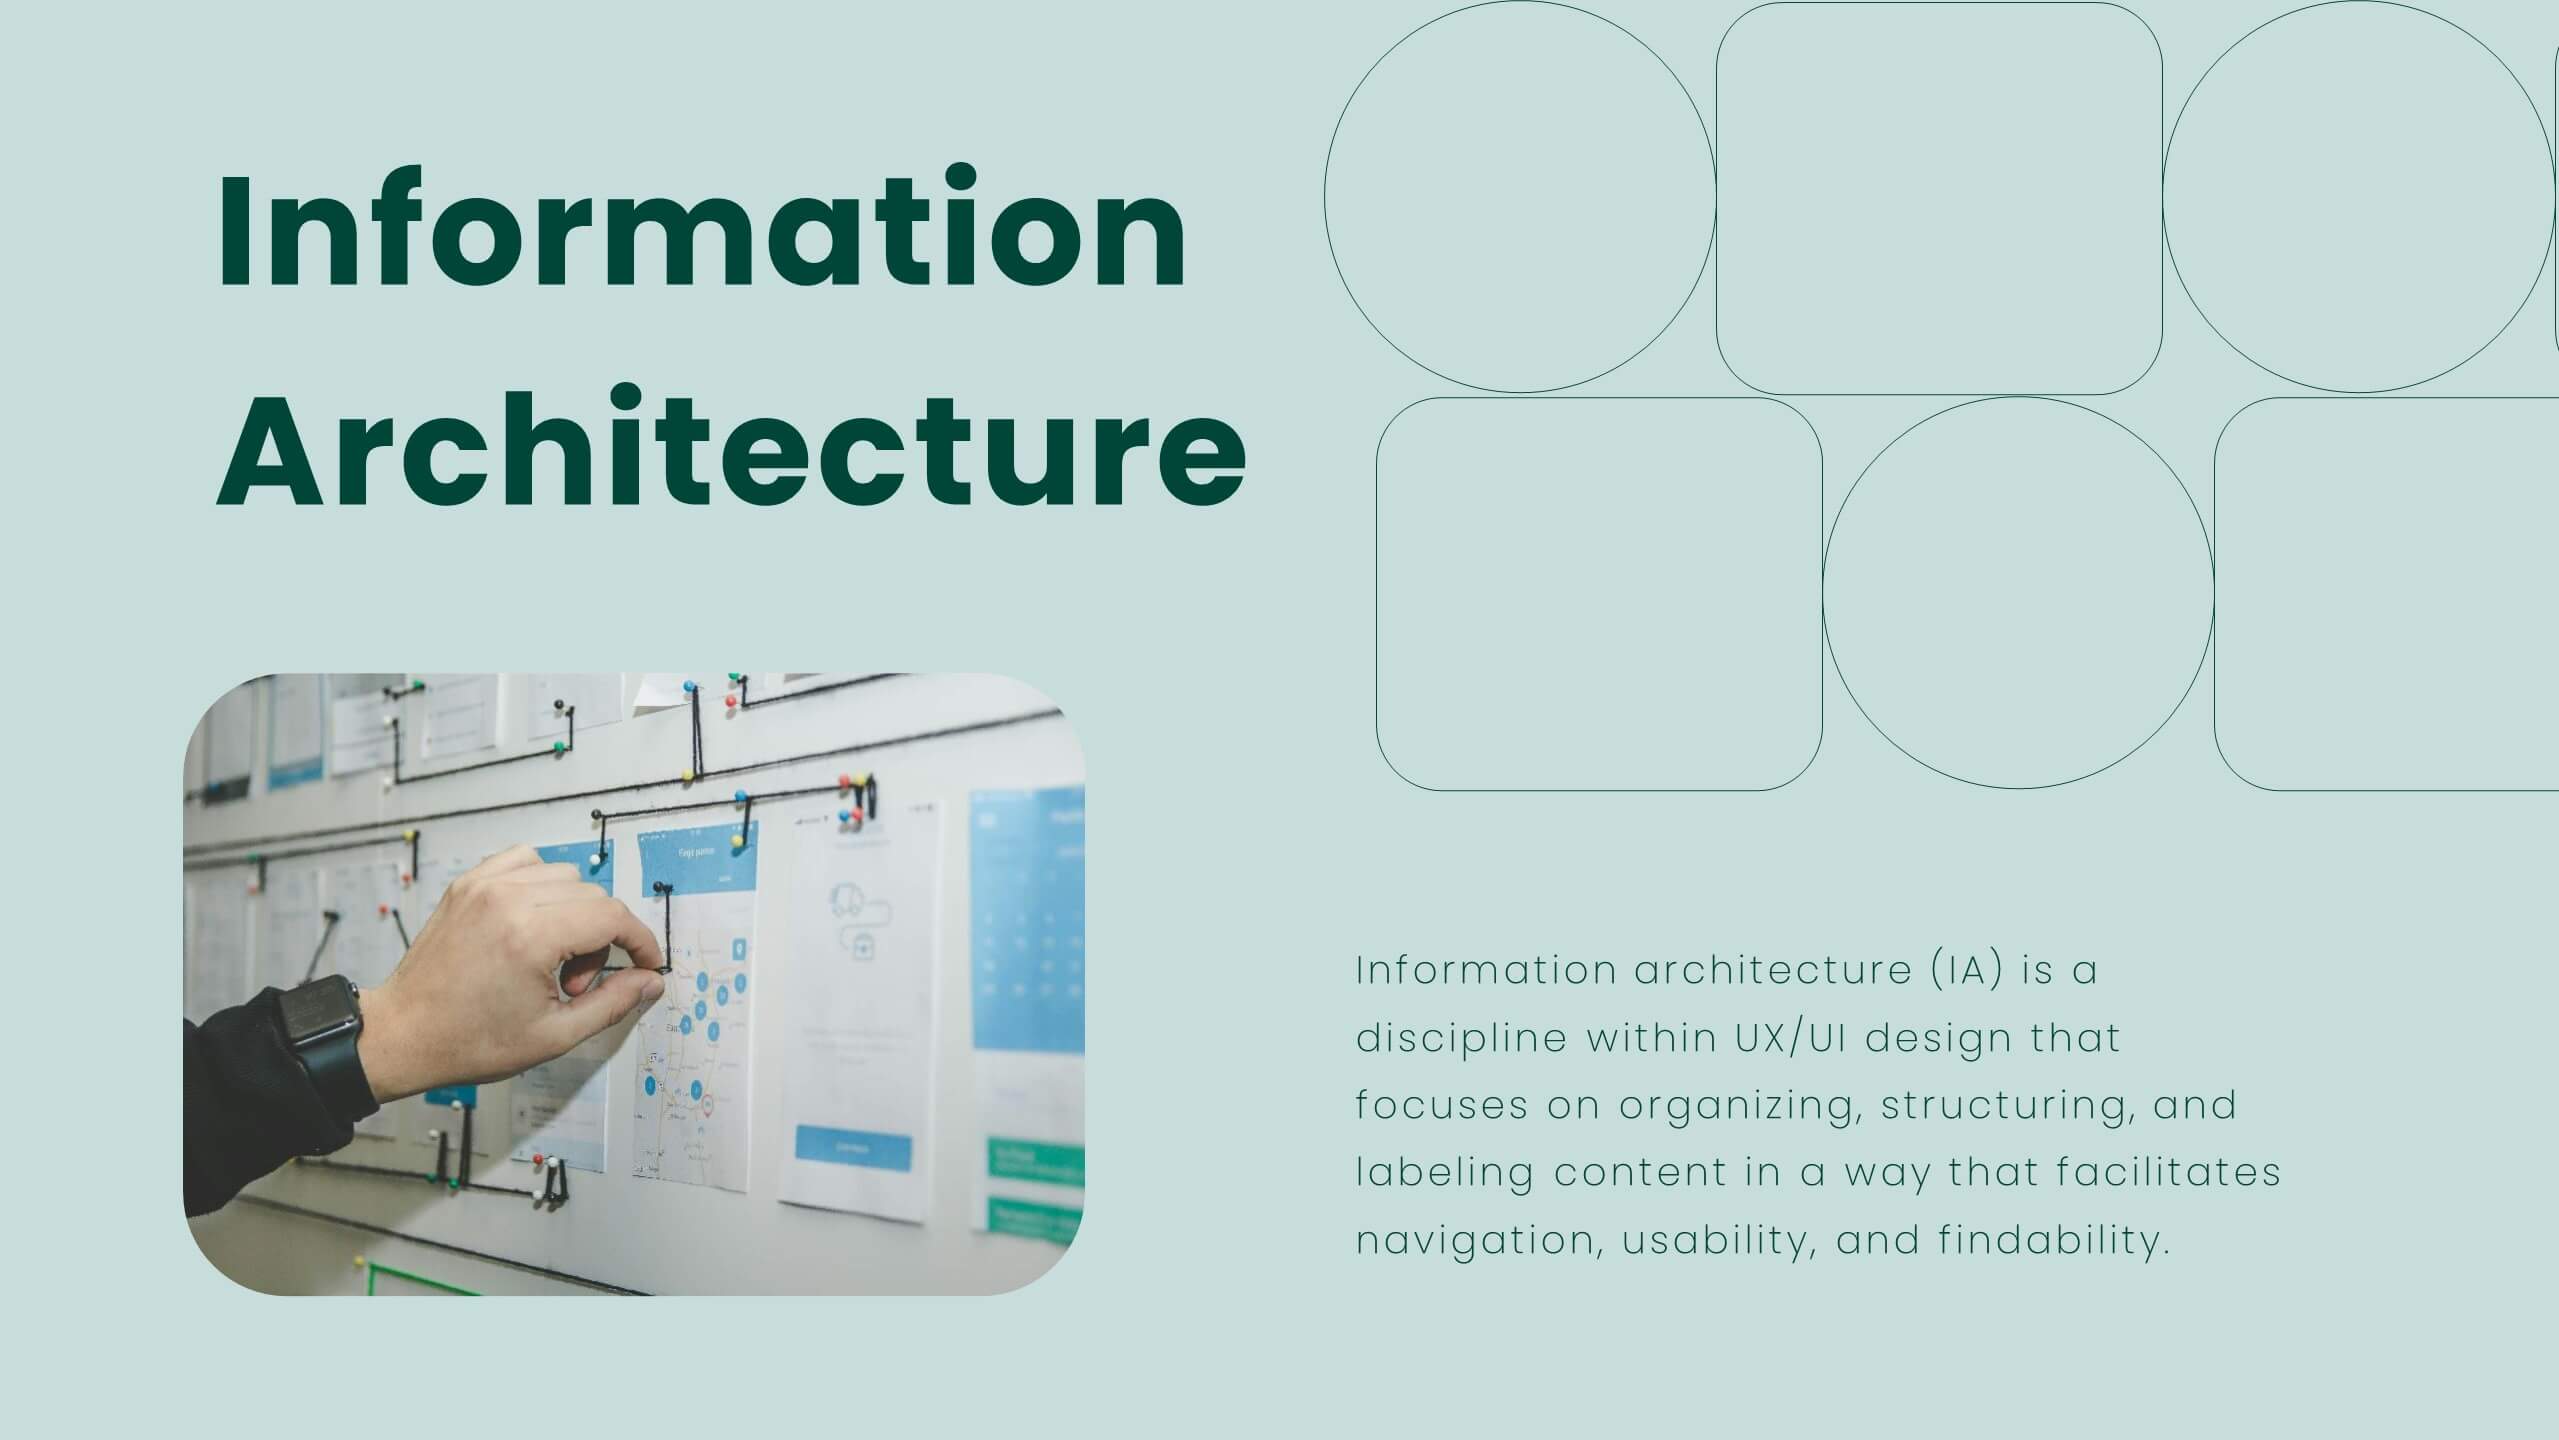
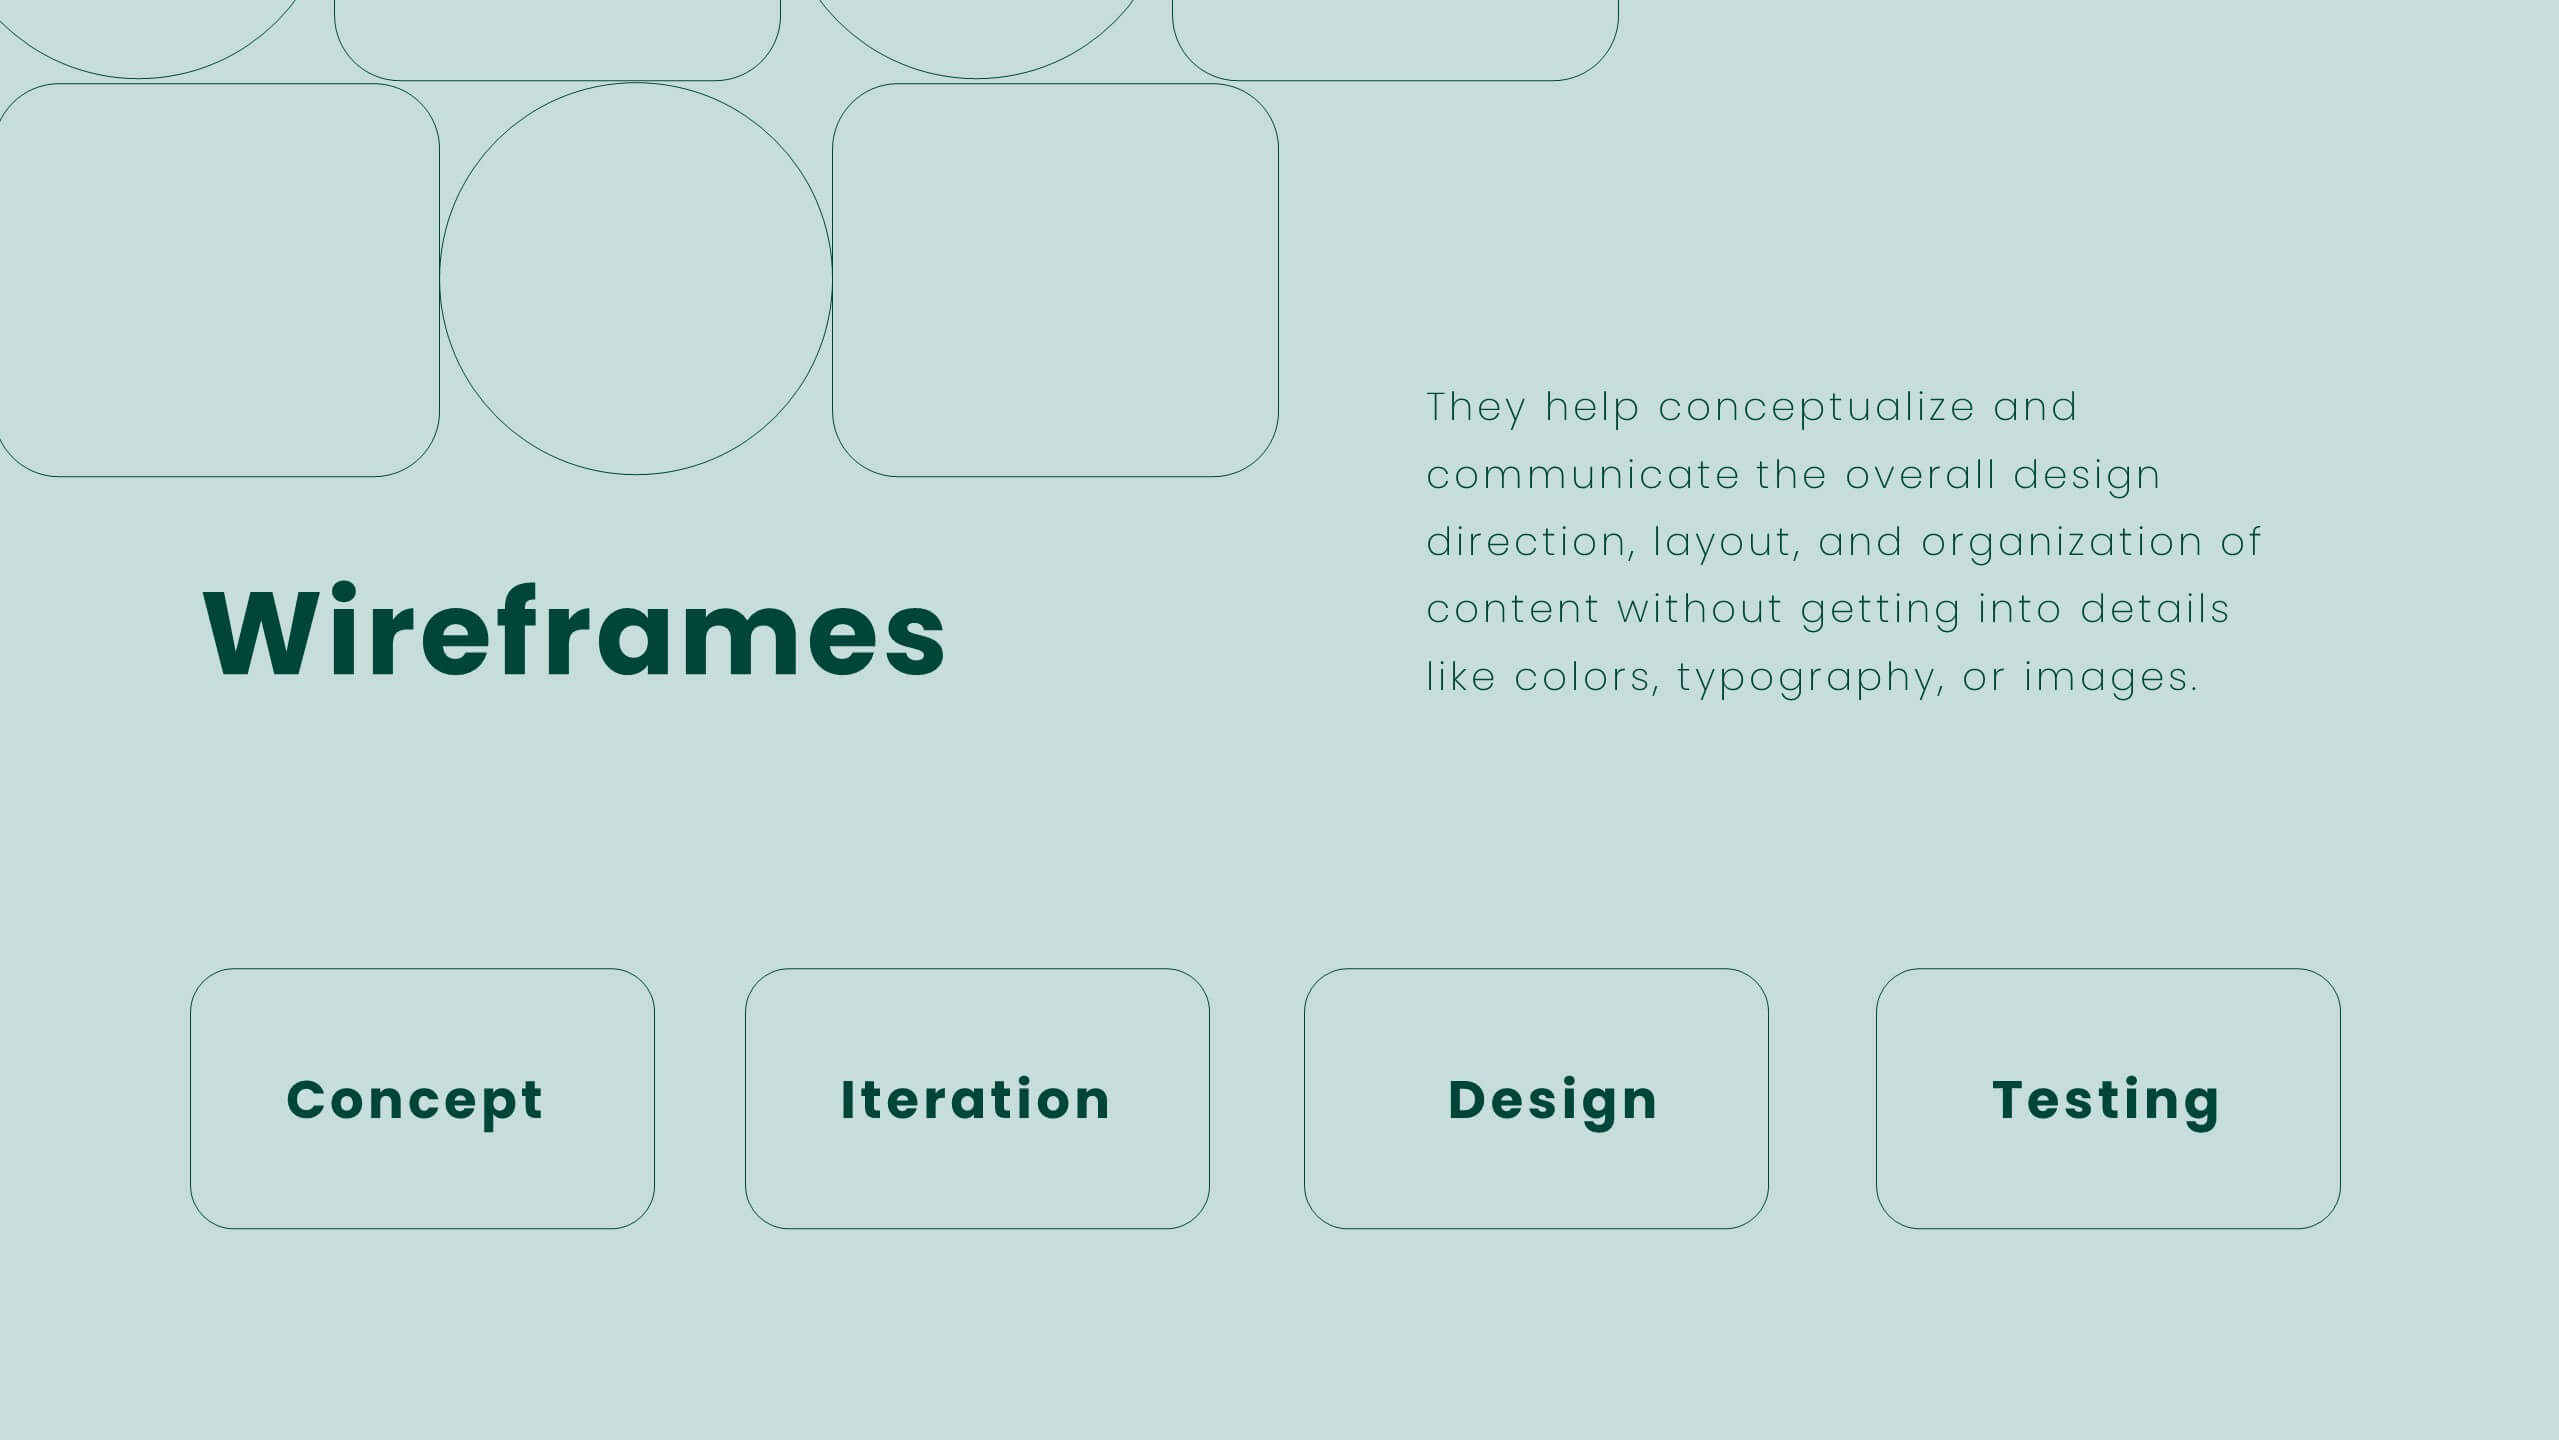
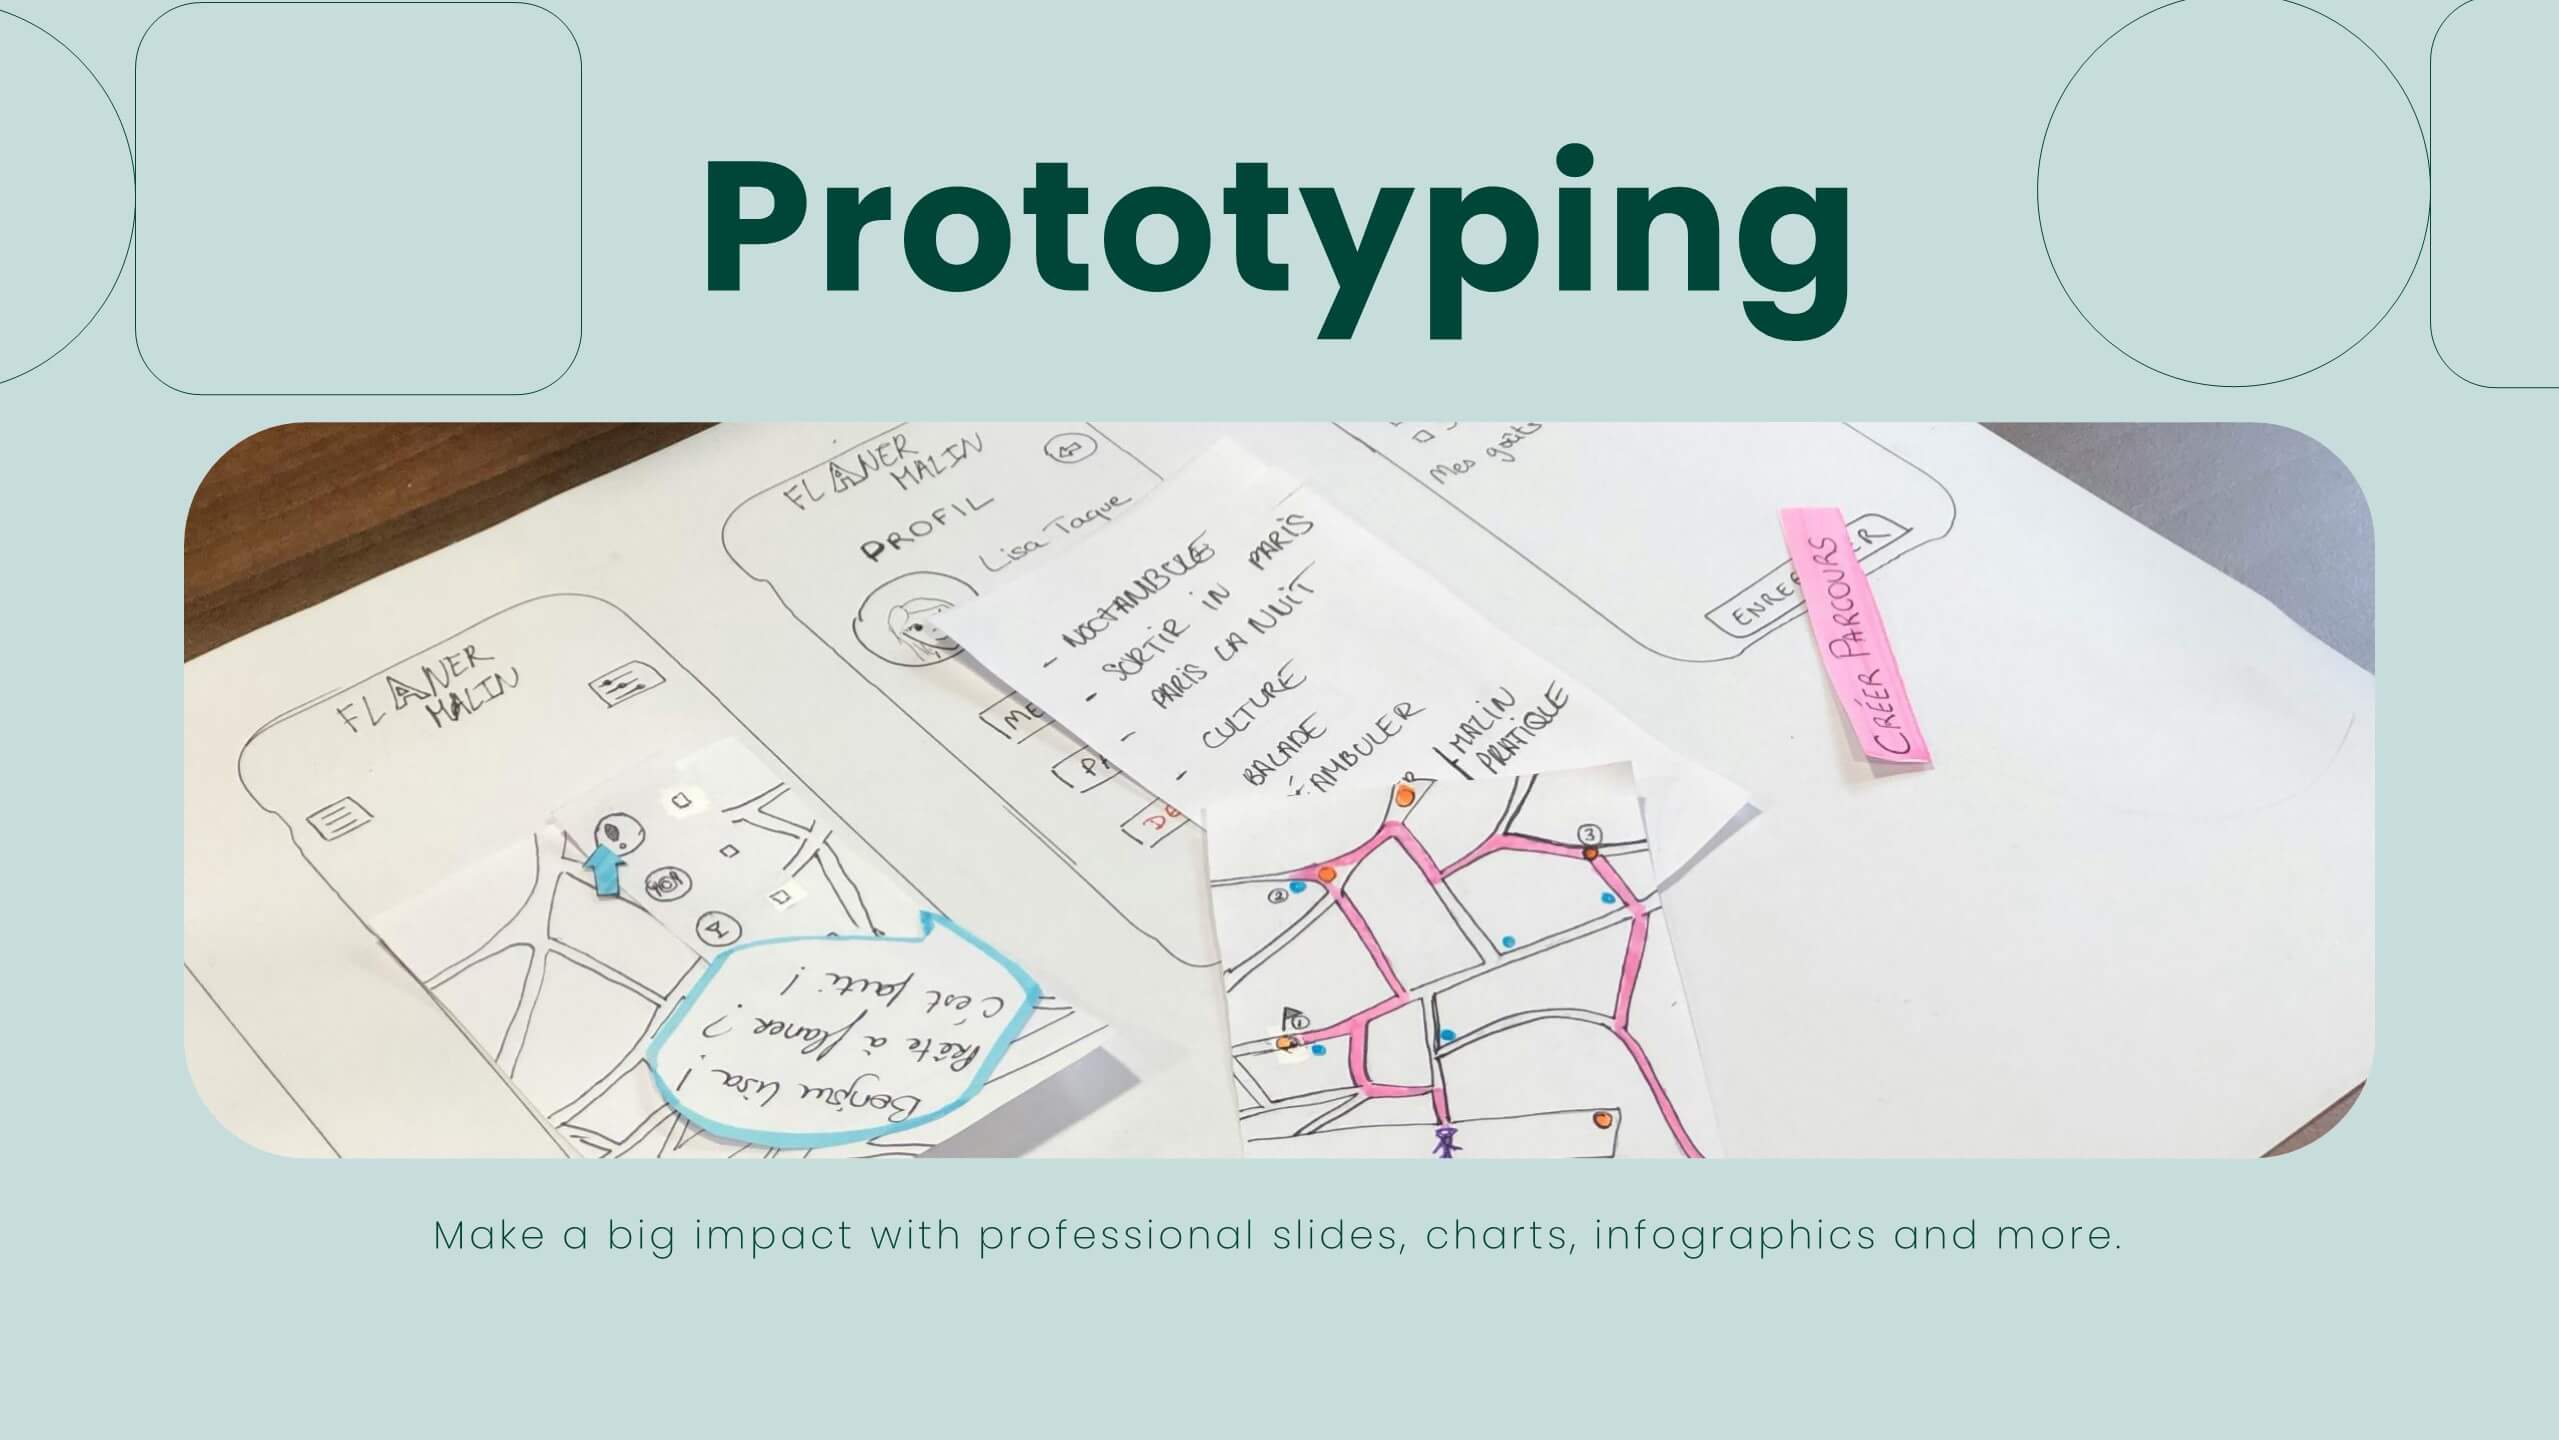
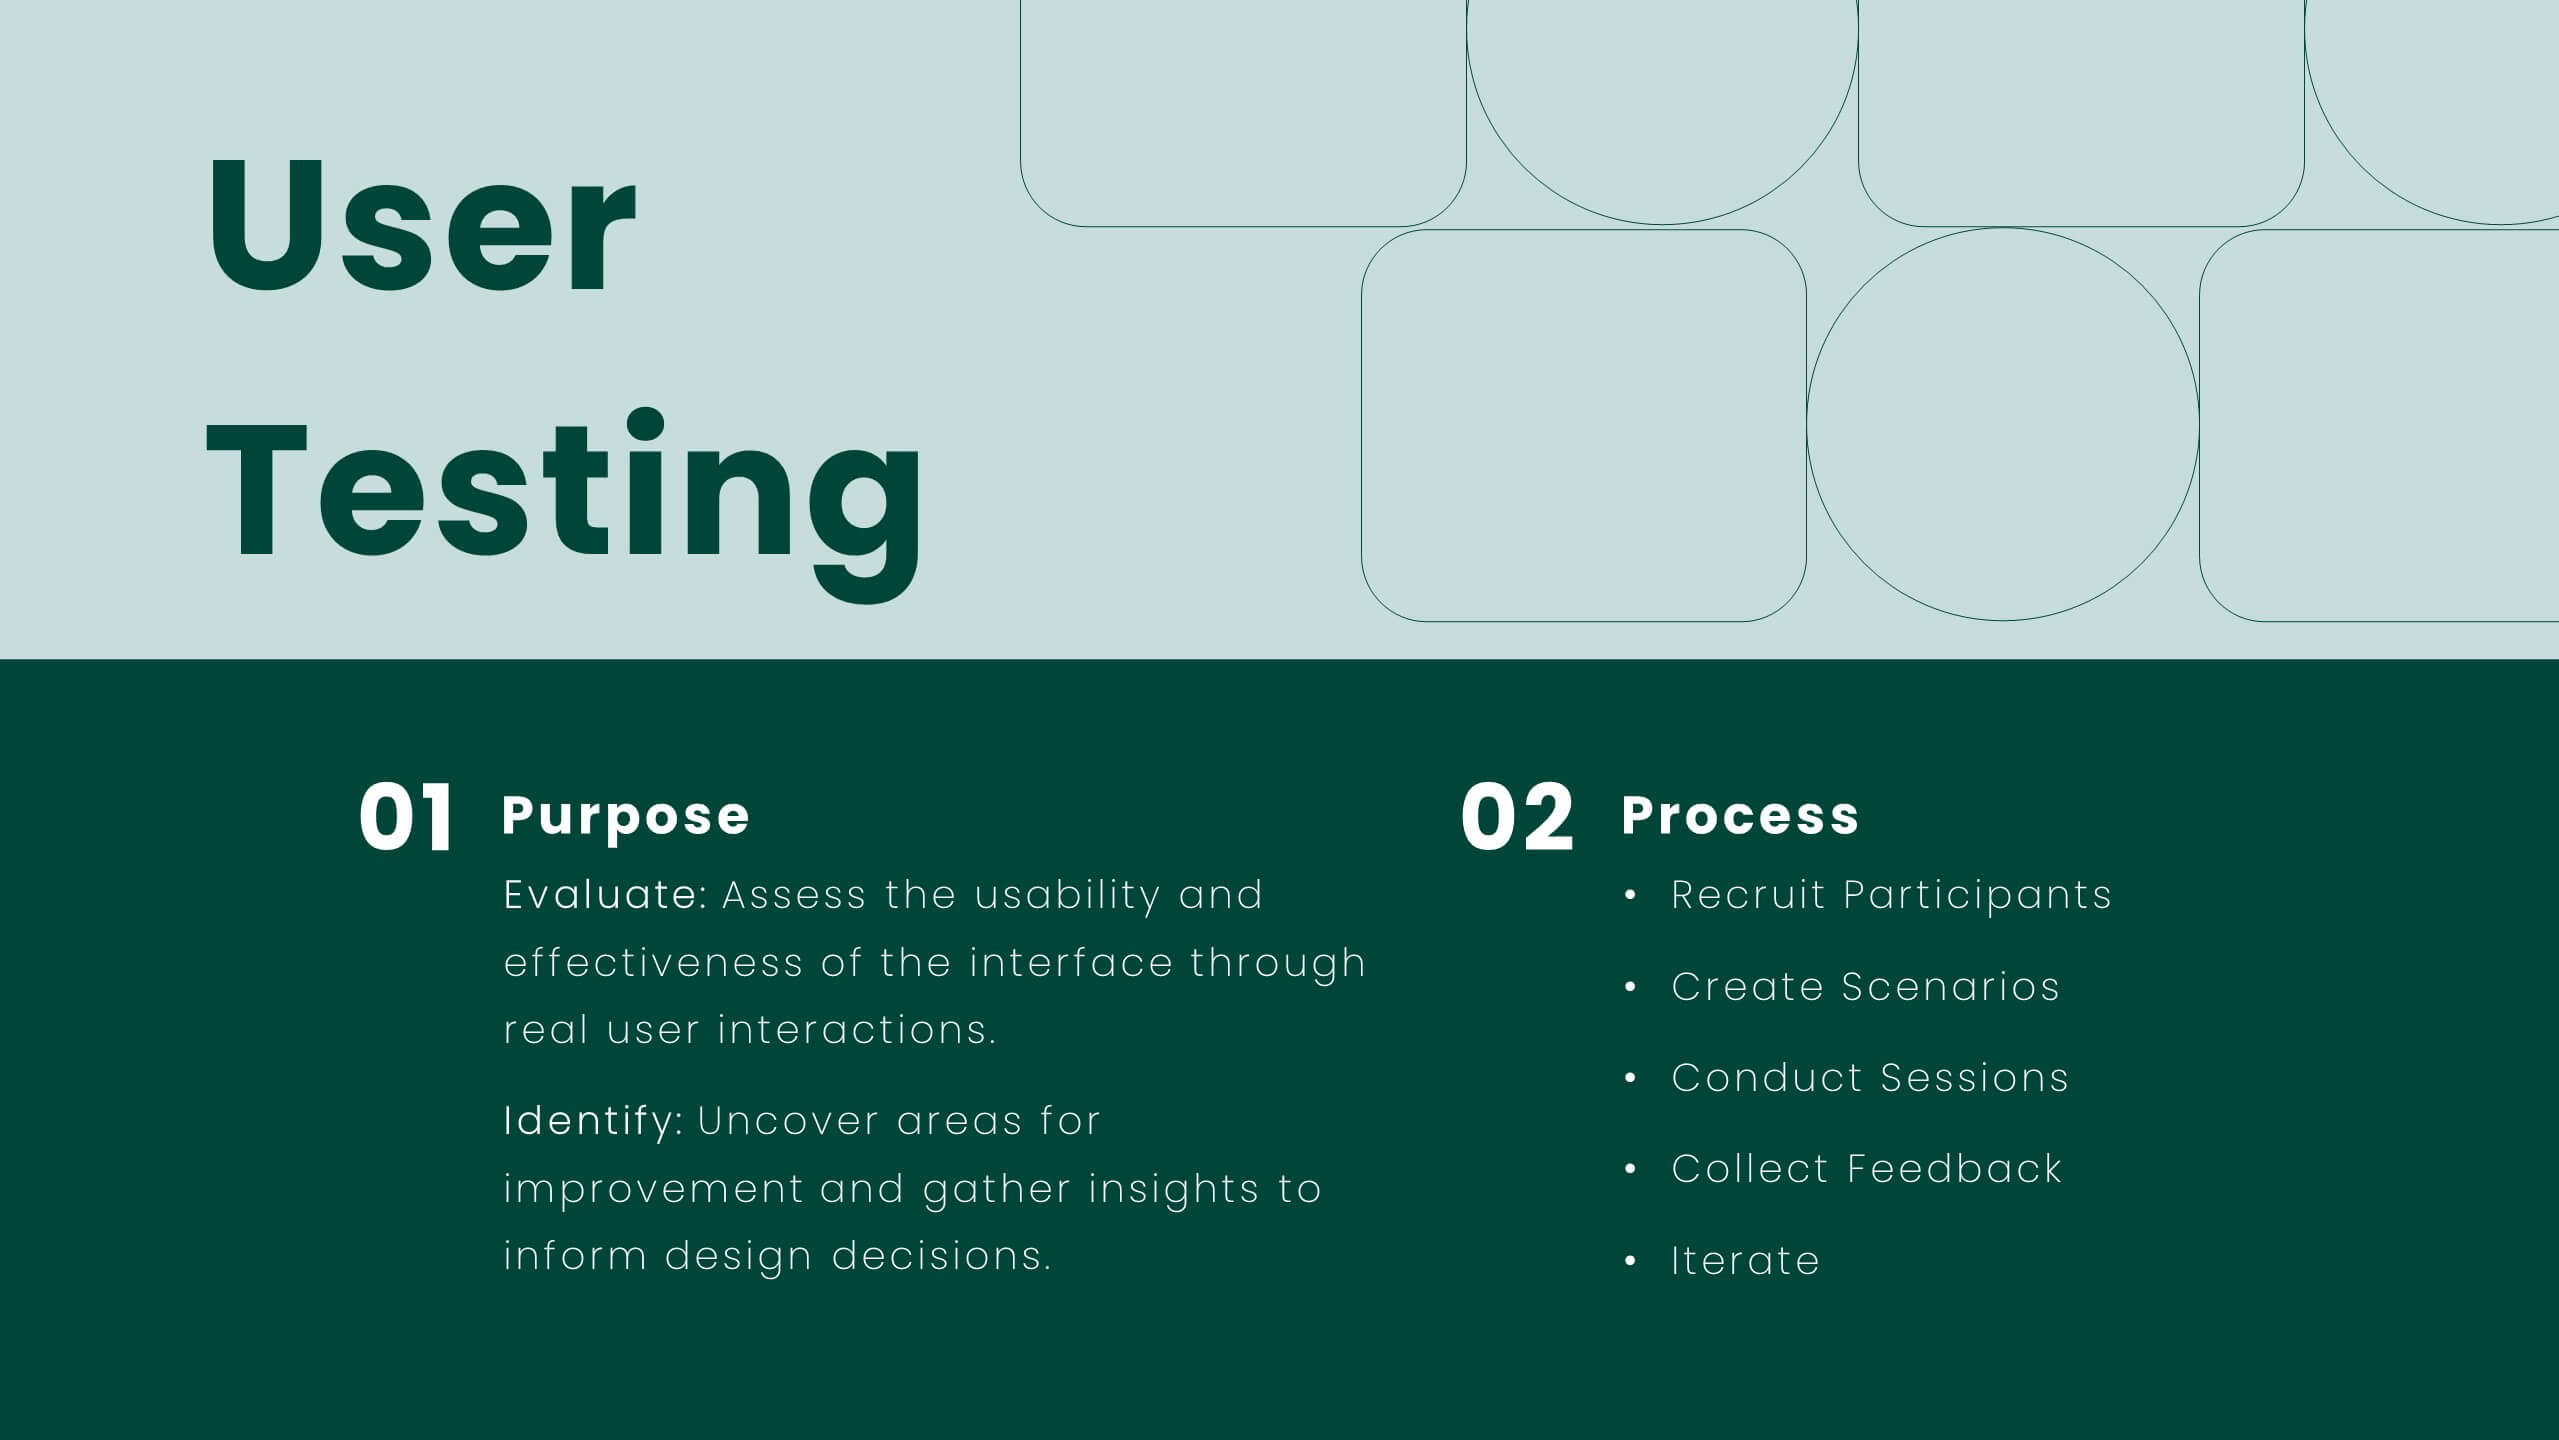
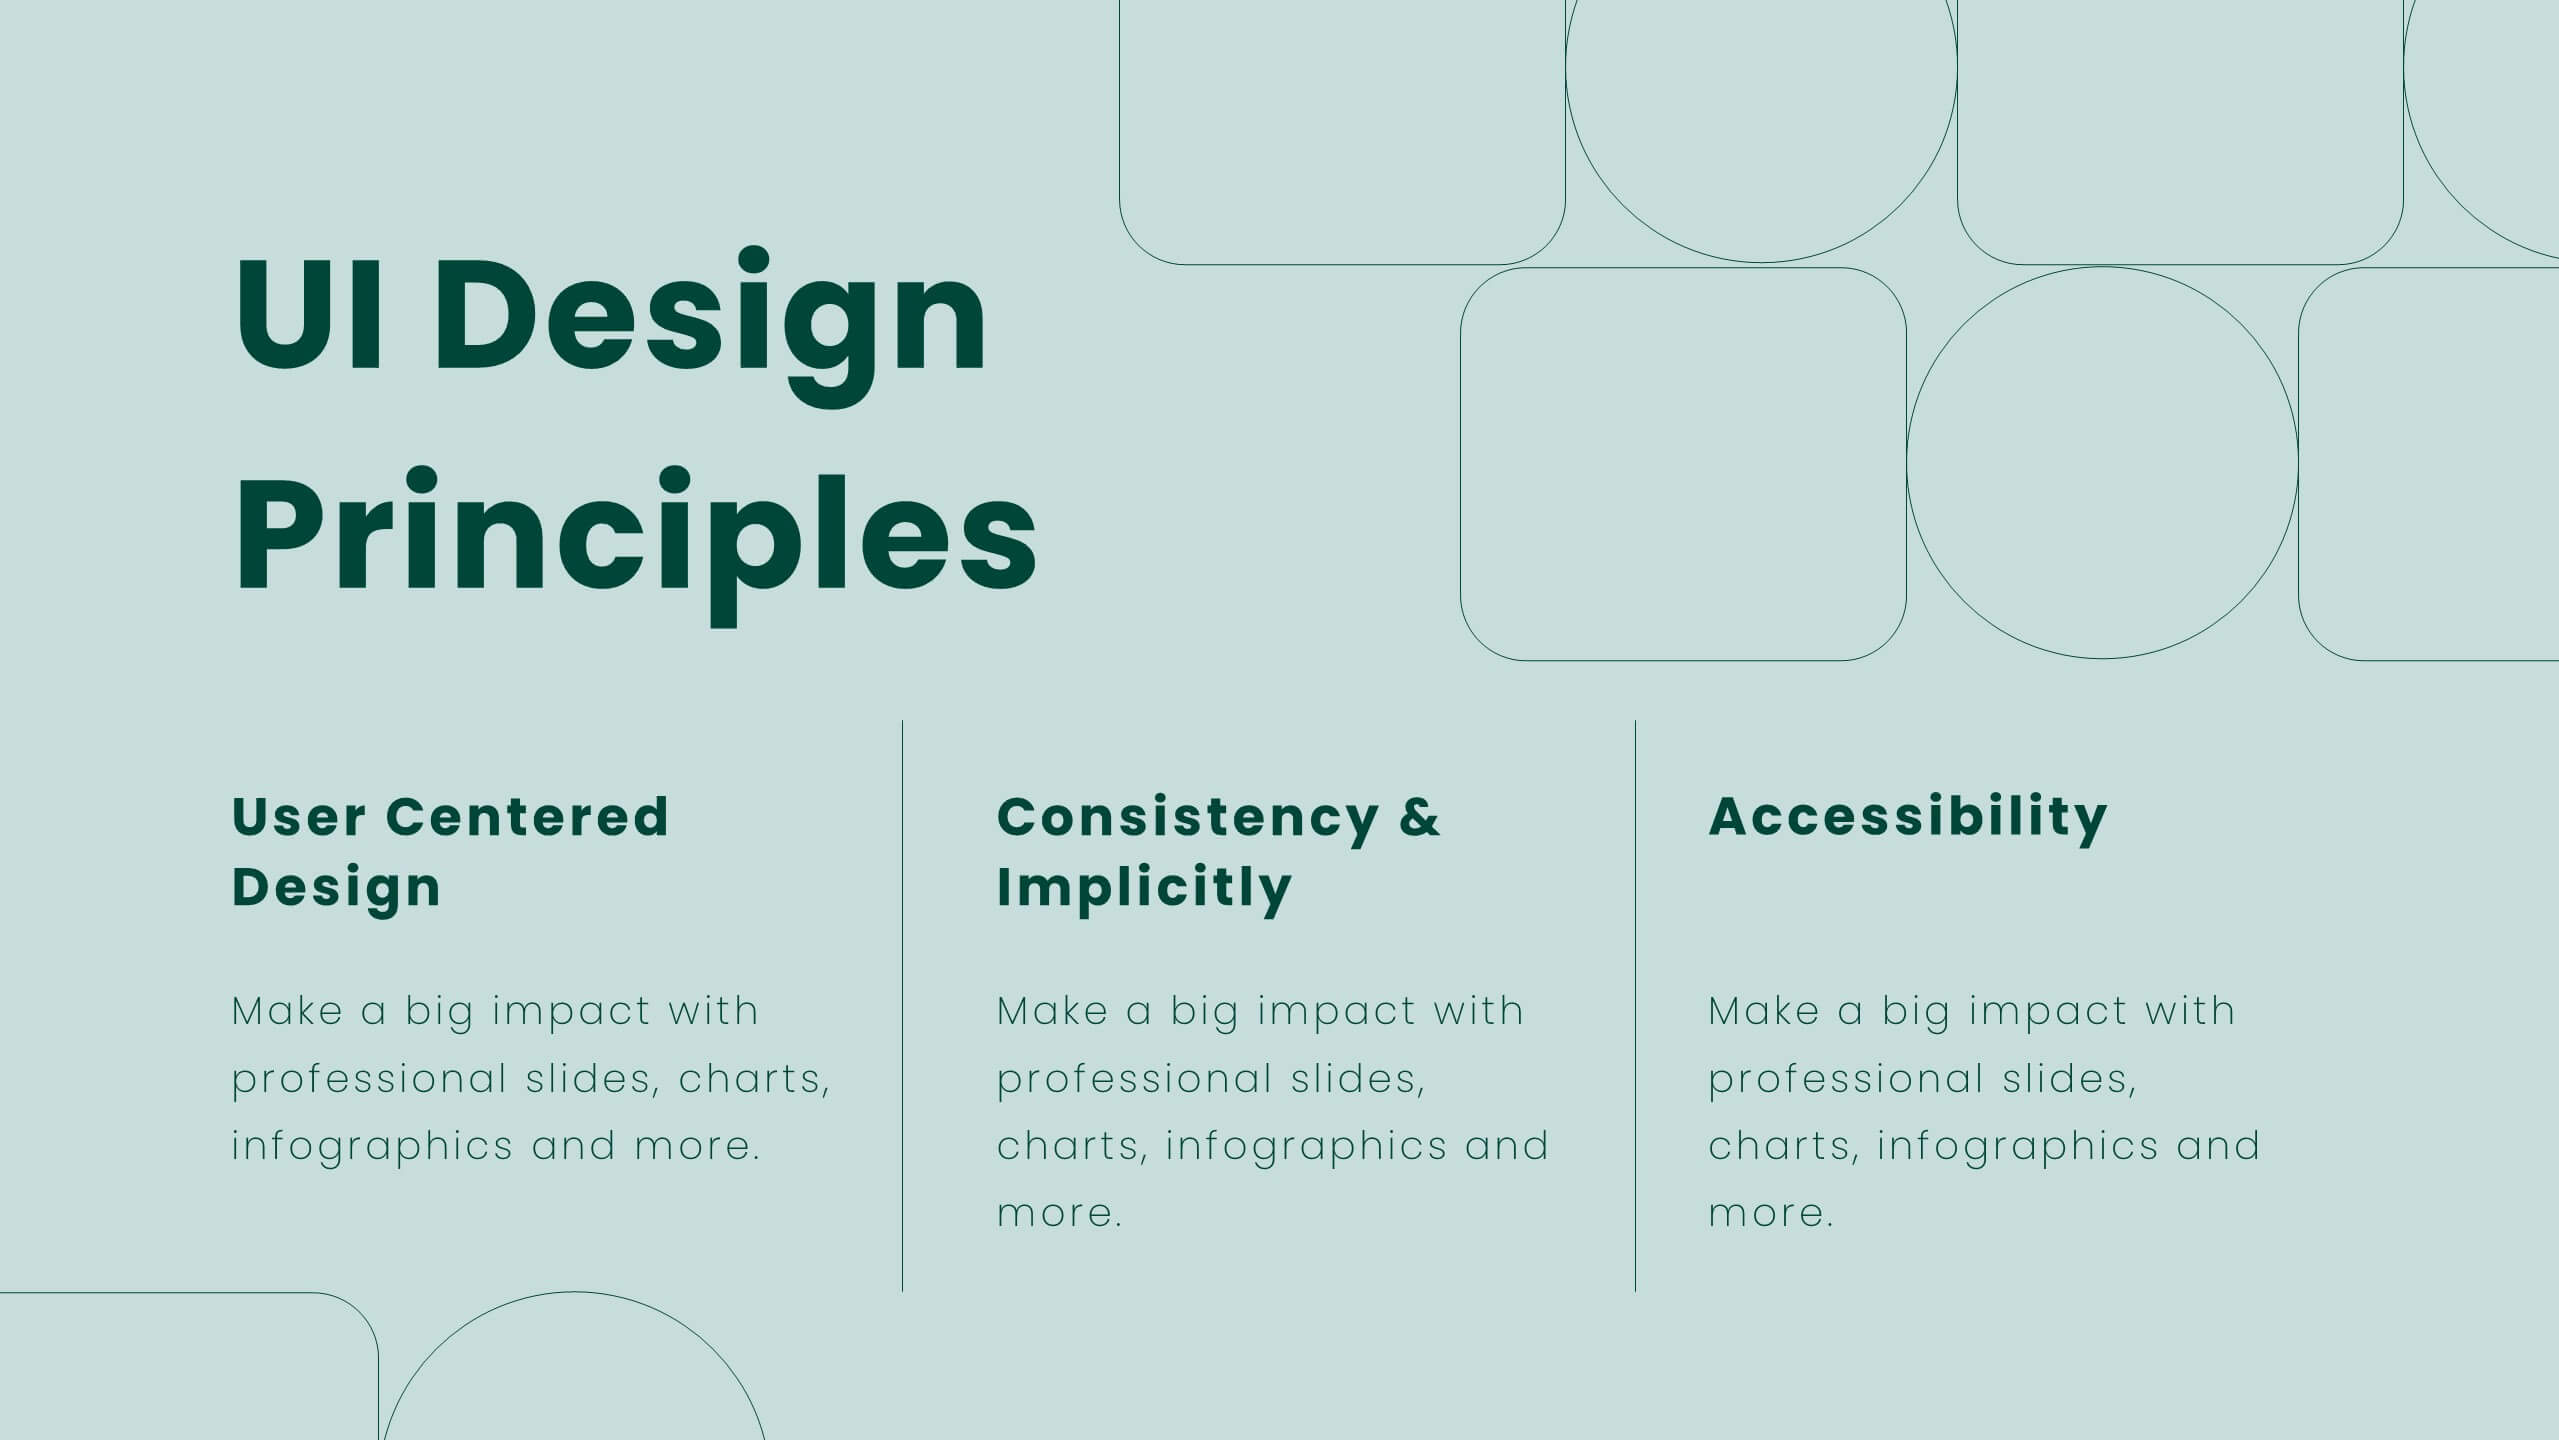
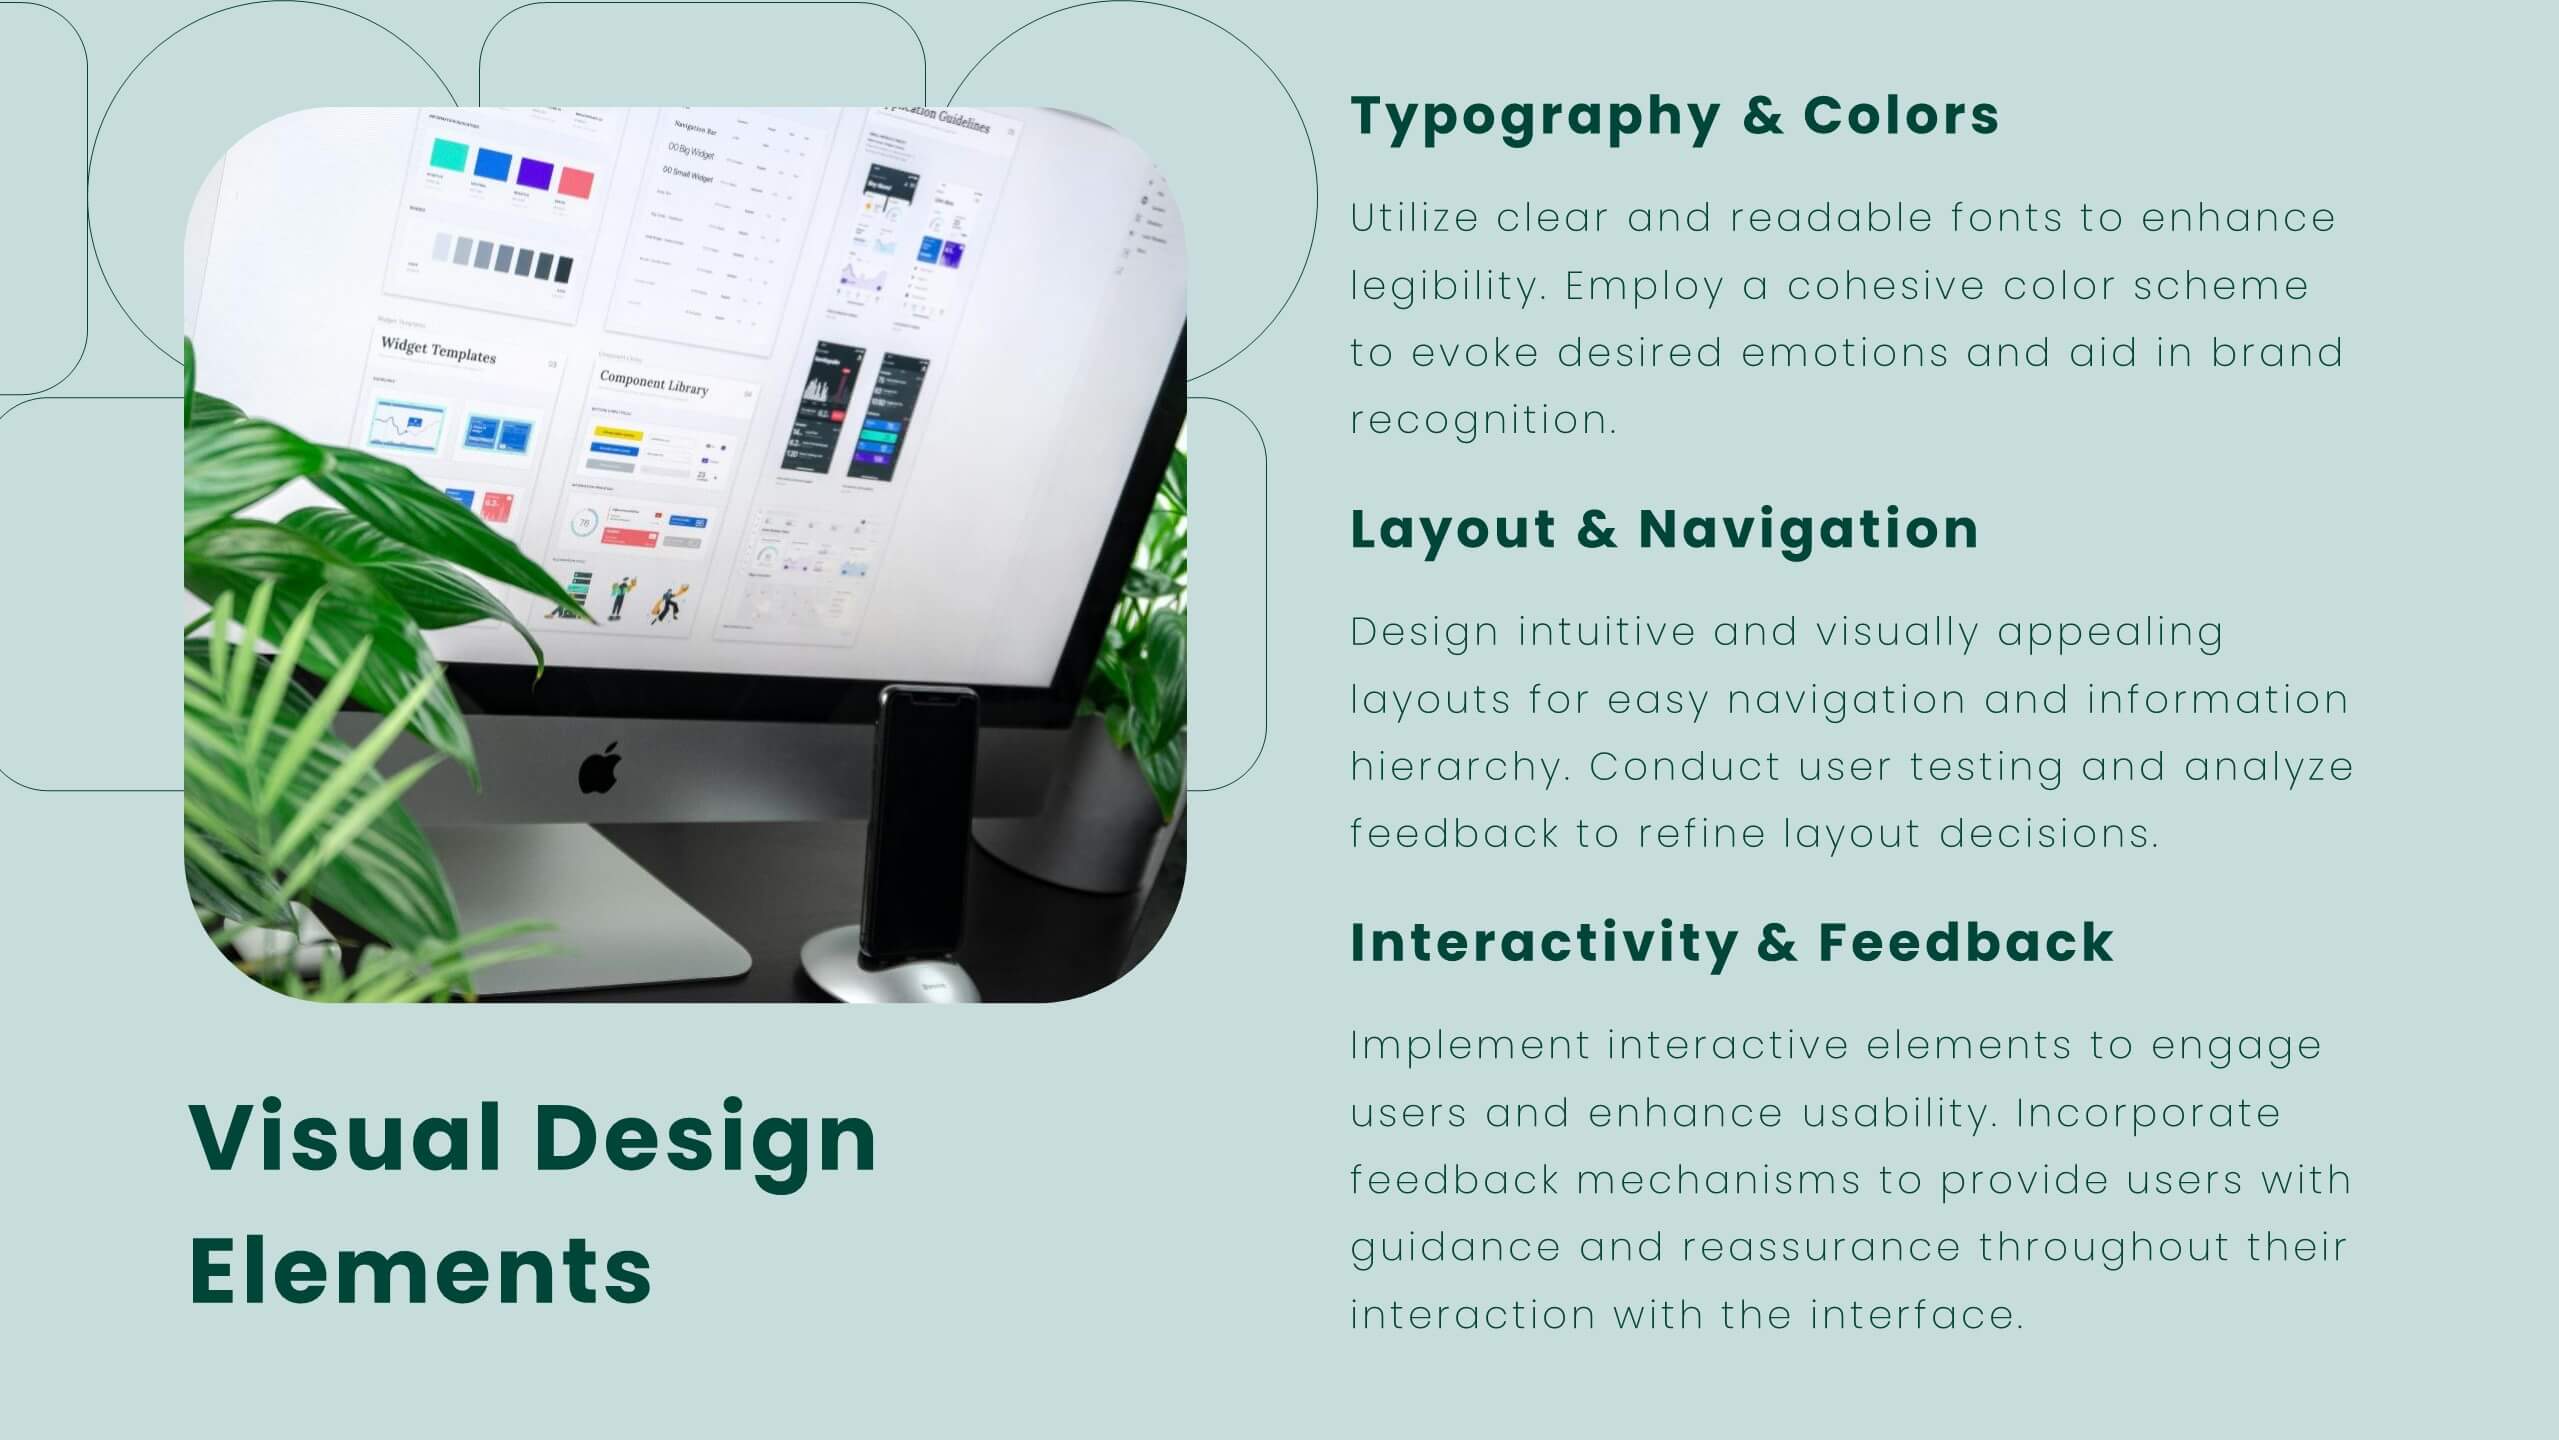
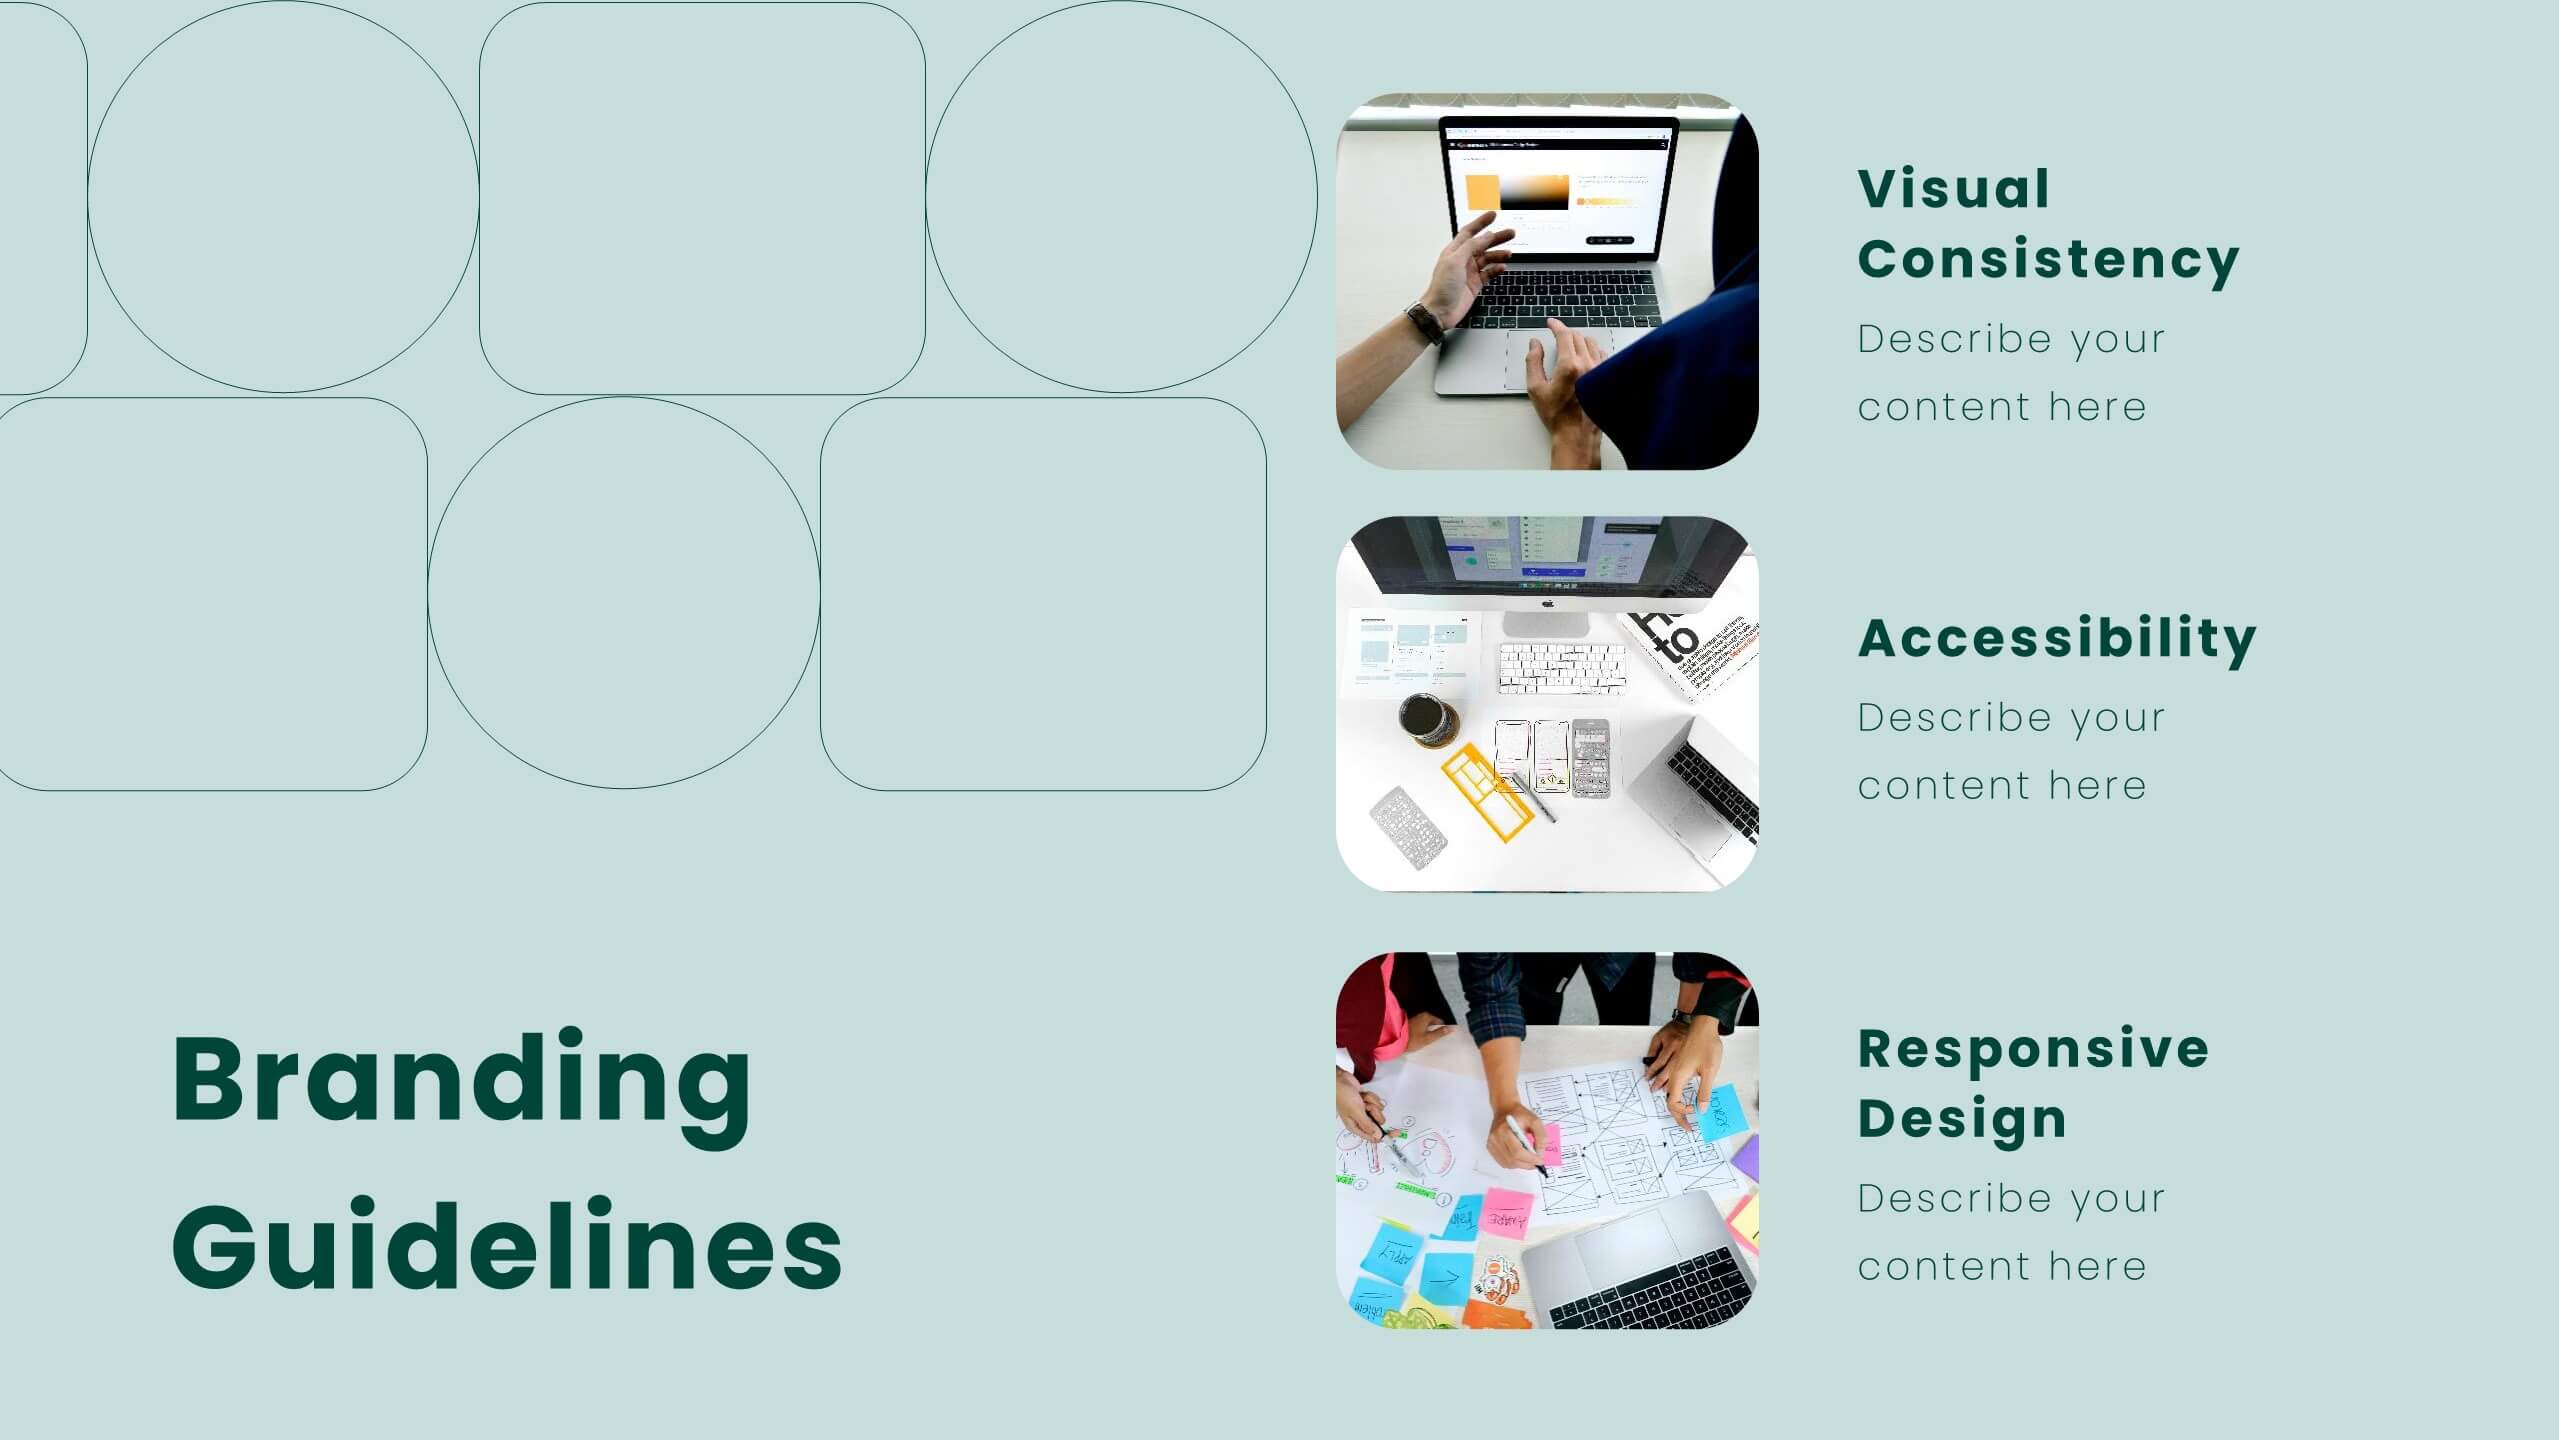
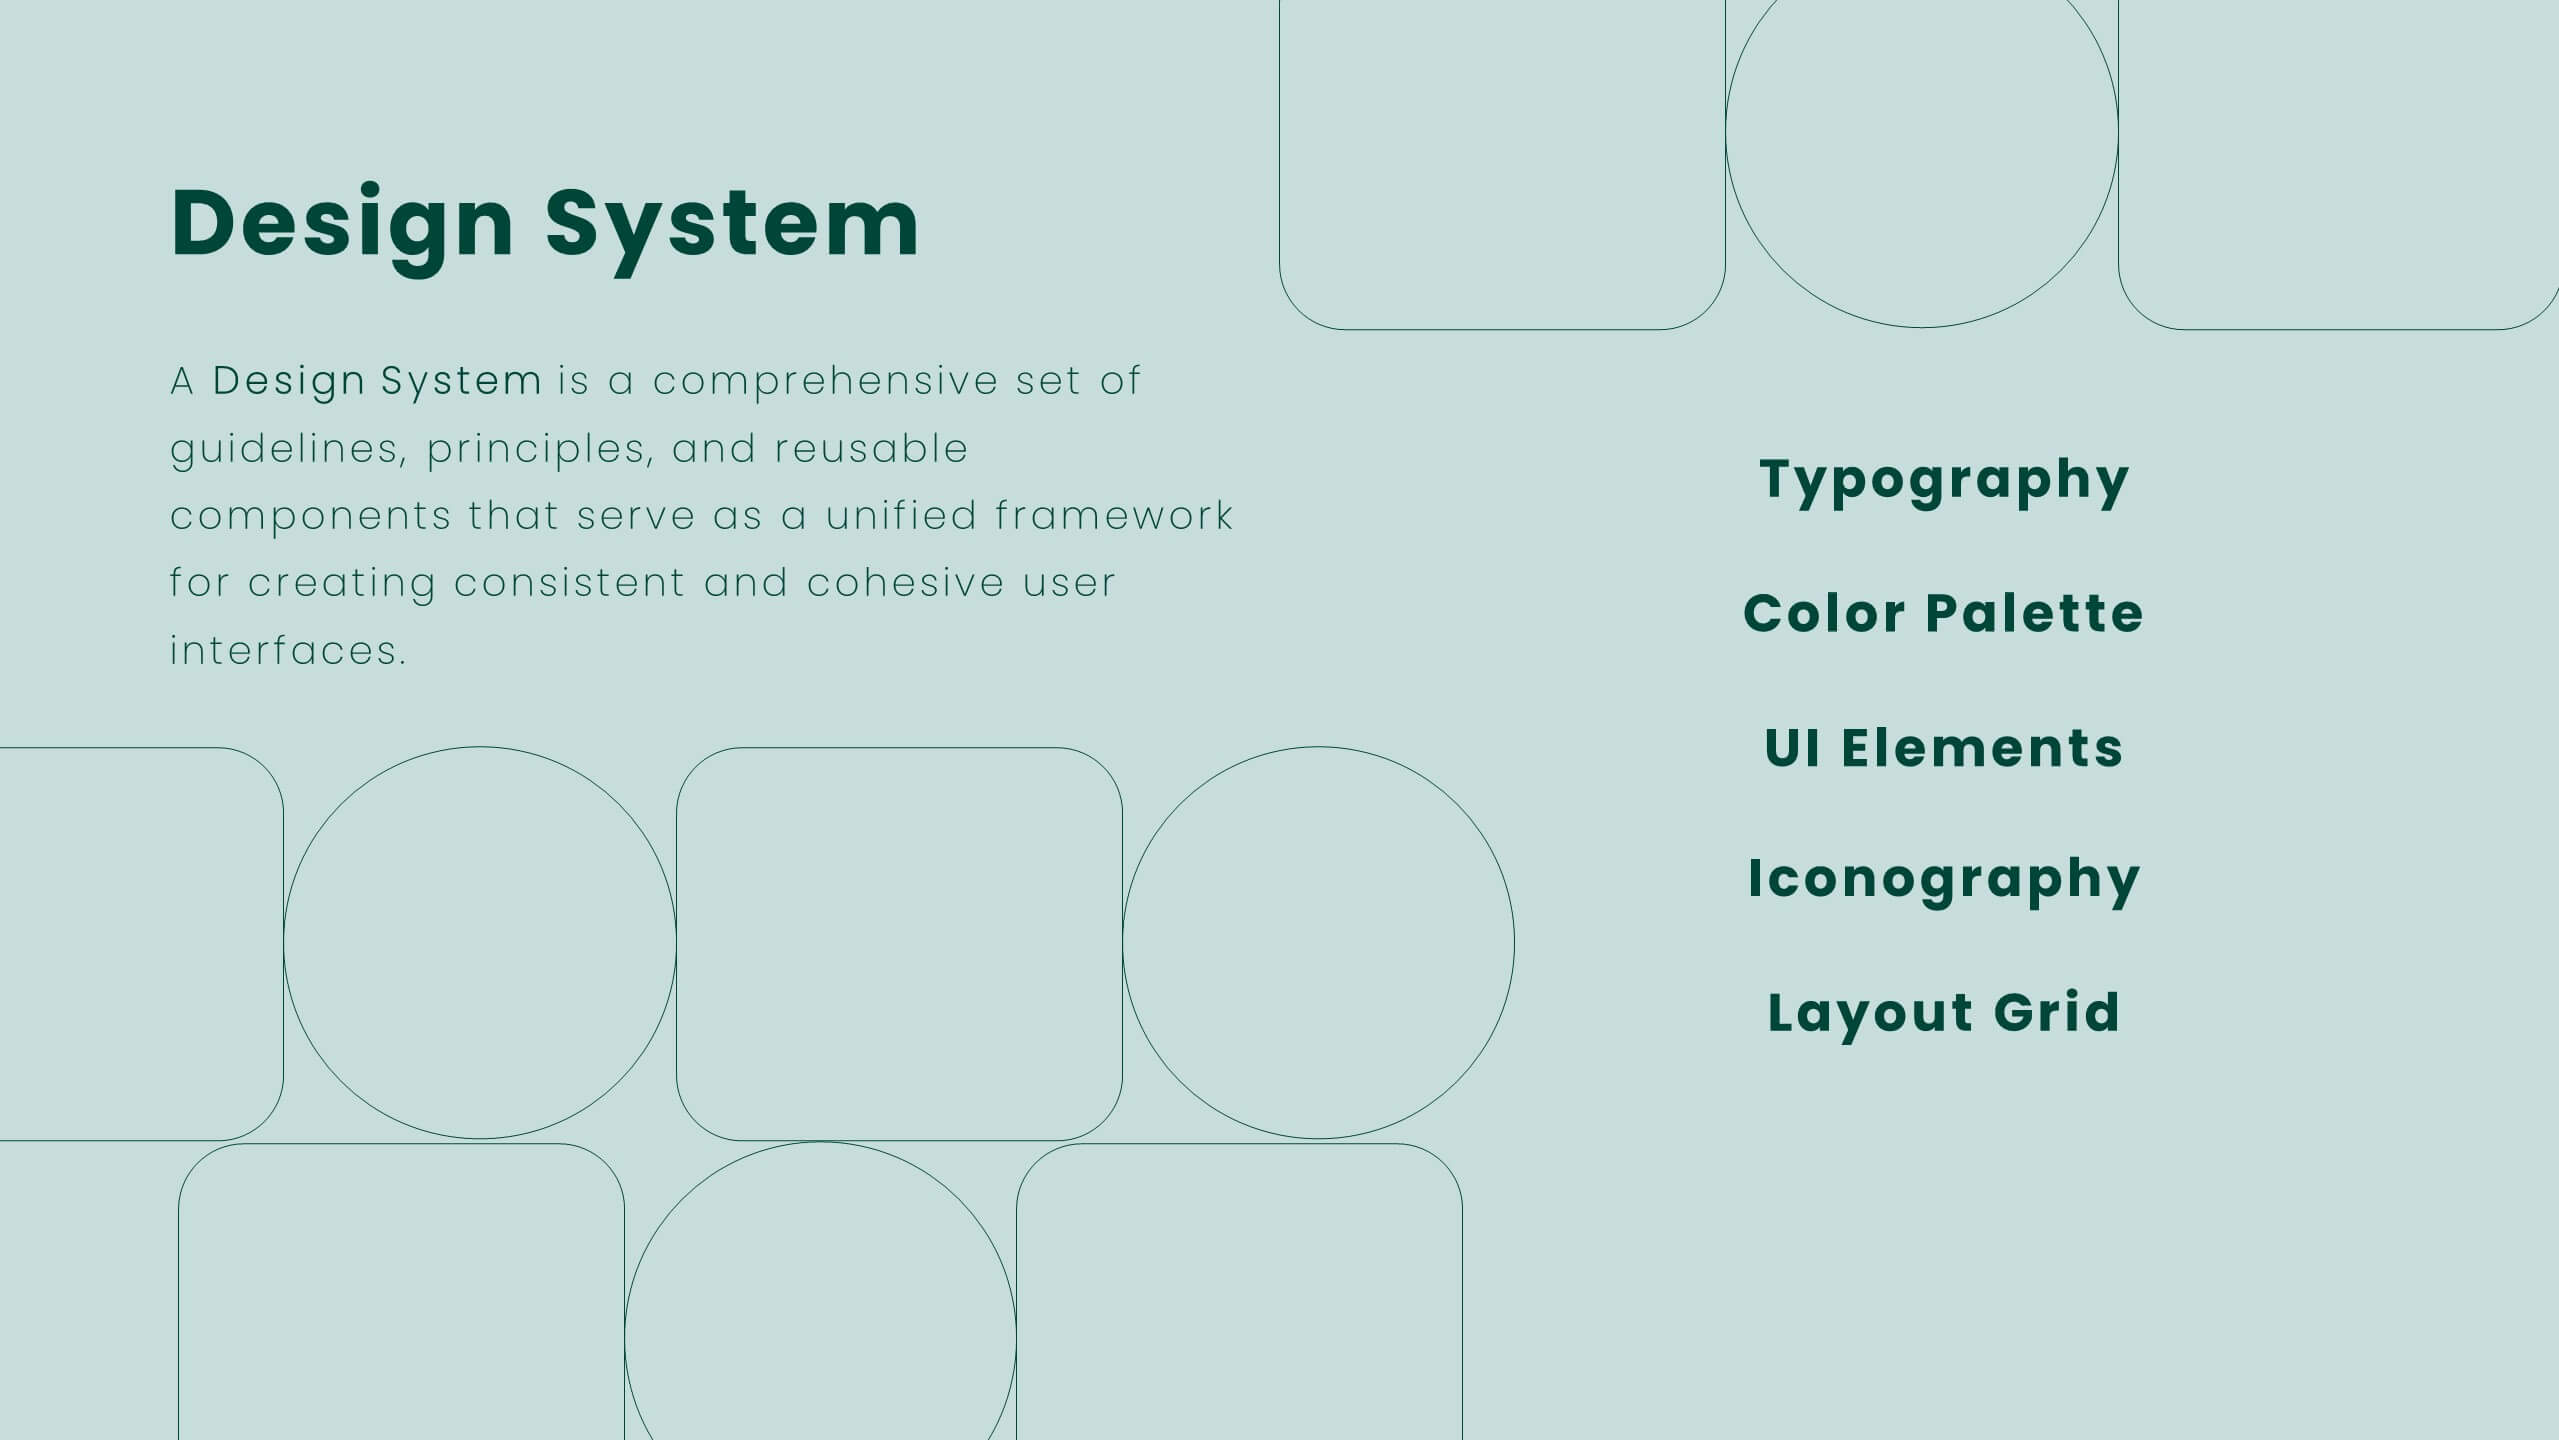
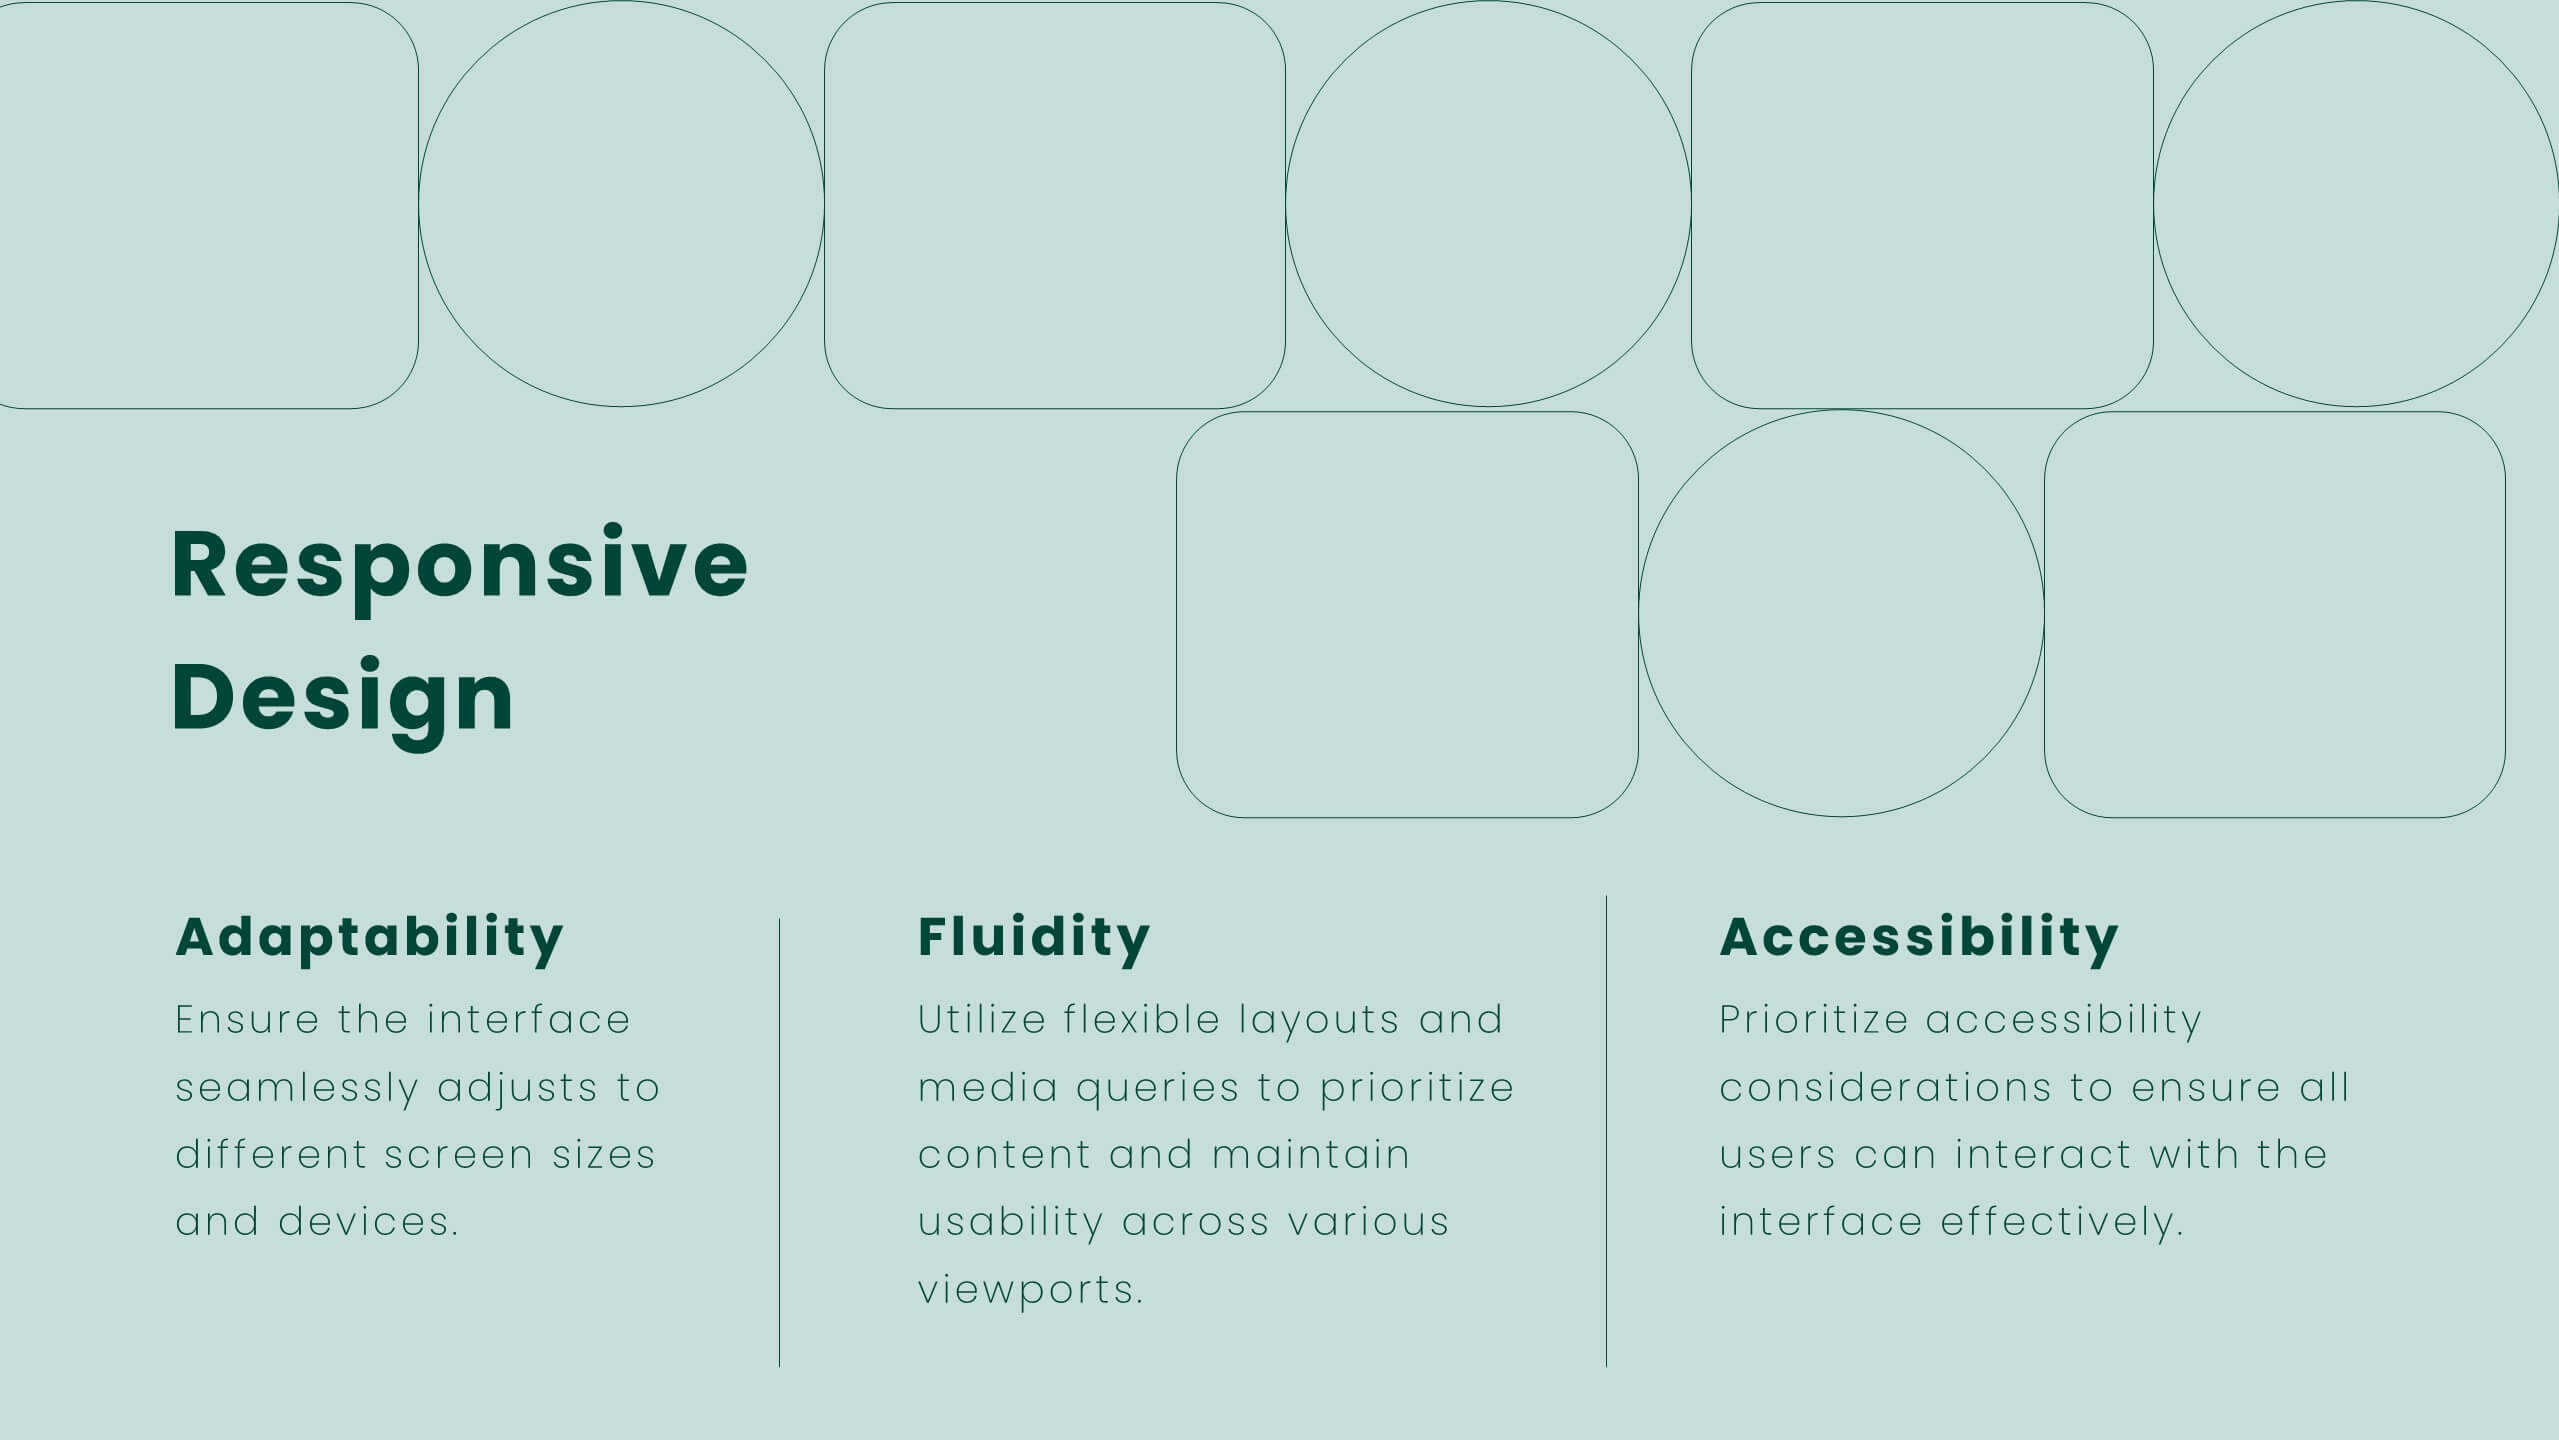
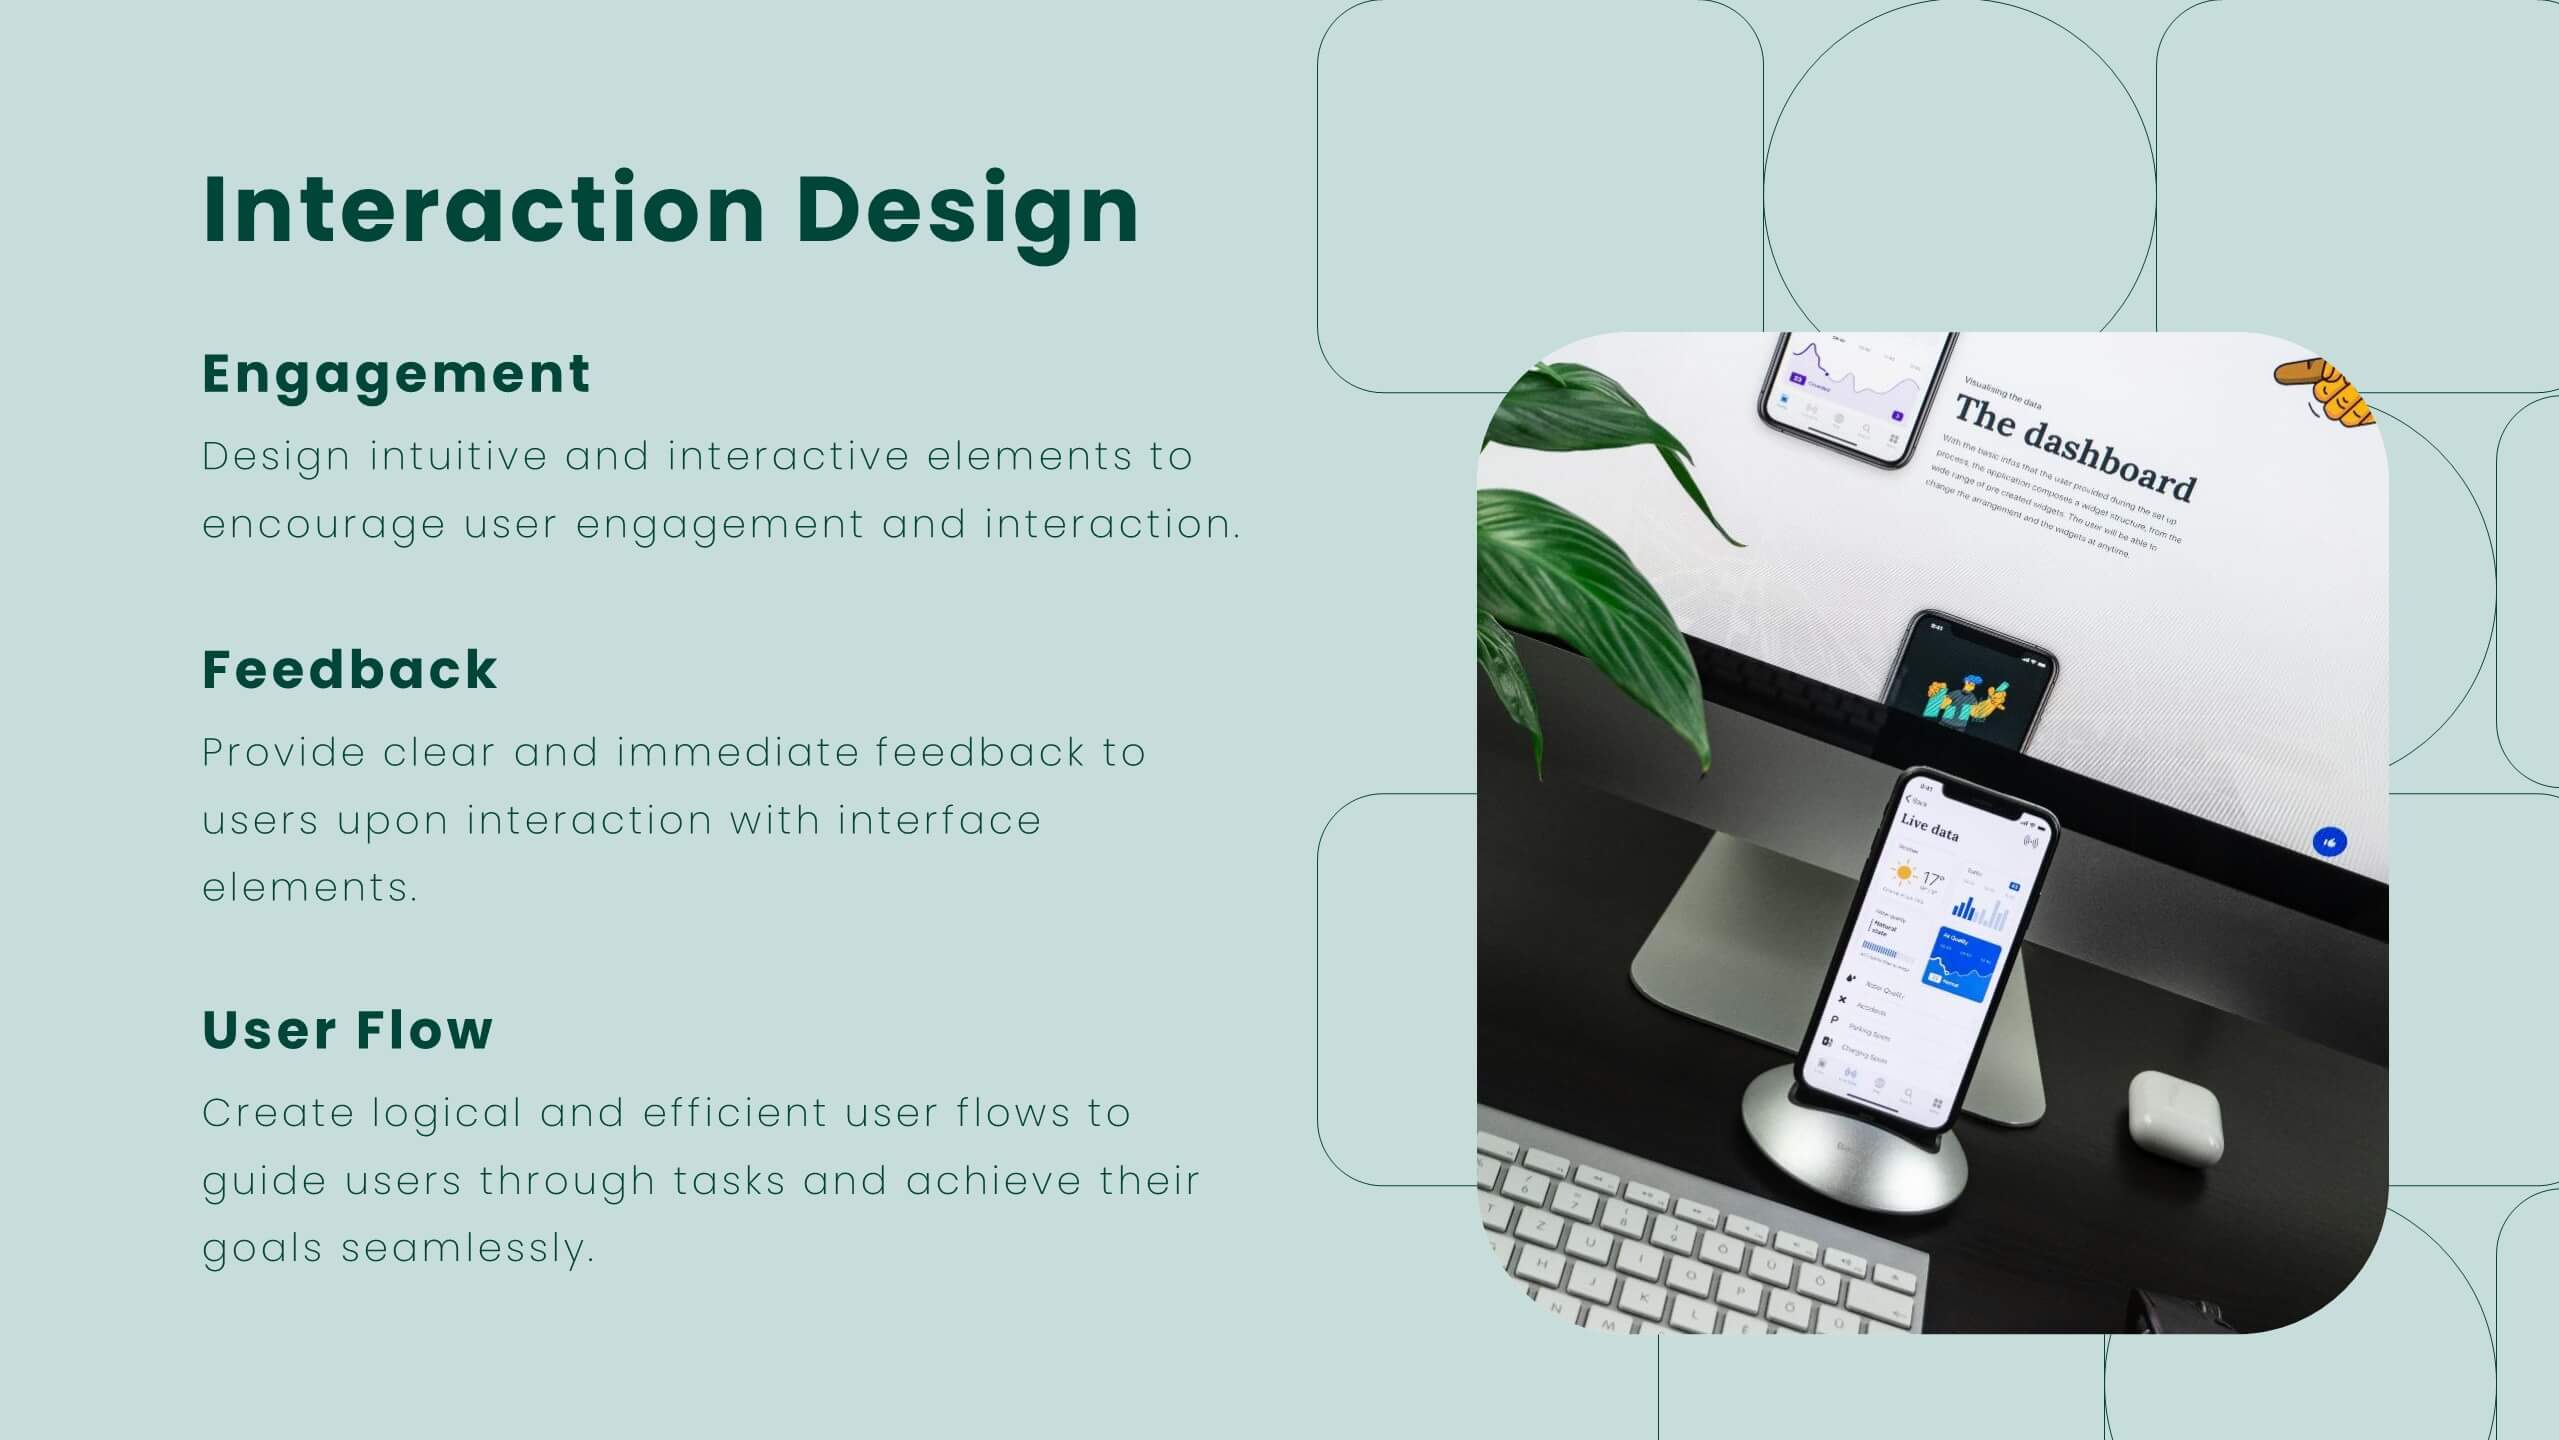
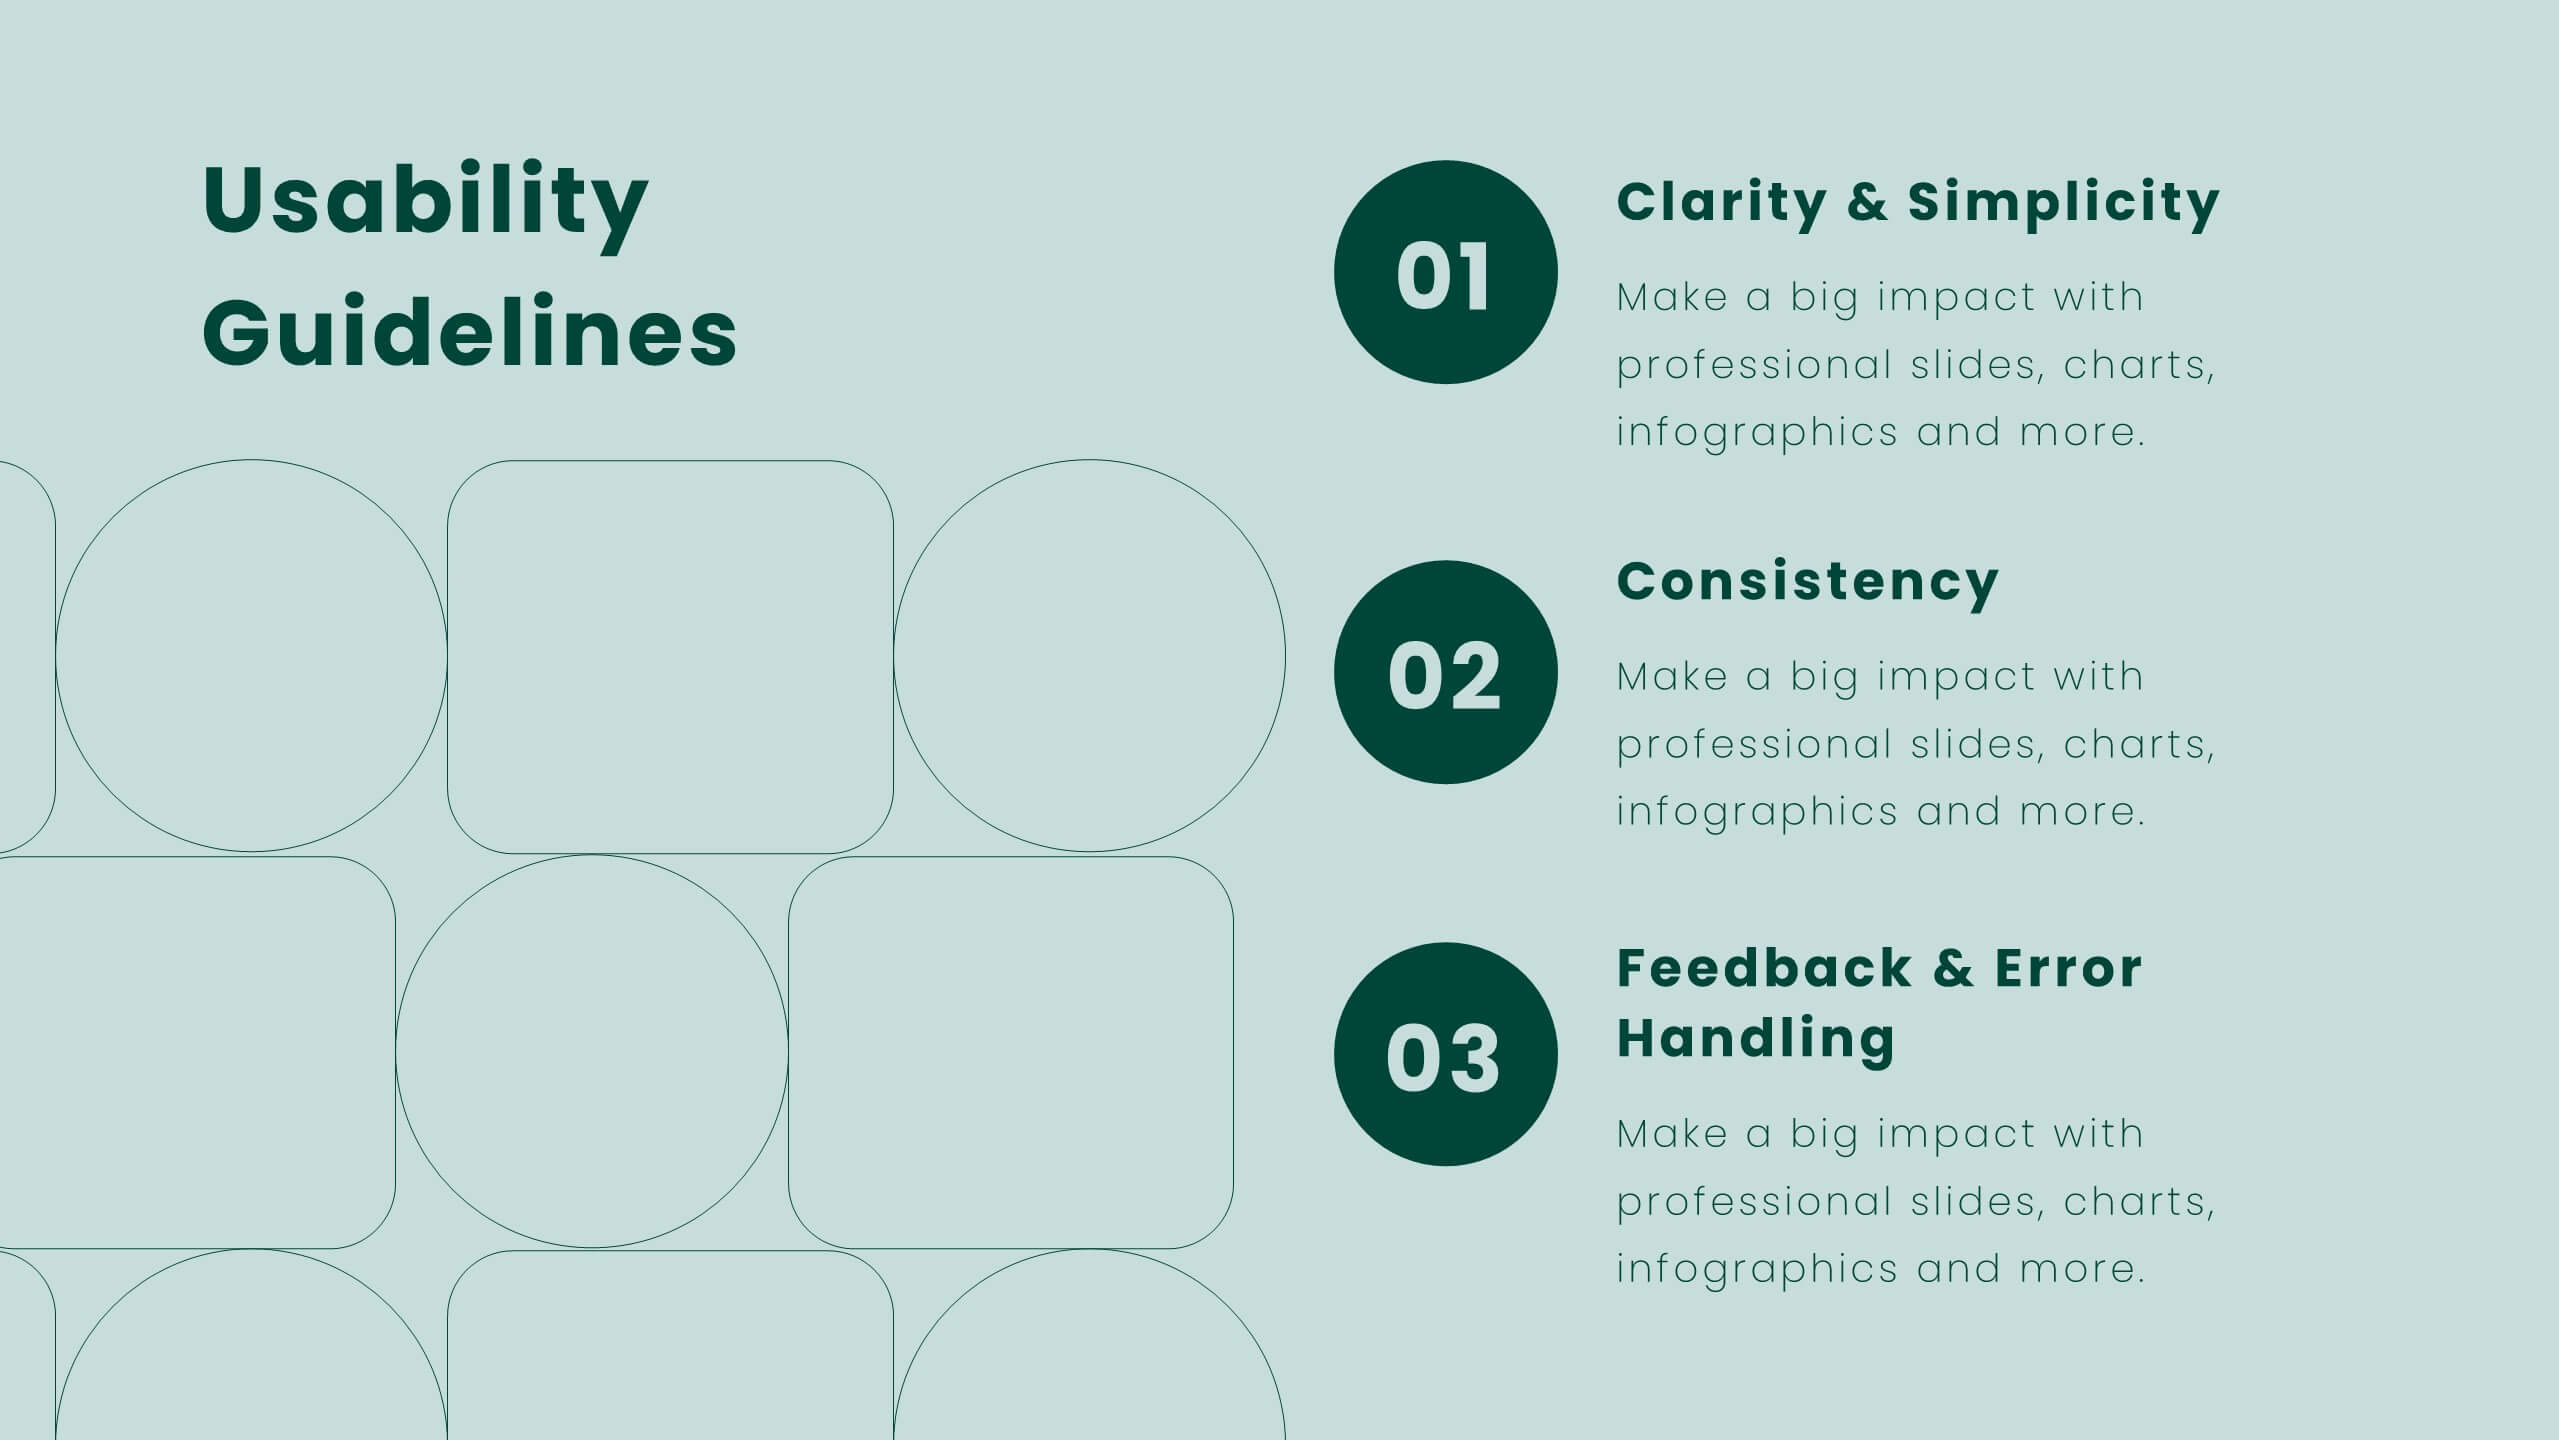
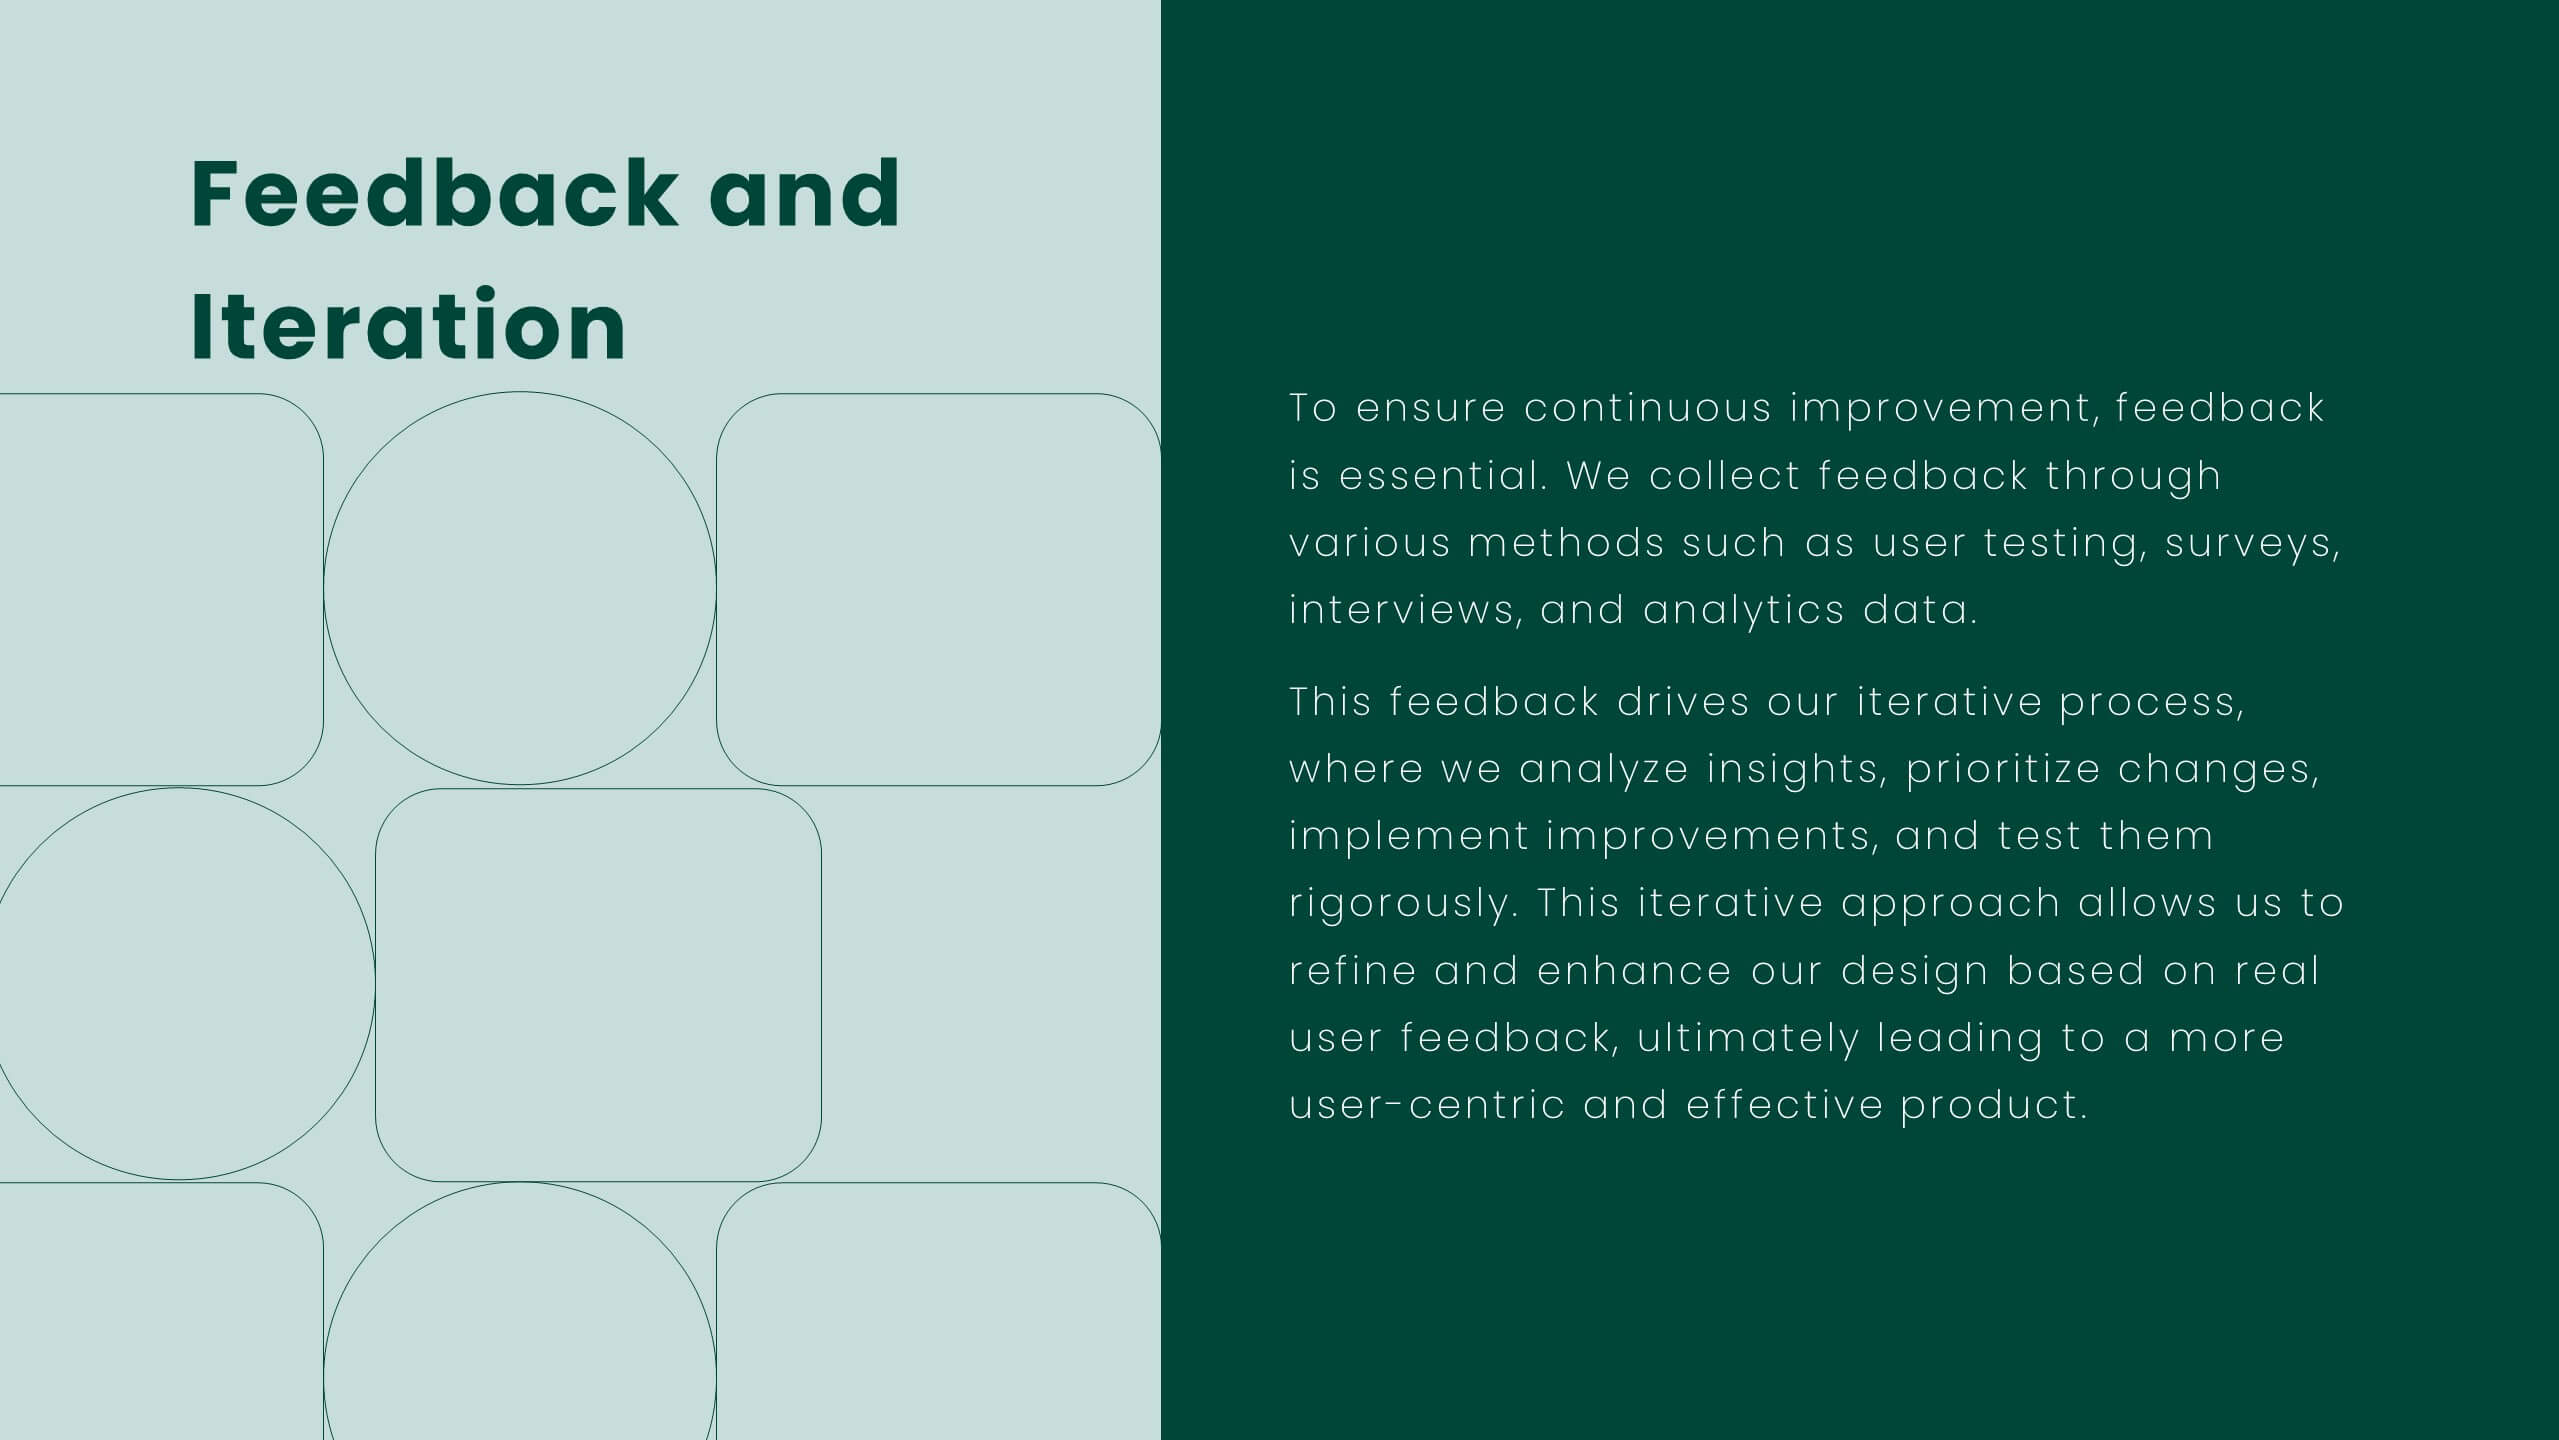
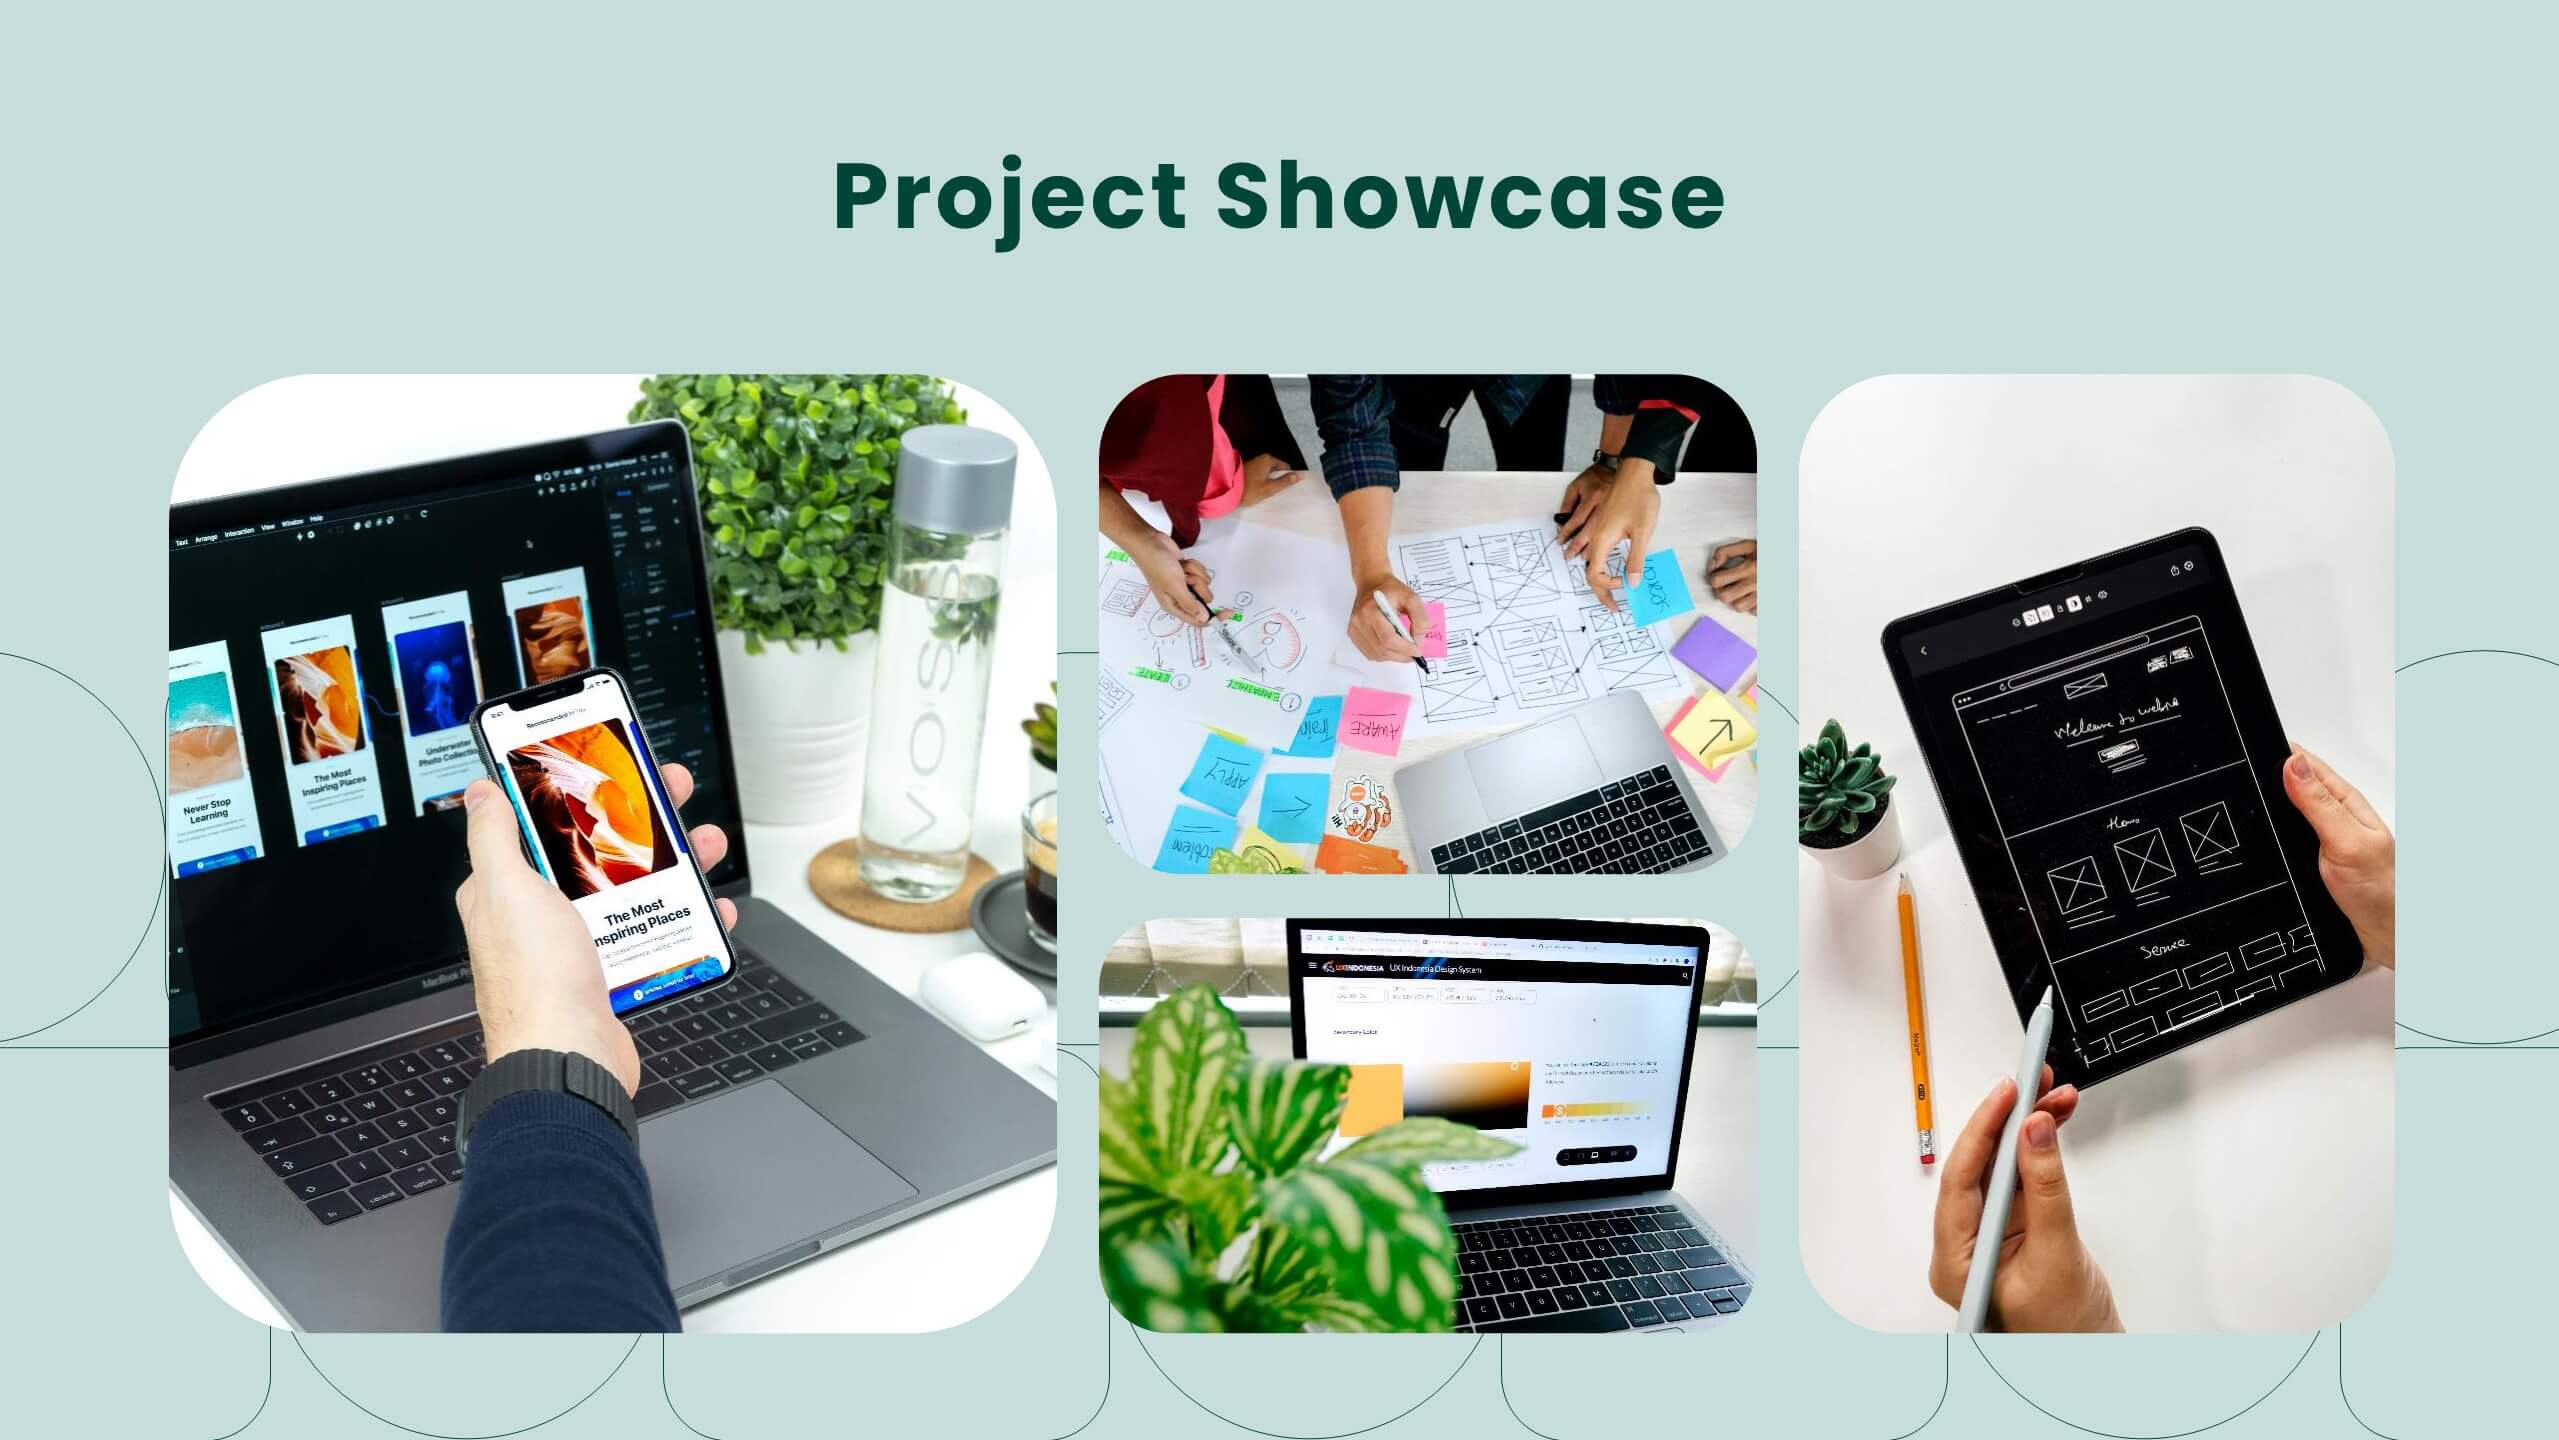
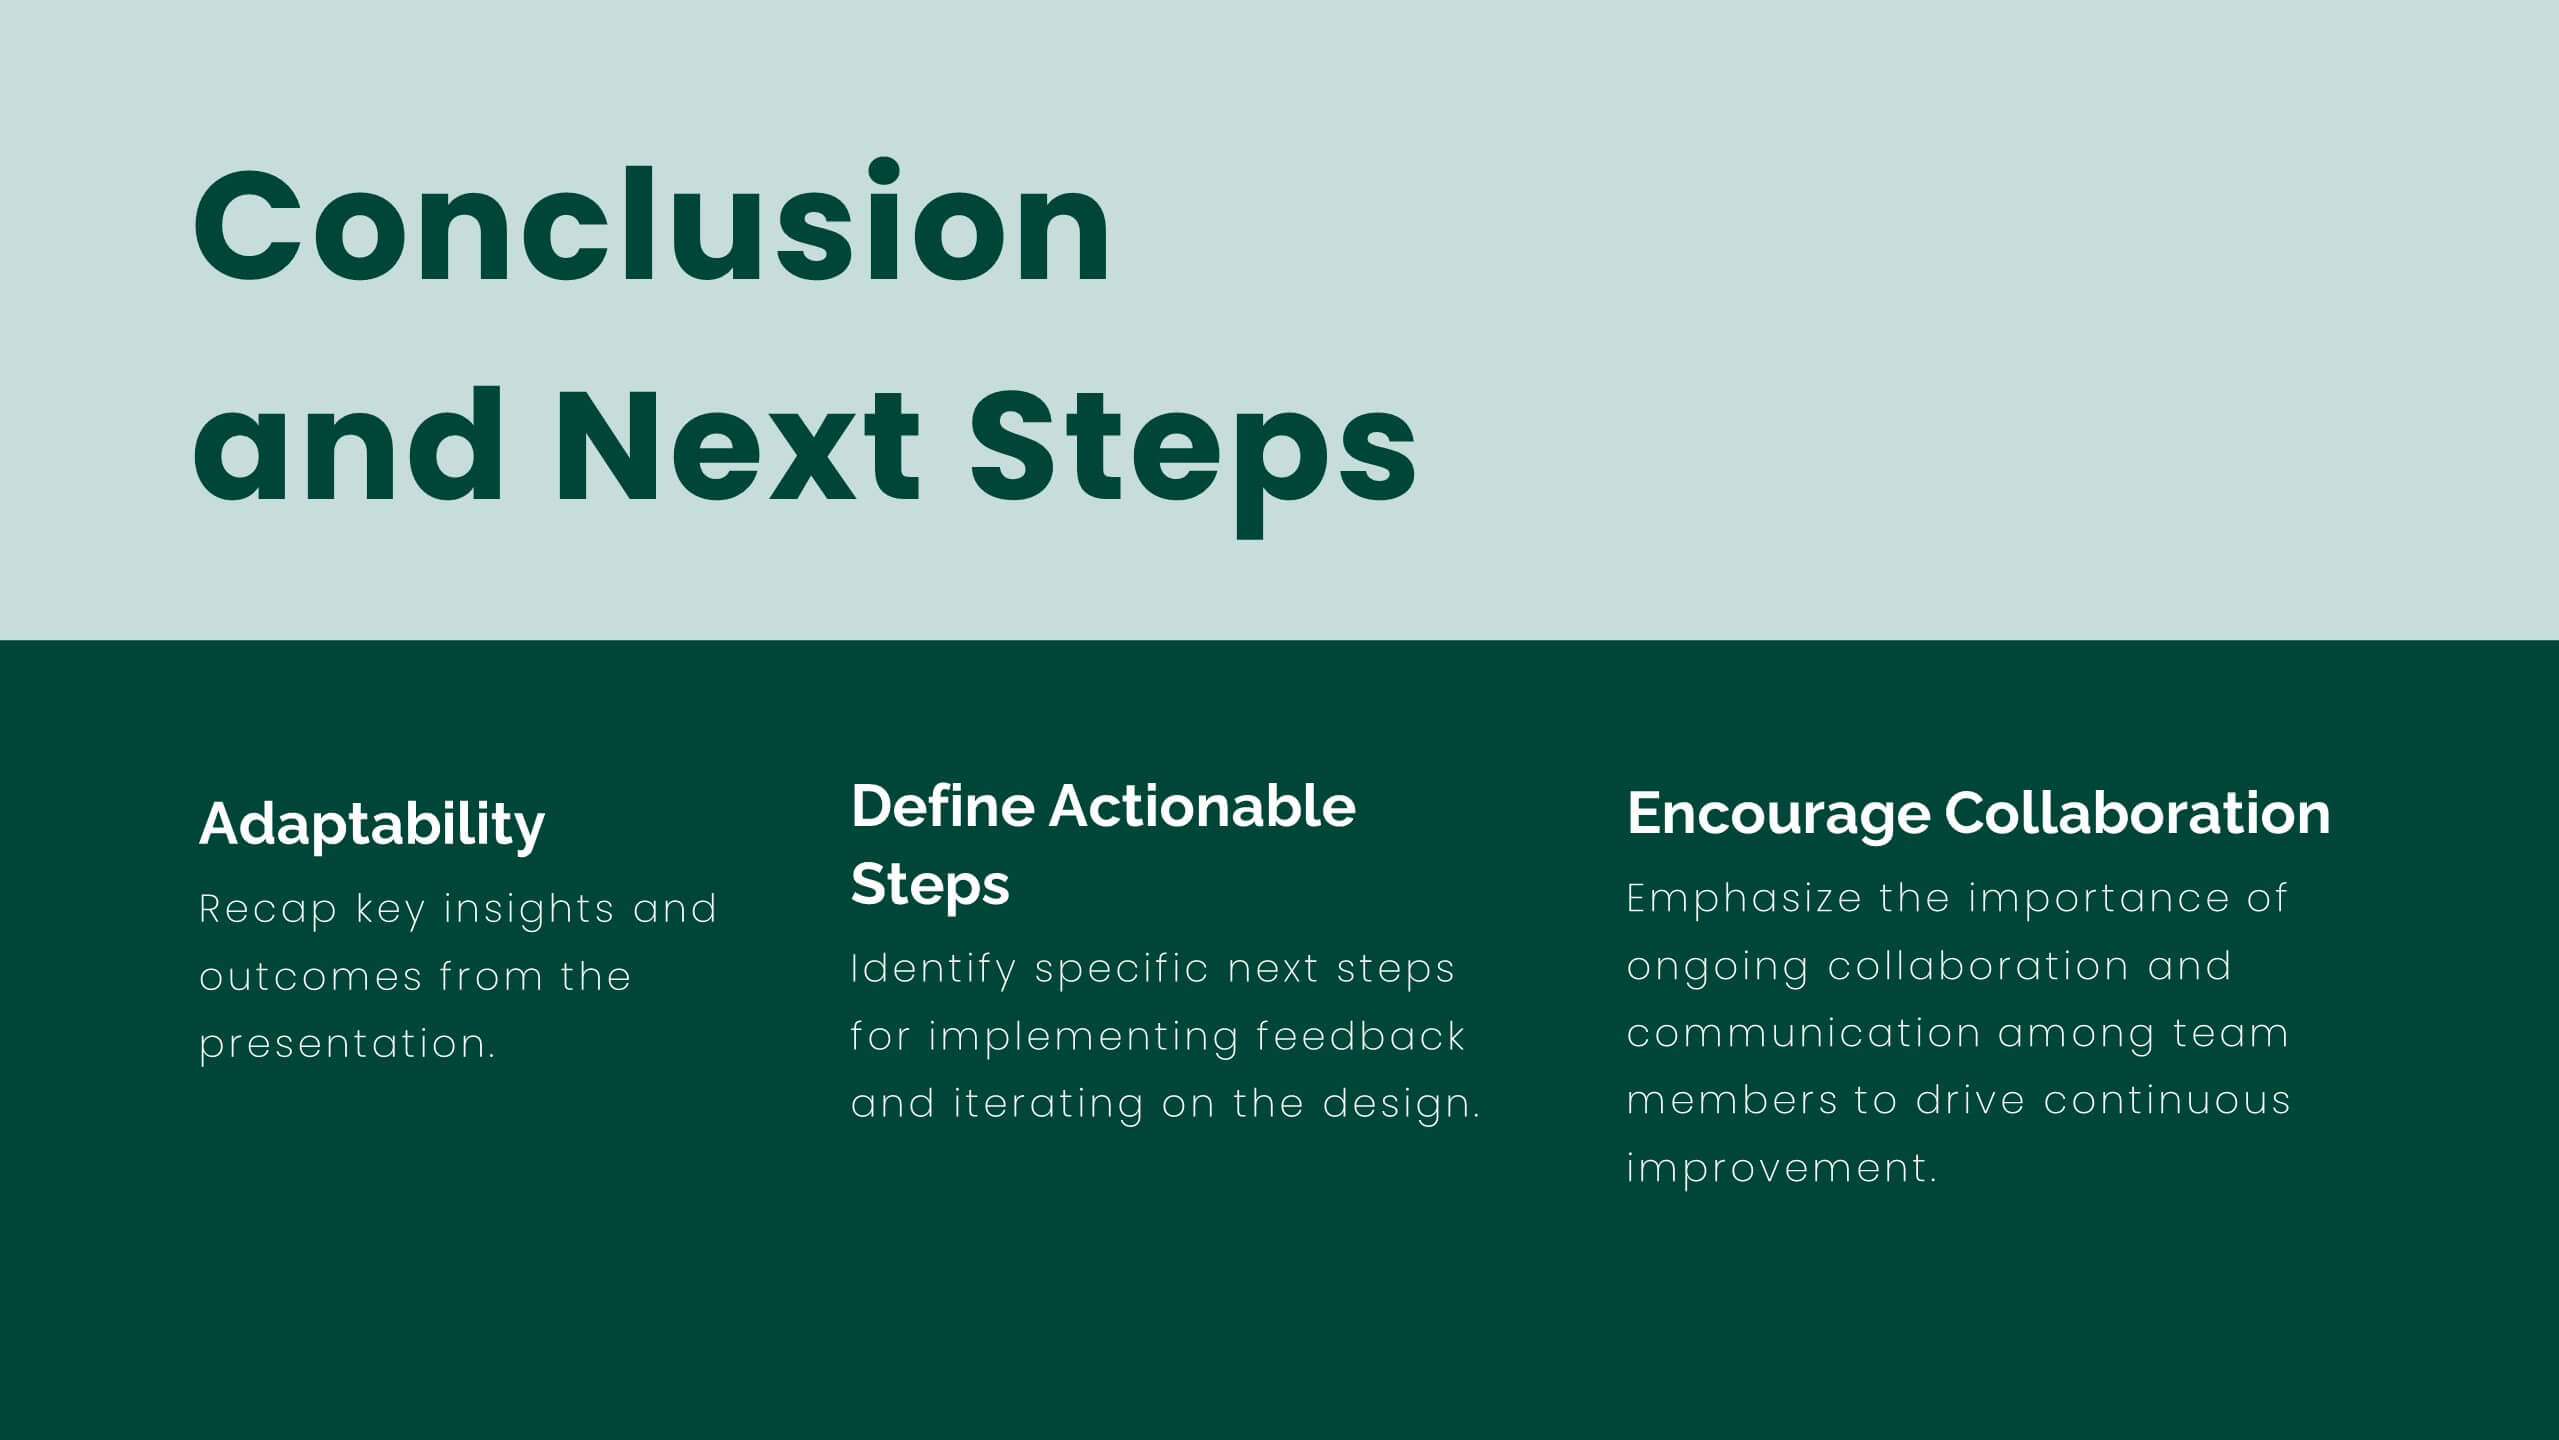
Lumina UX Case Study Presentation
Create compelling UX case studies with this modern template. Cover user research, personas, wireframes, and prototyping. Perfect for showcasing UI design principles, responsive design, and usability guidelines. Highlight feedback, iteration, and project showcase. Compatible with PowerPoint, Keynote, and Google Slides. Elevate your UX presentations and impress stakeholders with clear, detailed insights.


26 diapositivas
Transportation and Logistics Company Profile Presentation
Delve into the fast-paced realm of Transportation and Logistics, the backbone of global commerce. Our vibrant template captures this essence with a lively mix of yellow, blue, orange, and purple. Precision-crafted, it comes alive with industry-specific graphics, adaptable icons, and purpose-built image placeholders. Seamless compatibility ensures smooth sailing whether you're on Powerpoint, Keynote, or Google Slides. Tailored for businesses, it's the go-to choice for presenting company profiles within the transportation sector. Don't just inform; captivate and inspire your audience. Elevate your presentation game today!


5 diapositivas
Level-Based Authority Chart Presentation
Display organizational hierarchy with clarity using this level-based authority chart. The pyramid layout highlights reporting tiers, perfect for showcasing leadership roles, department levels, or team structures. Fully customizable in Canva, PowerPoint, or Google Slides—ideal for managers, HR professionals, and business consultants looking to present structured authority in a clean format.


5 diapositivas
Strategic Planning Canvas for Growth
Build a clear roadmap to success with the Strategic Planning Canvas for Growth Presentation. This slide uses a curved timeline layout to showcase five progressive steps, ideal for outlining growth phases, initiatives, or planning milestones. Each stage is paired with a modern icon and text area for key insights. Fully editable in PowerPoint, Keynote, and Google Slides.


6 diapositivas
Demographic and Psychographic Segmentation Presentation
Bring your audience insights to life with a clear, data-driven design that highlights who your customers are and what drives their decisions. This presentation helps you analyze audiences by lifestyle, behavior, and demographics. Fully customizable and compatible with PowerPoint, Keynote, and Google Slides for effortless professional presentations.


5 diapositivas
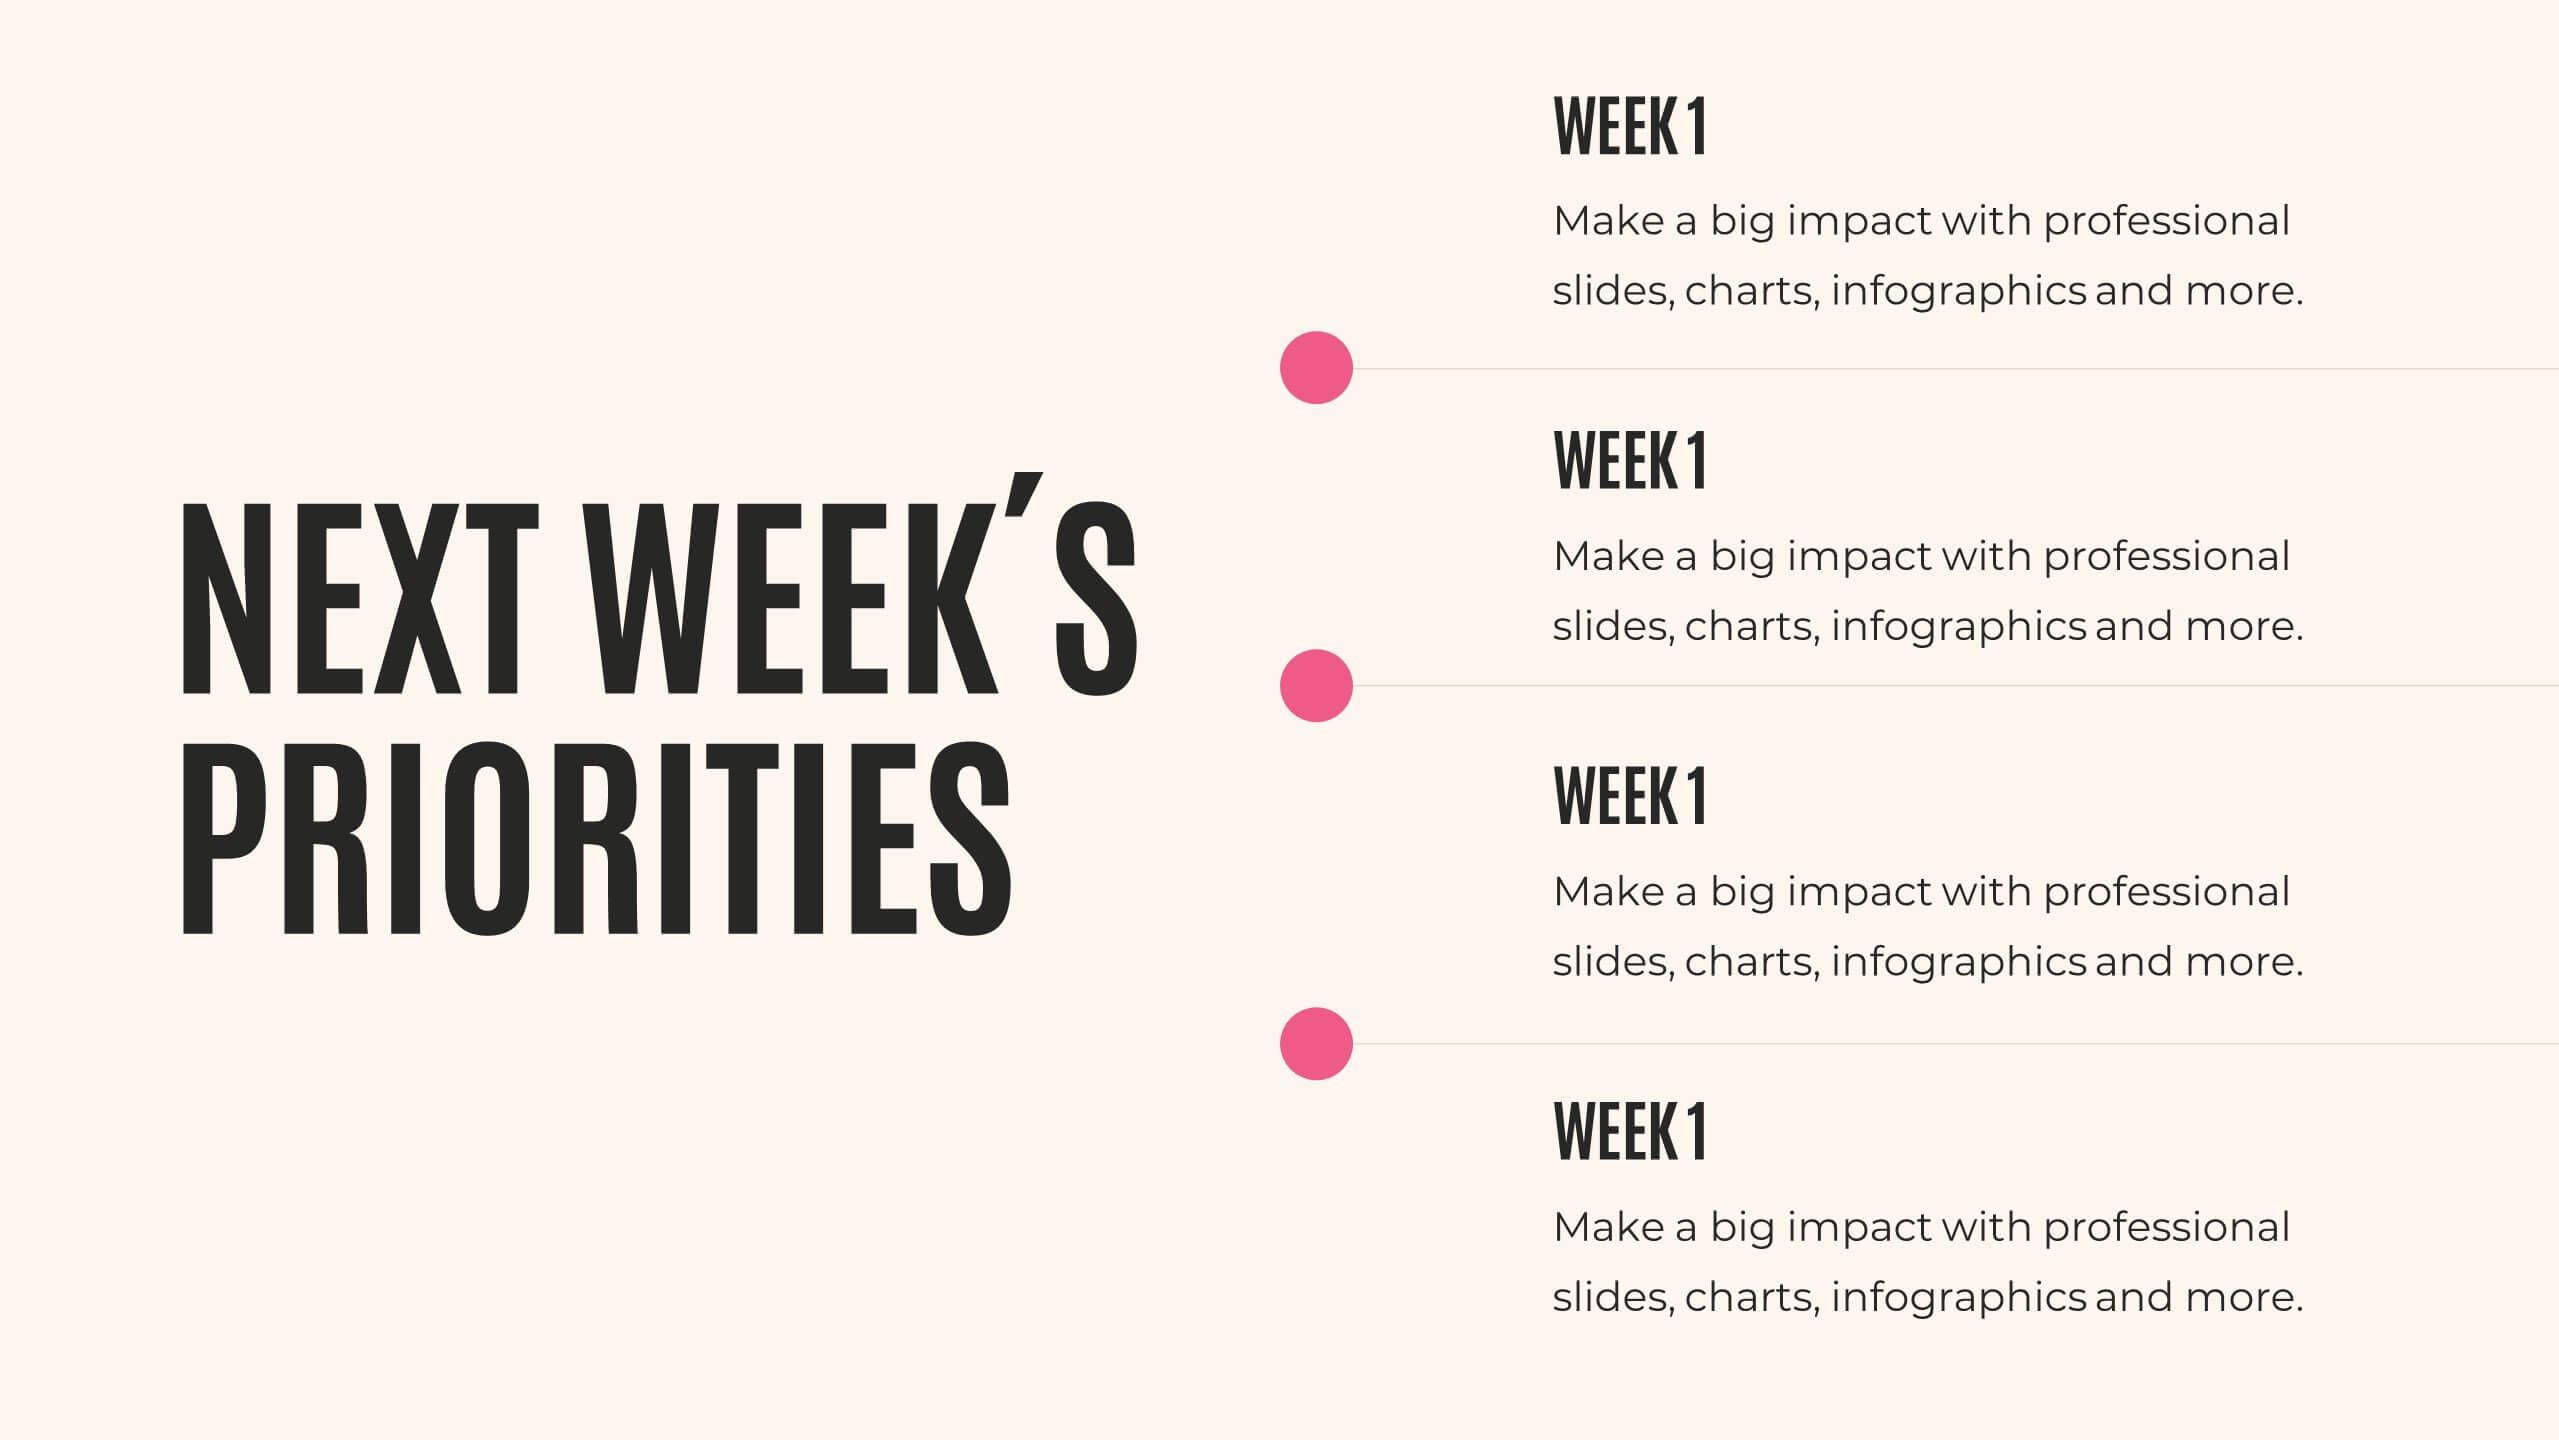
Linear Business Process Flowchart Presentation
Visualize sequential processes with this clean linear flowchart layout. Ideal for workflows, decision-making steps, or procedural overviews. Featuring directional connectors and labeled shapes, this design keeps your message structured and easy to follow. Fully editable in PowerPoint, Keynote, or Google Slides—perfect for business processes, planning, and operations presentations.


6 diapositivas
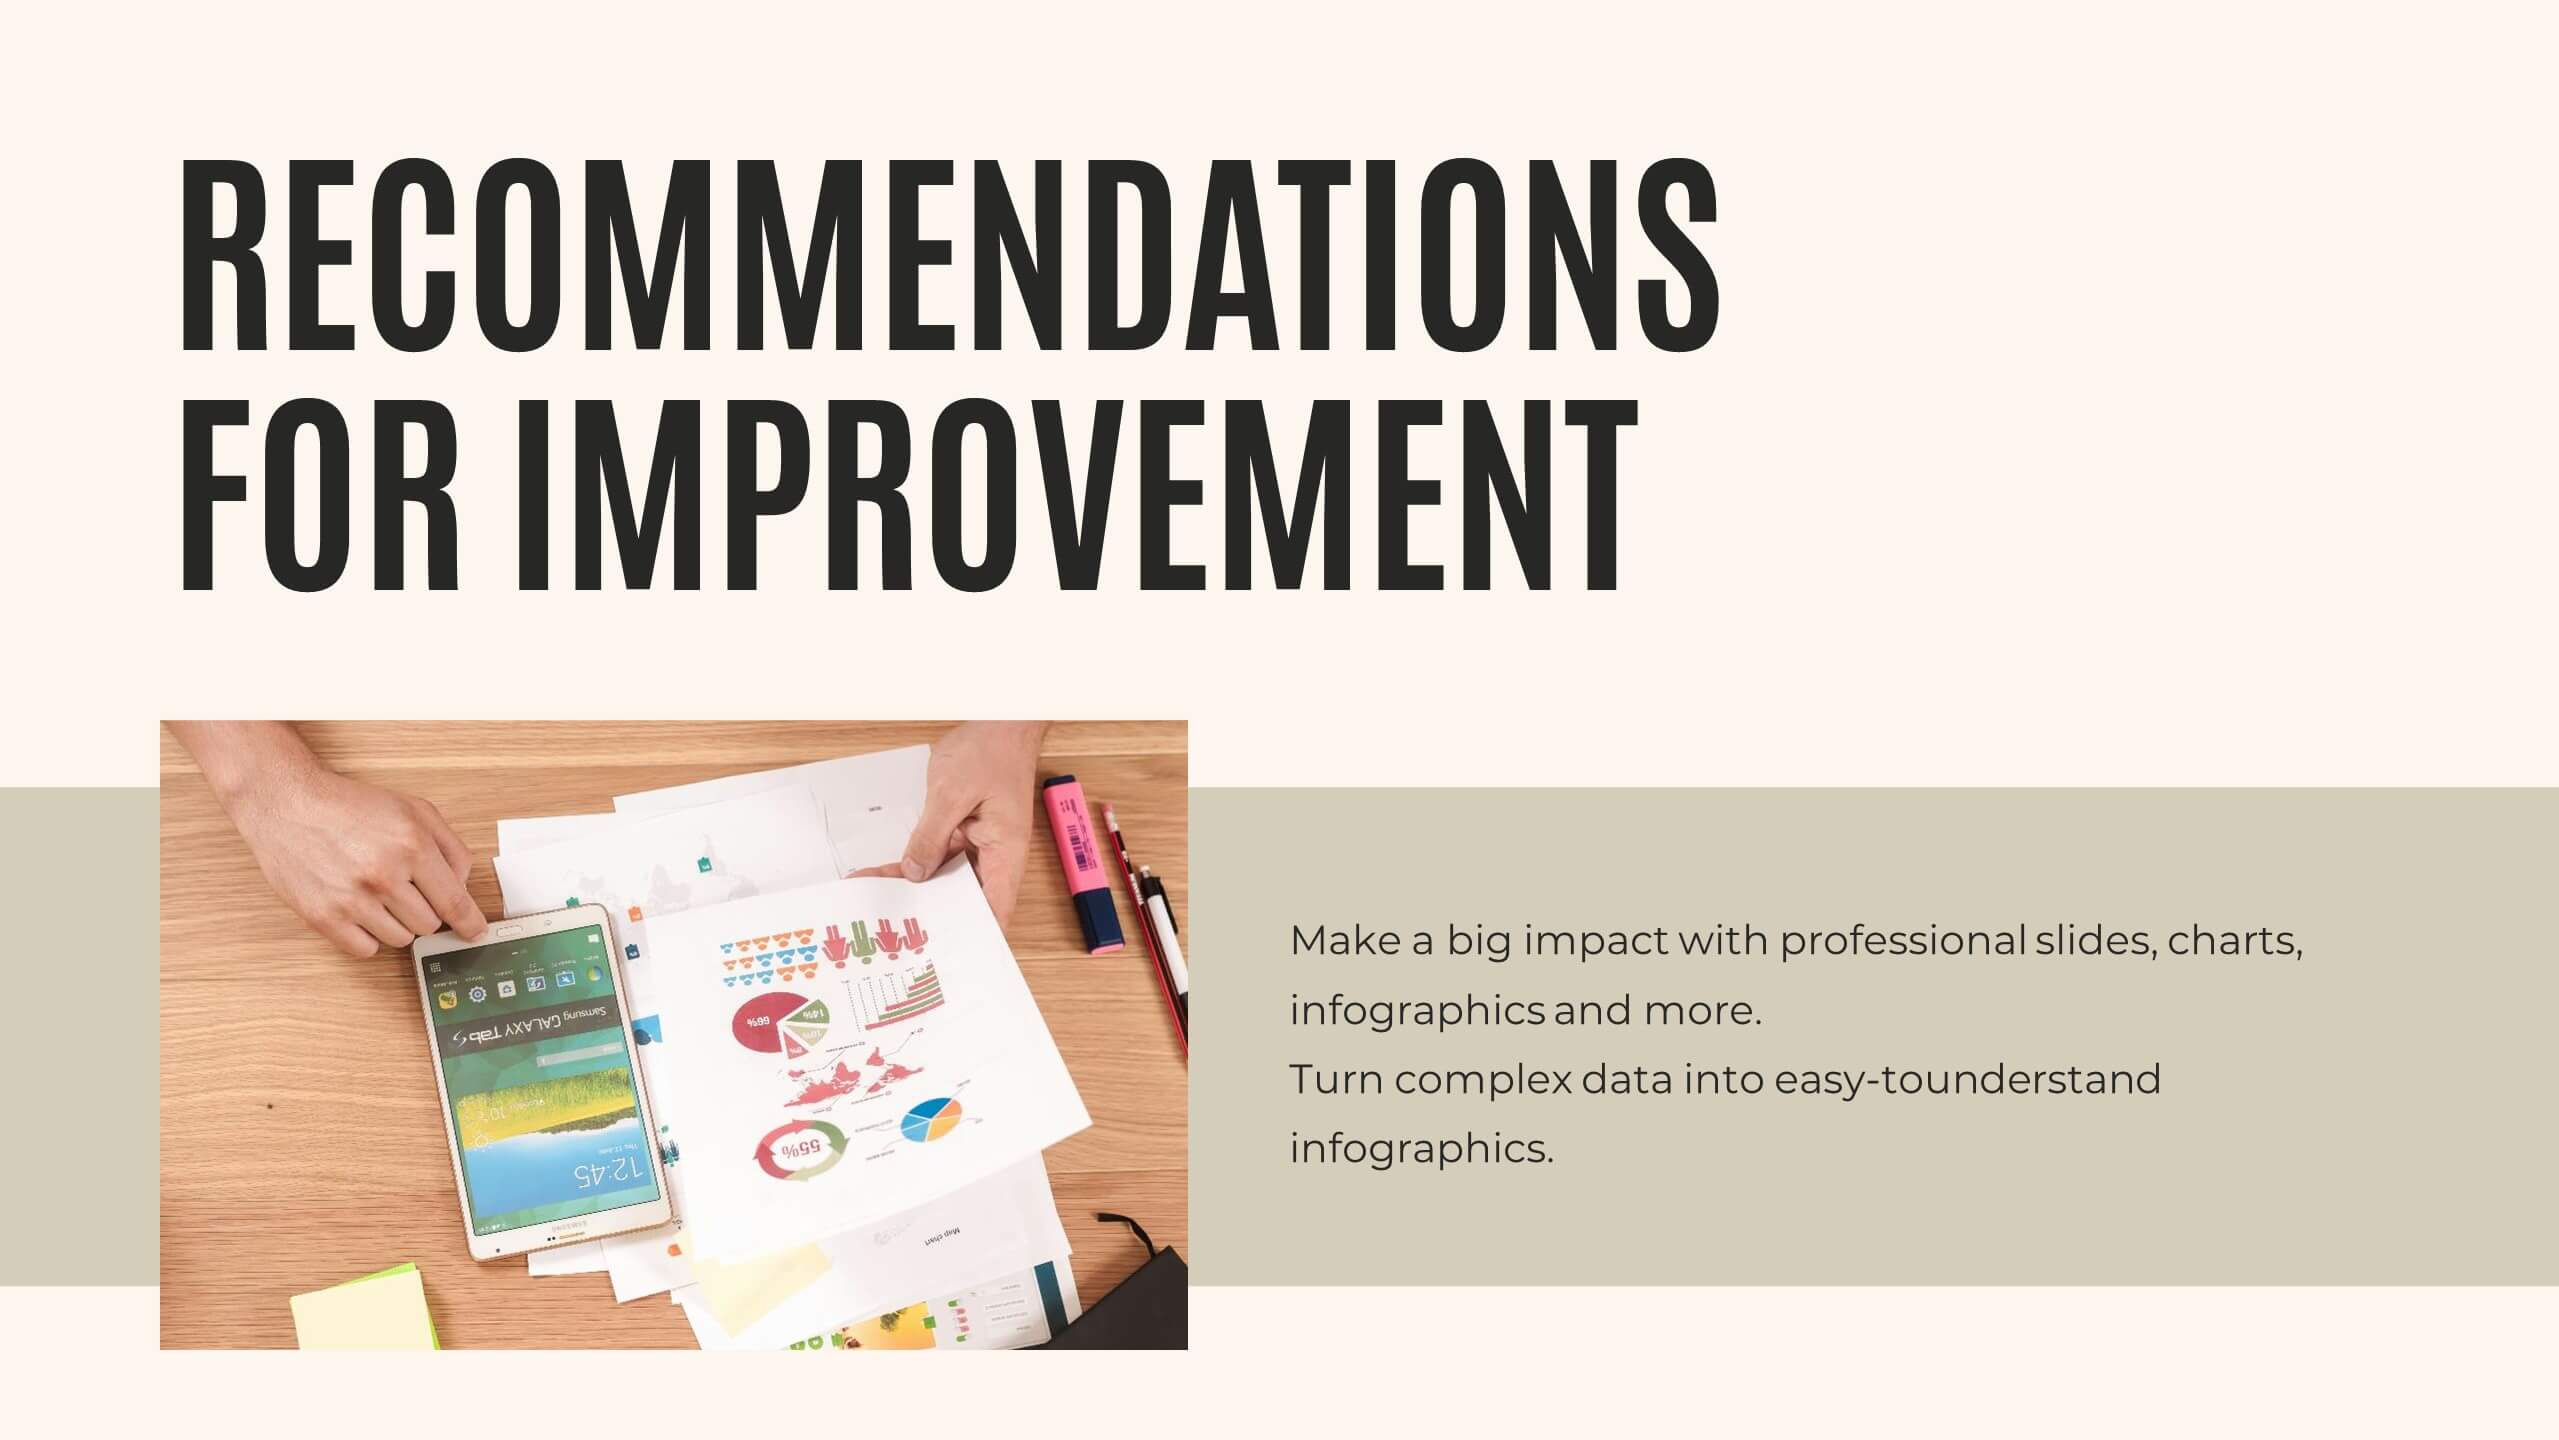
Product and Service Options Presentation
Showcase your offerings with the Product and Service Options Presentation template. This structured design highlights key features, benefits, and differentiators, making it ideal for business proposals, service breakdowns, and marketing strategies. Fully customizable for PowerPoint, Keynote, and Google Slides, ensuring seamless integration into your presentation.


6 diapositivas
Big Data Technology Infographic
Big Data technology refers to the tools, techniques, and frameworks used to capture, store, process, analyze, and visualize large and complex datasets that are beyond the capabilities of traditional data processing systems. This infographic template is perfect for organizations that deal with massive volumes of data from various sources, including social media, sensors, machines, and more. This template enables businesses to gain valuable insights, make informed decisions, and create new opportunities. This infographic can be used for various industries, including e-commerce, healthcare, finance, manufacturing, and more.


6 diapositivas
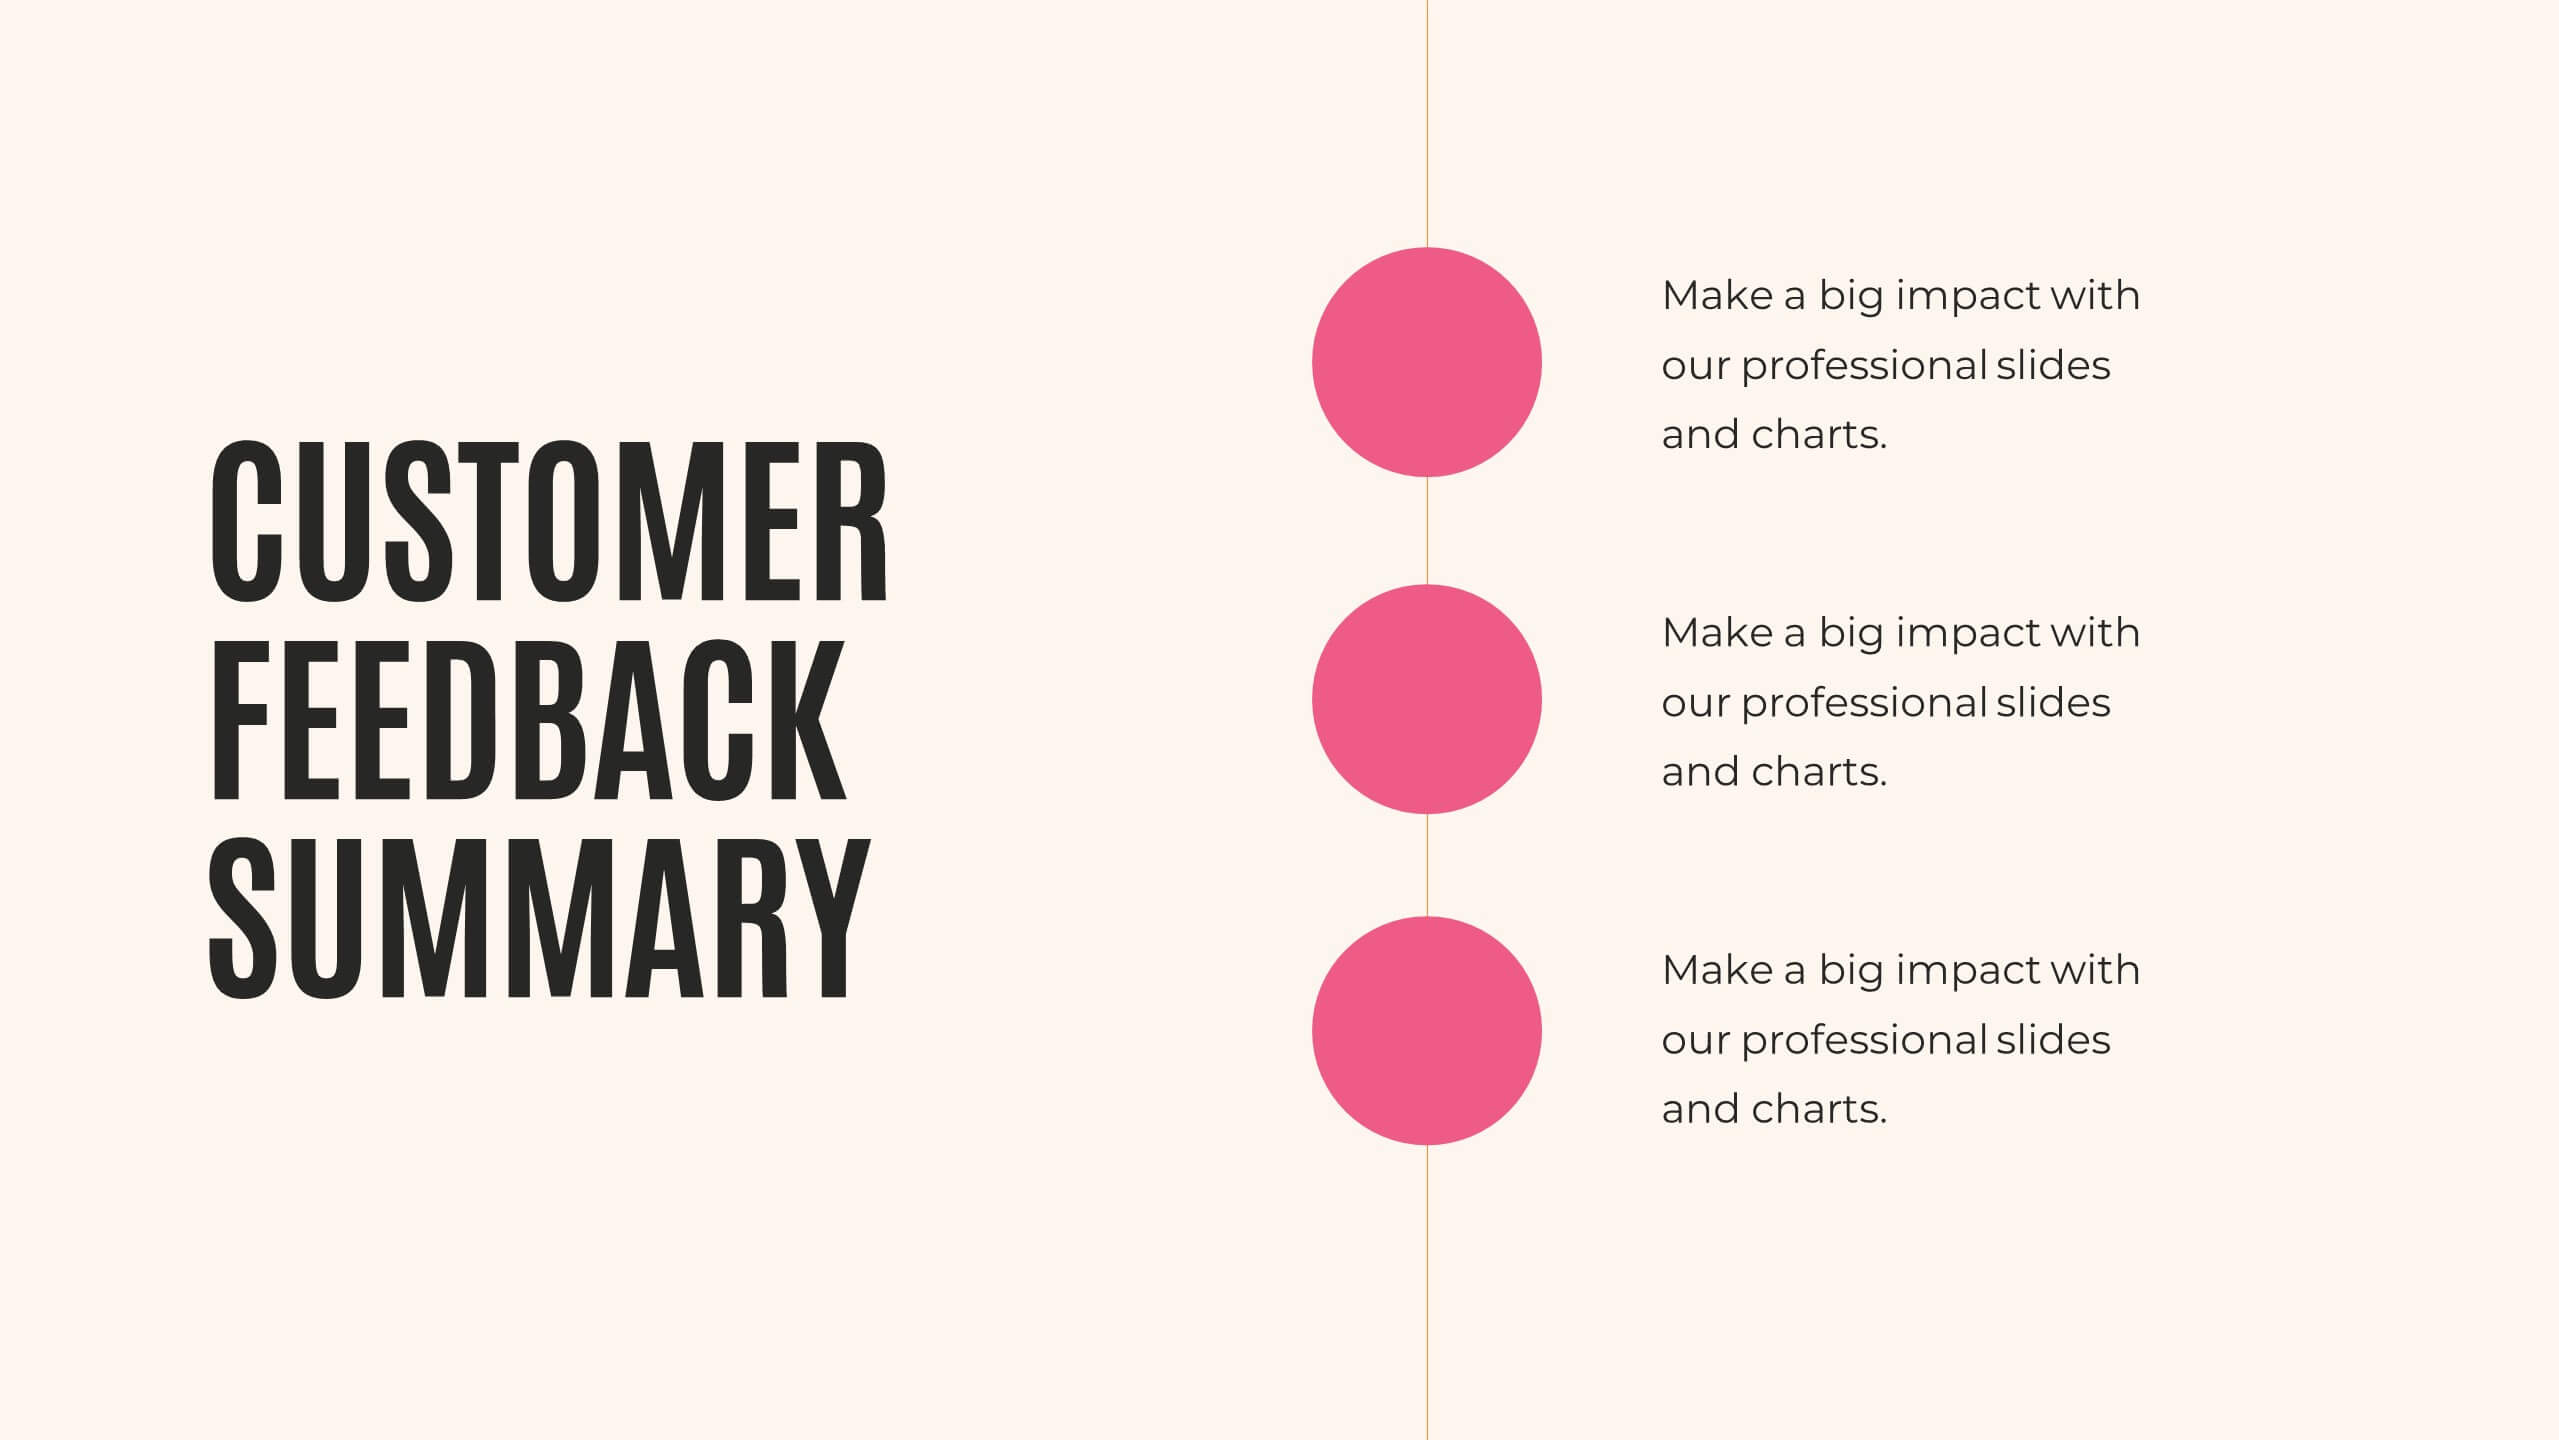
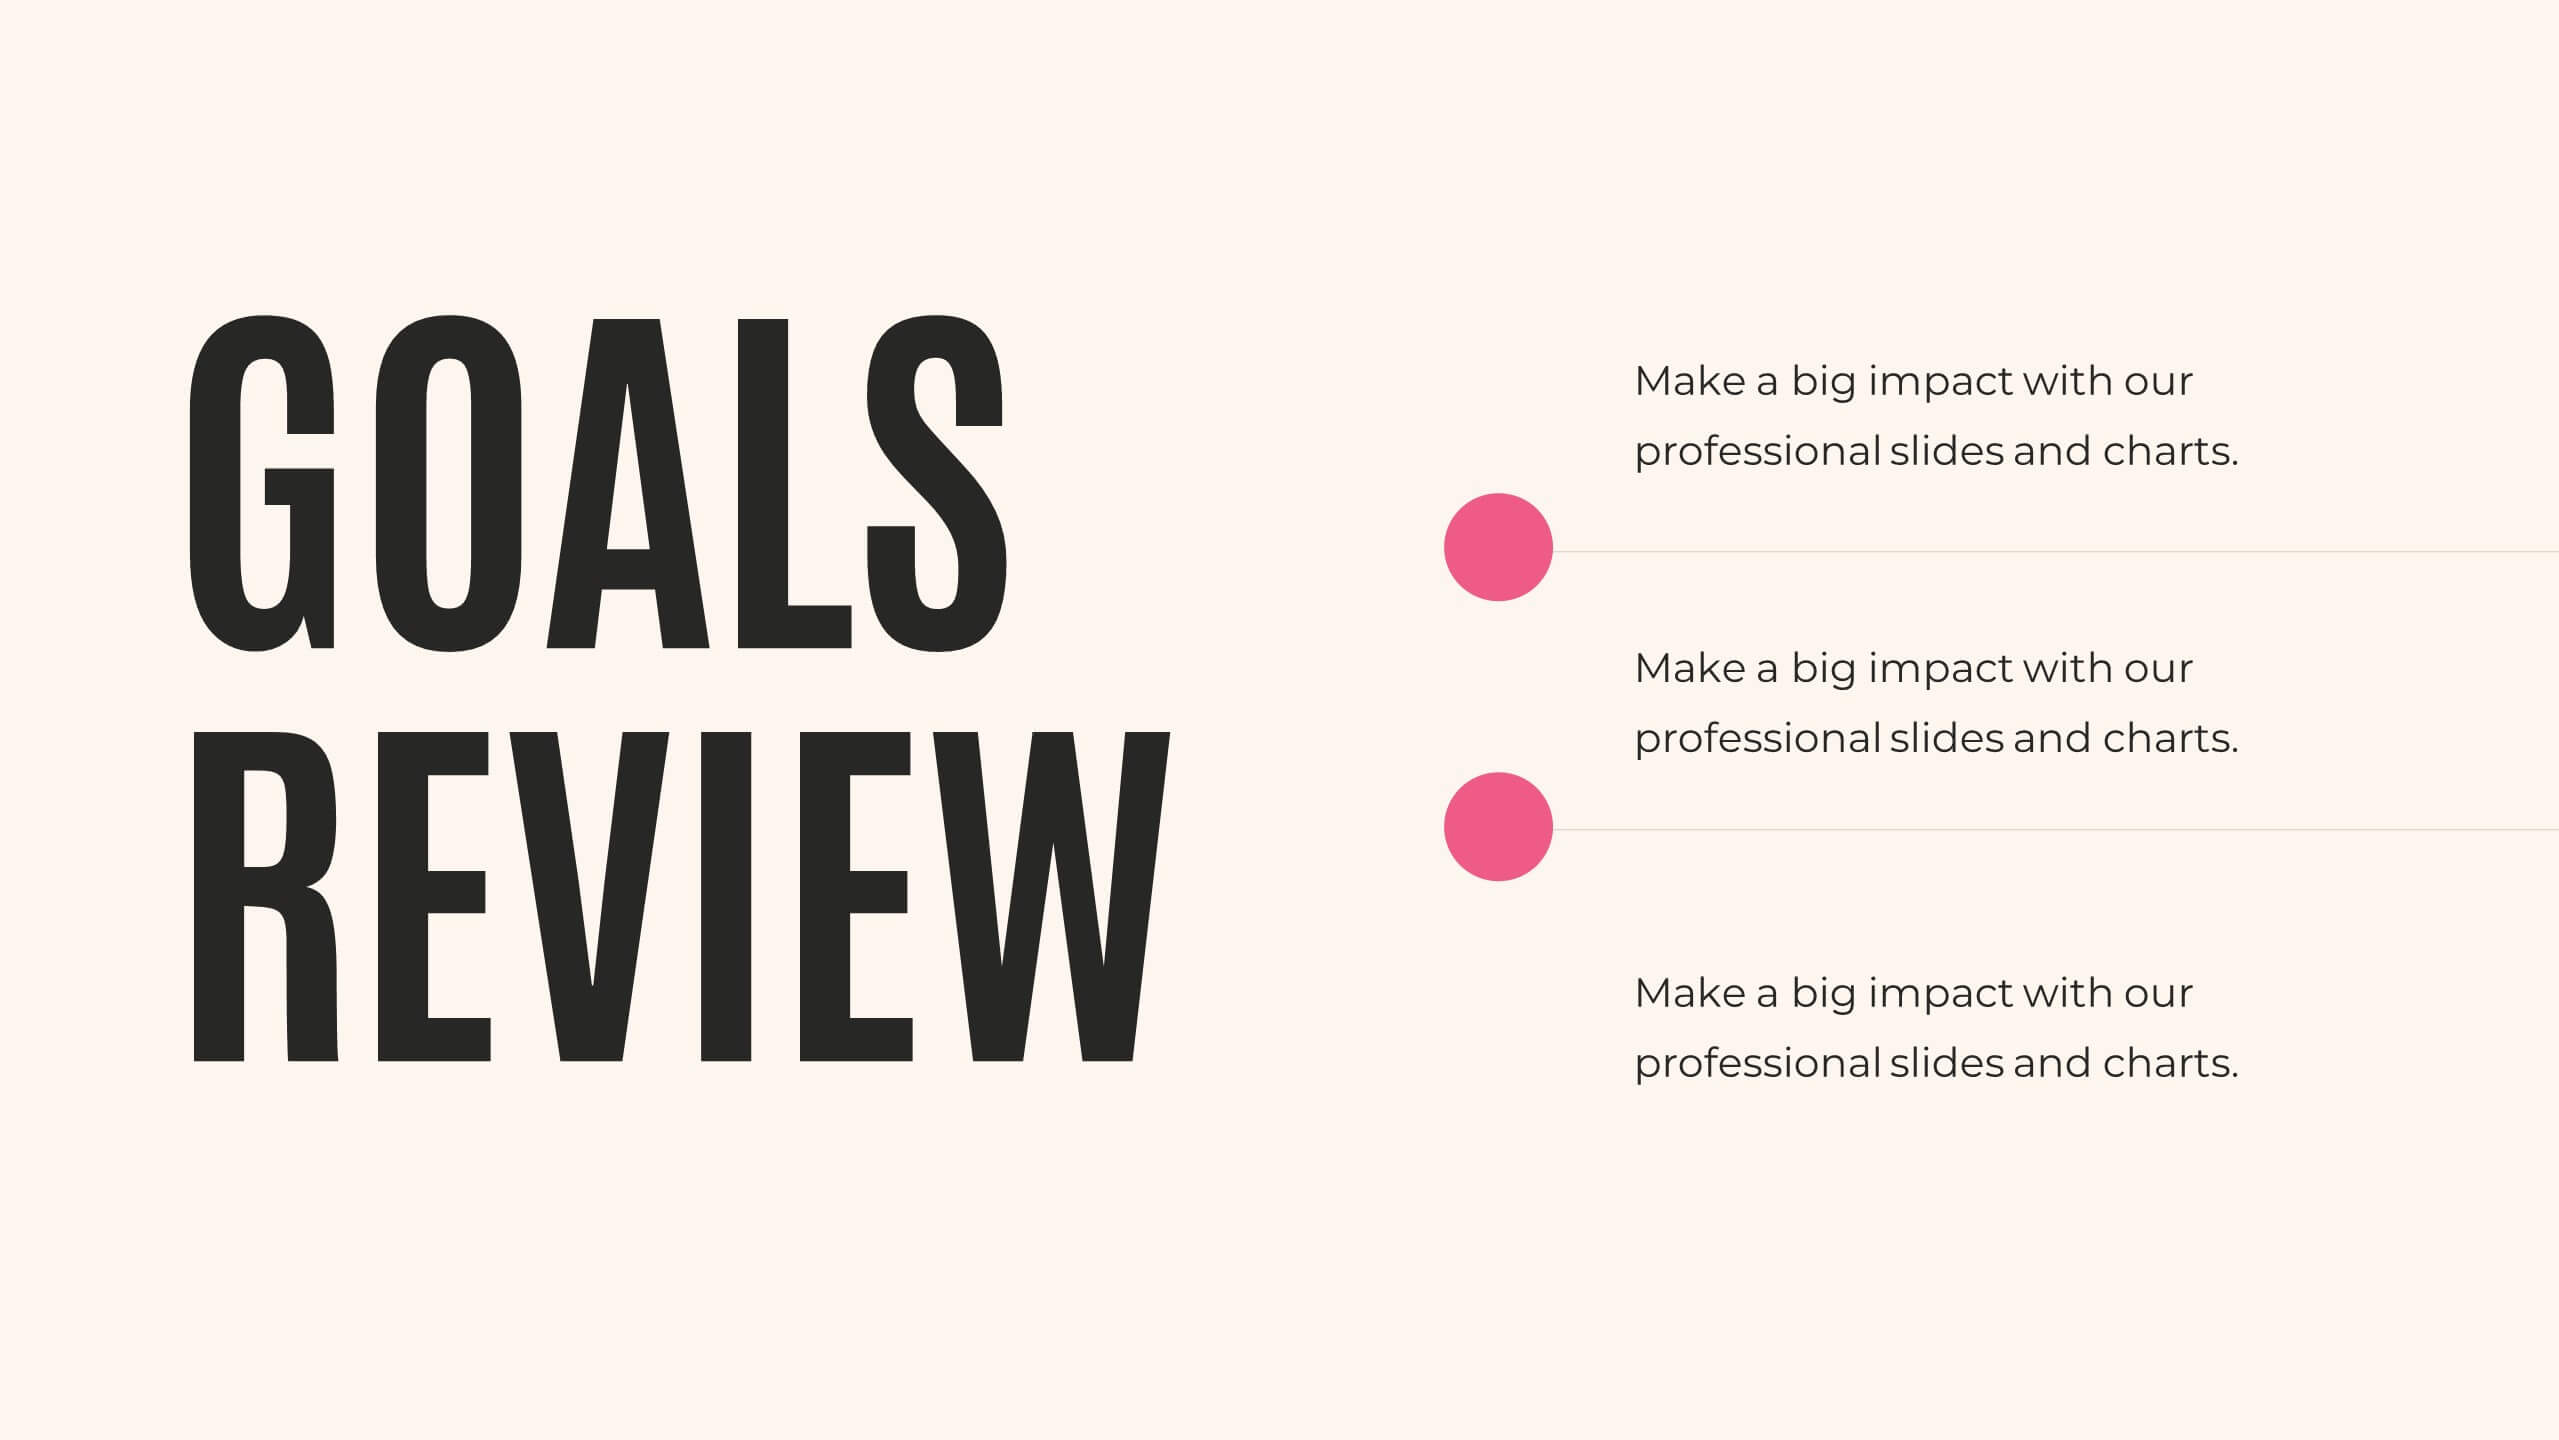
Mission Goals Infographic
These professionally designed slide templates are tailored to help you articulate your organization's mission goals with clarity and impact. Each slide is structured to emphasize the strategic objectives that guide your operations, making them ideal for communicating with stakeholders, teams, and external partners. Featuring a variety of layouts that include real-life imagery and concise text areas, these templates not only convey your goals but also illustrate the values that underpin your mission. They are perfect for enhancing corporate presentations, annual meetings, or internal strategy discussions, providing a visual and textual guide to what drives your organization forward. Customizable for various communication needs, these templates can be adapted to highlight specific mission goals or to align with different thematic elements of your presentations. They are an essential tool for organizations aiming to foster a unified understanding of their mission and to inspire alignment and action among all stakeholders.


6 diapositivas
App Design Mockup
Showcase your app UI in a bold, creative way with this vibrant slide layout. Featuring dynamic smartphone mockups and modern graphic accents, it's ideal for app demos, portfolio highlights, or feature walkthroughs. Fully editable in PowerPoint, Keynote, and Google Slides—customize fonts, colors, and layouts to suit your brand.


7 diapositivas
Digital KPI Dashboard Infographic
A KPI Dashboard is a visual representation of the most important performance metrics or KPIs that track the progress of an organization or business activities. This infographic template is designed to showcase the KPIs and metrics that are crucial for evaluating the success of digital marketing efforts. This template provides an overview of various digital marketing KPIs in an easy-to-understand format. The template utilizes eye-catching charts, graphs, and diagrams to present digital marketing data in a visually appealing way. Bar graphs, line charts, pie charts, and other visual elements make it easy to grasp the performance trends at a glance.


4 diapositivas
Culinary Business Branding Deck Presentation
Visualize your culinary identity with the Culinary Business Branding Deck Presentation. Designed with a segmented chef hat illustration, this slide helps you showcase four brand pillars—perfect for restaurants, food startups, and culinary consultants. Use it to highlight your cuisine focus, customer experience, service style, and ambiance. Fully editable in PowerPoint, Keynote, Google Slides, and Canva.


7 diapositivas
Inversion Table Infographic
A table infographic is a visual representation of data or information presented in a tabular format, using a combination of text, numbers, and visual elements to make the information more engaging and easily understandable. This infographic template is great for comparing two or more variables and is a powerful way to convey your data. This infographic is designed to show your audience the key points of your data in a visually appealing way. This template is a good option if you want to present your information as an easy-to-read table with labels and numbers. The bright colors and fun design make it easy to see at a glance.