


Características


¿Tienes alguna pregunta?
Recomendar


6 diapositivas
Artificial Intelligence Stocks Infographics
Our "Artificial Intelligence Stocks" infographic template, ideal for PowerPoint, Keynote, and Google Slides, is tailored for financial analysts, investors, and tech enthusiasts. This template seamlessly blends technology and finance, focusing on AI stocks and investment trends. This futuristic design includes elements such as AI technology trends, stock market performance, and investment opportunities. It’s an invaluable tool for presenting complex financial and technological data in a clear and visually appealing manner. The template is perfect for conveying intricate investment strategies and market insights related to the burgeoning AI sector. The template features a cutting-edge design with a color scheme that blends shades of blue and gray, symbolizing innovation and financial growth. It’s designed to make your presentation not only informative but also visually engaging. Whether used in investor meetings, tech conferences, or educational seminars, this template ensures your insights on AI stocks are presented with clarity and sophistication.


12 diapositivas
Real Estate Business Proposal Presentation
Present your Real Estate Business Proposal with this structured and visually compelling template. Designed for real estate professionals, investors, and agencies, this slide helps communicate investment strategies, market opportunities, and property insights effectively. Fully customizable and compatible with PowerPoint, Keynote, and Google Slides for seamless editing.
8 diapositivas
Business Growth and Progress Tracking Presentation
Visualize success with this upward-arrow roadmap template designed to highlight four key stages of business development. Ideal for managers, analysts, and entrepreneurs, this slide uses milestone icons and clean, directional layout to emphasize progress. Fully editable in PowerPoint, Keynote, and Google Slides for seamless customization.


5 diapositivas
Investment Opportunity Business Case
Visualize the value behind your proposal with this key-themed layout, ideal for presenting compelling reasons to invest. Each section highlights a unique point, making it easy to walk stakeholders through critical benefits and insights. Fully editable and compatible with PowerPoint, Keynote, and Google Slides.


4 diapositivas
Products Comparison Table Presentation
Make your decision-making story instantly clear with a bold visual that balances options in a clean, modern way. This presentation helps you compare features, weigh benefits, and highlight key differences using simple graphics and intuitive labeling. Fully compatible with PowerPoint, Keynote, and Google Slides.

21 diapositivas
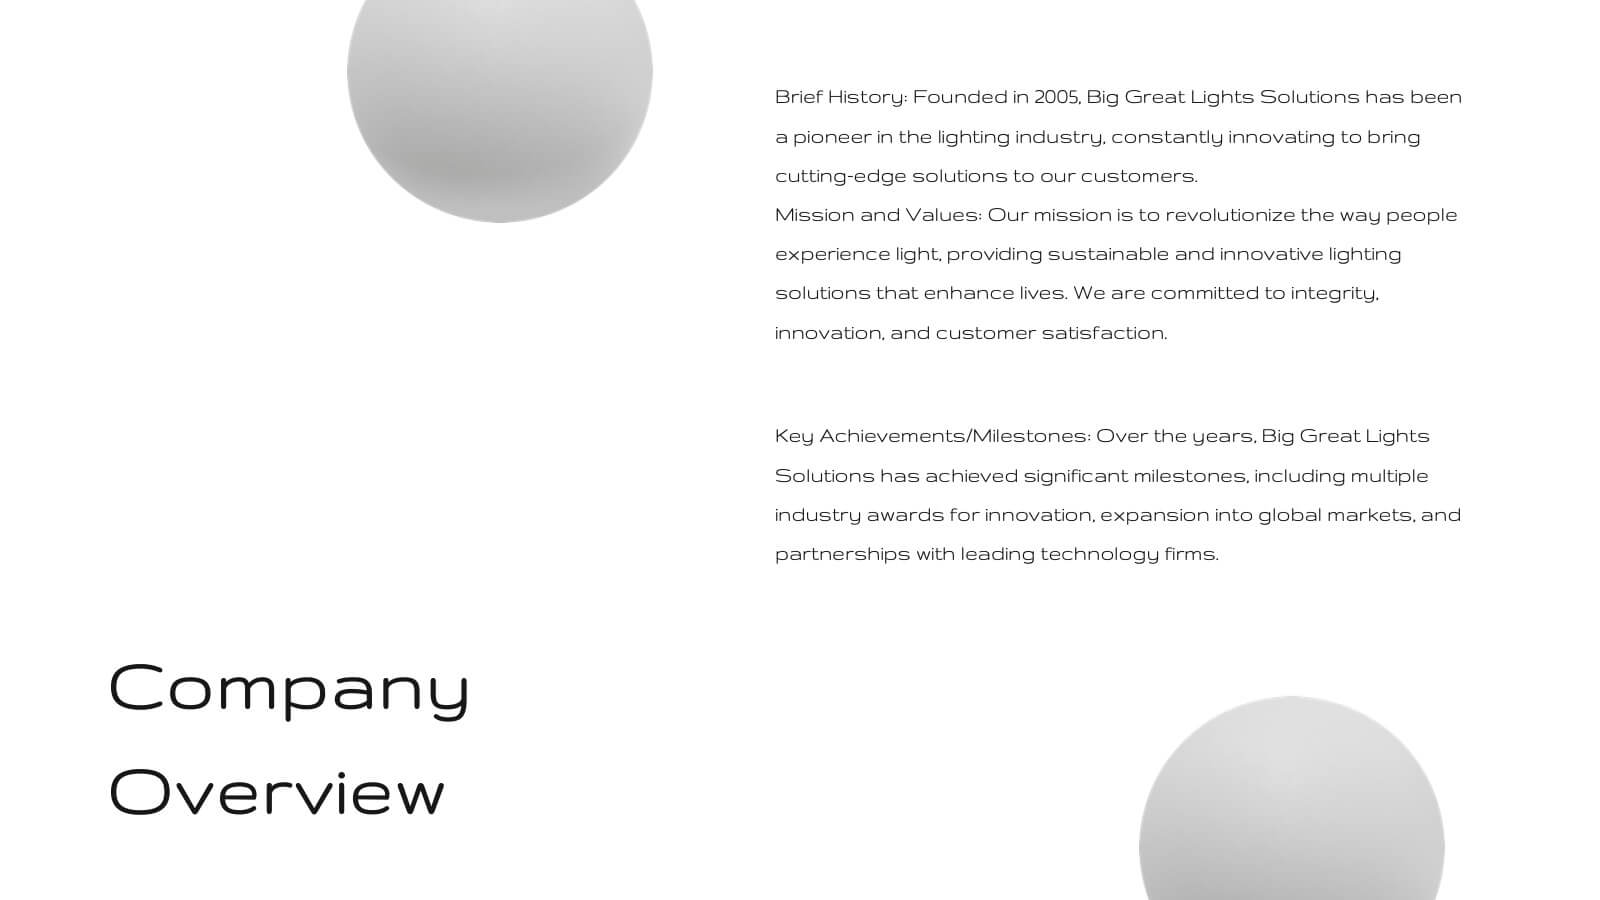
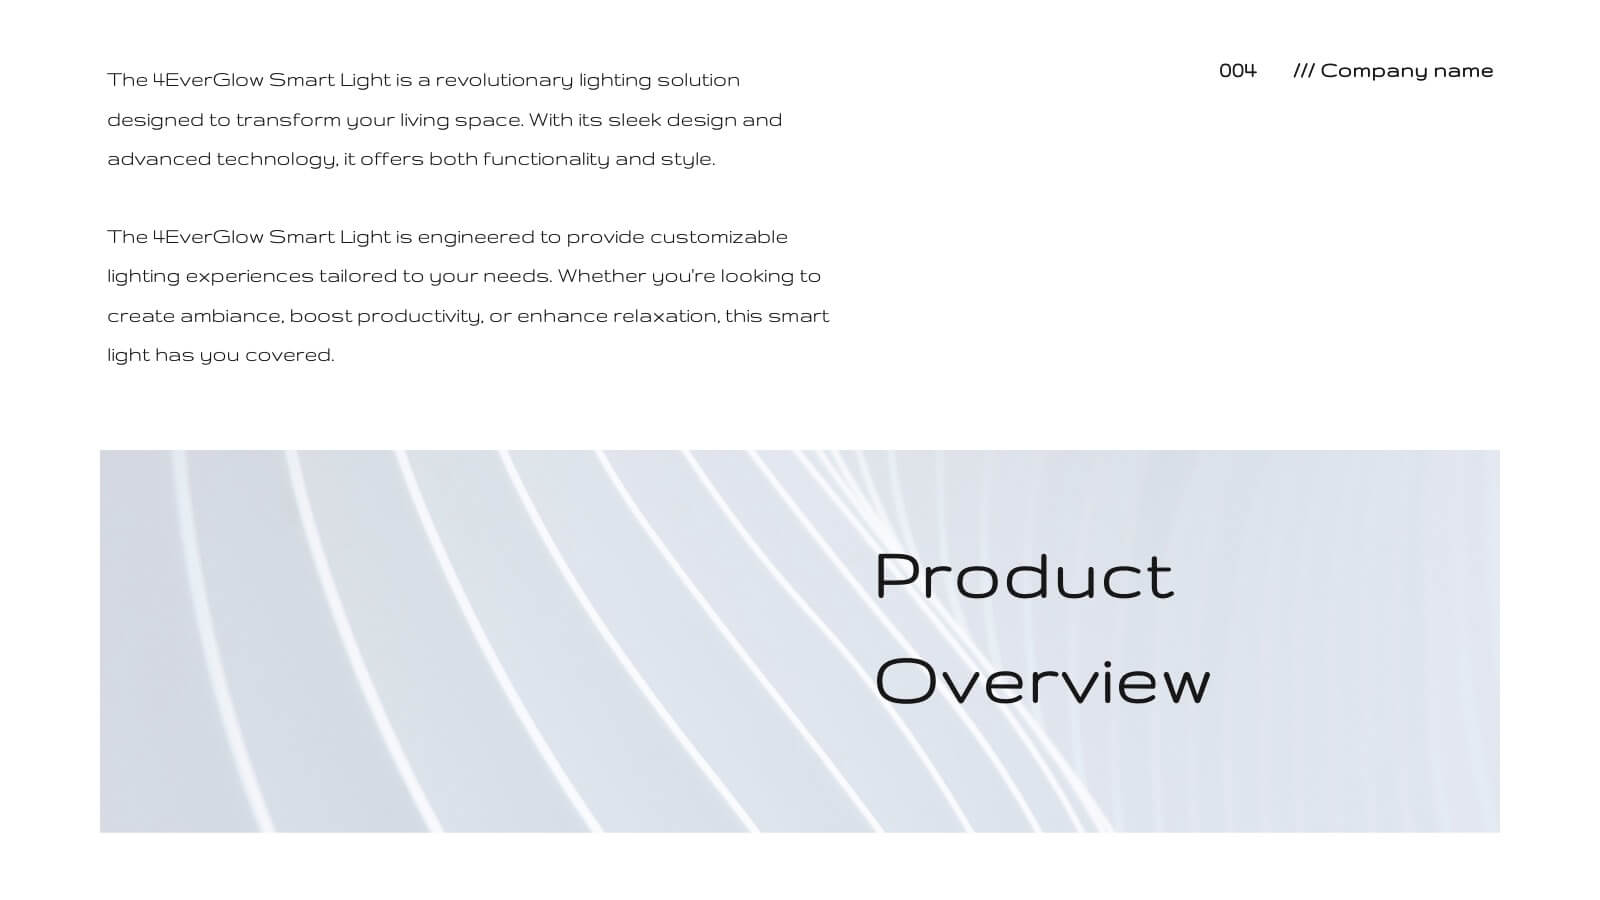
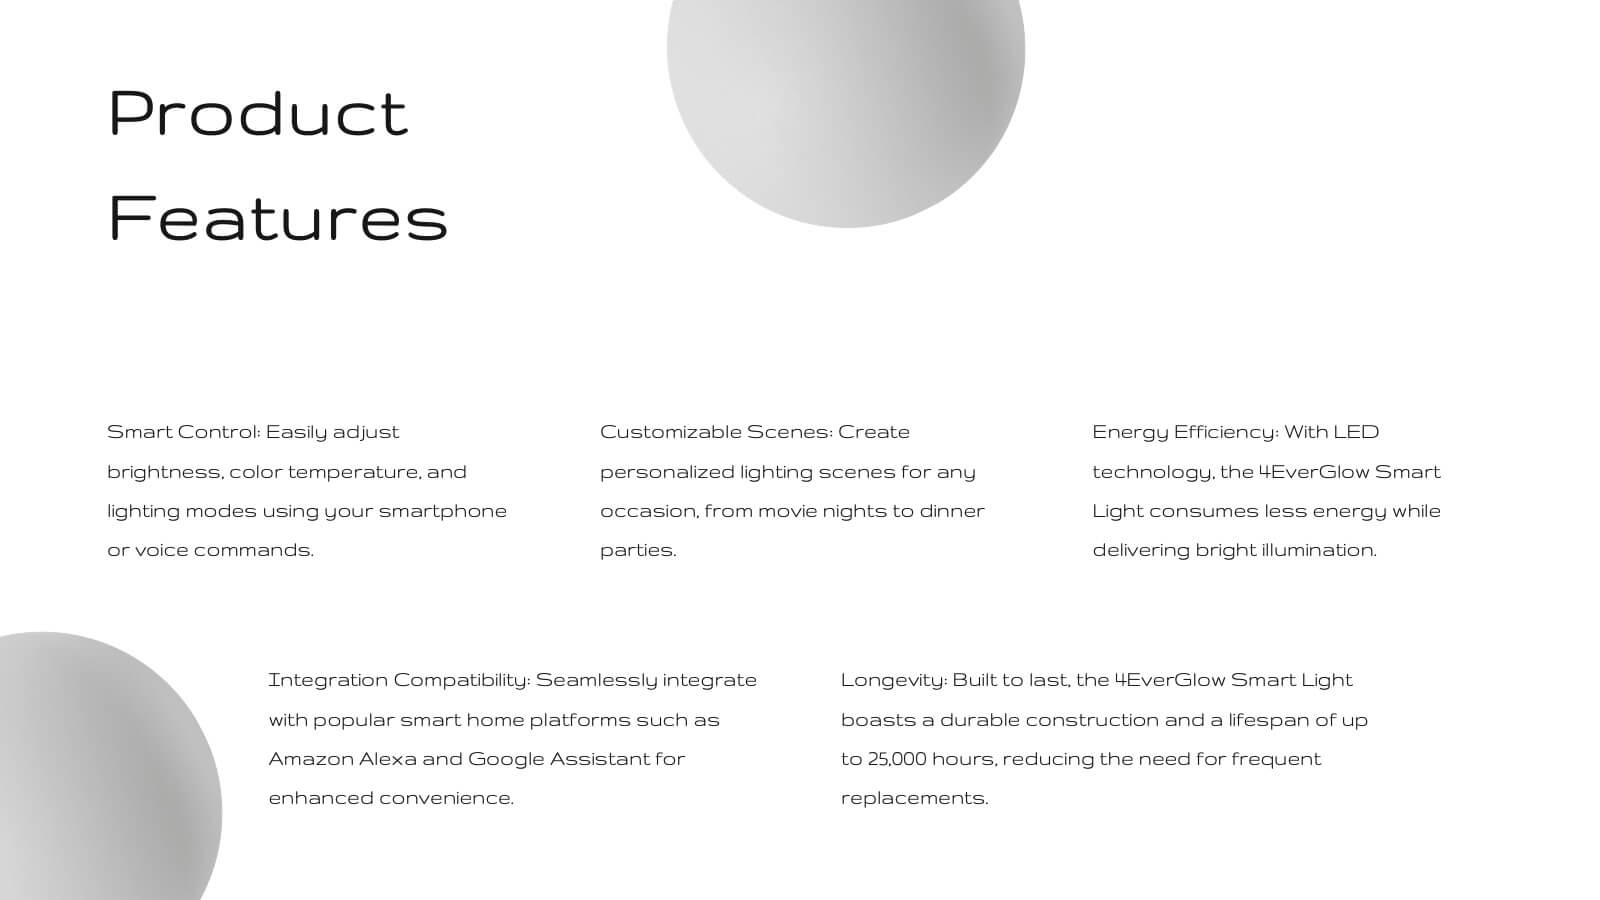
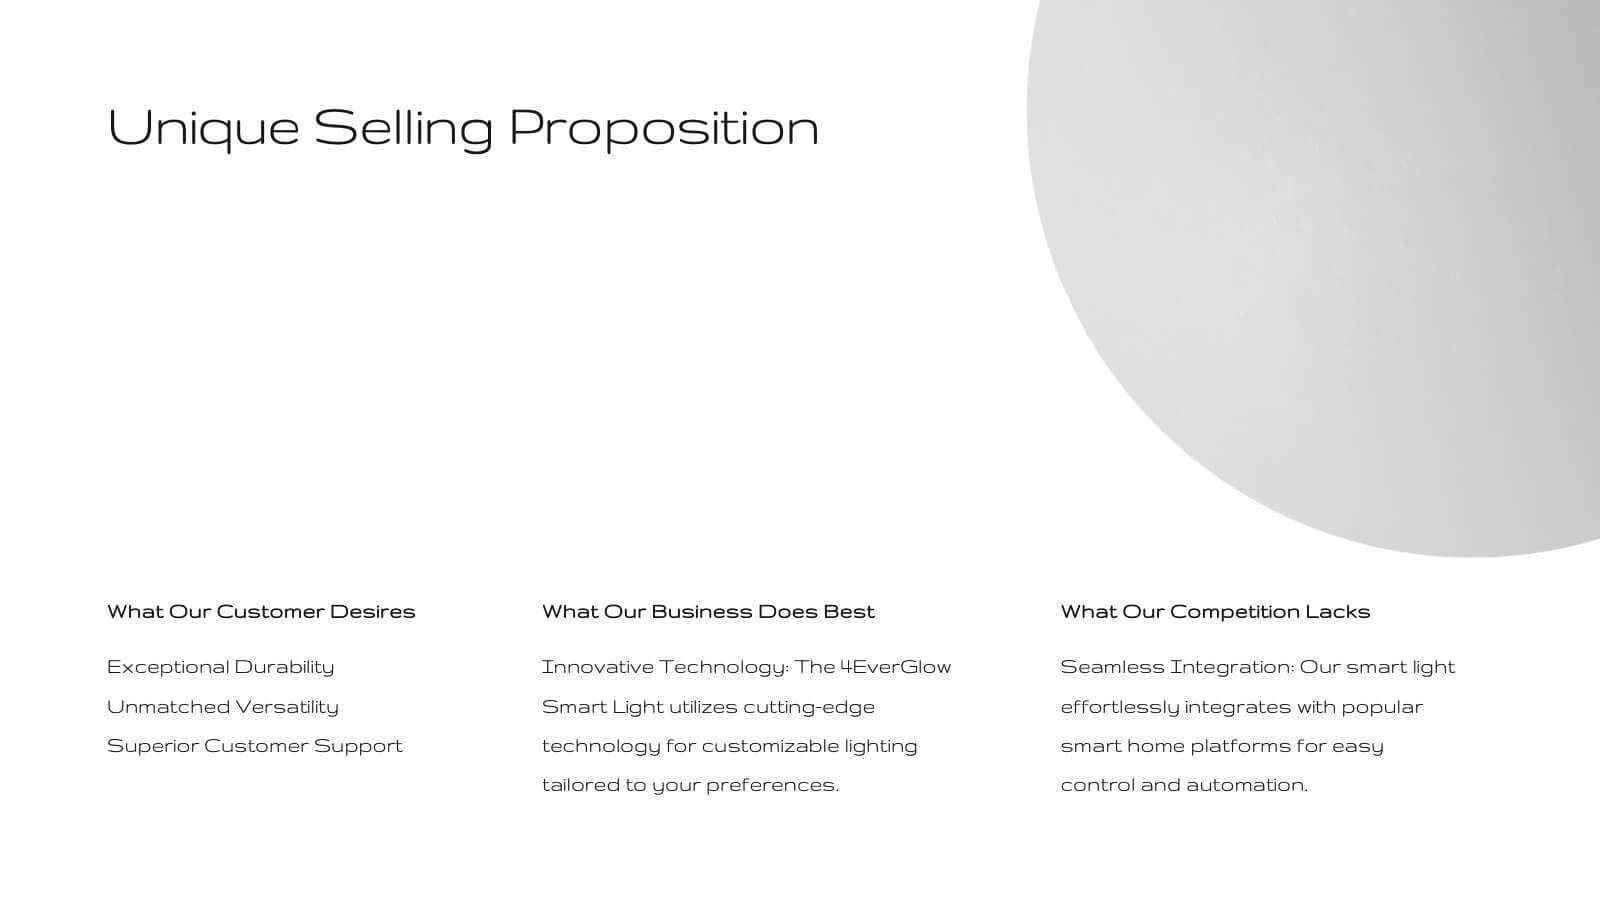
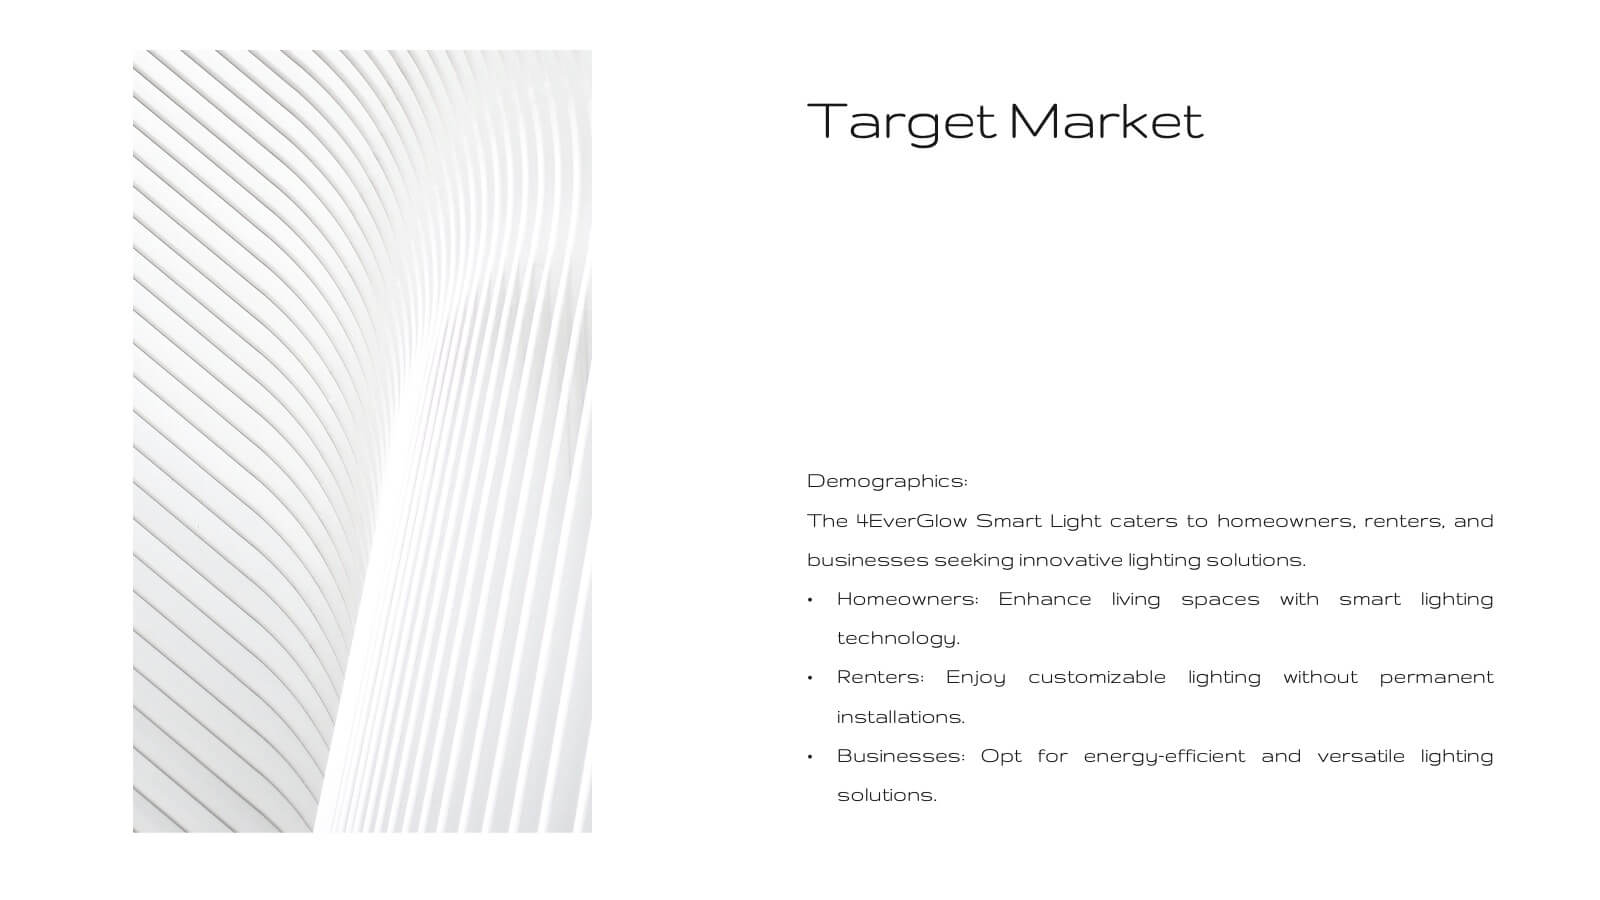
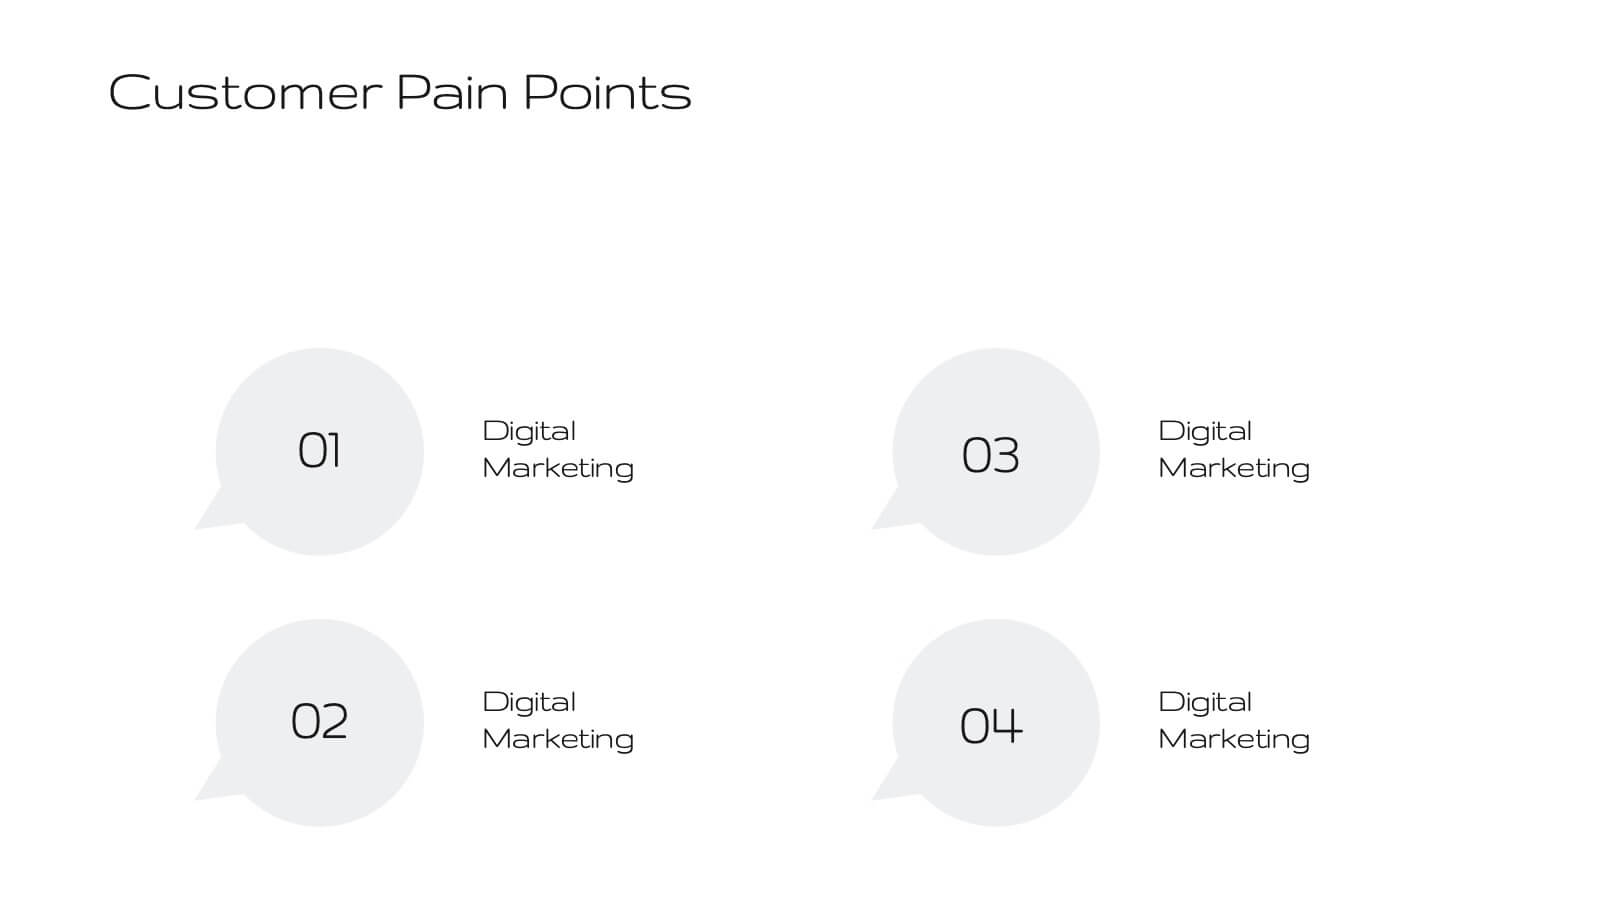
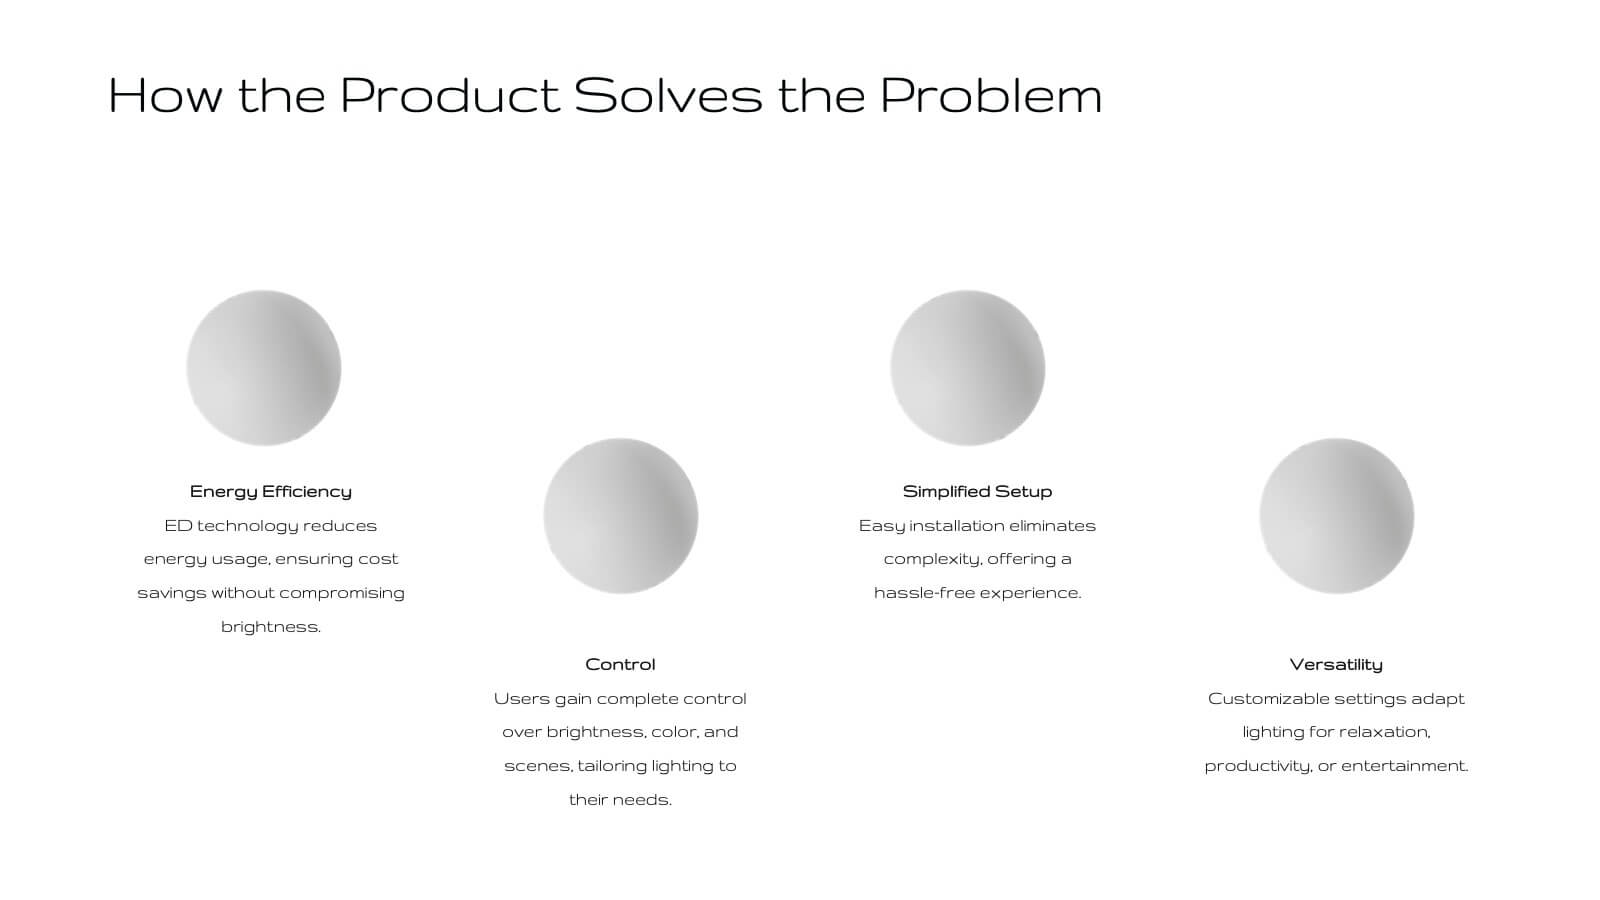
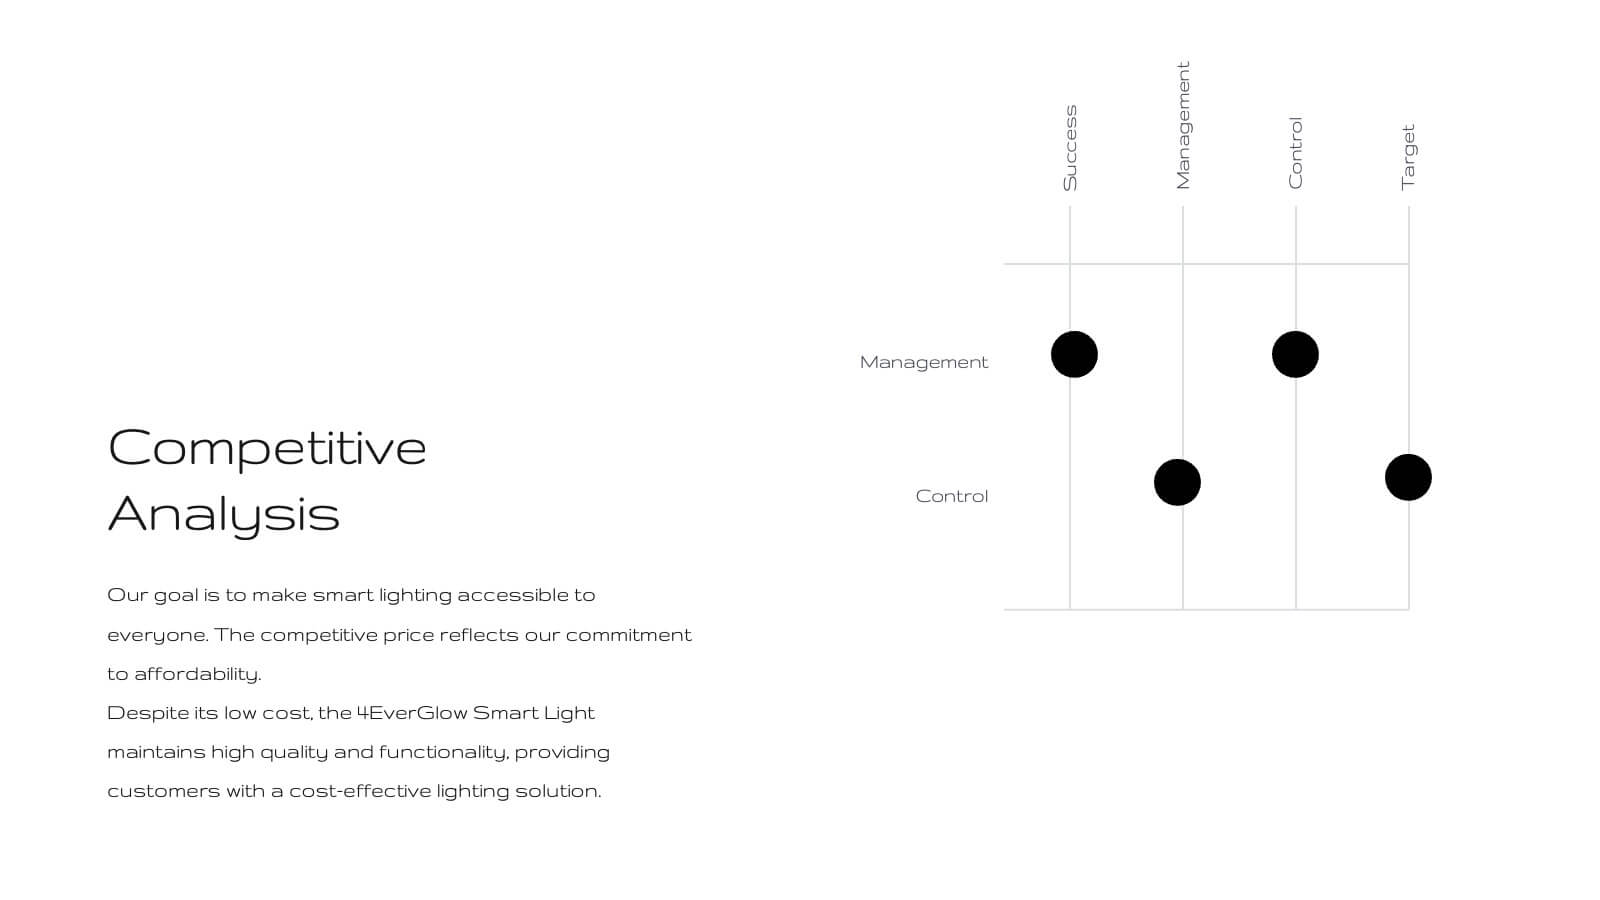
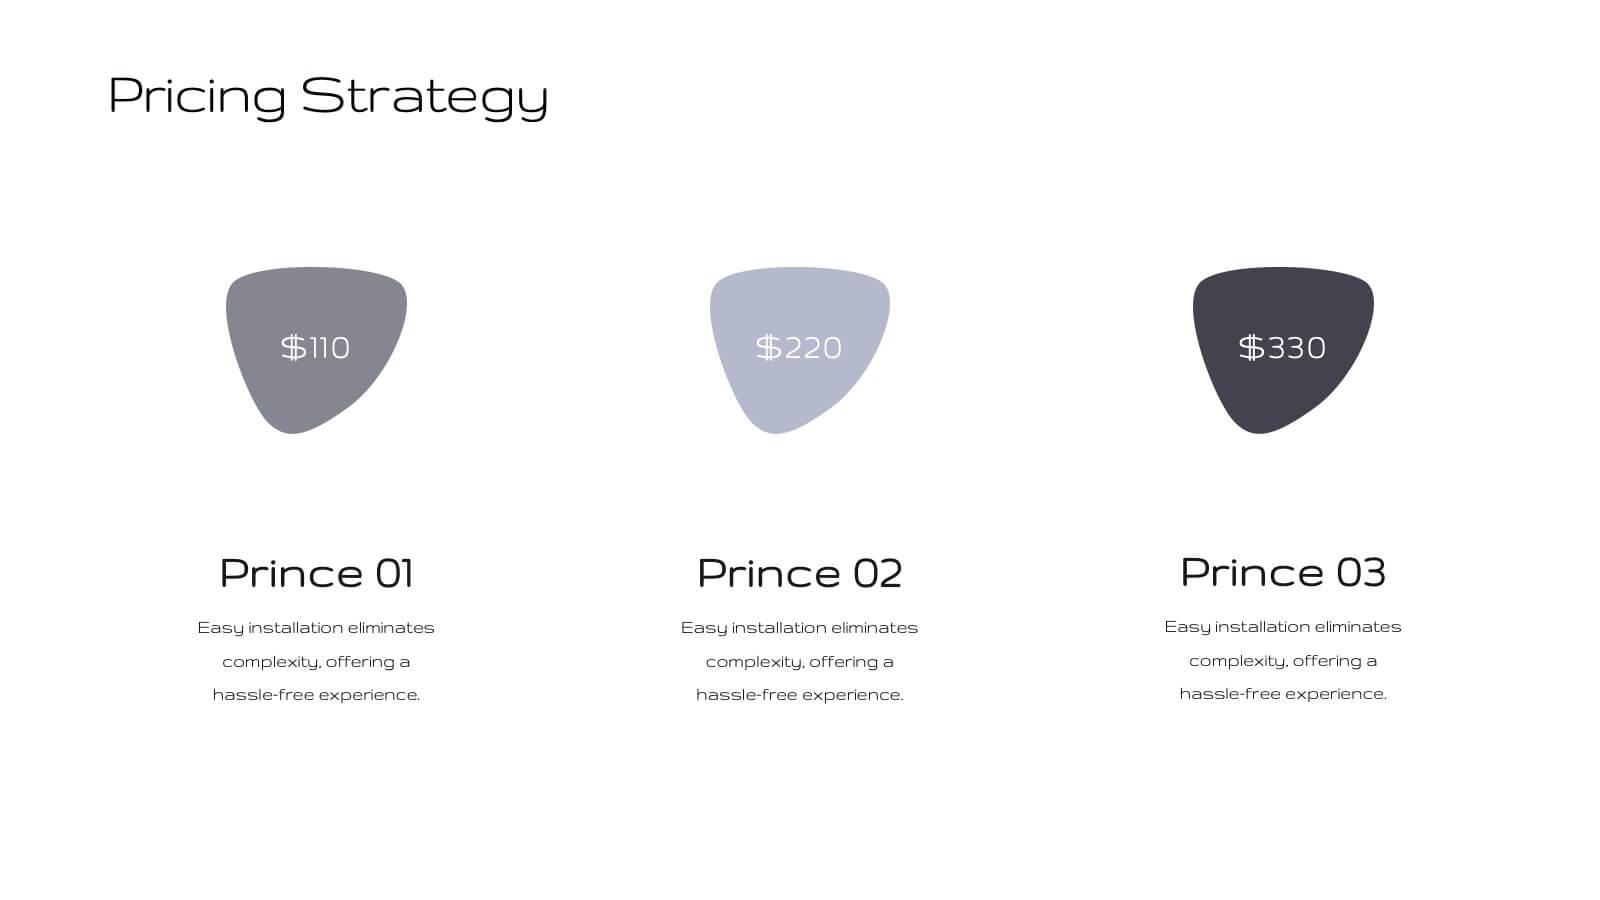
Fortuna Product Development Plan Presentation
Unveil your product's potential with this elegant, minimalist presentation template. Perfect for detailing product development, features, and market strategies, it features a clean design that emphasizes clarity and professionalism. Highlight key aspects like customer pain points, competitive analysis, and pricing strategies to captivate your audience. Compatible with PowerPoint, Keynote, and Google Slides, it ensures seamless presentations on any platform.


25 diapositivas
Jasper Rebranding Project Plan Presentation
Elevate your brand transformation with this sleek rebranding presentation template! It covers everything from mission and values to market analysis and brand positioning. Perfect for showcasing your brand guidelines and touchpoints. Fully customizable, and compatible with PowerPoint, Keynote, and Google Slides, making your rebranding process seamless and professional.


7 diapositivas
Organizational Structure with 7S Model Presentation
Bring your organizational framework to life with a clean, modern layout that makes complex relationships easy to understand. This presentation helps you explain key elements, show how they connect, and guide strategic discussions with clarity and structure. Fully editable and compatible with PowerPoint, Keynote, and Google Slides.


12 diapositivas
Customer Satisfaction Smile Rating Presentation
Measure customer happiness with this engaging customer satisfaction smile rating template! Featuring a visual scale from dissatisfaction to delight, this design helps businesses track feedback and identify improvement areas. Ideal for reports, surveys, and performance reviews. Fully customizable and compatible with PowerPoint, Keynote, and Google Slides.


5 diapositivas
Product Life Cycle Stages Presentation
Explore the 'Product Life Cycle Stages' with this concise presentation template. Perfect for marketing professionals and product managers, it outlines the product journey from introduction to decline. Enhance your strategy discussions using this template, compatible with PowerPoint, Keynote, and Google Slides.


3 diapositivas
Credit Card Comparison Chart Presentation
Make financial decisions feel clearer and more visual with this clean comparison-focused layout designed to highlight key features side by side. It helps you simplify data, explain differences, and guide smarter choices with confidence. Fully editable and compatible with PowerPoint, Keynote, and Google Slides.

20 diapositivas
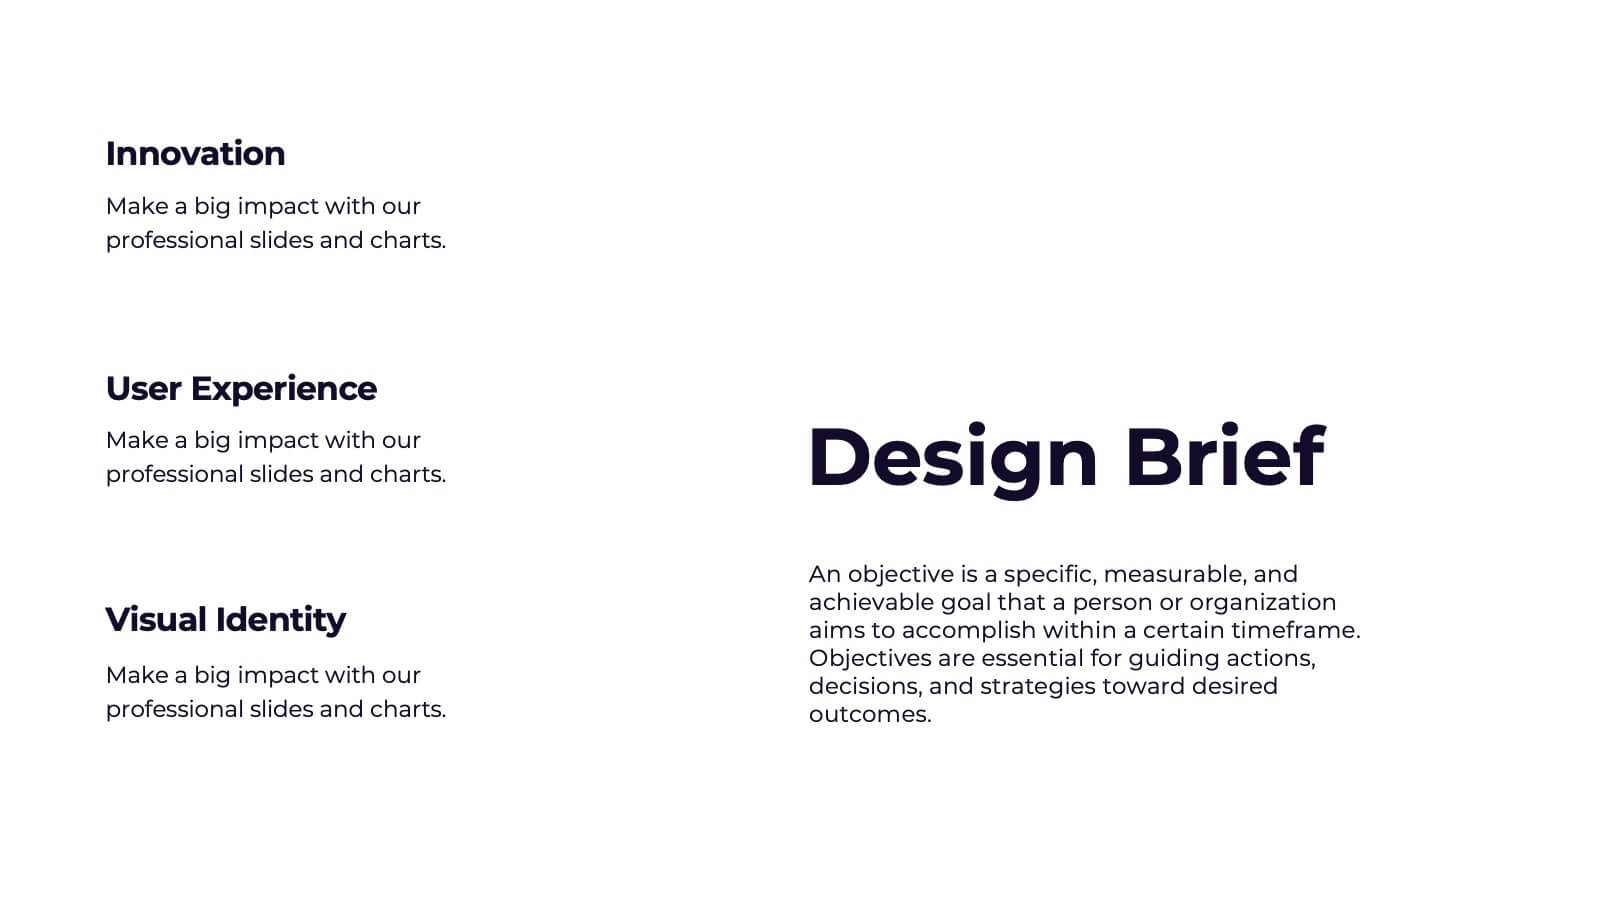
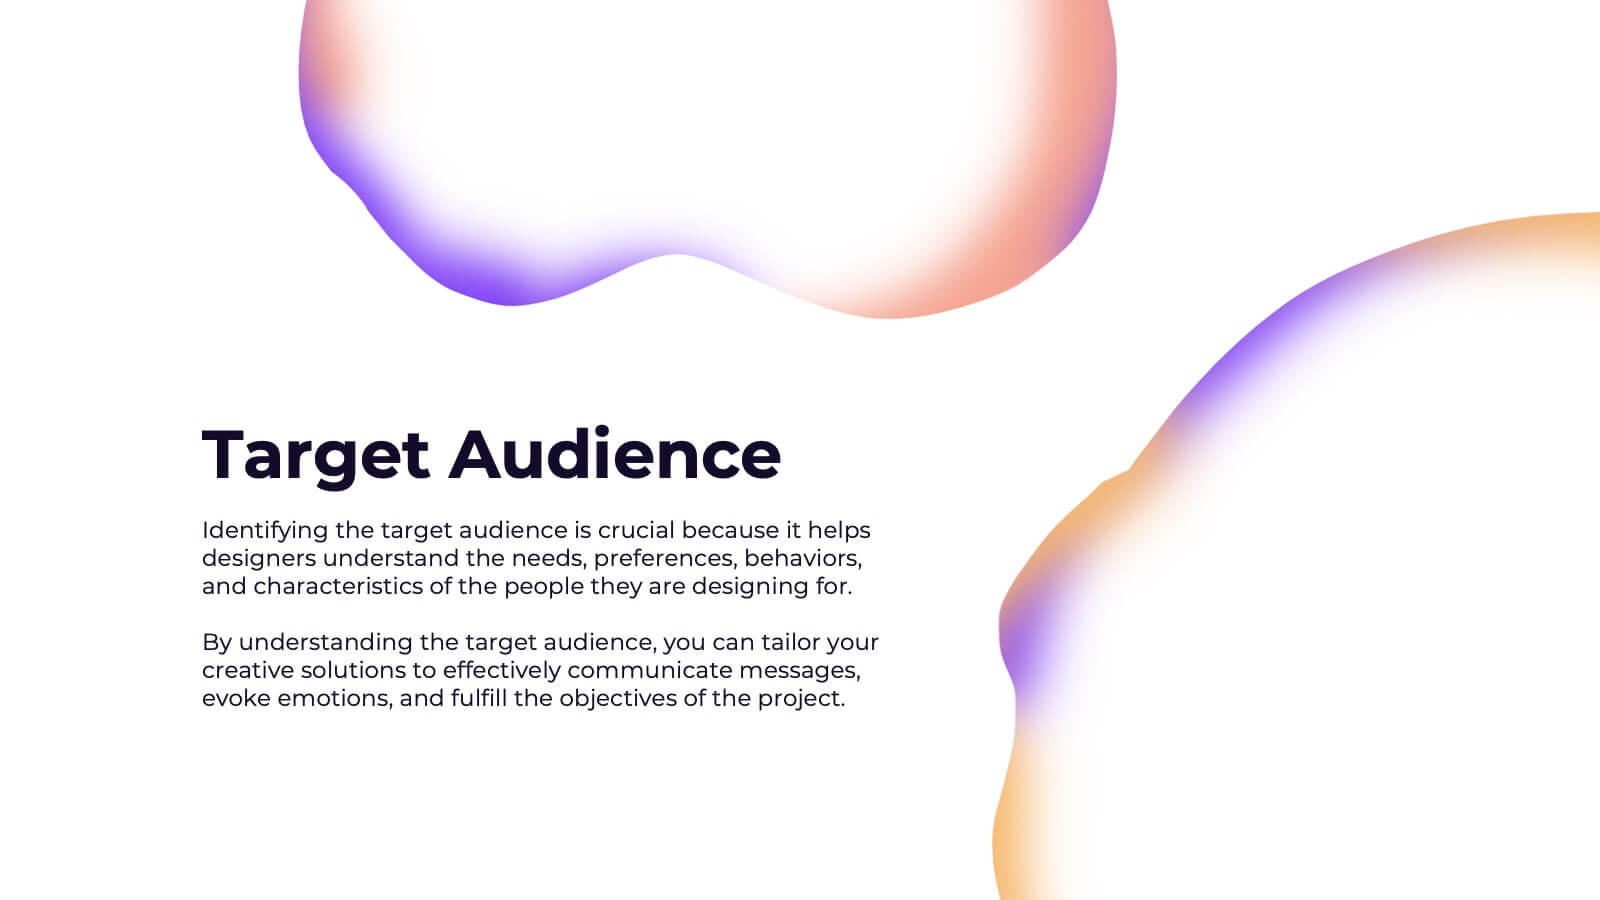
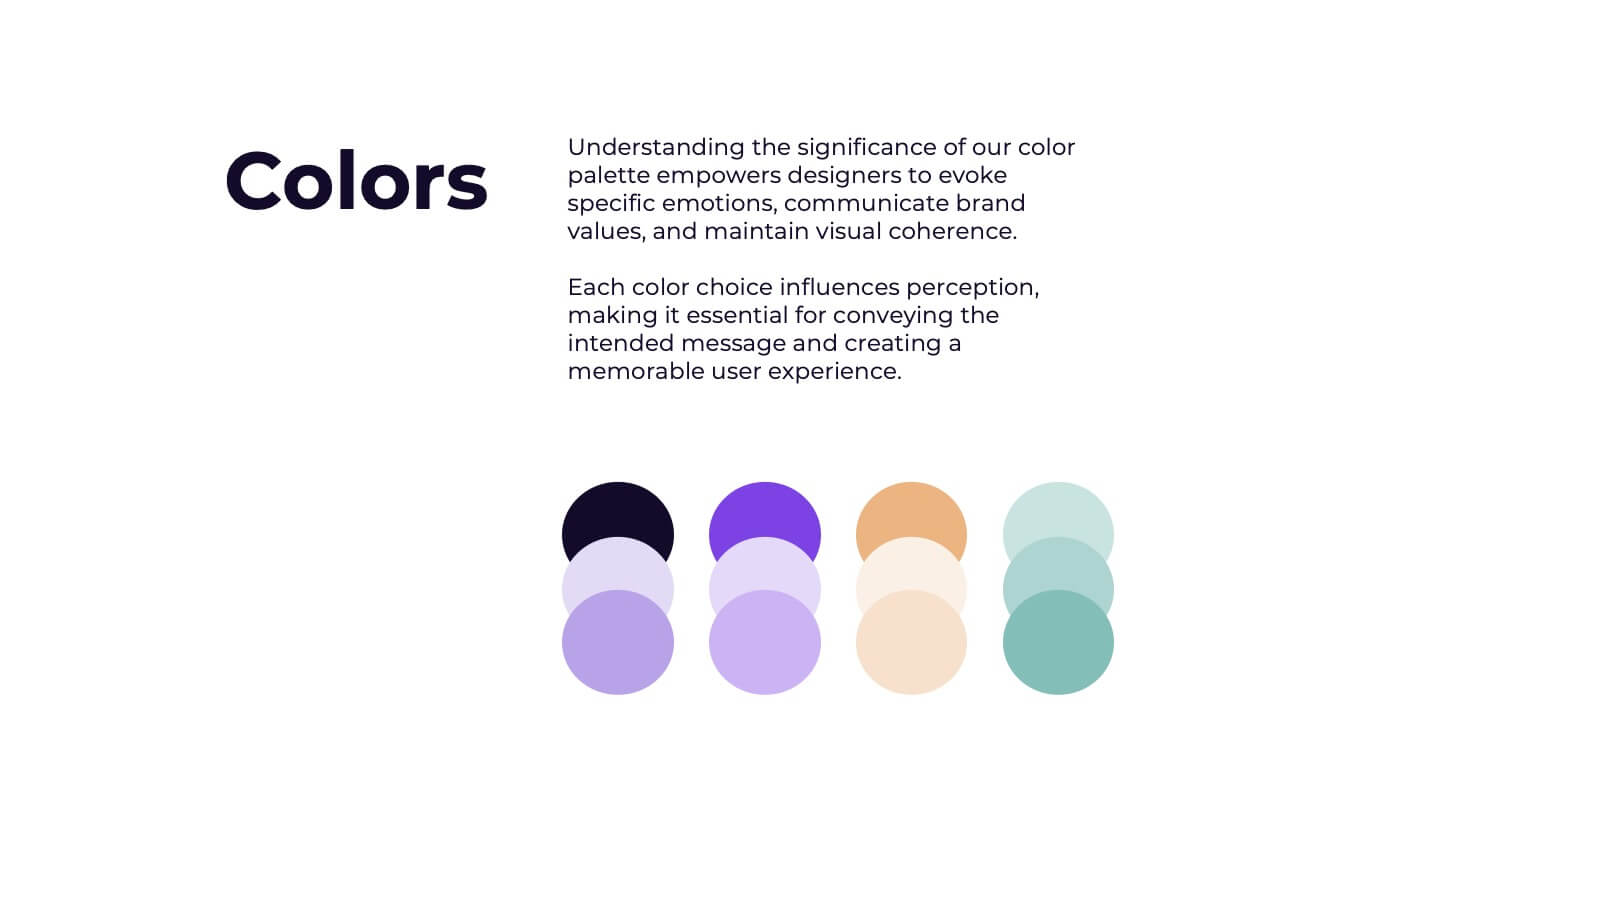
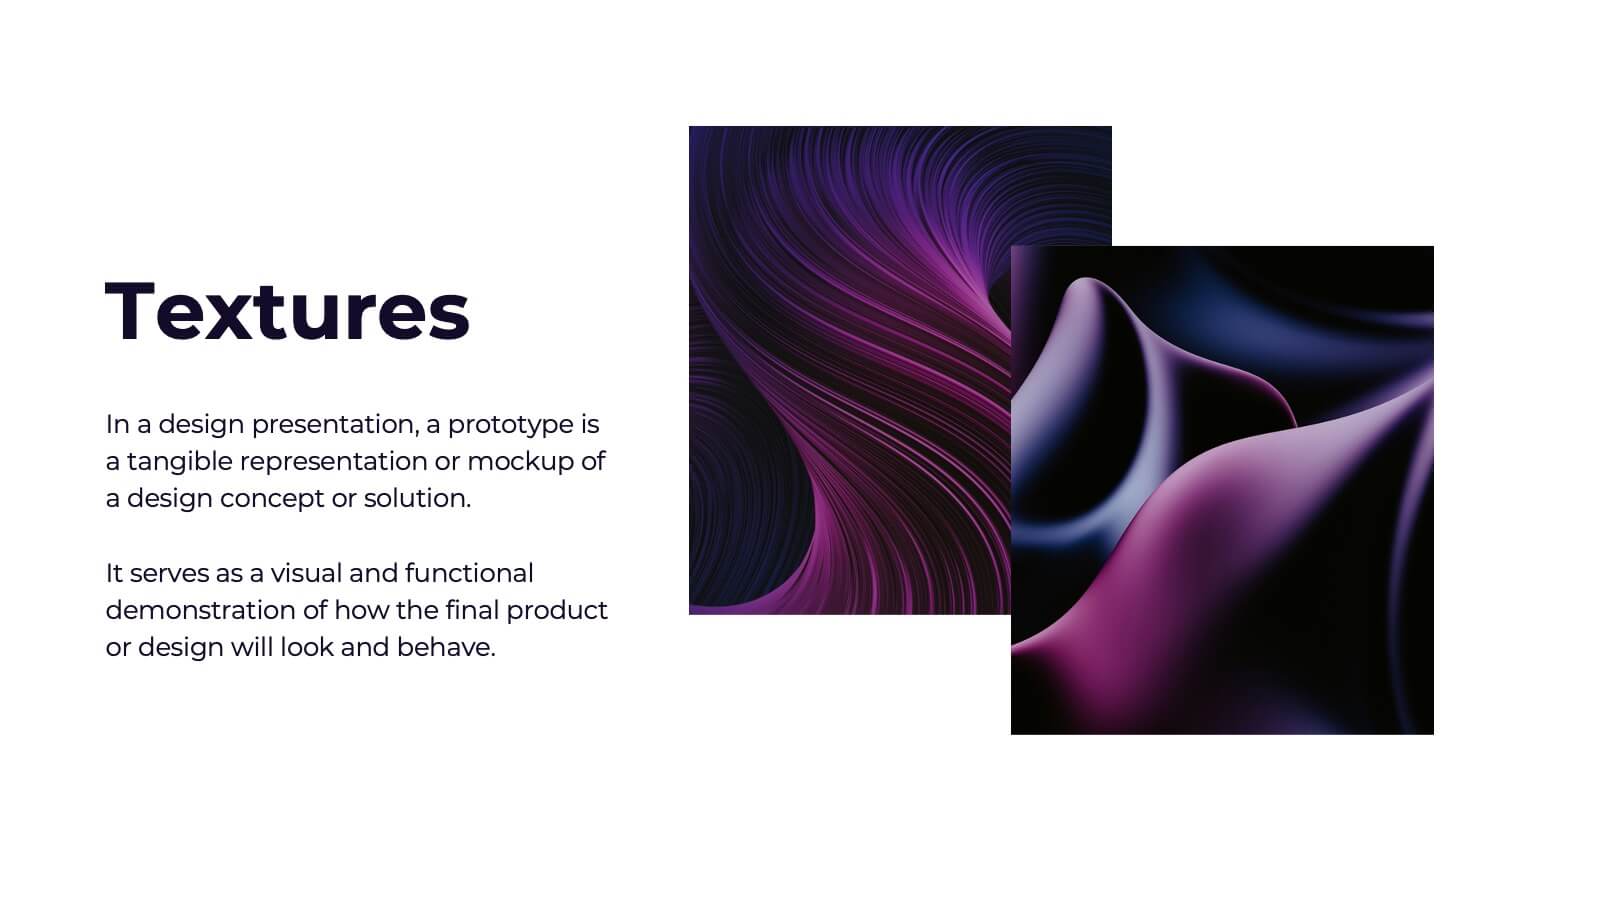
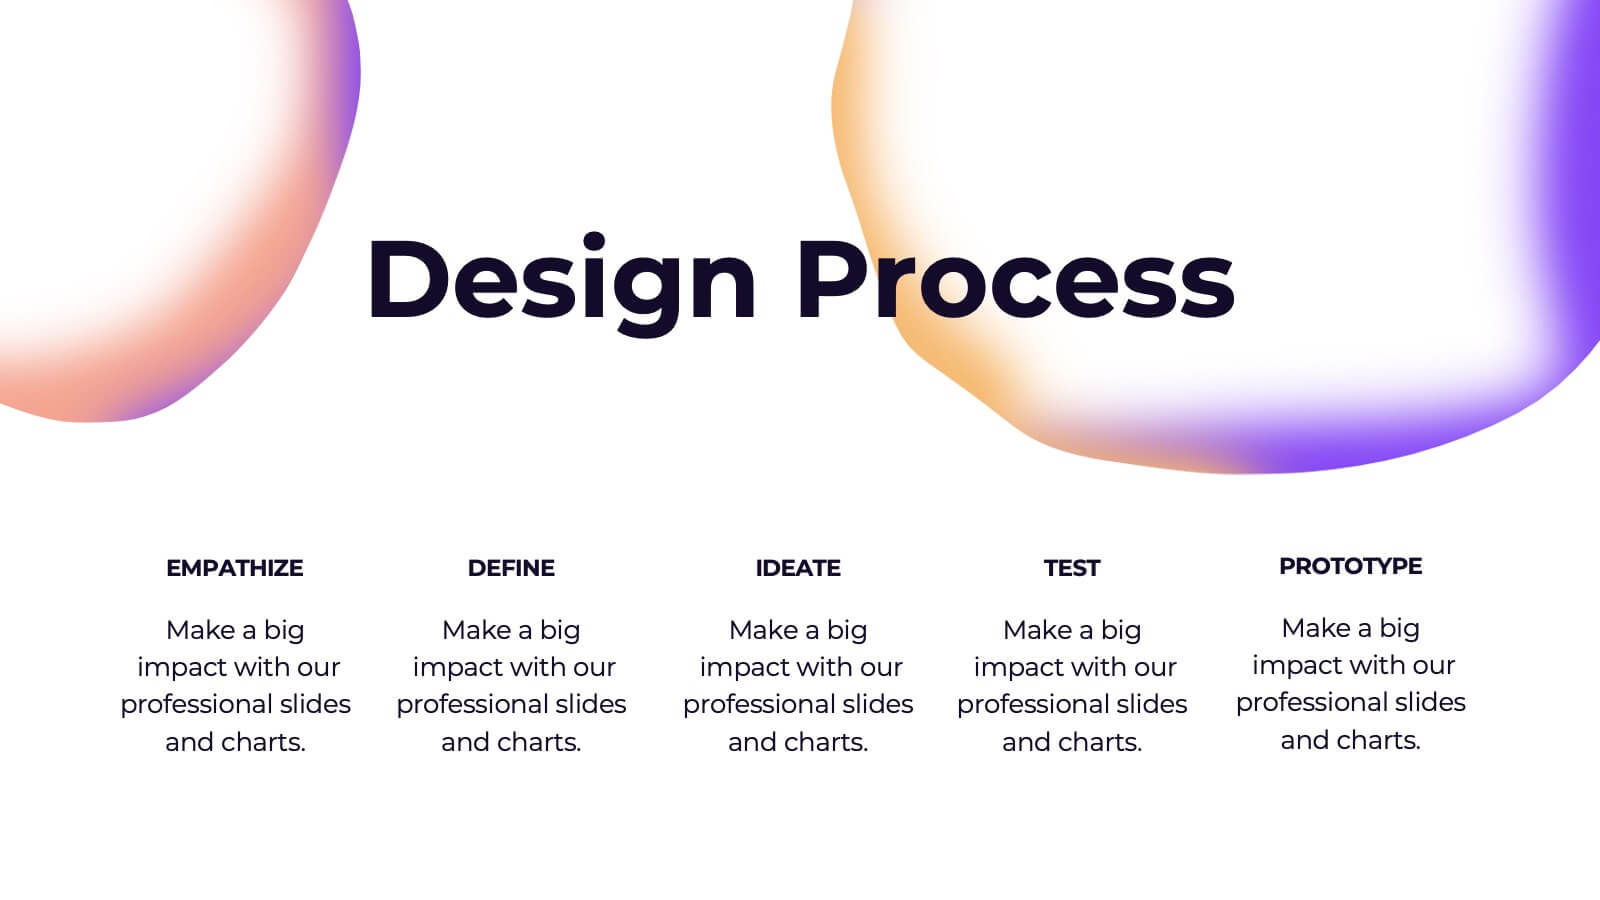
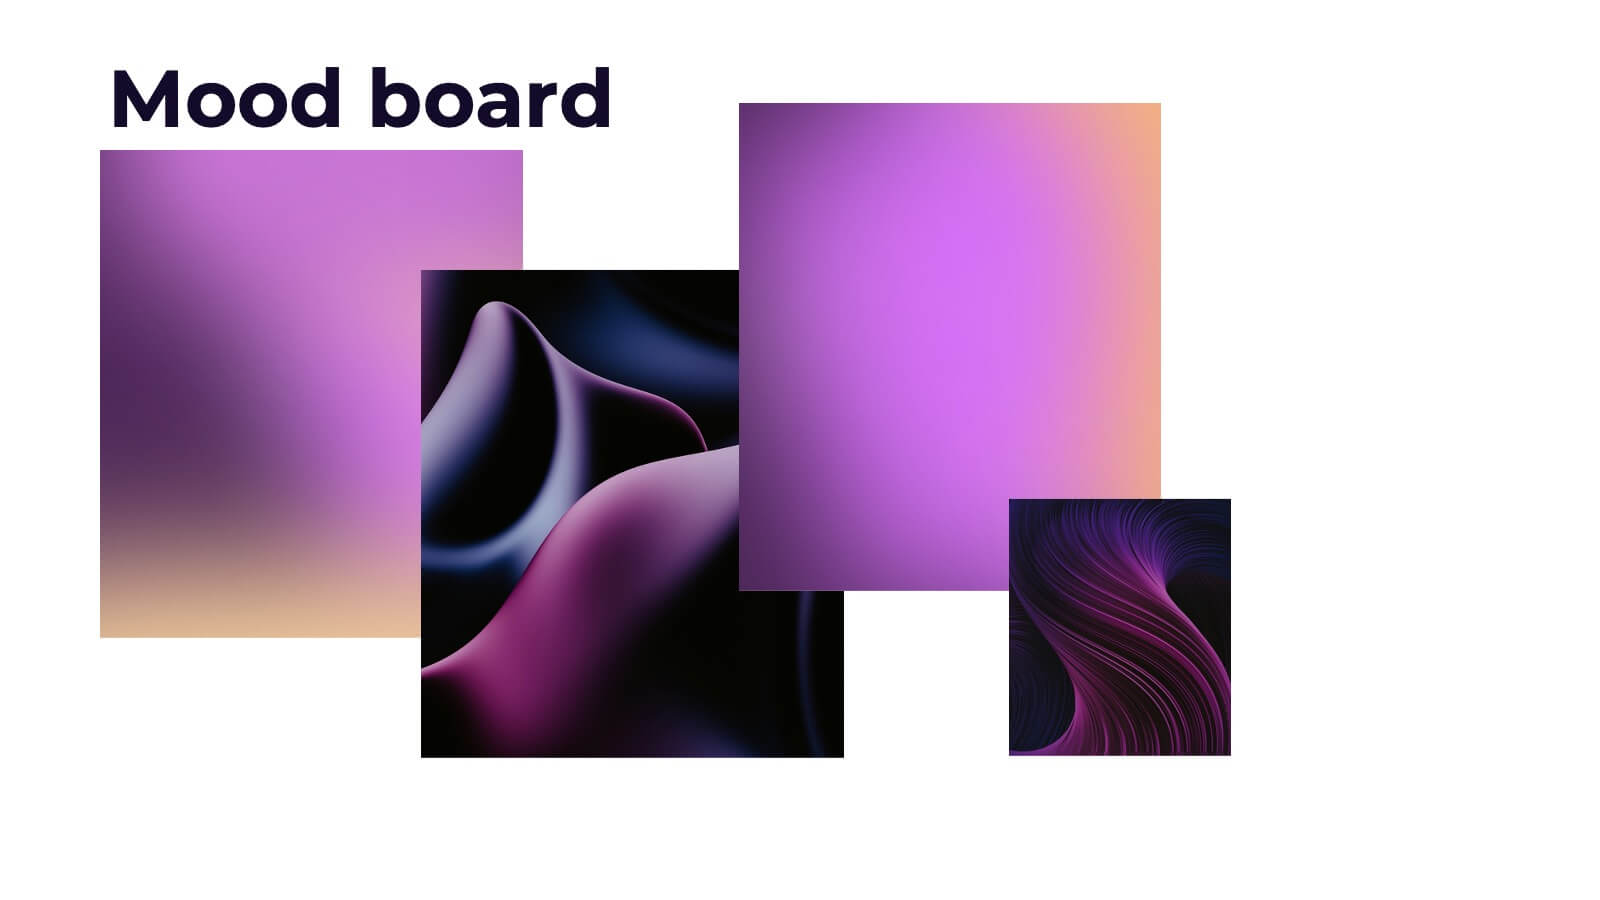
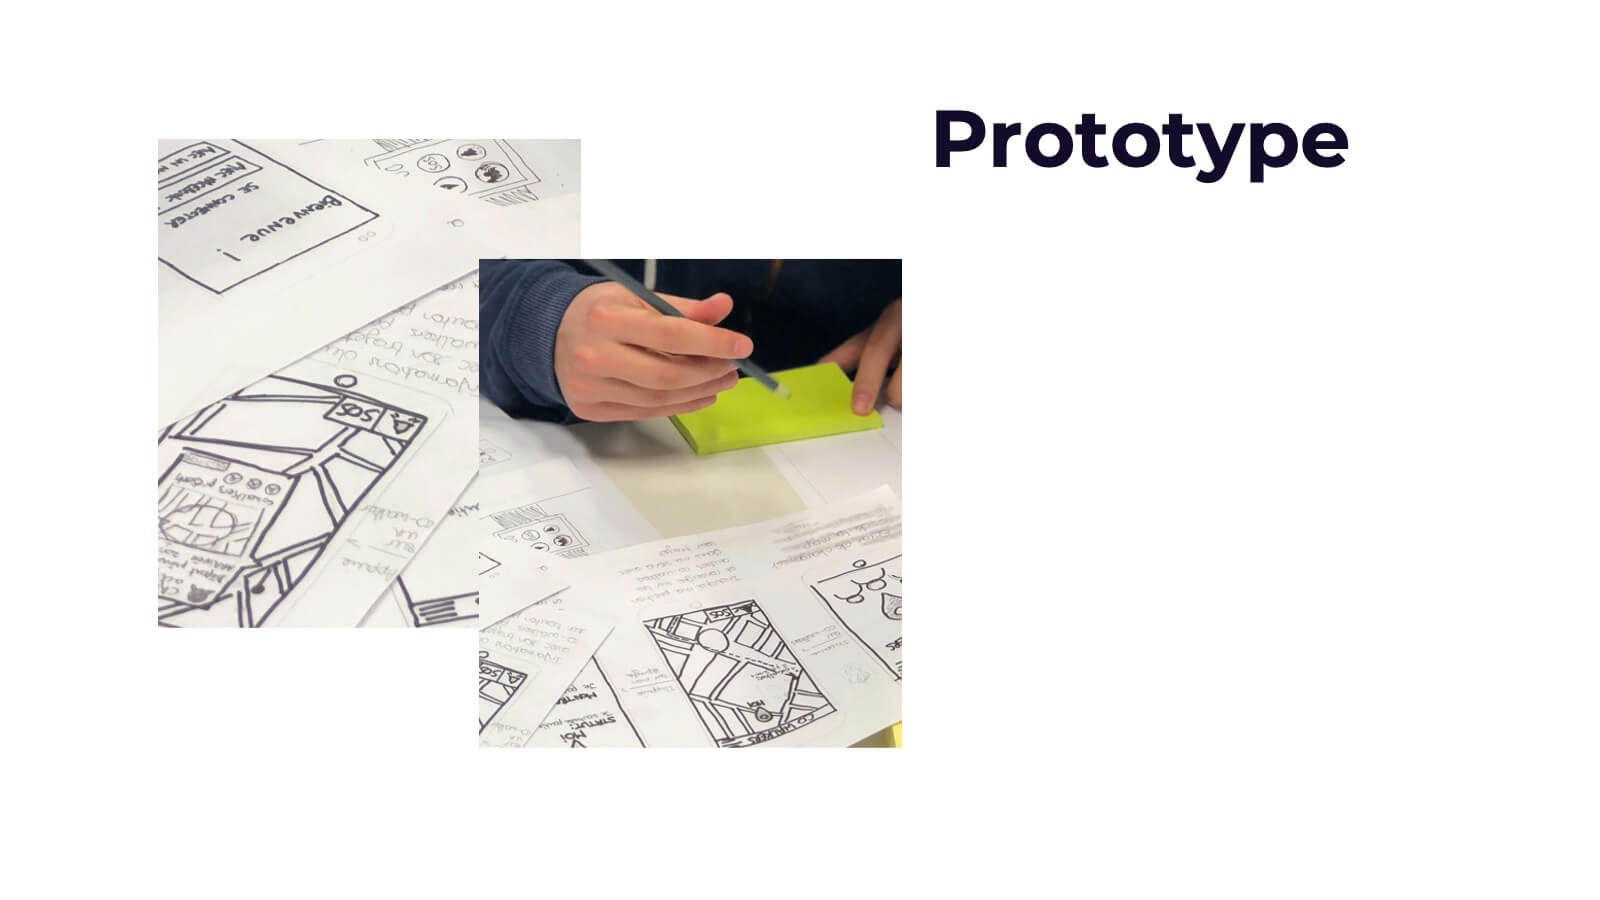
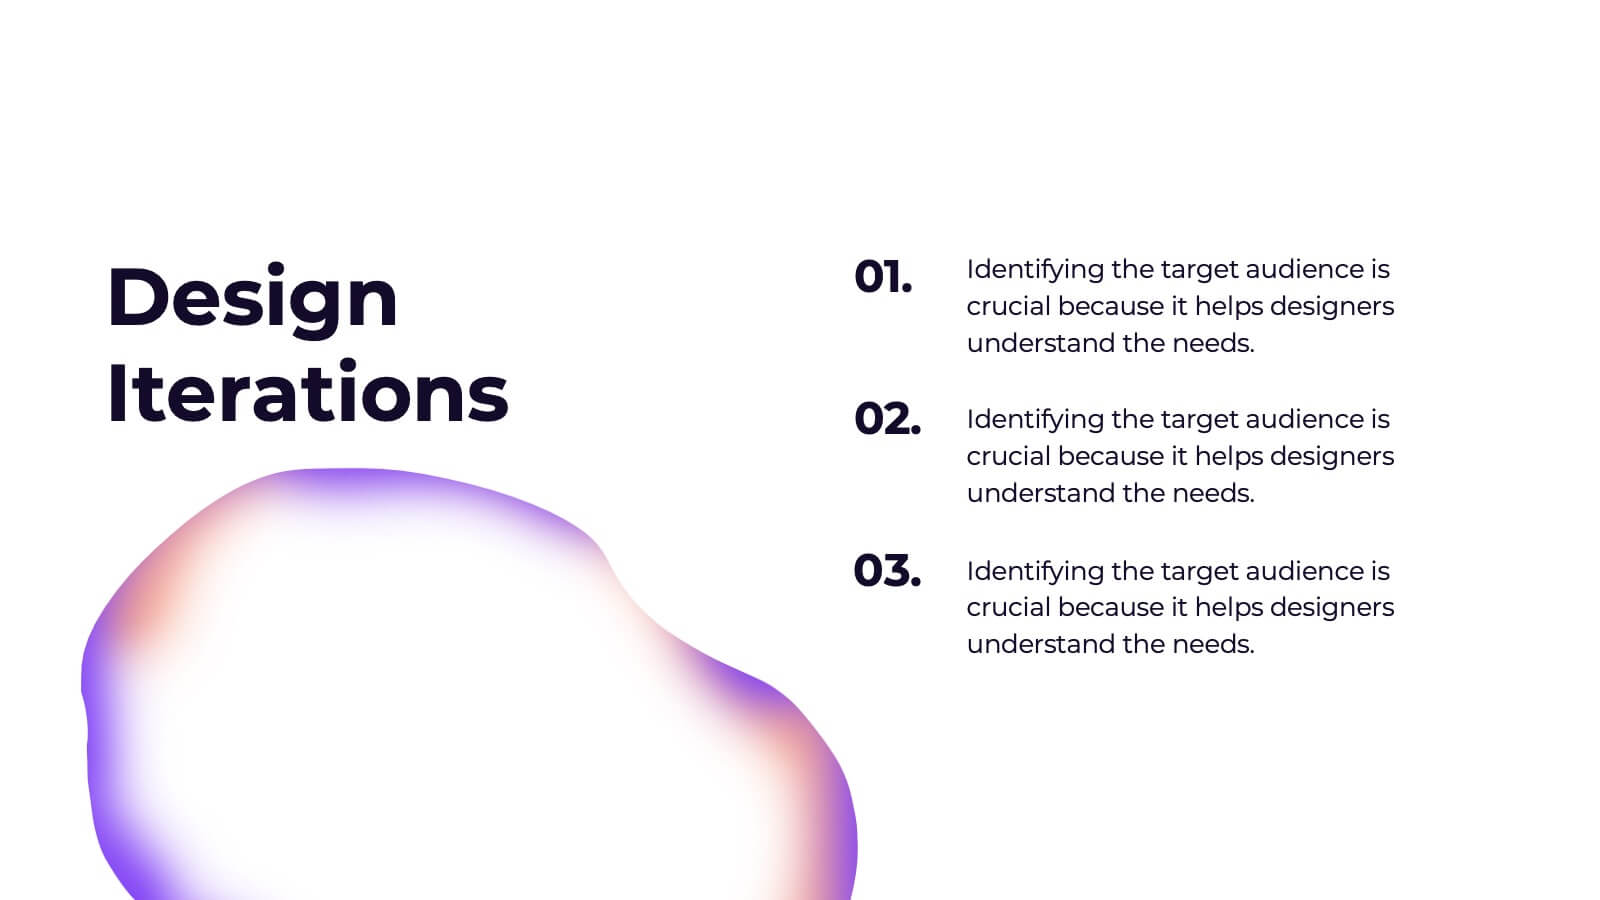
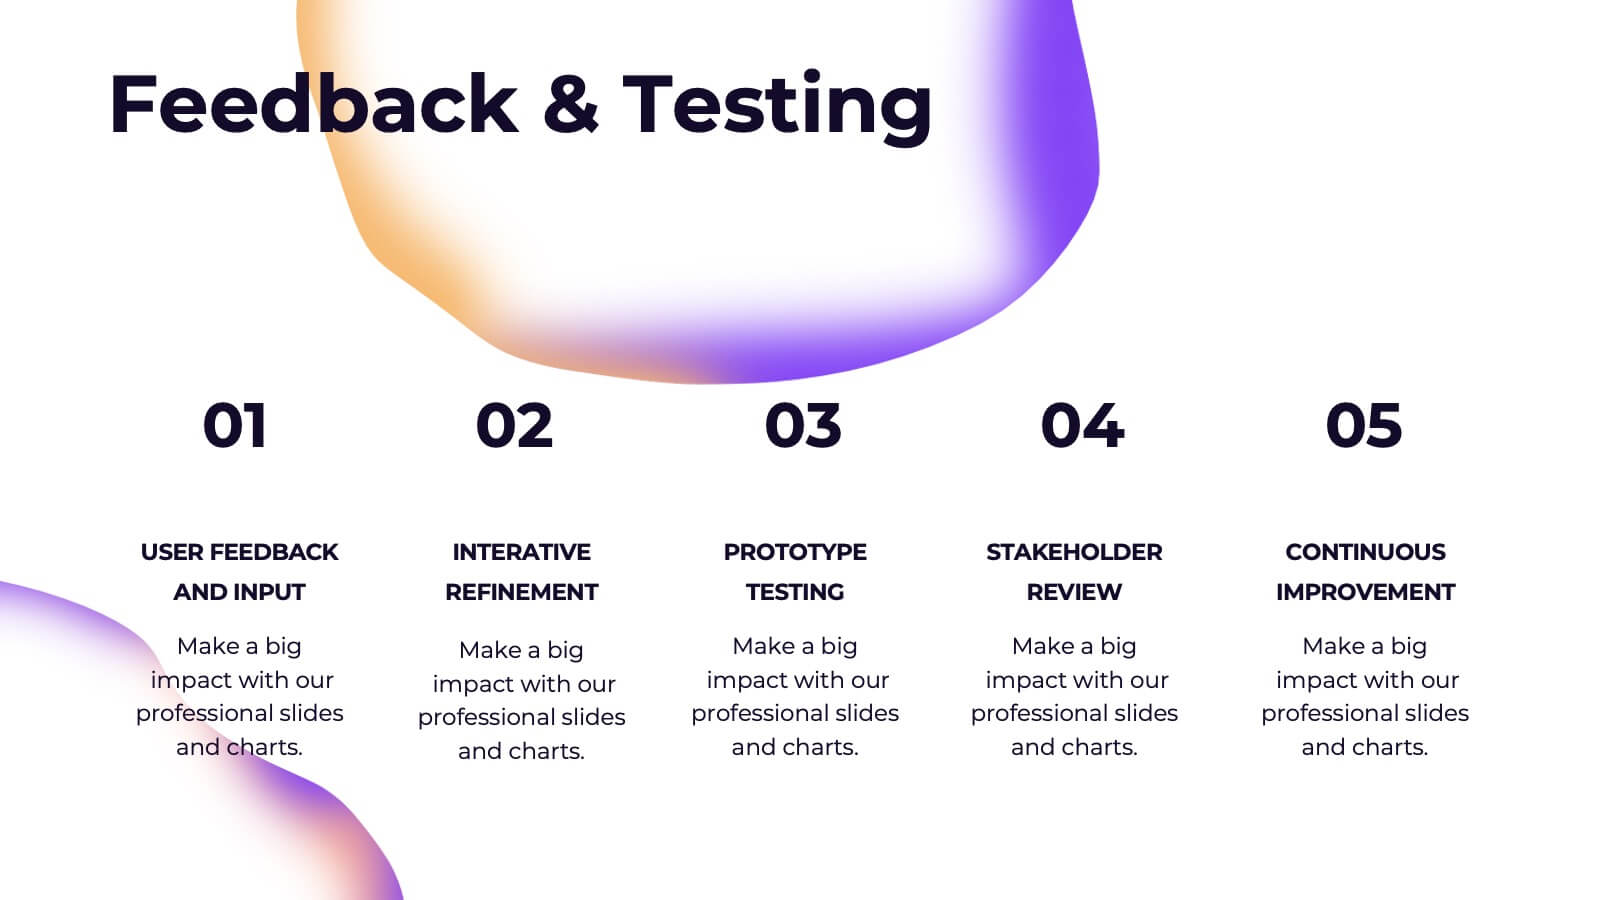
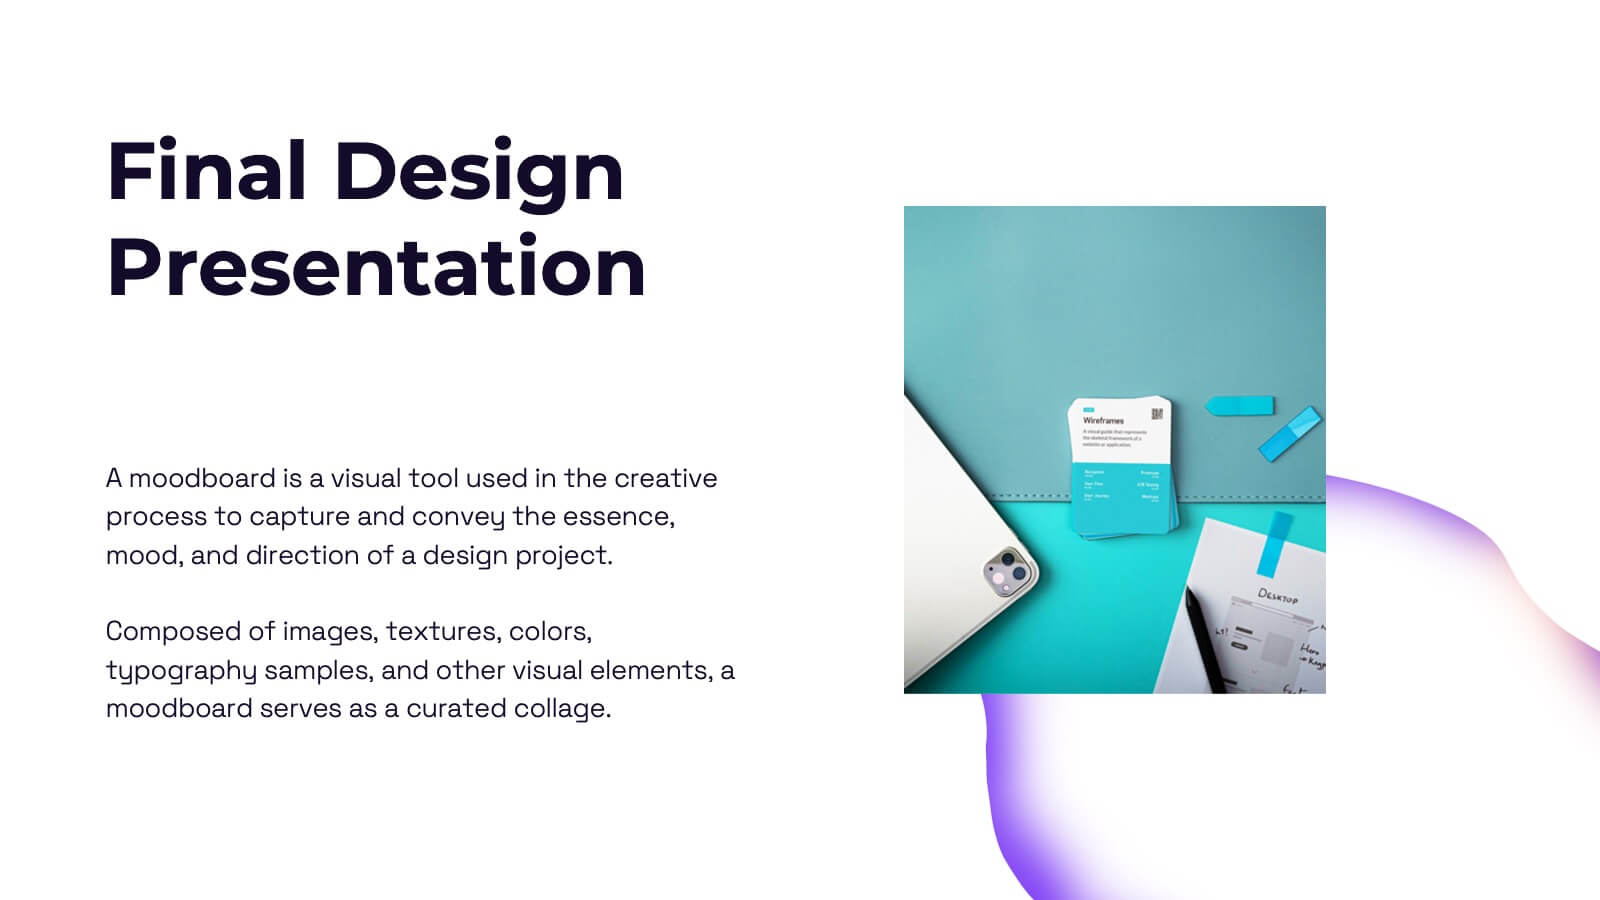
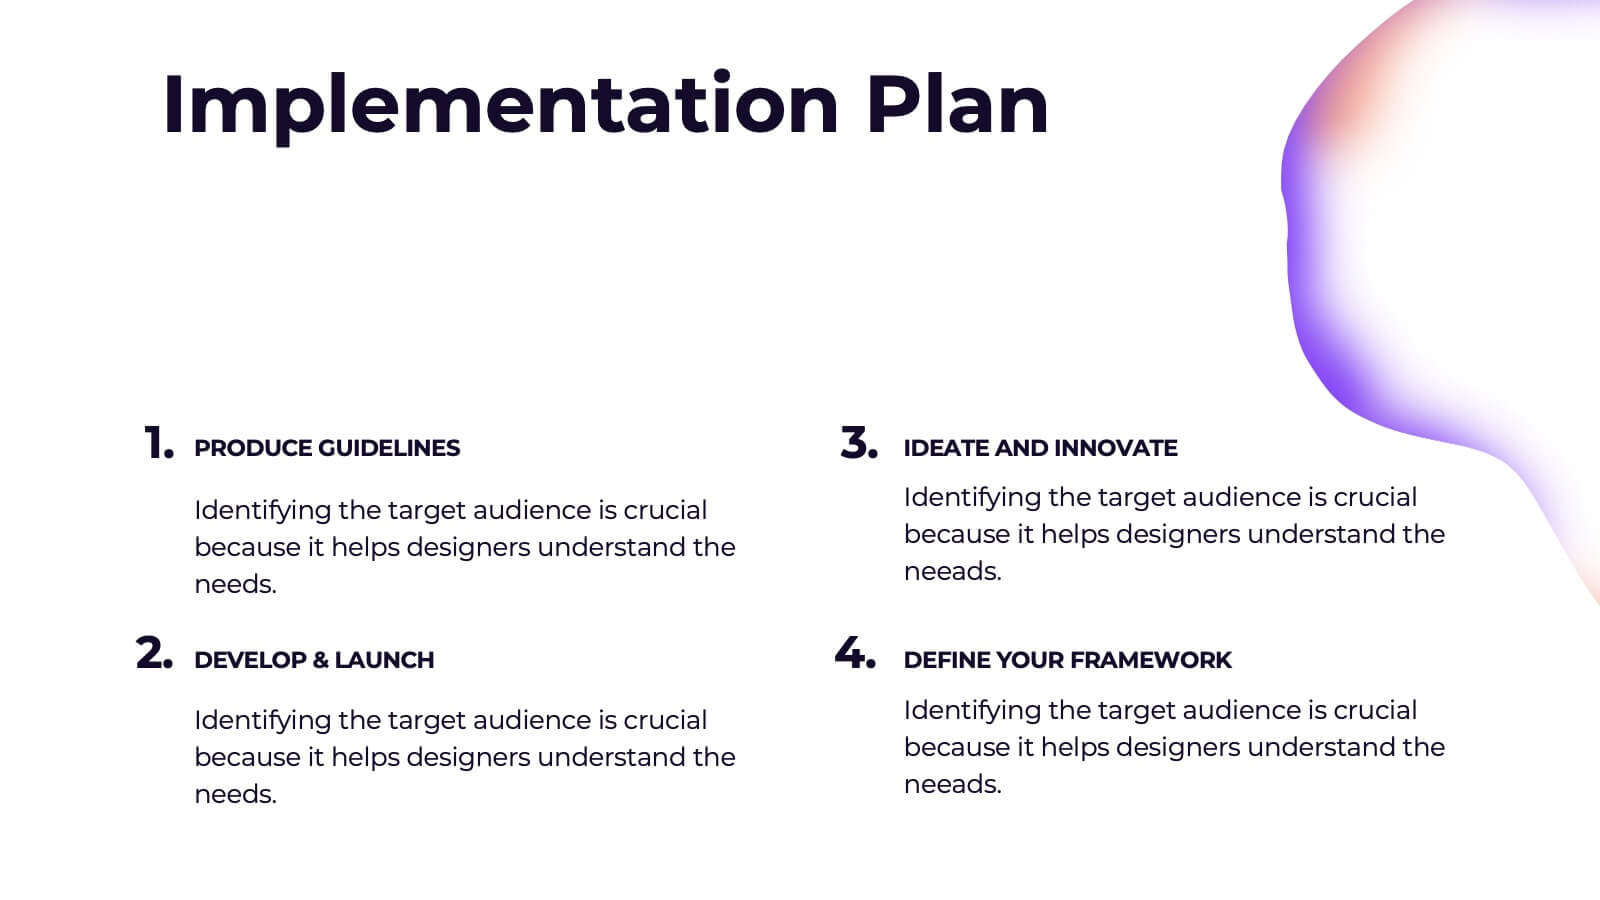
Valkyrie Design Strategy Proposal Presentation
Elevate your design strategy presentations with this visually captivating and modern template! It covers every step of the design process, from concept development and mood boards to prototype iterations and feedback. Ideal for showcasing design elements, textures, and assets, this template is perfect for creative professionals. Compatible with PowerPoint, Keynote, and Google Slides for easy, polished presentations.


5 diapositivas
AIDA Funnel for Marketing Strategy Presentation
This presentation template breaks down the AIDA model—Attention, Interest, Desire, Action—into a clean, engaging layout. Perfect for marketing strategies, campaign planning, or customer journey mapping. Easily customizable in Canva, it combines modern icons, bold typography, and horizontal flow to clearly visualize your marketing funnel in a compelling, structured format.


20 diapositivas
Aurumix Agency Portfolio Presentation
Make a lasting impression with this bold and creative agency portfolio presentation. Designed to showcase your services, case studies, client success stories, and campaign strategies, this template helps highlight your agency’s expertise with confidence. Fully customizable and compatible with PowerPoint, Keynote, and Google Slides for a seamless, professional presentation experience.


8 diapositivas
Meeting Agenda Presentation
Streamline your meeting agendas with our "Meeting Agenda Presentation" template. This design features a central node linked to four key points, each representing a separate agenda item, ensuring a clear and organized discussion flow. Color-coded segments aid in visually distinguishing between topics, making it easy for participants to follow and engage. Ideal for team meetings, project updates, and strategic discussions, this template enhances communication and efficiency. Its intuitive layout keeps your sessions on track and productive. Compatible with PowerPoint, Keynote, and Google Slides, it's an essential tool for any professional aiming to optimize their meeting presentations.


5 diapositivas
Lean Six Sigma Business Strategy
Present your continuous improvement plan with this visually compelling Lean Six Sigma pyramid slide. Each layer represents a key phase—Define, Measure, Analyze, Improve, and Control—making it ideal for team training, process mapping, or performance reviews. Fully editable in PowerPoint, Keynote, and Google Slides.


6 diapositivas
Multiple Choice Options Slide Presentation
Make your ideas stand out with a bold, interactive design that organizes multiple options clearly and visually. Ideal for showcasing comparisons, scenarios, or decision pathways, this presentation keeps audiences engaged and informed. Fully compatible with PowerPoint, Keynote, and Google Slides for seamless customization and professional results.