


Características


¿Tienes alguna pregunta?
Recomendar


7 diapositivas
3D Modeling Infographic
3D modeling is the process of creating three-dimensional representations of objects or scenes using specialized computer software. This infographic template is crafted to demystify the world of 3D modeling, providing a comprehensive understanding of the techniques, applications, and the creative process that brings ideas to life in the third dimension. Compatible with Powerpoint, Keynote, and Google Slides. This infographic is an invitation to the captivating universe of 3D artistry and innovation. Use this template to step into the realm where imagination meets the third dimension.


5 diapositivas
5-Year Strategic Roadmap Slide Presentation
Take your audience on a dynamic journey with a flowing, milestone-based layout that makes long-term planning feel clear and engaging. This presentation helps you map out goals, priorities, and key initiatives across five years with structure and clarity. Ideal for strategy meetings and planning sessions. Fully compatible with PowerPoint, Keynote, and Google Slides.


6 diapositivas
RAPID Responsibility Matrix Infographics
Efficiently manage responsibilities and tasks with our RAPID Responsibility Matrix infographic template. This template is fully compatible with popular presentation software such as PowerPoint, Keynote, and Google Slides, allowing you to easily customize it to meet your specific project needs. The RAPID Responsibility Matrix infographic template offers a structured framework for defining roles and responsibilities within your team or organization. Whether you're a project manager, team leader, or simply looking to streamline workflows, this template provides a user-friendly platform to create clear and concise matrices for your projects. Optimize your project management processes with this SEO-optimized RAPID Responsibility Matrix infographic template, thoughtfully designed for clarity and ease of use. Customize it to assign and communicate responsibilities effectively, ensuring smooth collaboration and project success. Start crafting your personalized infographic today!


4 diapositivas
Banking Products and Credit Overview Presentation
Make your next presentation feel like a swipe of a card—clear, sleek, and purposeful. This layout is perfect for explaining the differences between financial products, highlighting banking services, and breaking down credit-related insights. Fully customizable and professionally designed for PowerPoint, Keynote, and Google Slides, it's ideal for any financial overview presentation.


21 diapositivas
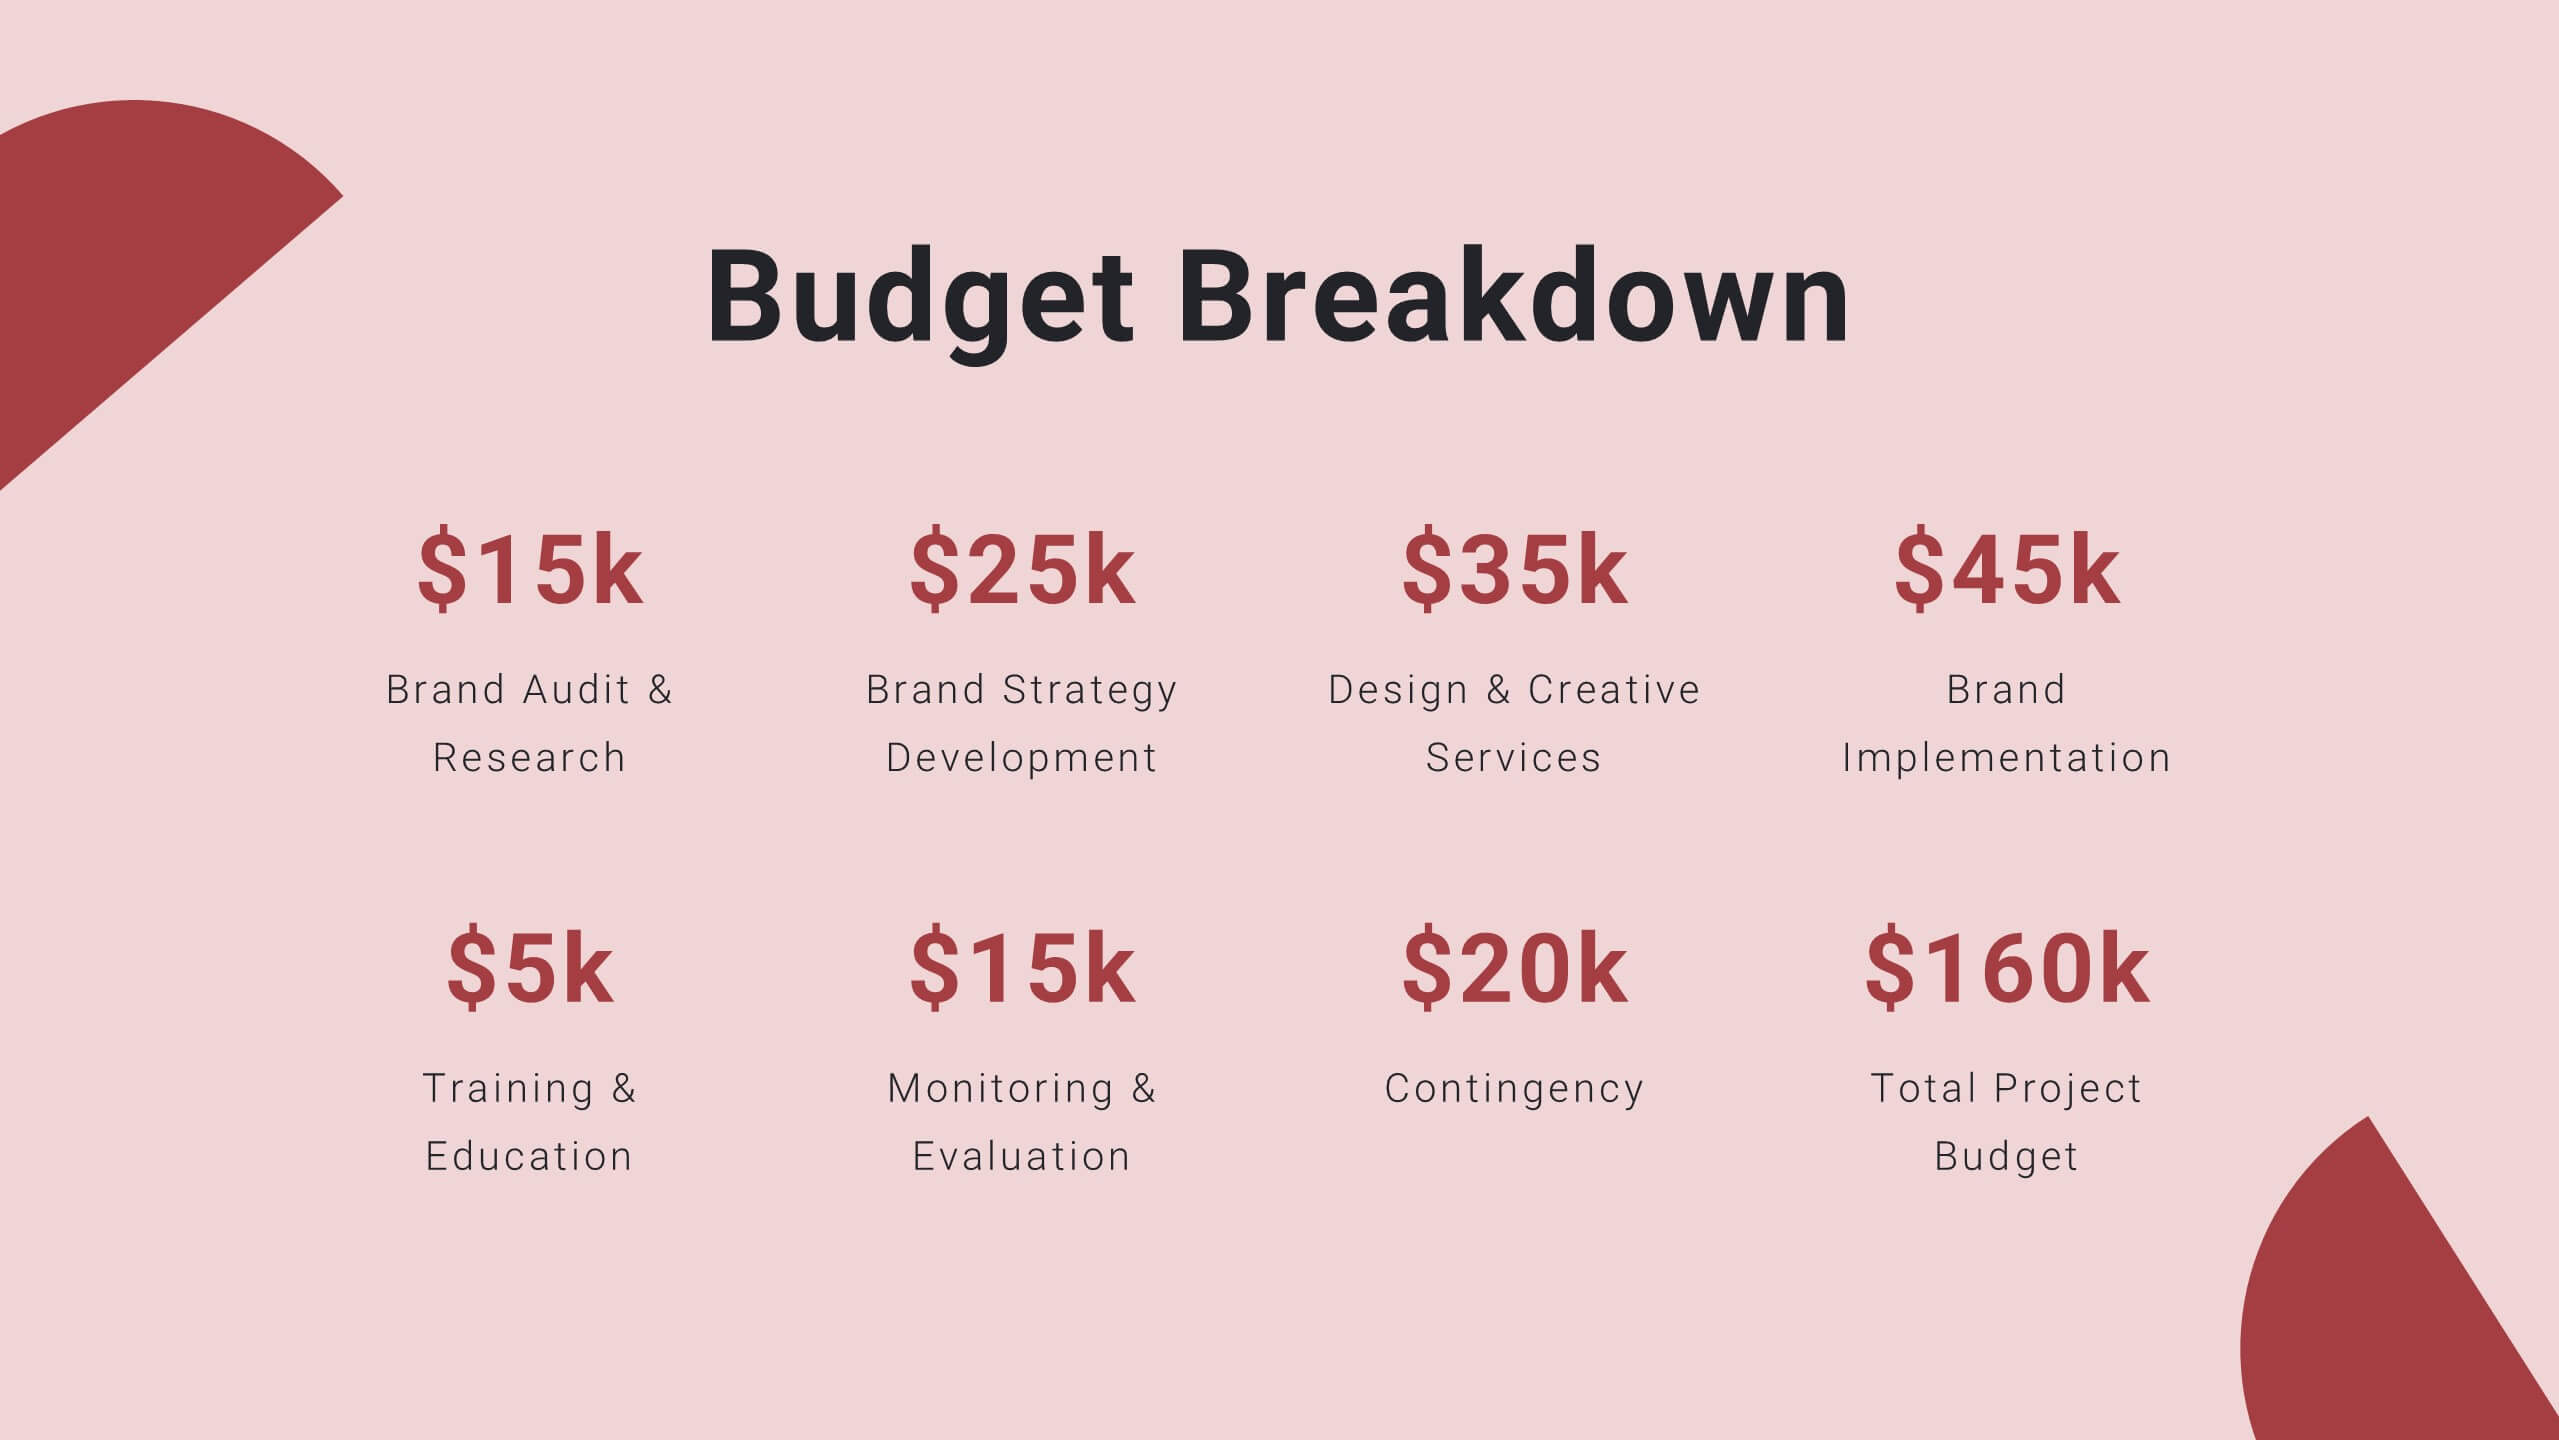
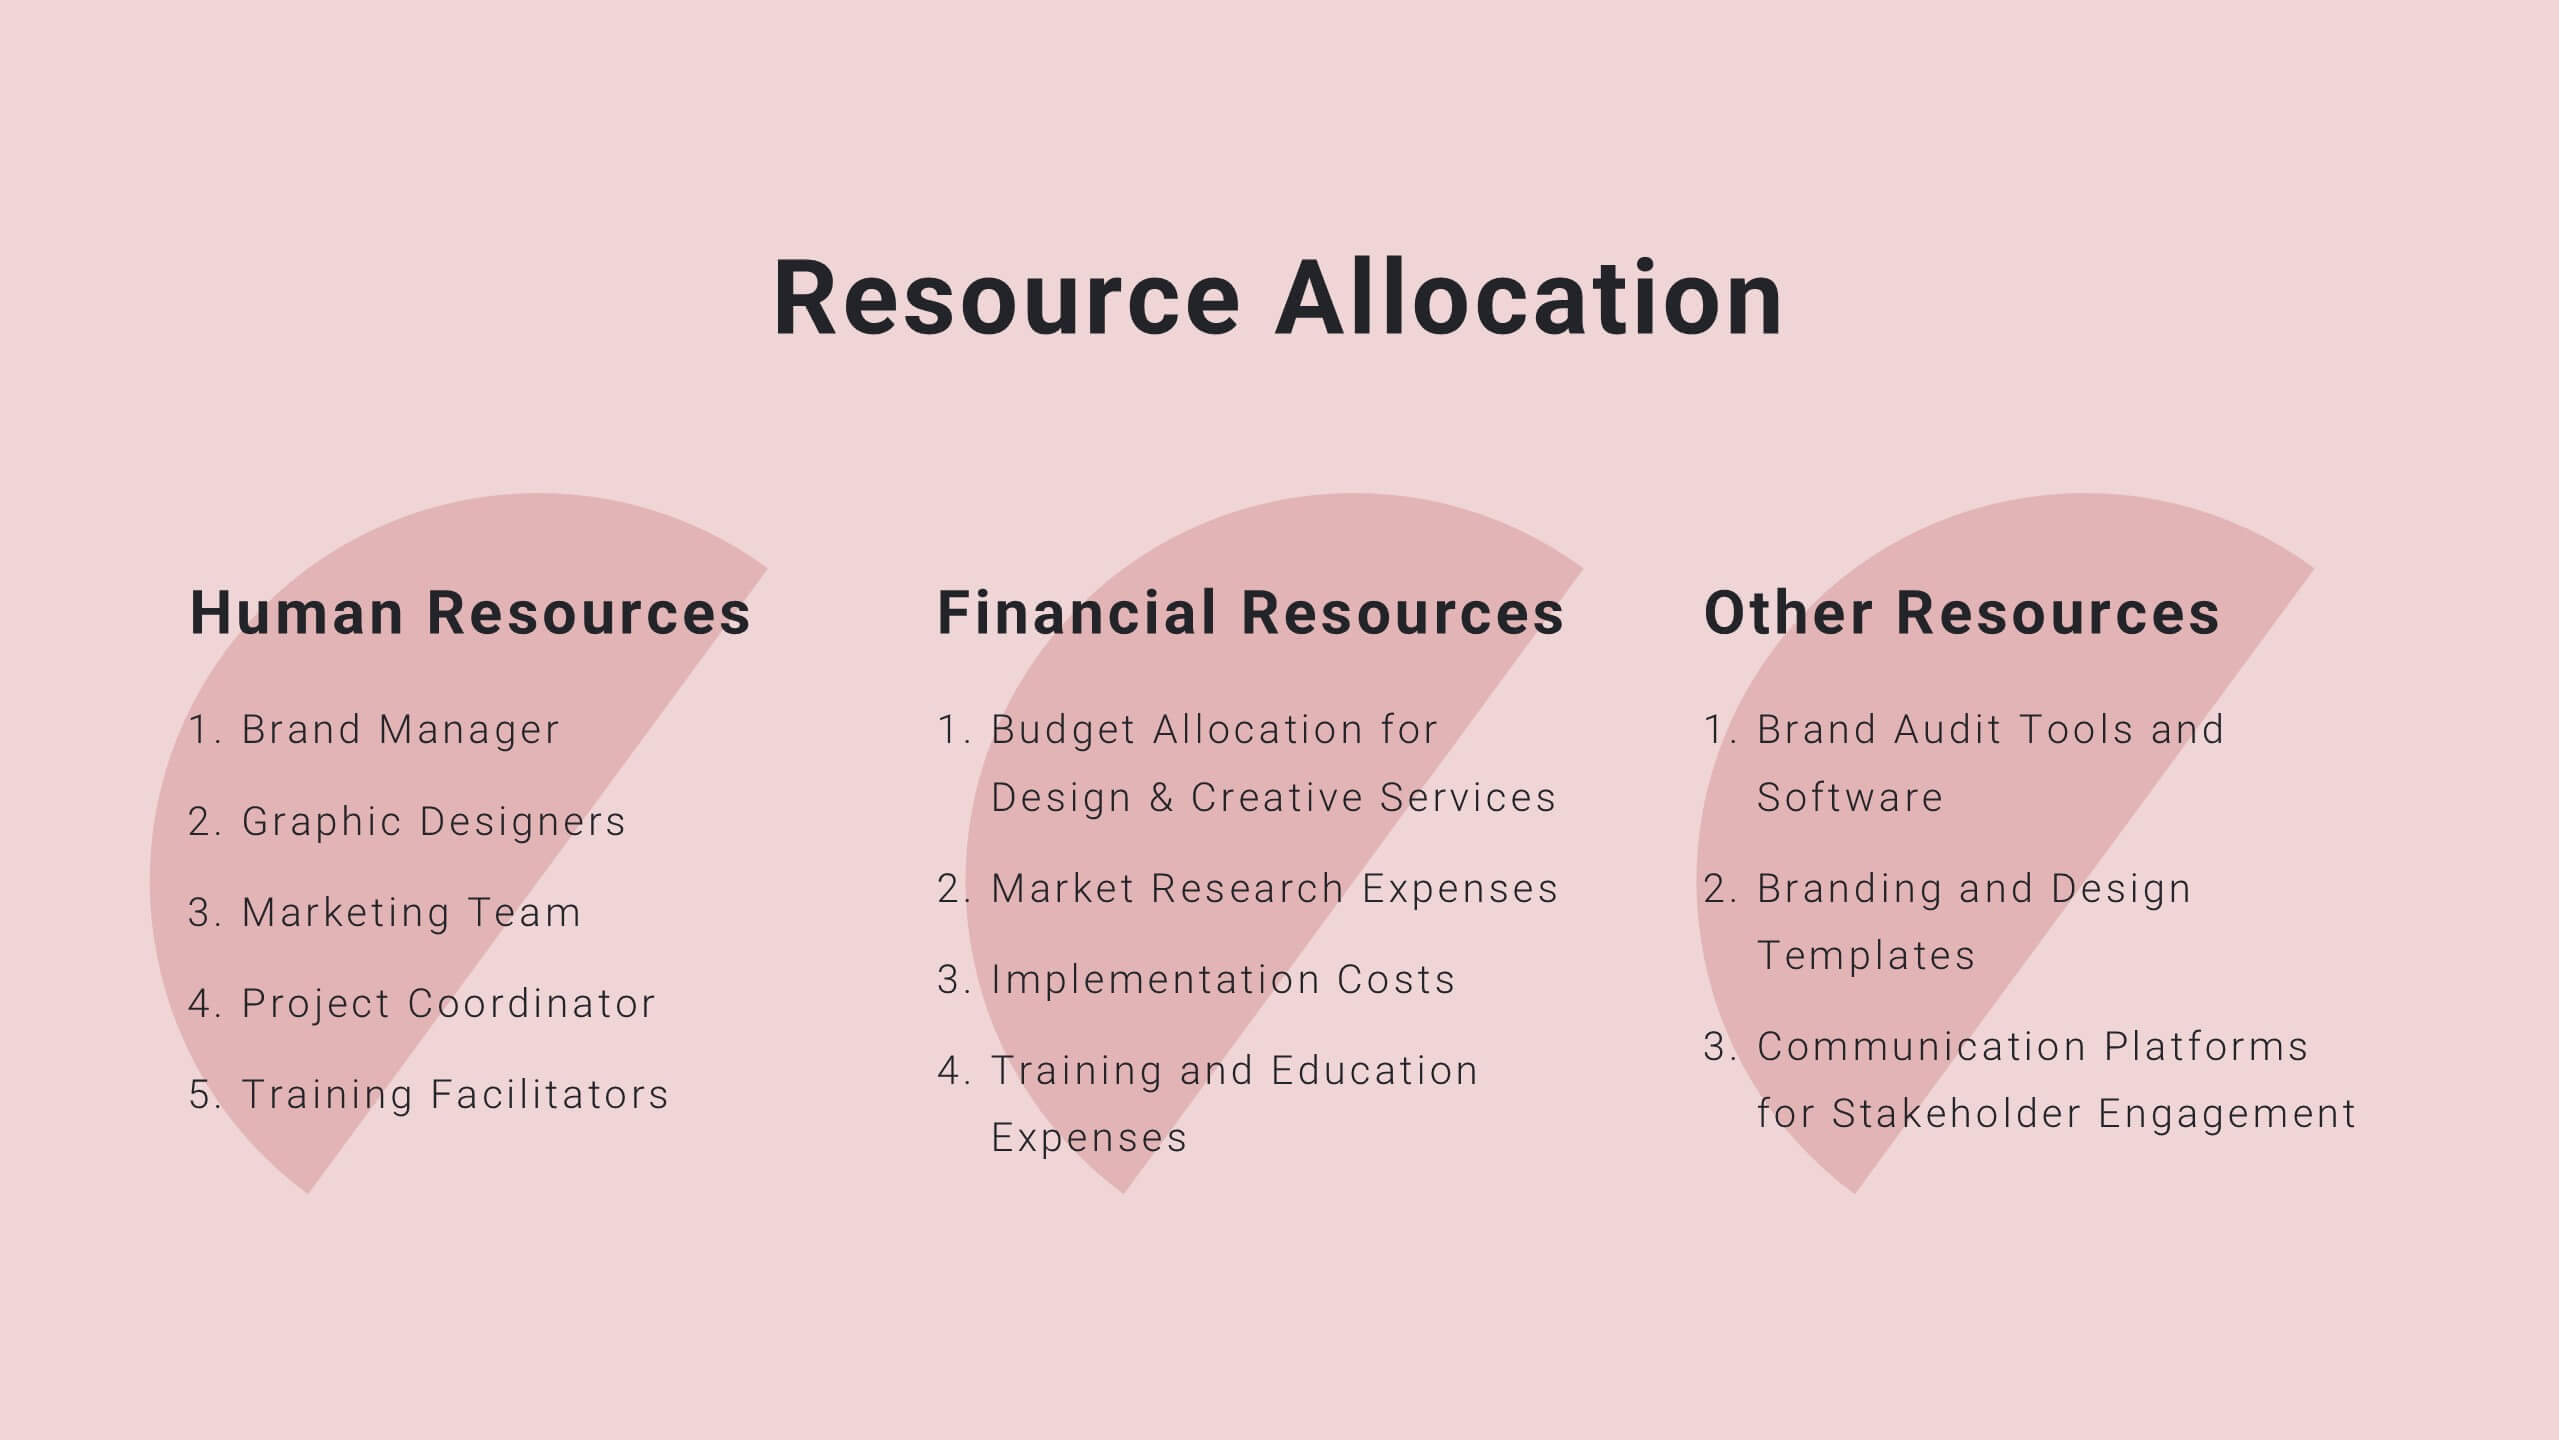
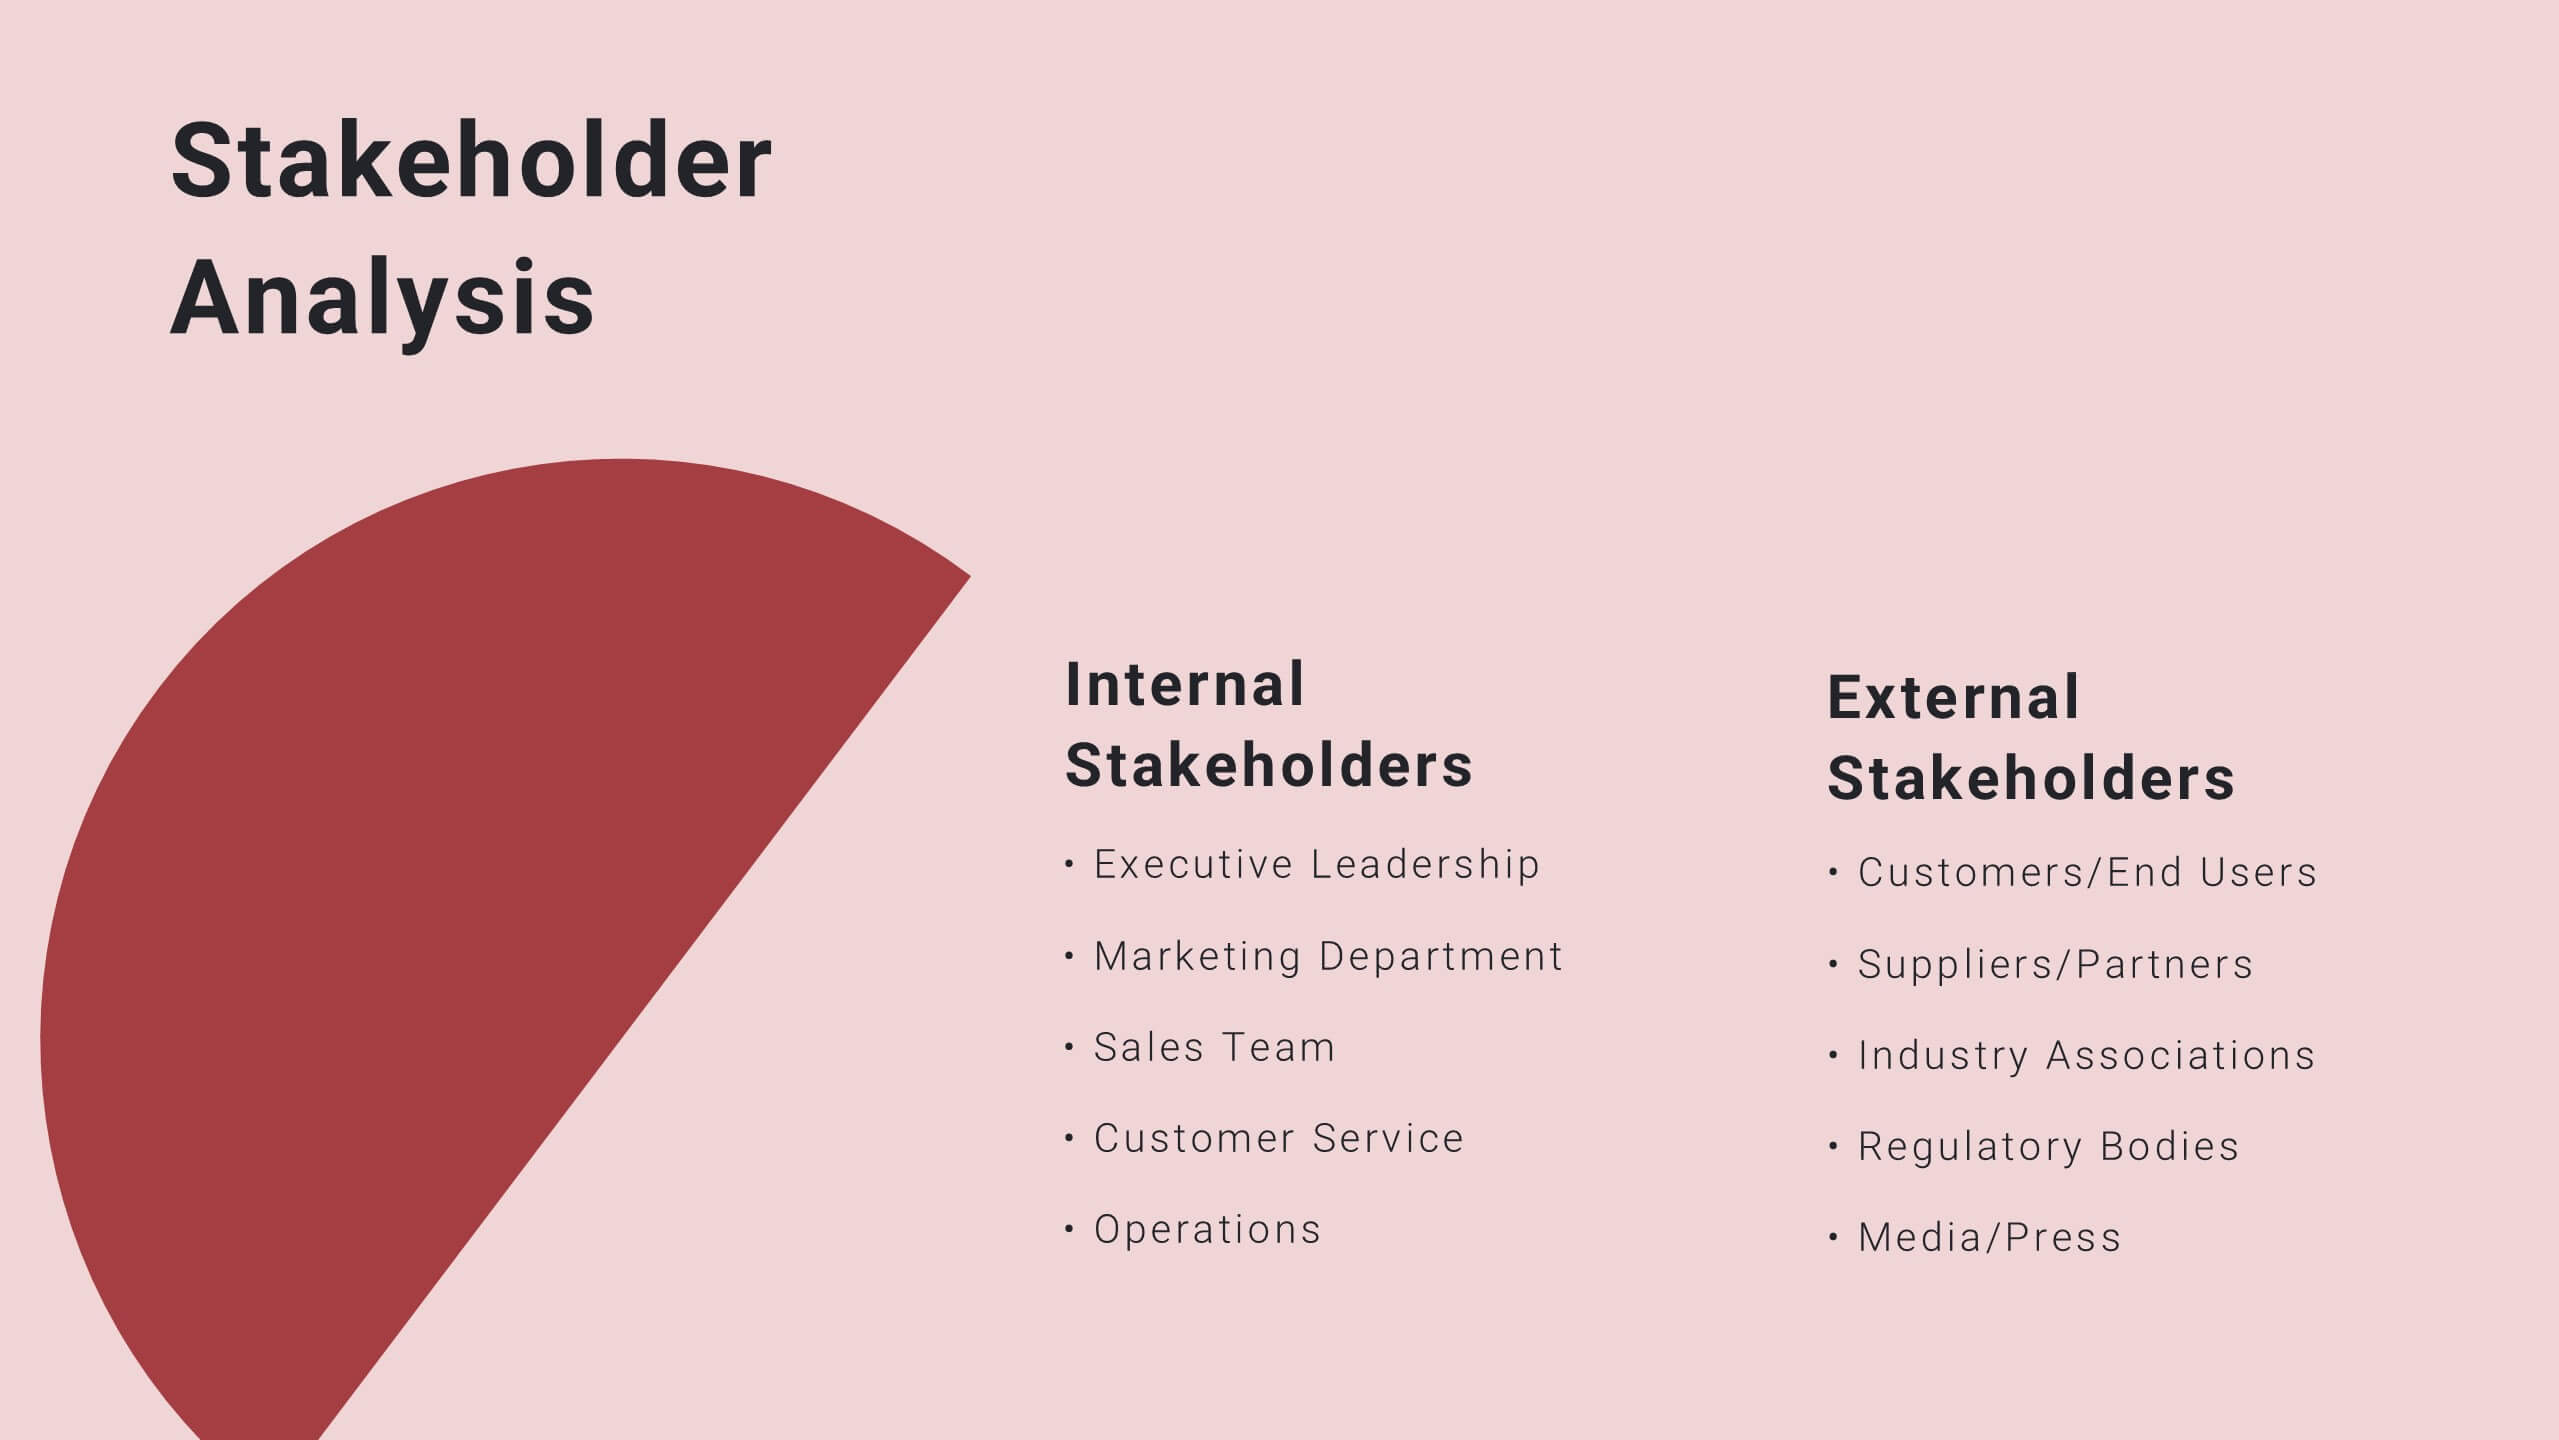
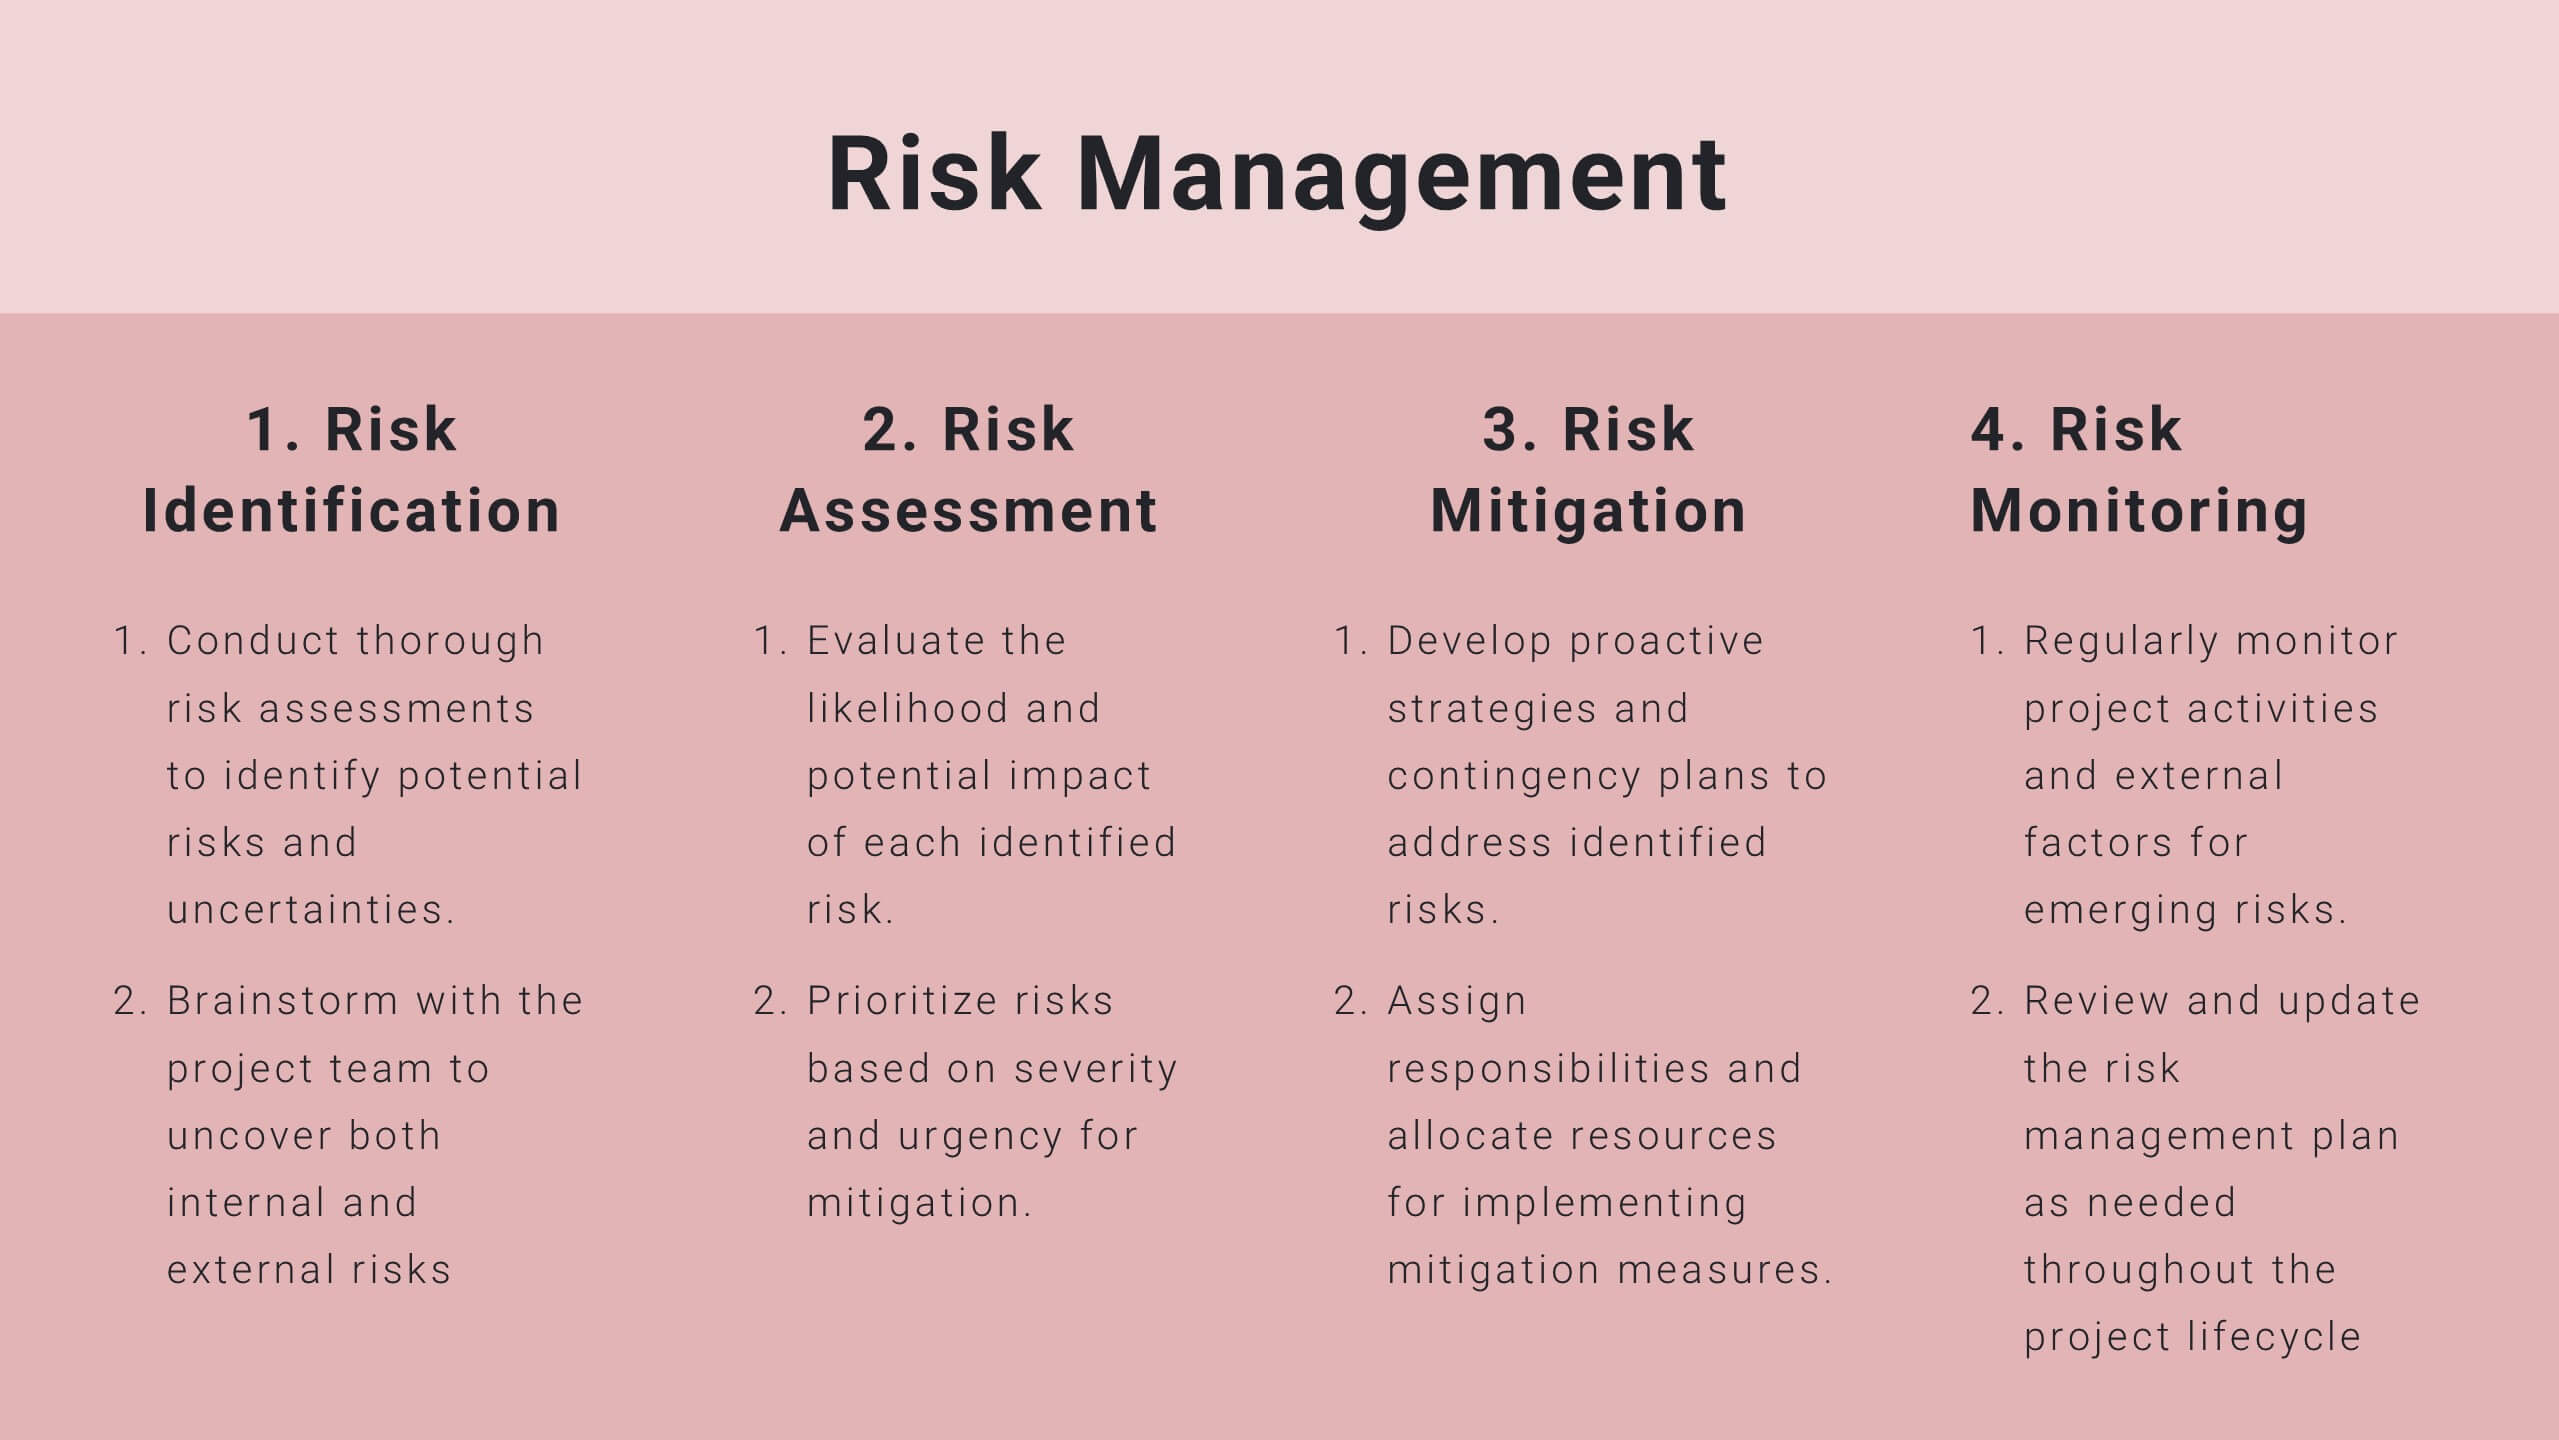
Twilight Project Milestones Report Presentation
Present your project milestones and plan with clarity using this sleek project proposal template! It includes sections for objectives, timelines, budget breakdowns, and risk management. Perfect for organizing and presenting complex project plans, it’s fully customizable and compatible with PowerPoint, Keynote, and Google Slides, ensuring a professional presentation every time.


5 diapositivas
Property Investment Analysis
Visualize property performance, investment comparisons, or growth strategies using this colorful building-height layout. Ideal for real estate agents, financial consultants, and property developers seeking to present tiered data clearly. Fully customizable in PowerPoint, Keynote, and Google Slides.


3 diapositivas
Work from Home Setup and Productivity Plan Presentation
Ready to supercharge your productivity from your kitchen table to your couch office? This visual template helps you map out ideal remote work setups, task plans, and daily focus routines. Organize workspace essentials and time blocks in a clean, engaging format. Fully compatible with PowerPoint, Keynote, and Google Slides.


20 diapositivas
Wyrmwood Design Proposal Presentation
The Startup Funding Proposal Presentation Template includes 20 sleek and professional slides covering problem statements, solutions, pricing structures, and team expertise. With its modern black-and-white aesthetic, it ensures clarity and impact. Fully editable and compatible with PowerPoint, Keynote, and Google Slides, it's perfect for startups seeking investment opportunities and partnerships.


6 diapositivas
Matrix Diagram Business Analysis Infographic
Streamline your business analysis with our Matrix Diagram Infographic Template. This versatile tool is designed for clarity and impact, helping you compare and contrast various data points. Whether you're assessing risks, evaluating performance, or categorizing information, our template provides a visually appealing and easy-to-understand matrix layout. Compatible with PowerPoint, Google Slides, and Keynote, it's the perfect addition to your business presentations. With its customizable design, you can tailor the colors, shapes, and text to fit your specific needs. Use this template to bring a professional edge to your strategic planning and stakeholder communication.


5 diapositivas
History Timeline Infographics
A History Timeline is a visual representation of events and their chronological order over a specific period of time. These infographic templates are designed to help you organize and understand historical events by presenting them in a sequential manner. It offers a visually engaging way to present the information and create a clear understanding of the sequence and significance of events. They showcases the chronological sequence of historical events, developments, or milestones. Using this template will help your audience grasp the sequence of events and the context of historical periods, facilitating a deeper understanding and appreciation of history.


7 diapositivas
Asia Countries Map Infographic
This Asia Countries Map infographic template is ideal for presentations requiring a detailed breakdown of geographic and statistical data across Asia. Compatible with PowerPoint, Google Slides, and Keynote, it features a collection of map styles and data visualization tools including icons, bar charts, and color-coded points for easy data comparison and interpretation. The template is perfect for visualizing diverse metrics such as demographic details or social statistics, with each slide tailored to display information in a clear, engaging manner. This tool is exceptionally suited for educators, and business professionals who need to convey complex data about Asian countries.


23 diapositivas
Nightspire Strategic Planning Report Presentation
Streamline your strategic planning process with this professionally designed presentation template. Covering key areas such as market analysis, SWOT assessment, milestones, and resource allocation, this template is ideal for businesses and project teams. Fully editable and compatible with PowerPoint, Keynote, and Google Slides.


20 diapositivas
Blaze UX UI Design Pitch Deck Presentation
Craft a visually stunning pitch that brings your UX/UI design process to life with this sleek and modern presentation template. From concept development to final prototypes, each slide is designed to showcase research, wireframes, typography, and more with a seamless, professional aesthetic. Fully compatible with PowerPoint, Keynote, and Google Slides.


4 diapositivas
Problem Tracing with Fishbone Diagram Presentation
Identify root causes clearly with the Problem Tracing with Fishbone Diagram Presentation. This template features a horizontal, fish-shaped layout with six categories represented in vertical columns, helping you trace issues back to their source. Ideal for quality control, brainstorming, and strategic reviews. Fully editable in PowerPoint, Keynote, and Google Slides.


5 diapositivas
Startup Business Plan Presentation
Launch your ideas with clarity using this Startup Business Plan slide template. The rocket-inspired visual guides your audience through five strategic stages, each labeled with editable icons and titles—perfect for pitching goals, financials, timelines, or key operations. Ideal for entrepreneurs and early-stage companies, this slide is easy to customize in PowerPoint, Keynote, or Google Slides.


10 diapositivas
Brand Loyalty and Customer Retention Presentation
Strengthen your brand’s relationship with your audience using the "Brand Loyalty and Customer Retention" presentation template. This design effectively illustrates how strong branding strategies enhance customer loyalty and retention rates. Ideal for marketers and business strategists, this template is fully compatible with PowerPoint, Keynote, and Google Slides, making it perfect for presentations aimed at improving customer engagement and business growth.


12 diapositivas
Customer Demographics Map Presentation
Showcase customer demographics effectively with our "Customer Demographics Map Presentation" template. This infographic is crafted to display the geographical distribution of customer data across the United States, using a color-coded map for clarity. Each state is marked to represent varying metrics like age, income, or product preference, facilitating easy visual comparisons and insights into market trends. Ideal for marketers, business analysts, and data scientists, this template simplifies complex demographic data for strategic presentations. It enhances understanding of customer bases and market segmentation. Compatible with PowerPoint, Keynote, and Google Slides, it's essential for detailed demographic analysis in any professional presentation.