


Características


¿Tienes alguna pregunta?
Recomendar


8 diapositivas
Customer Targeting and Persona Creation Presentation
Hook your audience with a clean, modern layout that zooms in on what really matters—your ideal customer. This customer persona template helps visualize traits, behaviors, and key targets for effective marketing. Perfect for campaign planning, branding, or audience research. Fully compatible with PowerPoint, Keynote, and Google Slides.


20 diapositivas
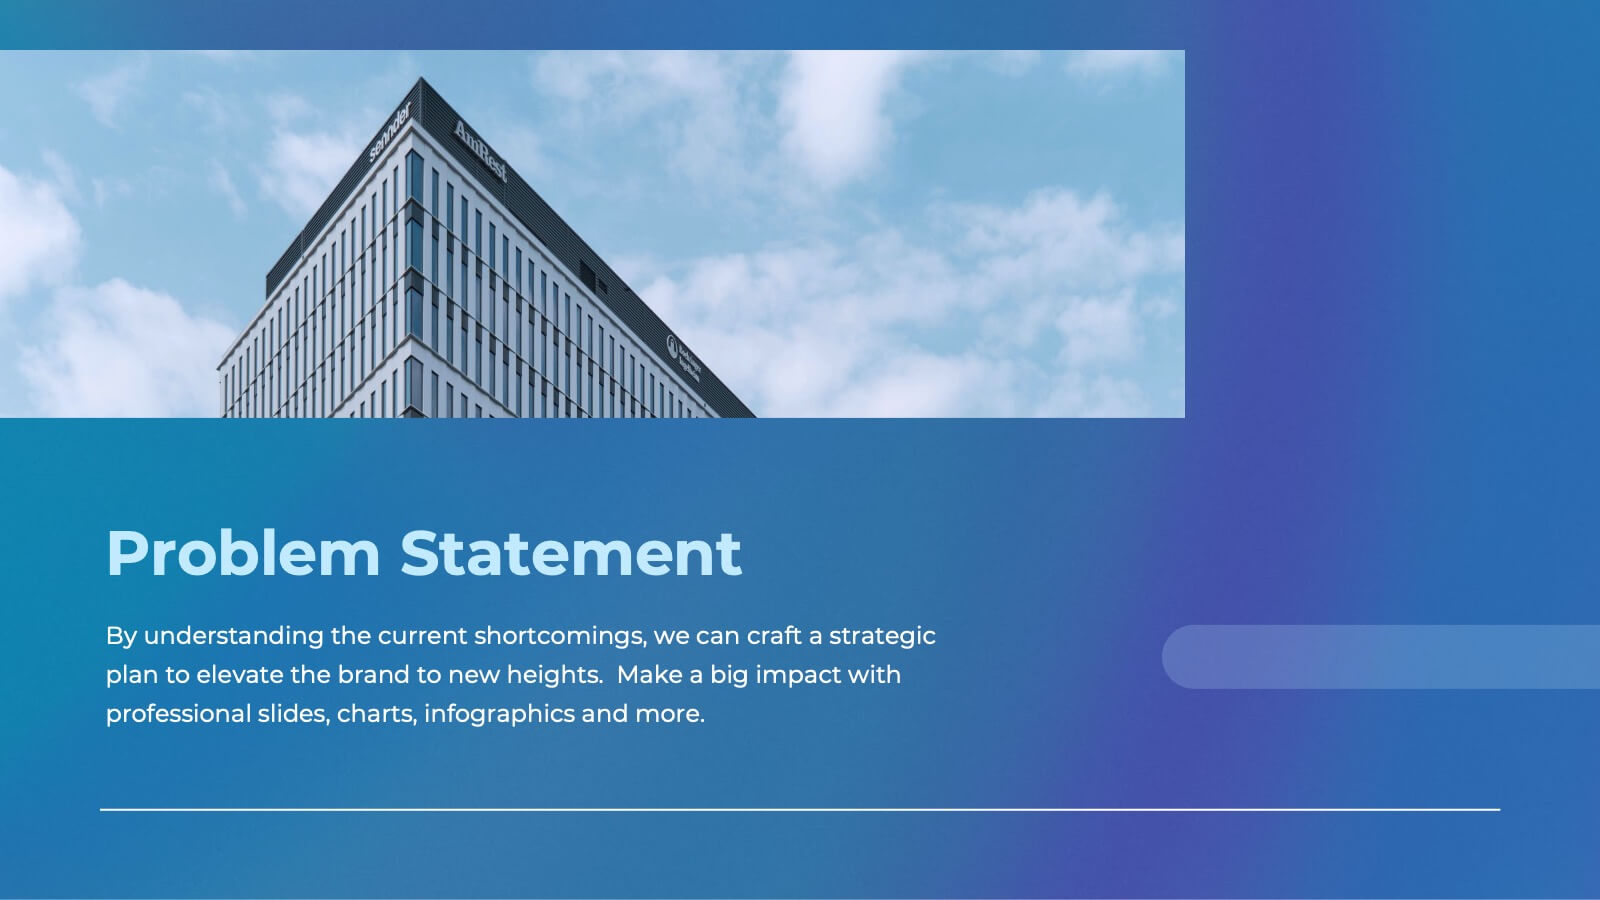
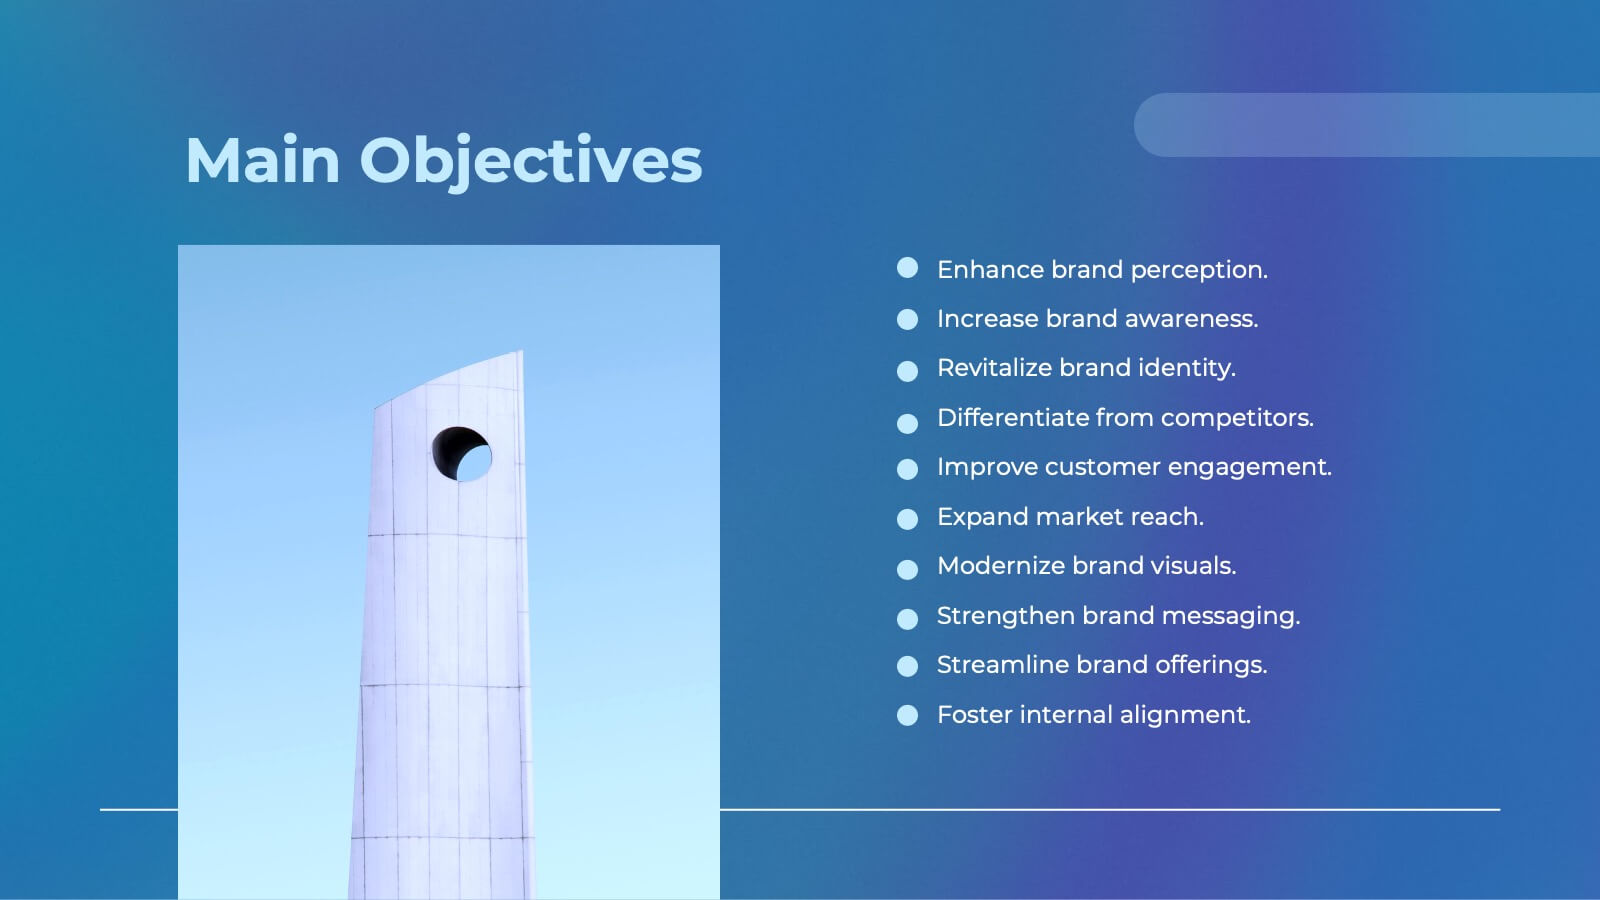
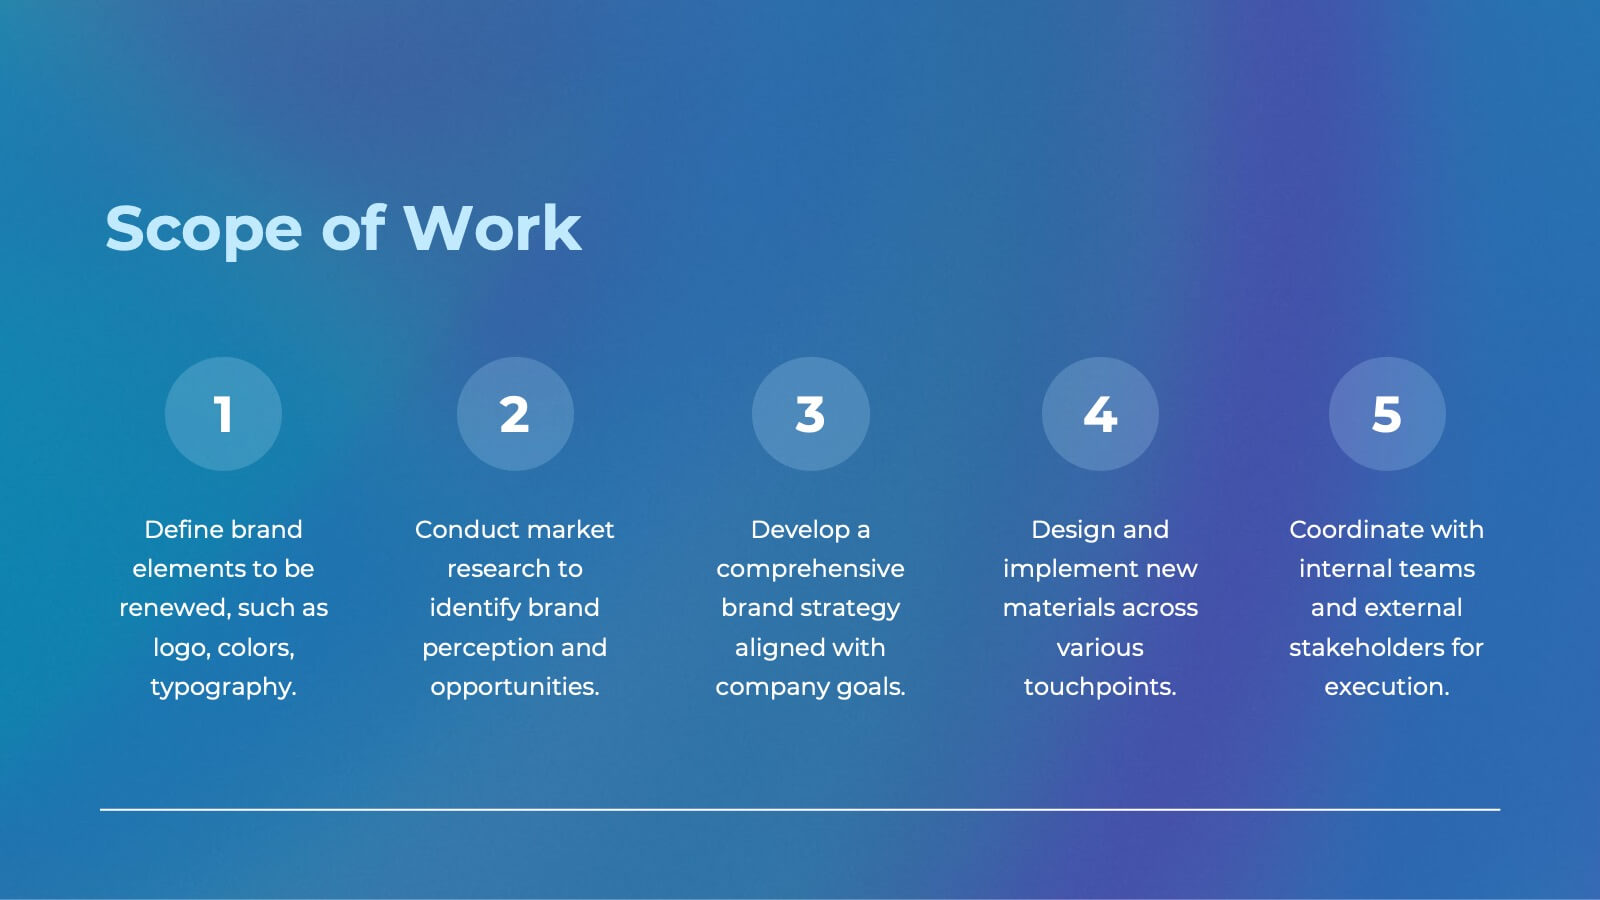
Venus Design Proposal Presentation
Present your design proposal with confidence using this sleek and professional layout! It includes everything from problem statements and proposed solutions to budget breakdowns, milestones, and team expertise, ensuring every detail is covered. Ideal for client presentations or internal project pitches, this template is fully compatible with PowerPoint, Keynote, and Google Slides.


7 diapositivas
Hospital Operations and Medical Services Presentation
Showcase hospital services, departments, or medical workflows with the Hospital Operations and Medical Services Presentation. Featuring a central hospital graphic with six surrounding icons, this slide is ideal for healthcare strategy, facility overviews, or operational planning. Easily editable in Canva, PowerPoint, Keynote, and Google Slides for versatile use in any healthcare setting.


8 diapositivas
Brainstorming Visualization
Spark creativity with the Brainstorming Visualization Presentation—a dynamic diagram built to energize your ideation process. Featuring a lightning bolt cloud as the central symbol, this layout radiates out to four key thought nodes, each with space to highlight insights, solutions, or topics. Ideal for team ideation, strategic planning, or mind mapping. Fully editable in PowerPoint, Keynote, and Google Slides.


26 diapositivas
From Side Projects to Startups Presentation Template
Elevate your entrepreneurial journey with this vibrant and adaptable presentation template, designed to take your side project to startup success. Featuring bold colors and clean layouts, the slides are crafted to effectively highlight your ideas, strategies, and progress. The template includes infographics, timelines, and charts to present complex information clearly and concisely. It also offers dedicated sections for team introductions, market analysis, and financial projections, ensuring a comprehensive narrative. Fully customizable to match your branding, you can adjust fonts, colors, and layouts to reflect your unique vision. This template is compatible with PowerPoint, Google Slides, and Keynote, offering flexibility and ease of use across platforms. Ideal for pitching to investors, presenting at events, or structuring your internal plans, this tool helps you communicate your message with clarity and style. Turn your vision into reality with a design that inspires confidence and drives impact.


6 diapositivas
SEO Strategy and Keyword Mapping Presentation
Streamline your digital strategy with this SEO mapping layout that blends structure and simplicity. Designed to help visualize keyword clusters, content priorities, and search intent stages, this infographic makes complex strategies feel approachable. It’s easy to edit and perfect for presentations in PowerPoint, Keynote, or Google Slides.


5 diapositivas
Revenue and Cost Breakdown Presentation
Present your financial insights with clarity using this 4-point revenue and cost analysis layout. Ideal for summarizing earnings, expenses, or budget comparisons. The circular icon design keeps information clean and engaging. Fully customizable in Canva, PowerPoint, or Google Slides to fit your brand’s data and presentation needs.


7 diapositivas
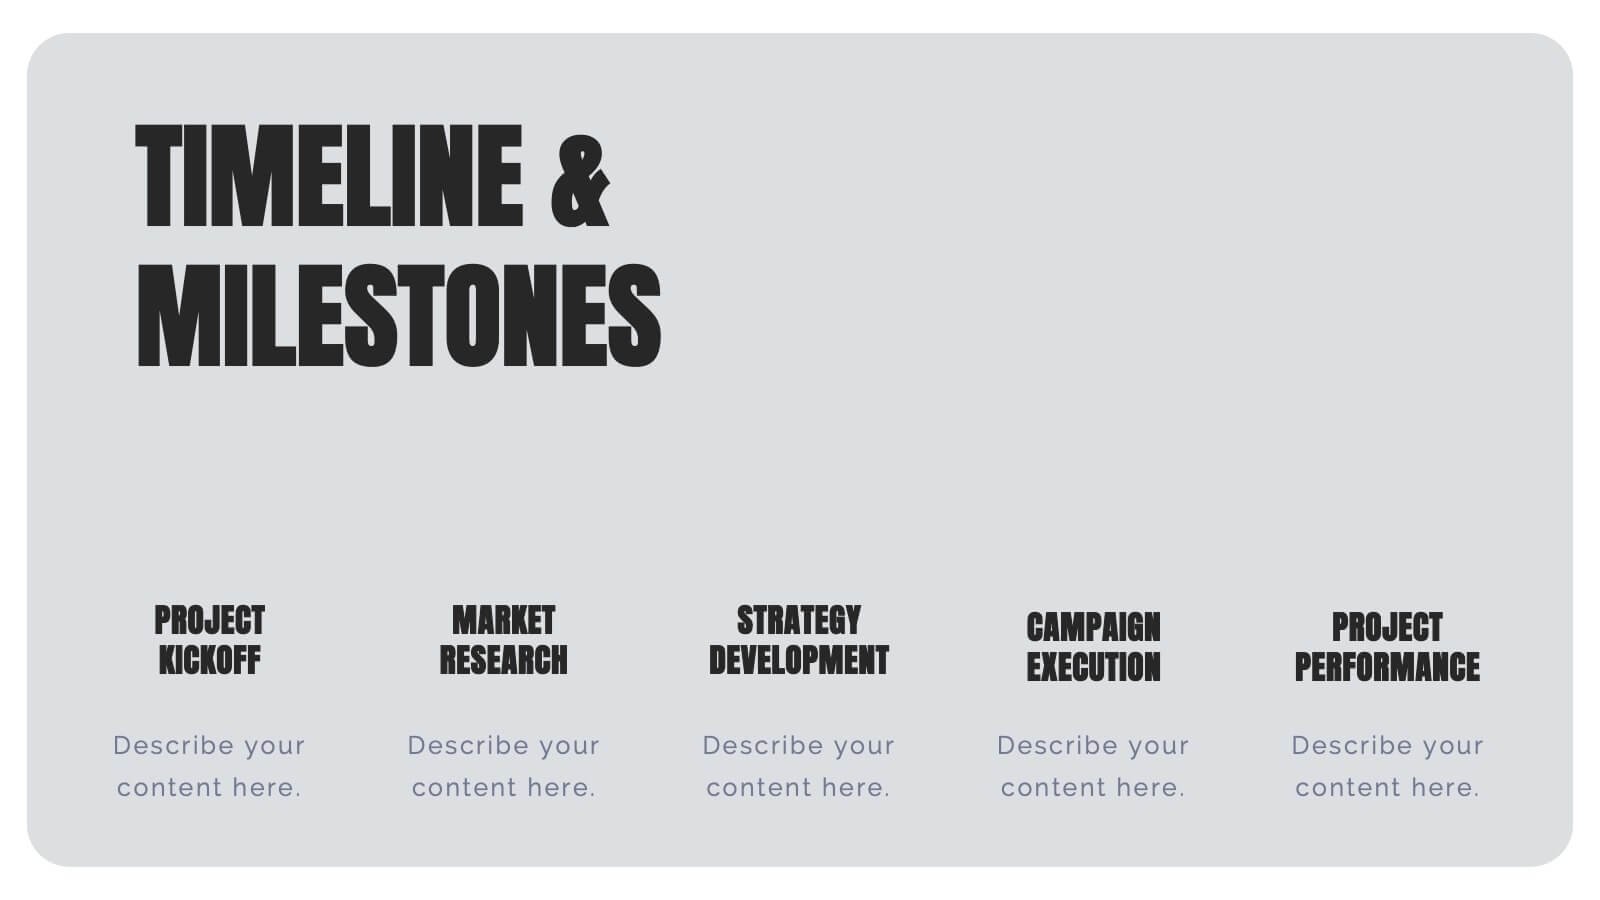
Project Timeline Presentation
Visualize key milestones with this project timeline presentation template. Designed to highlight each phase with clarity, it's perfect for project managers, planners, and teams tracking progress. The horizontal layout, color-coded steps, and year indicators make it easy to customize in PowerPoint, Keynote, or Google Slides for any industry.


8 diapositivas
TAM SAM SOM Market Analysis Presentation
Define Your Market Potential Clearly with this TAM SAM SOM Market Analysis Presentation template. Designed to break down Total Addressable Market (TAM), Serviceable Available Market (SAM), and Serviceable Obtainable Market (SOM), this structured layout helps startups, investors, and business analysts showcase market opportunities and growth potential. Fully customizable and compatible with PowerPoint, Keynote, and Google Slides, this template is perfect for fundraising pitches, strategic planning, and competitive analysis.


6 diapositivas
SEO Services Infographic
Search Engine Optimization services are specialized strategies and practices aimed at improving a website's visibility and ranking in search engine results pages. The goal of SEO is to increase organic traffic to a website by optimizing various elements, such as content, keywords, website structure, and more. This template is designed to provide an overview of the different aspects of SEO that the agency specializes in. This Infographic is a valuable tool for SEO agencies to showcase their expertise, services, and track record to potential clients. This template is compatible with Powerpoint, Keynote, and Google Slides.


3 diapositivas
Business Ethics and Legal Guidelines Presentation
Navigate the complexities of corporate governance with the "Business Ethics and Legal Guidelines" template, designed to simplify and clarify the presentation of legal standards and ethical expectations in business environments.This visually engaging layout helps emphasize the progression and importance of each principle, ensuring clarity in communication. Ideal for training modules, compliance meetings, or strategic planning sessions, it's compatible with PowerPoint, Keynote, and Google Slides.


6 diapositivas
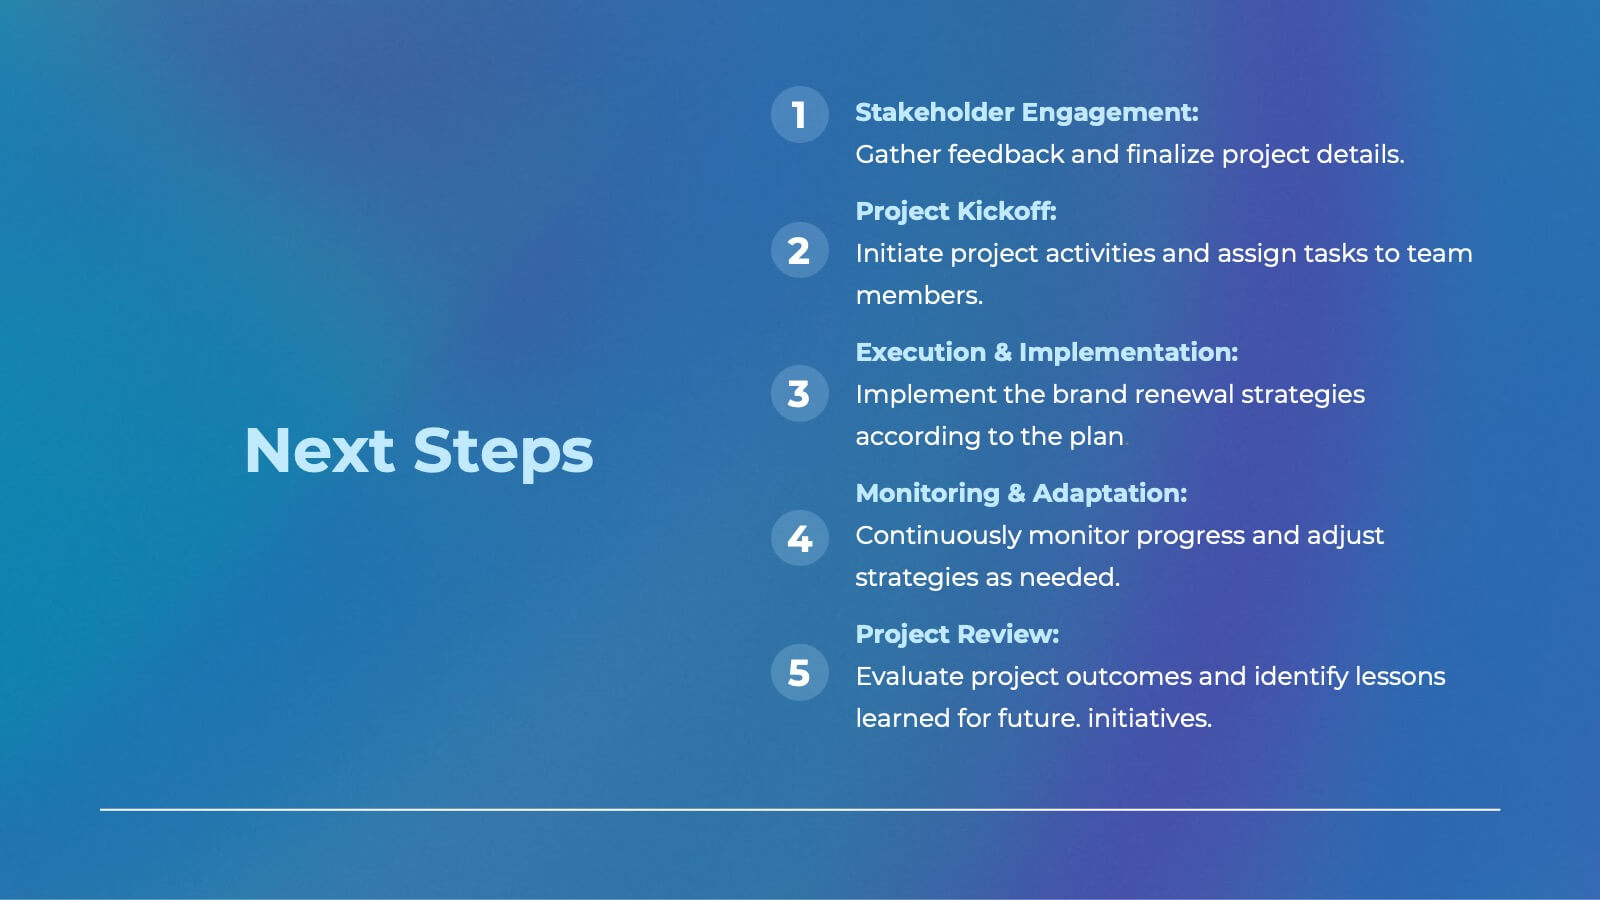
Business Plan Next Steps Presentation
Map out your strategy with the Business Plan Next Steps Presentation template. This visually structured layout helps outline key actions, milestones, and priorities for business growth and execution. Ideal for entrepreneurs, executives, and project managers, this slide ensures clarity and alignment on upcoming initiatives. Fully customizable in PowerPoint, Keynote, and Google Slides for easy integration into your planning process.


8 diapositivas
Political, Economic, Social Analysis Presentation
Highlight key external influences with the Political, Economic, Social Analysis Presentation. This clean, hexagon-based layout offers a simple yet impactful way to break down PEST factors for strategy planning, market entry, or business reports. Fully editable in PowerPoint, Canva, and Google Slides for fast, polished presentations.


7 diapositivas
Target Customer Profile Infographic
This Target Customer Profile infographic template is designed to help businesses clearly define and present their ideal customer segments. Available for PowerPoint, Google Slides, and Keynote, it includes various sections to detail demographics, customer needs, purchasing habits, and more. With a clean layout and a warm color scheme of oranges and blues, it facilitates the easy organization of customer information. Icons and comparison charts enable users to visualize customer motivations, goals, and product alignment efficiently. Ideal for marketers and business planners, this template simplifies the process of profiling target customers in a visually engaging and informative manner.


21 diapositivas
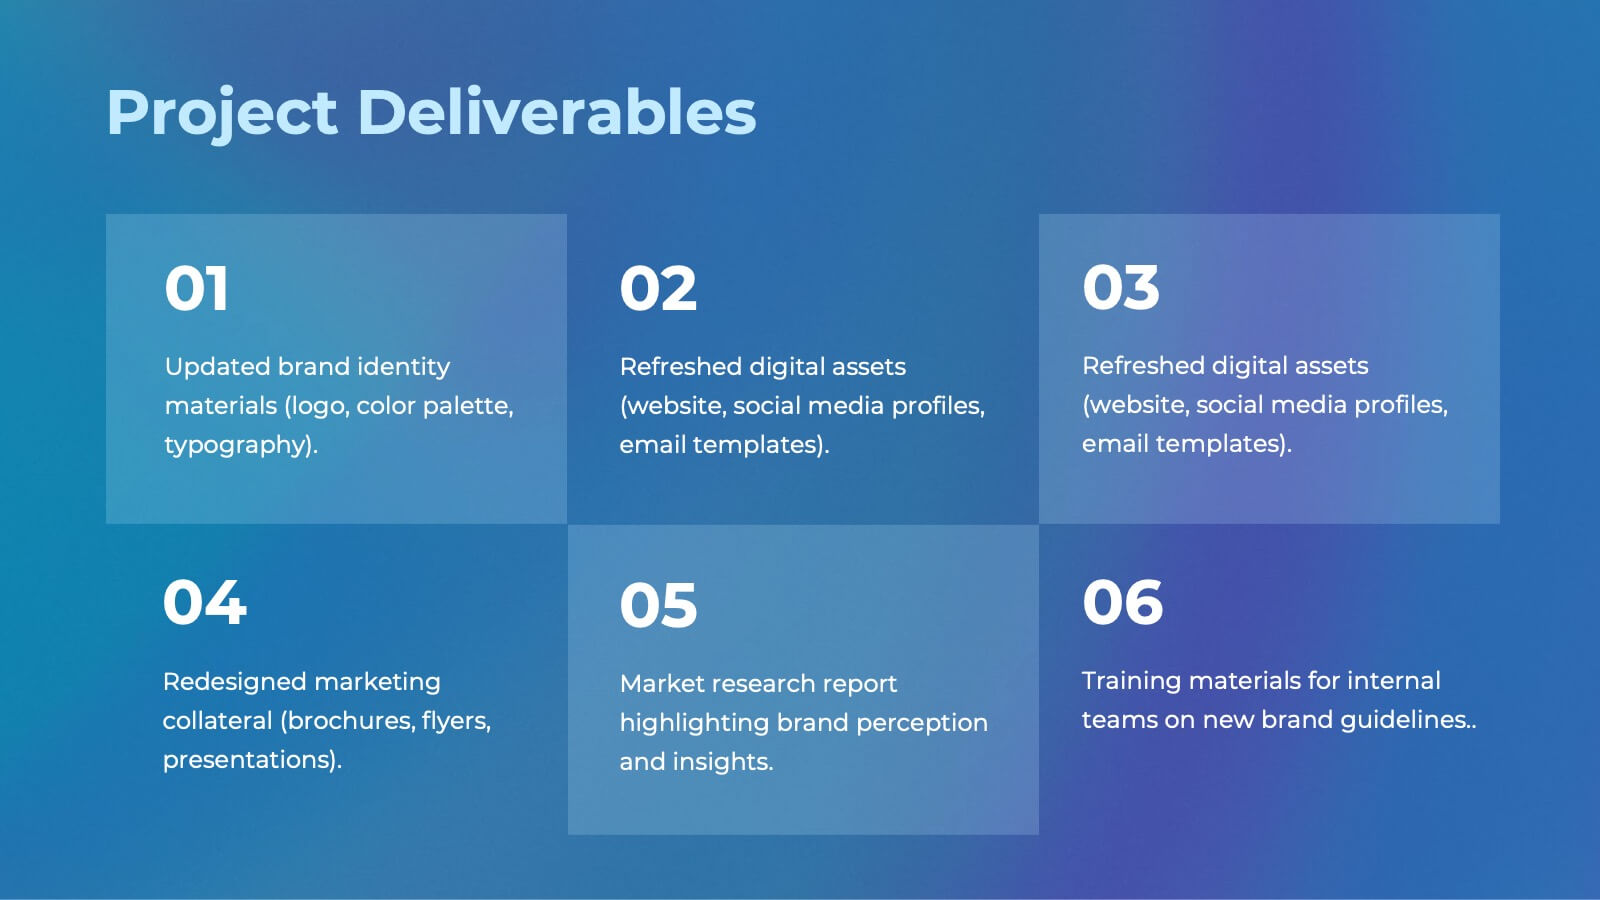
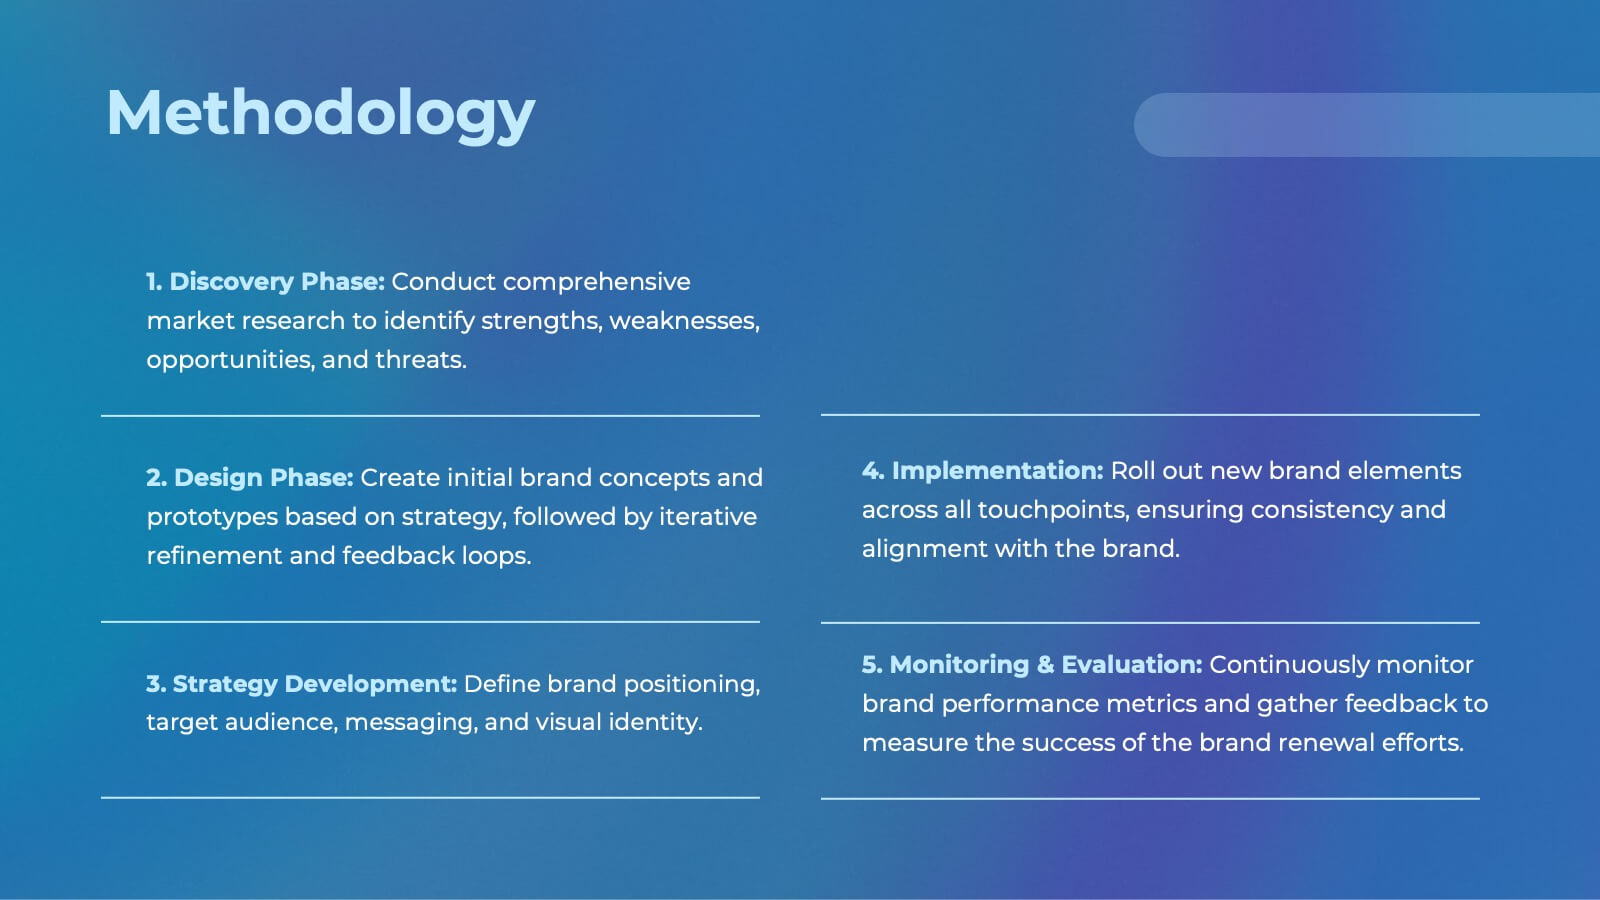
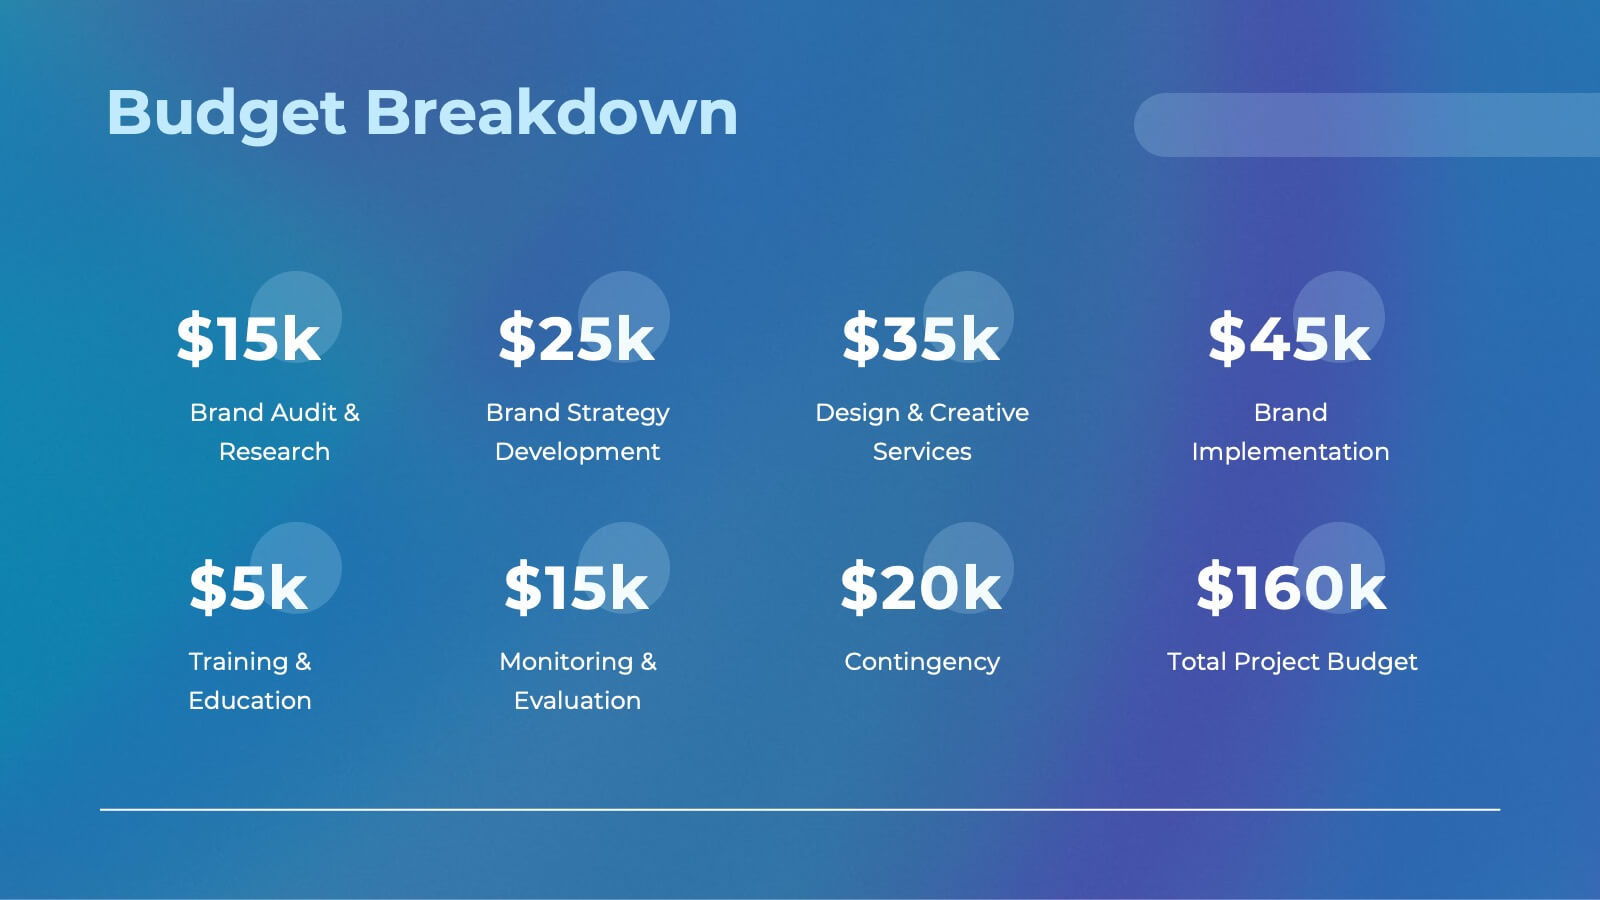
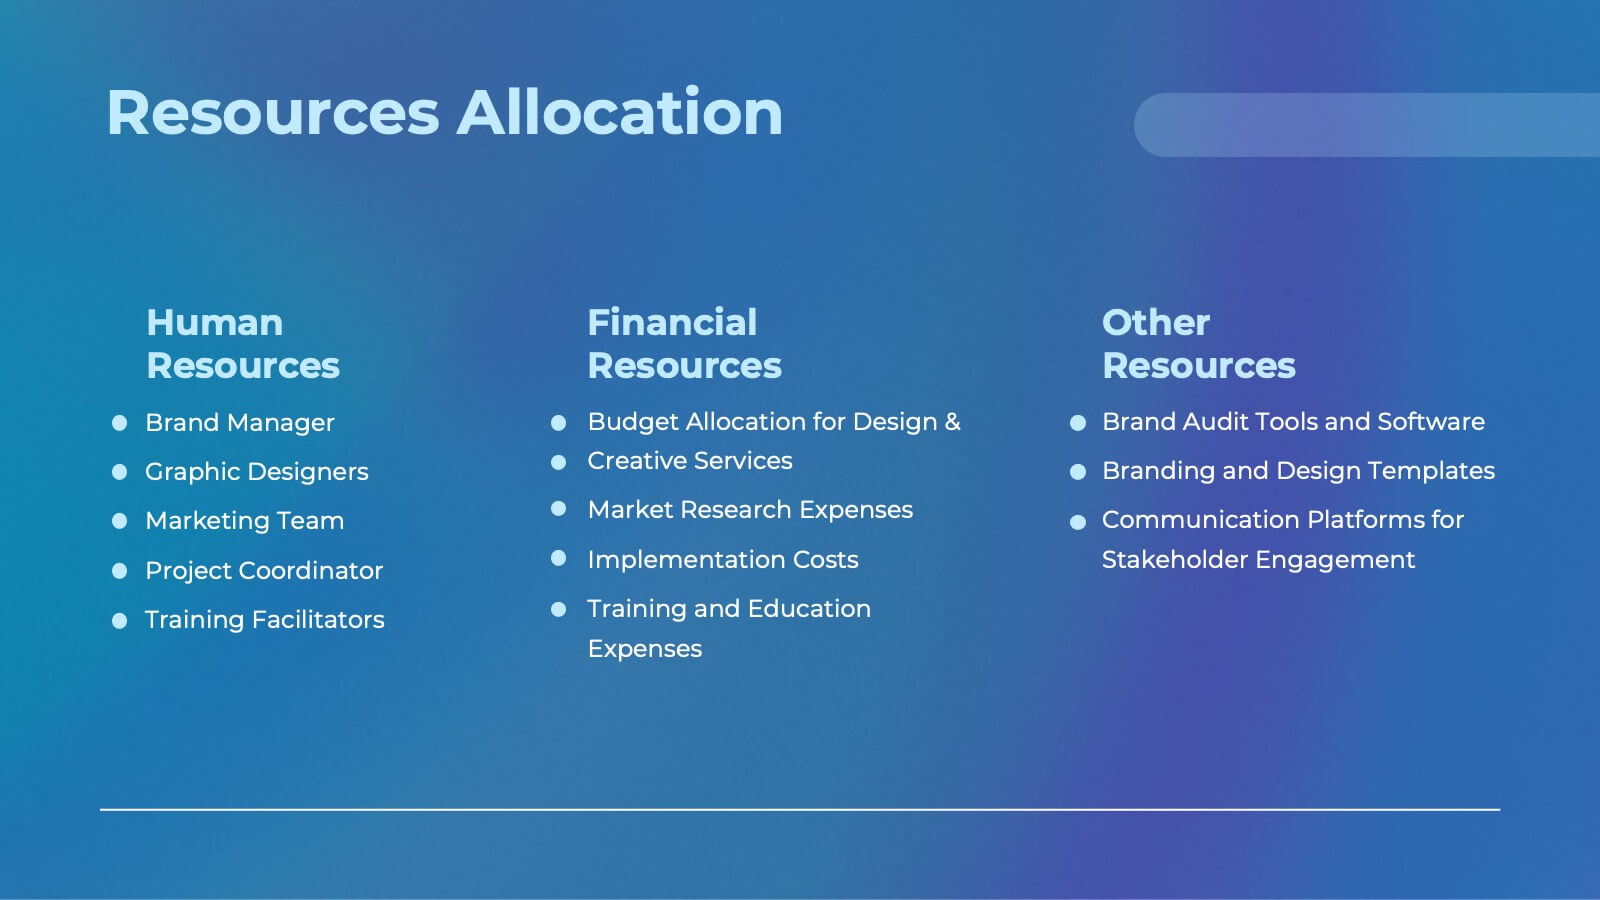
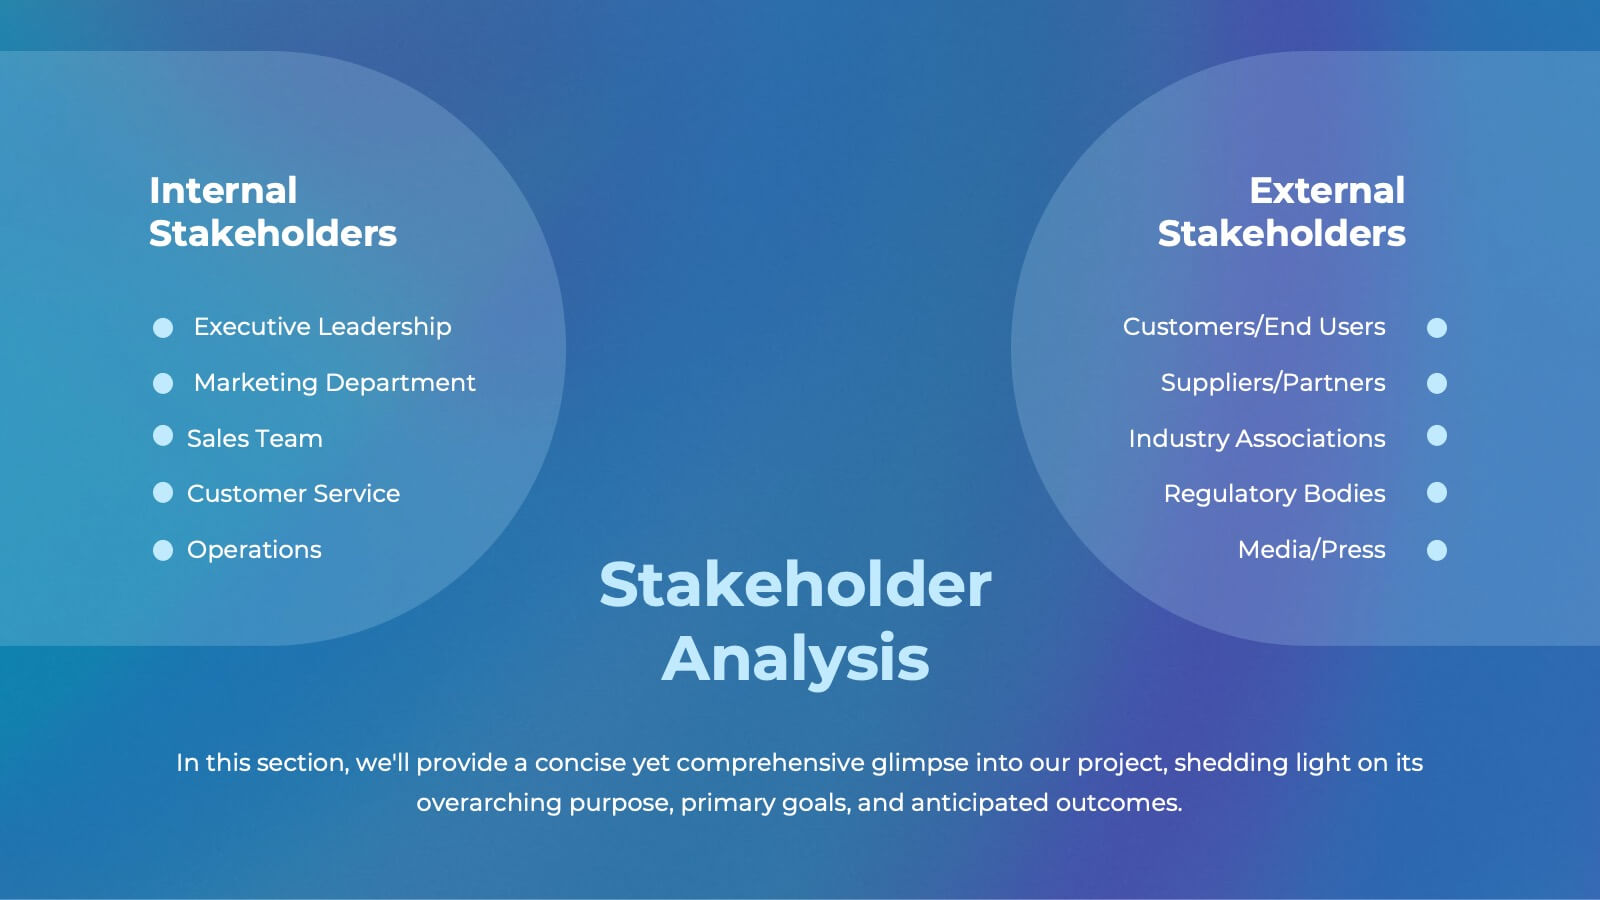
Ember Agile Project Plan Presentation
Ready to ace your next project proposal? This sleek presentation template is perfect for outlining objectives, timelines, and budgets. Designed for professionals aiming to impress stakeholders and secure approvals. Compatible with PowerPoint, Keynote, and Google Slides, it ensures a smooth and professional presentation every time. Ideal for project managers and business leaders.


6 diapositivas
Future Trends in 5G Connectivity Presentation
Showcase the evolving landscape of mobile innovation with this modern 5G trends infographic. Featuring a central smartphone graphic and five vertically aligned icons, this slide is perfect for highlighting connectivity advancements, industry shifts, and upcoming opportunities. Color-coded markers enhance clarity for presentations on telecom, IoT, smart cities, and emerging tech. Fully editable in PowerPoint, Keynote, and Google Slides.


5 diapositivas
Global Warming Impacts Infographics
Global Warming refers to the long-term increase in Earth's average surface temperature due to human activities, primarily the emission of greenhouse gases. This is a visually engaging infographic template that highlights the impacts of global warming on the environment, ecosystems, and human societies. This template is made to create an understanding of the consequences of climate change and raise awareness about the urgent need for action. The eye-catching visuals and impactful messaging, make these infographics ideal for presentations, educational material, or awareness campaigns related to global warming and environmental sustainability.