


Características


¿Tienes alguna pregunta?
Recomendar


7 diapositivas
Success Team Work Infographic
Teamwork is the collaborative effort of a group of individuals, each contributing their diverse skills, knowledge, and experiences to achieve a common goal or complete a shared task. Our success teamwork infographic is an inspiring visual tool designed to showcase the art of collaborative achievement. Celebrate the collective triumphs of teamwork and highlight how unity and synergy lead to unparalleled success. Compatible with Powerpoint, Keynote, and Google Slides. This template encourages a culture of collaboration and showcases the magic that happens when individuals unite for a common purpose.


6 diapositivas
Simple Workflow Process Presentation
Streamline your workflow presentations with this Simple Workflow Process template. Featuring a clean, step-by-step layout with intuitive lightbulb icons, it effectively visualizes processes. Fully customizable with editable colors, icons, and text to match your branding. Compatible with PowerPoint, Keynote, and Google Slides for effortless integration into your presentations.


12 diapositivas
Social and Professional Networking Presentation
Build Strong Connections with this Social and Professional Networking template. Featuring a dynamic network diagram, this slide helps visualize connections, relationships, and networking strategies in a clean, professional format. Ideal for business professionals, marketers, and career coaches, this fully editable template is compatible with PowerPoint, Keynote, and Google Slides for seamless customization.


6 diapositivas
Advanced Project Timeline with Gantt Layout
Keep complex projects on track with the Advanced Project Timeline with Gantt Layout Presentation. This slide makes it easy to outline task durations over multiple weeks, providing a clear visual of overlaps, dependencies, and pacing. Ideal for managers, teams, and stakeholders needing a structured view of multi-week initiatives. Compatible with PowerPoint, Keynote, and Google Slides for seamless updates.


6 diapositivas
Employee Change Management Strategy Presentation
Communicate change with clarity using this structured, gear-themed presentation slide. Designed to visualize six strategic stages of employee transition, it's ideal for HR professionals, team leaders, and consultants managing organizational change. Each step is represented with a numbered circle and aligned text for easy guidance. Fully customizable in PowerPoint, Keynote, and Google Slides.


20 diapositivas
Silverleaf Graphic Design Project Plan Presentation
This Graphic Design Project Plan Presentation Template offers a vibrant and modern design to showcase your creative process, key elements, and strategic goals. It includes sections for design brief, target audience, moodboard, prototypes, and implementation. Ideal for agencies and designers, fully customizable in PowerPoint, Keynote, and Google Slides.


5 diapositivas
Real Estate Market Infographics
The Real Estate Market refers to the buying, selling, and renting of properties, including residential, commercial, and industrial properties. These infographic templates are a valuable tool for real estate professionals, investors, or anyone interested in understanding and presenting key information about the real estate market. With its visually appealing design and informative content it provides an overview of the real estate market and serves as a powerful visual aid for presentations or reports. Showcase key data and trends in the real estate market. It is compatible with PowerPoint, Keynote, and Google Slides.
21 diapositivas
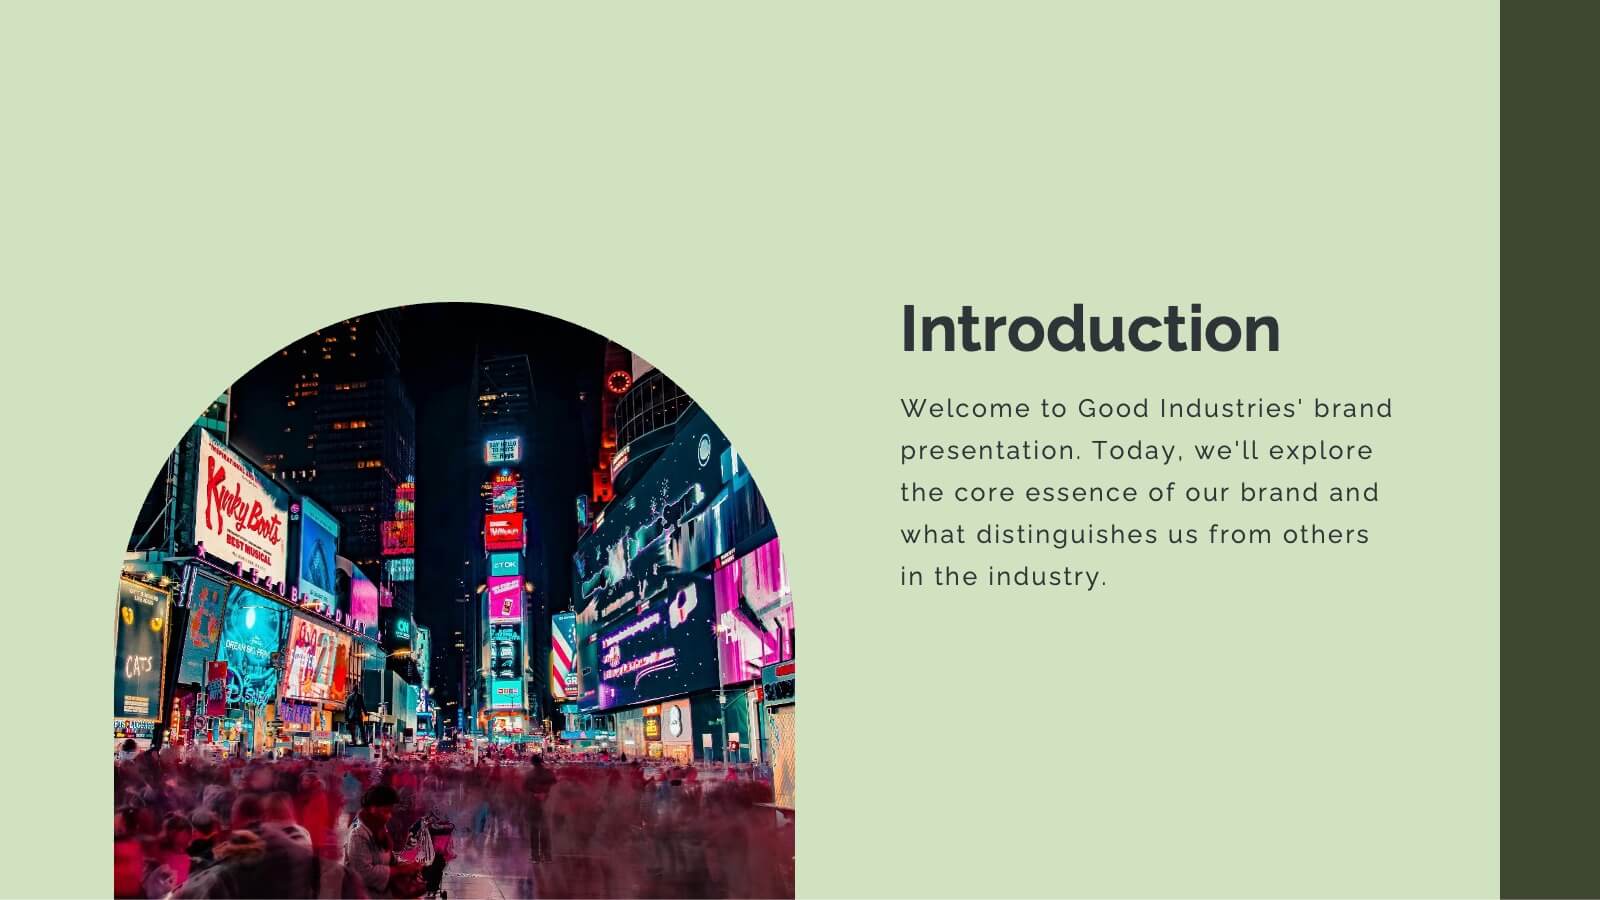
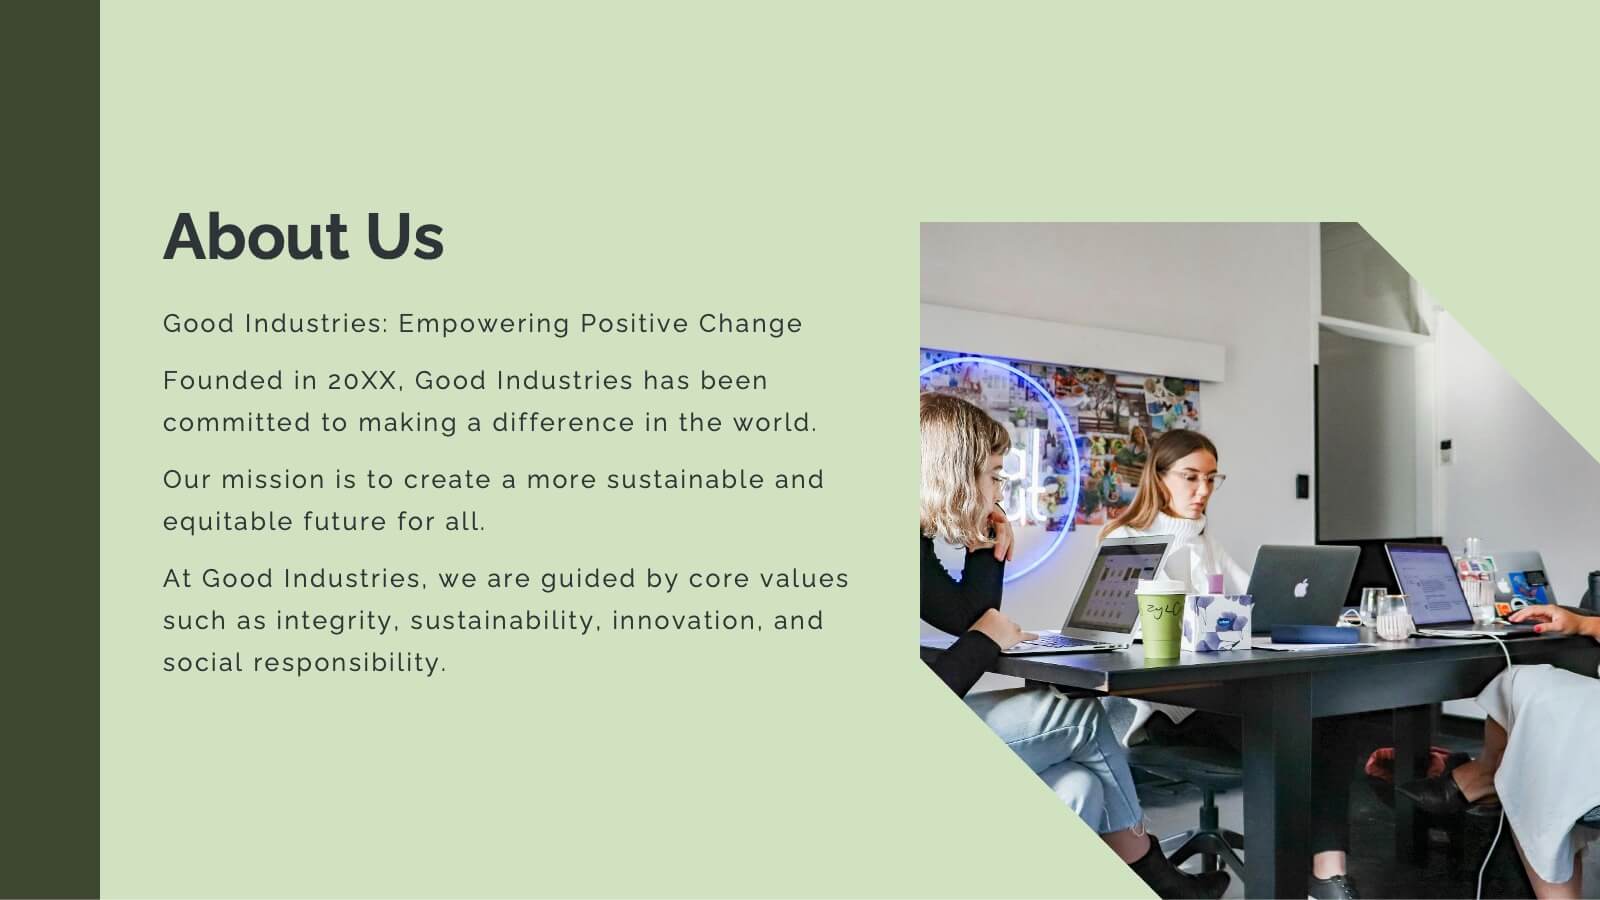
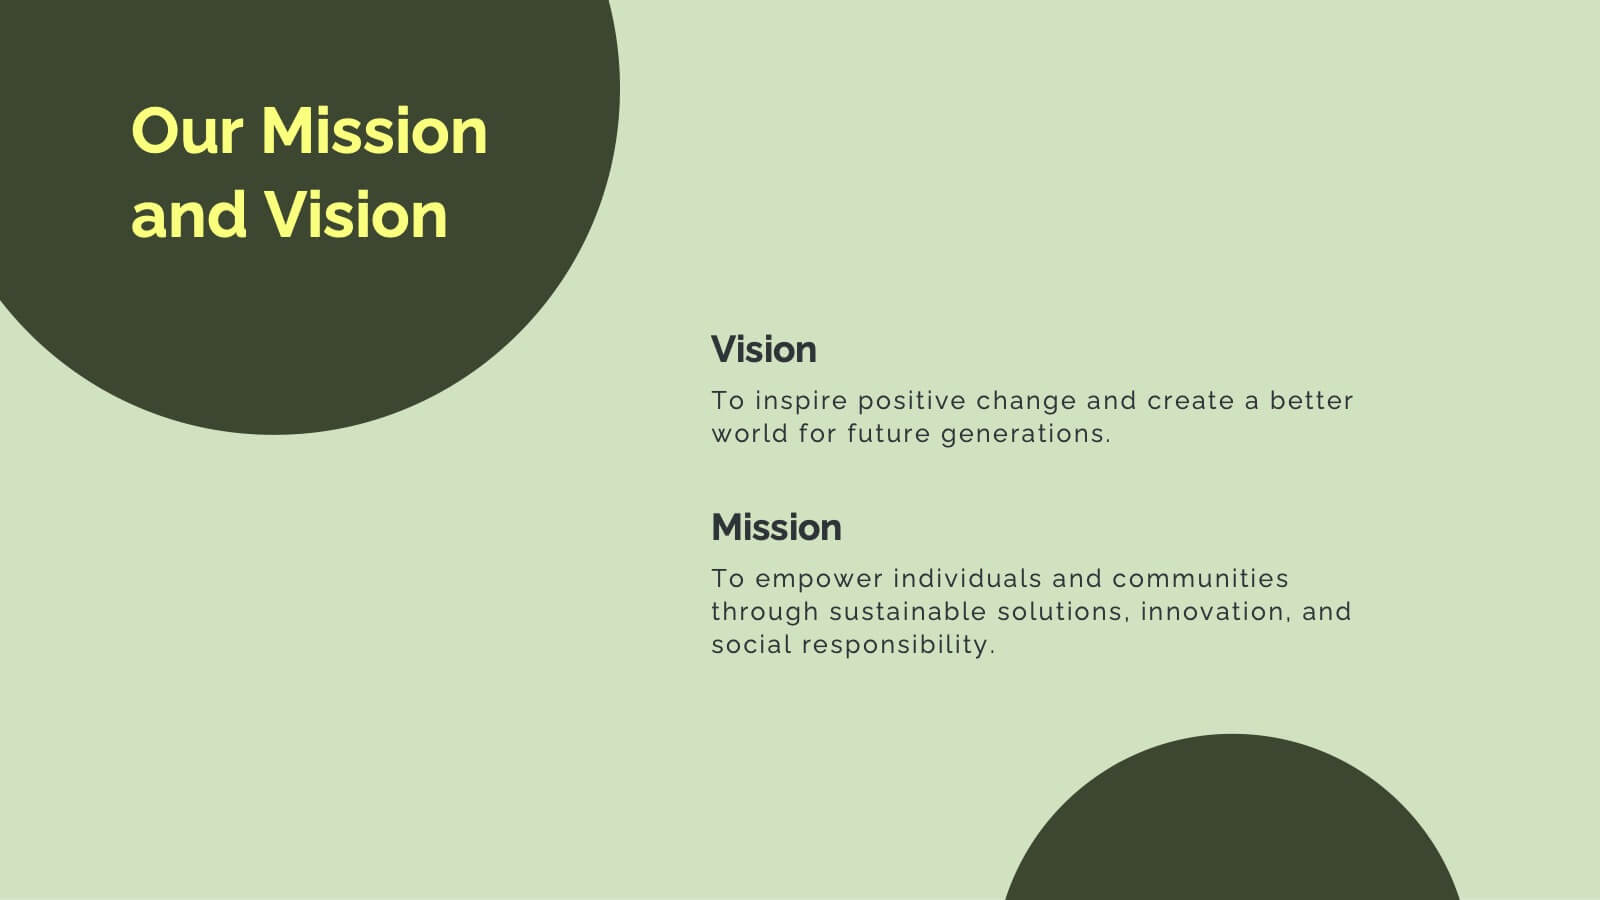
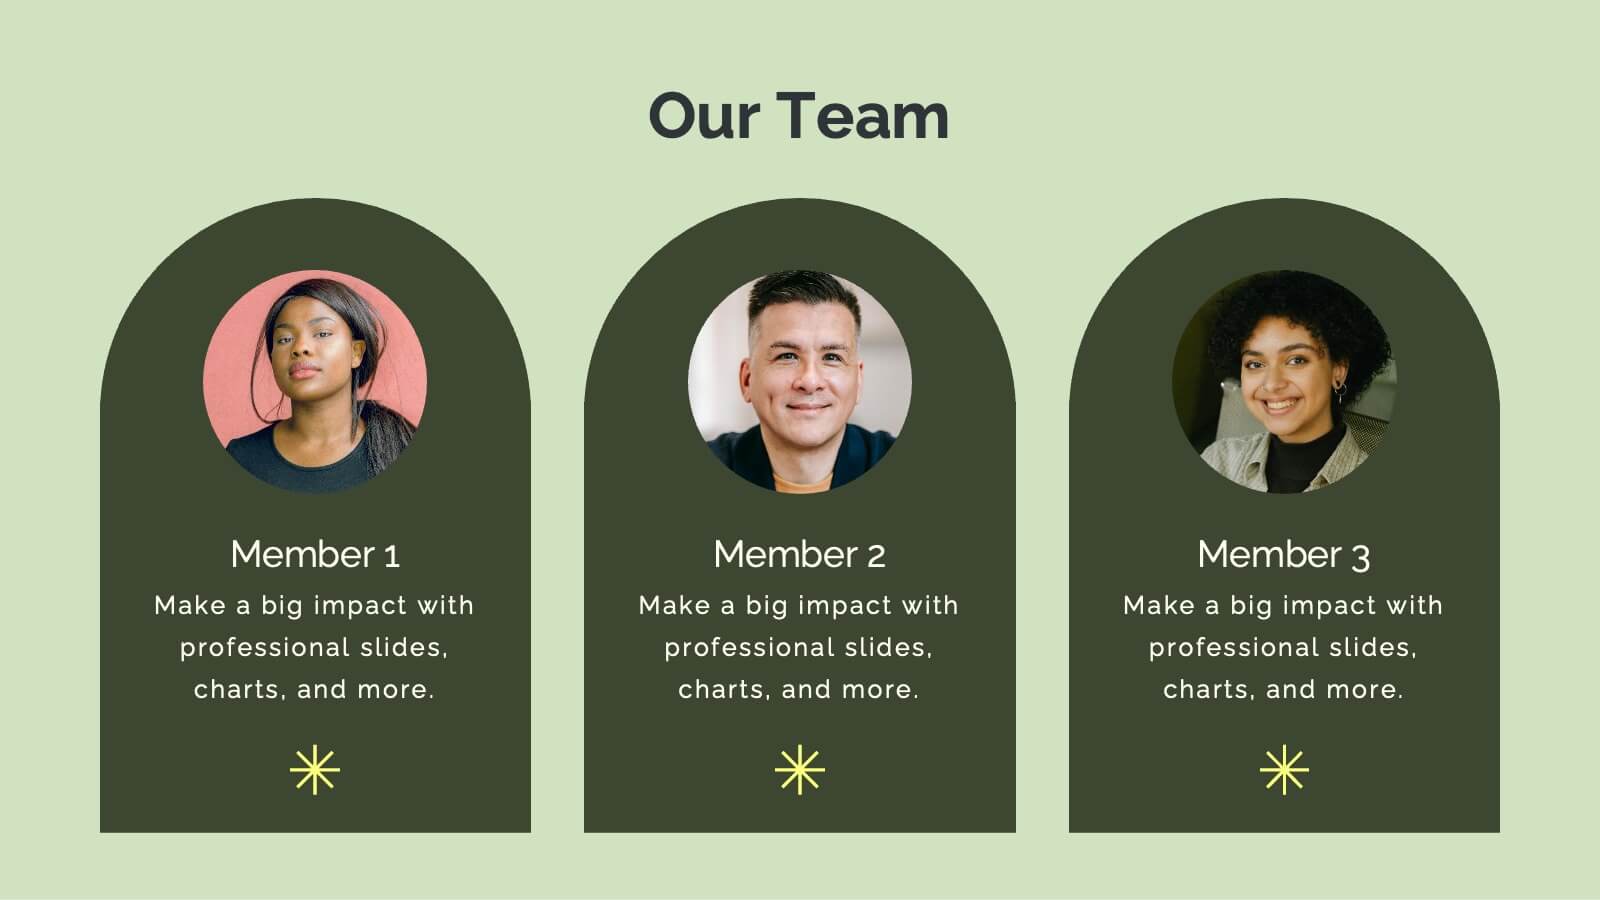
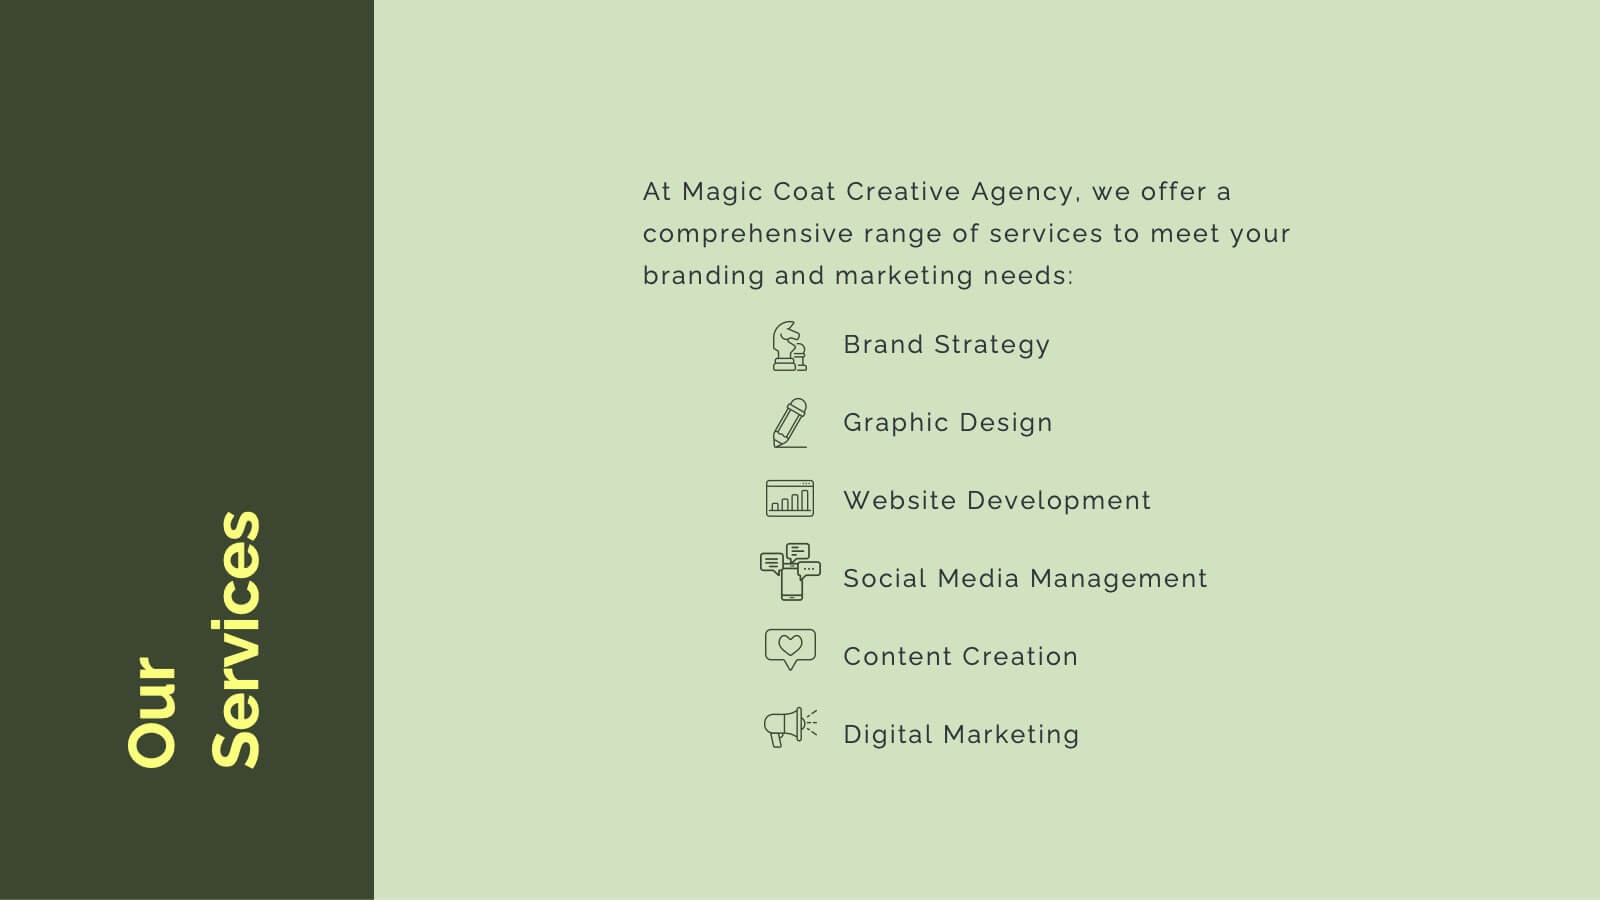
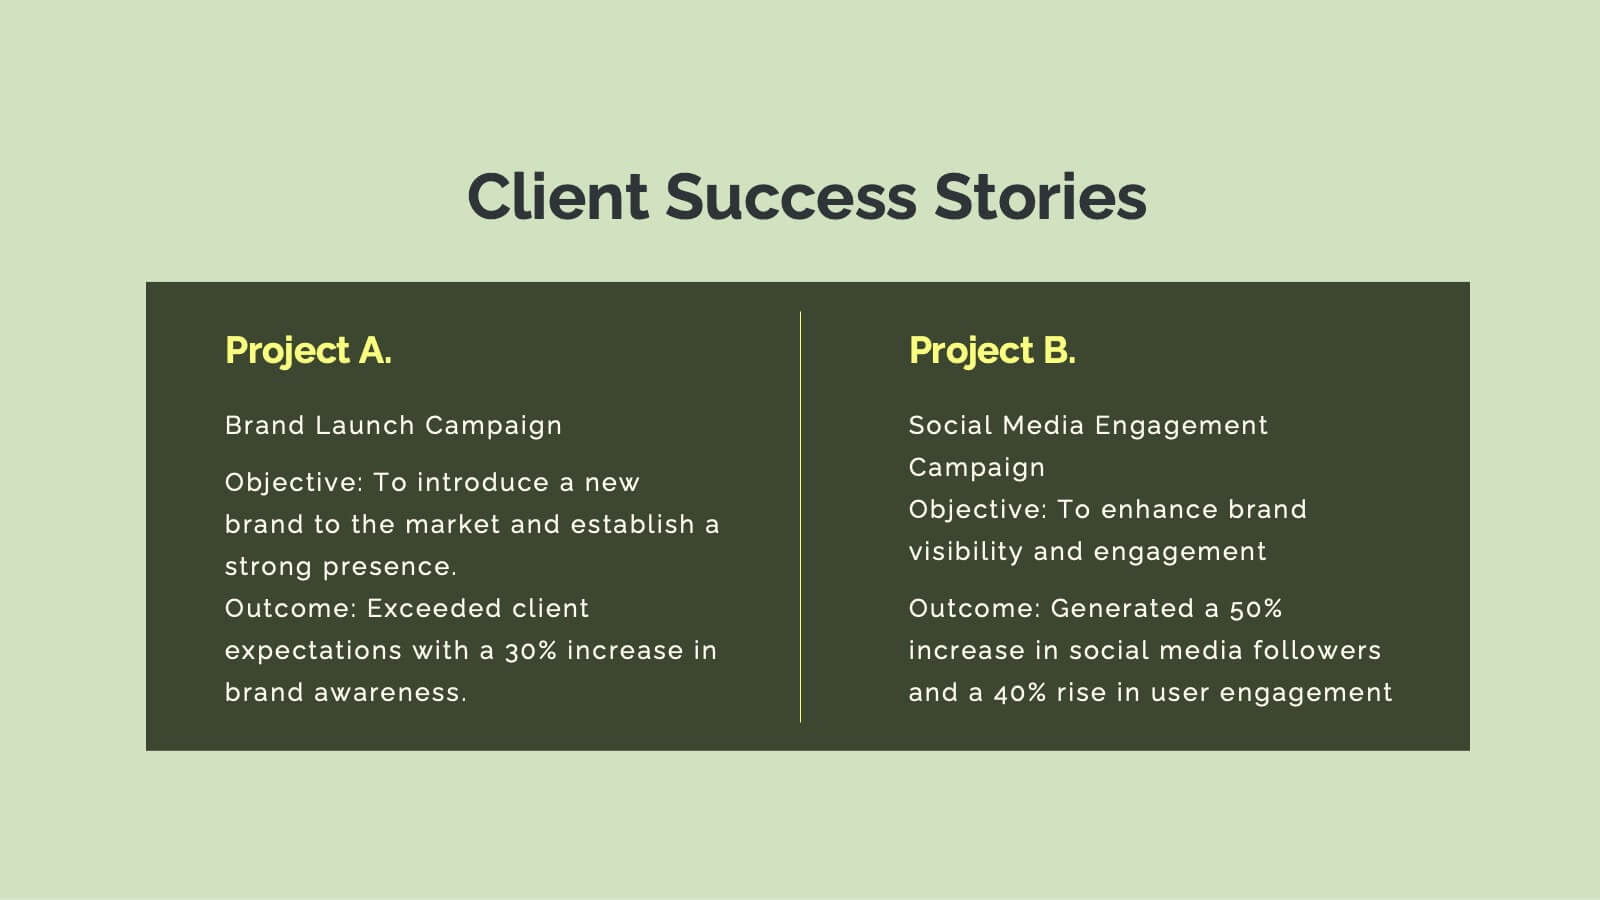
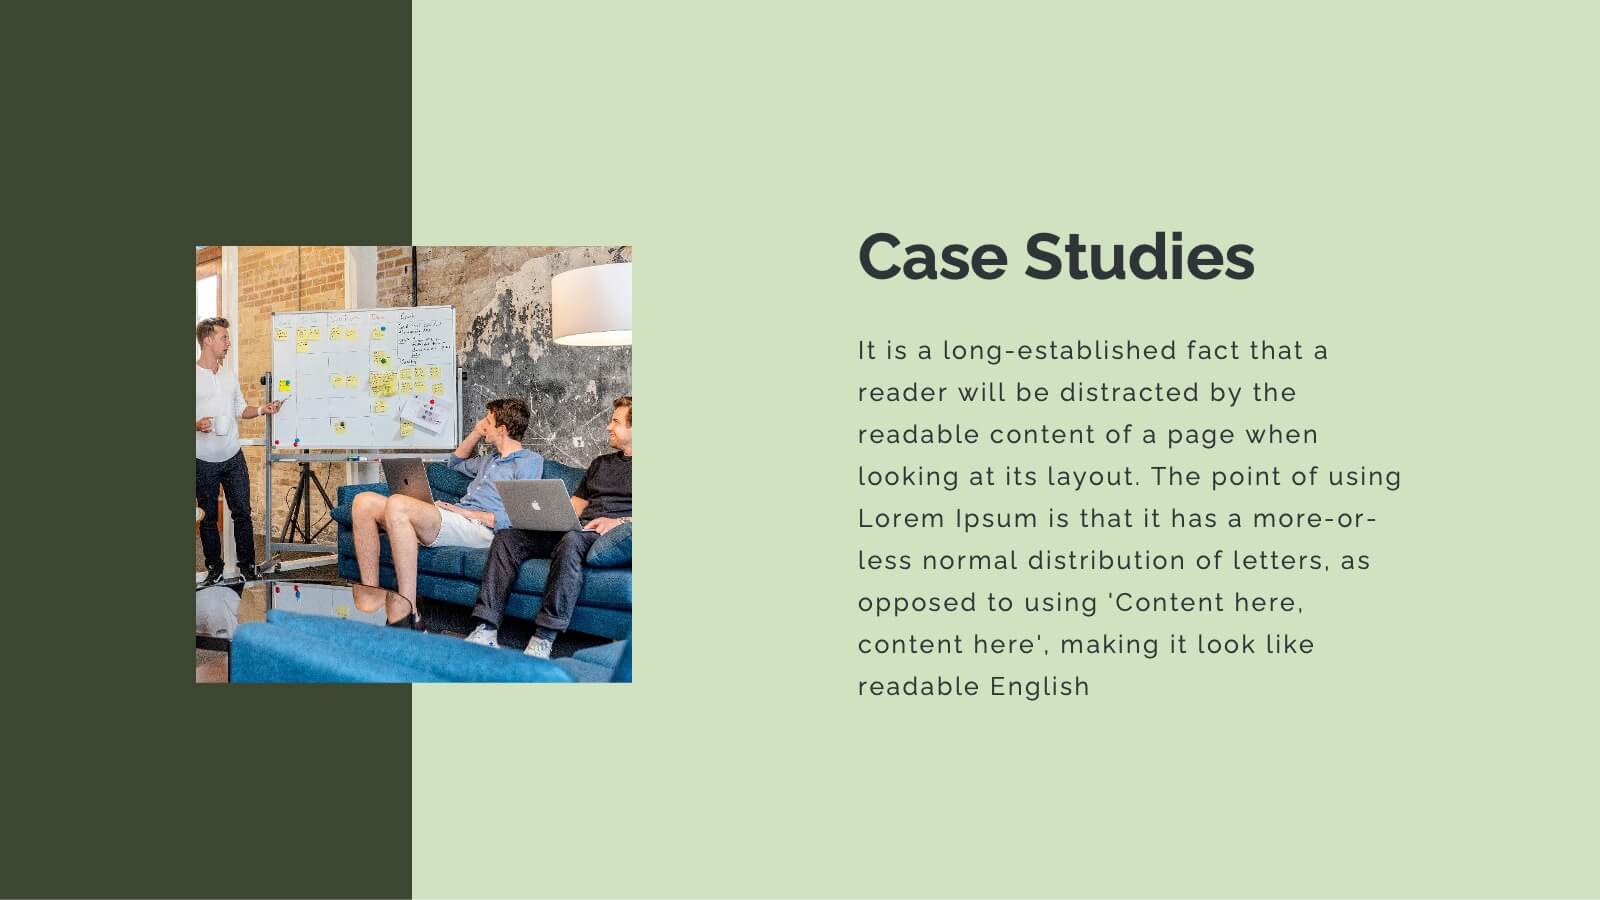
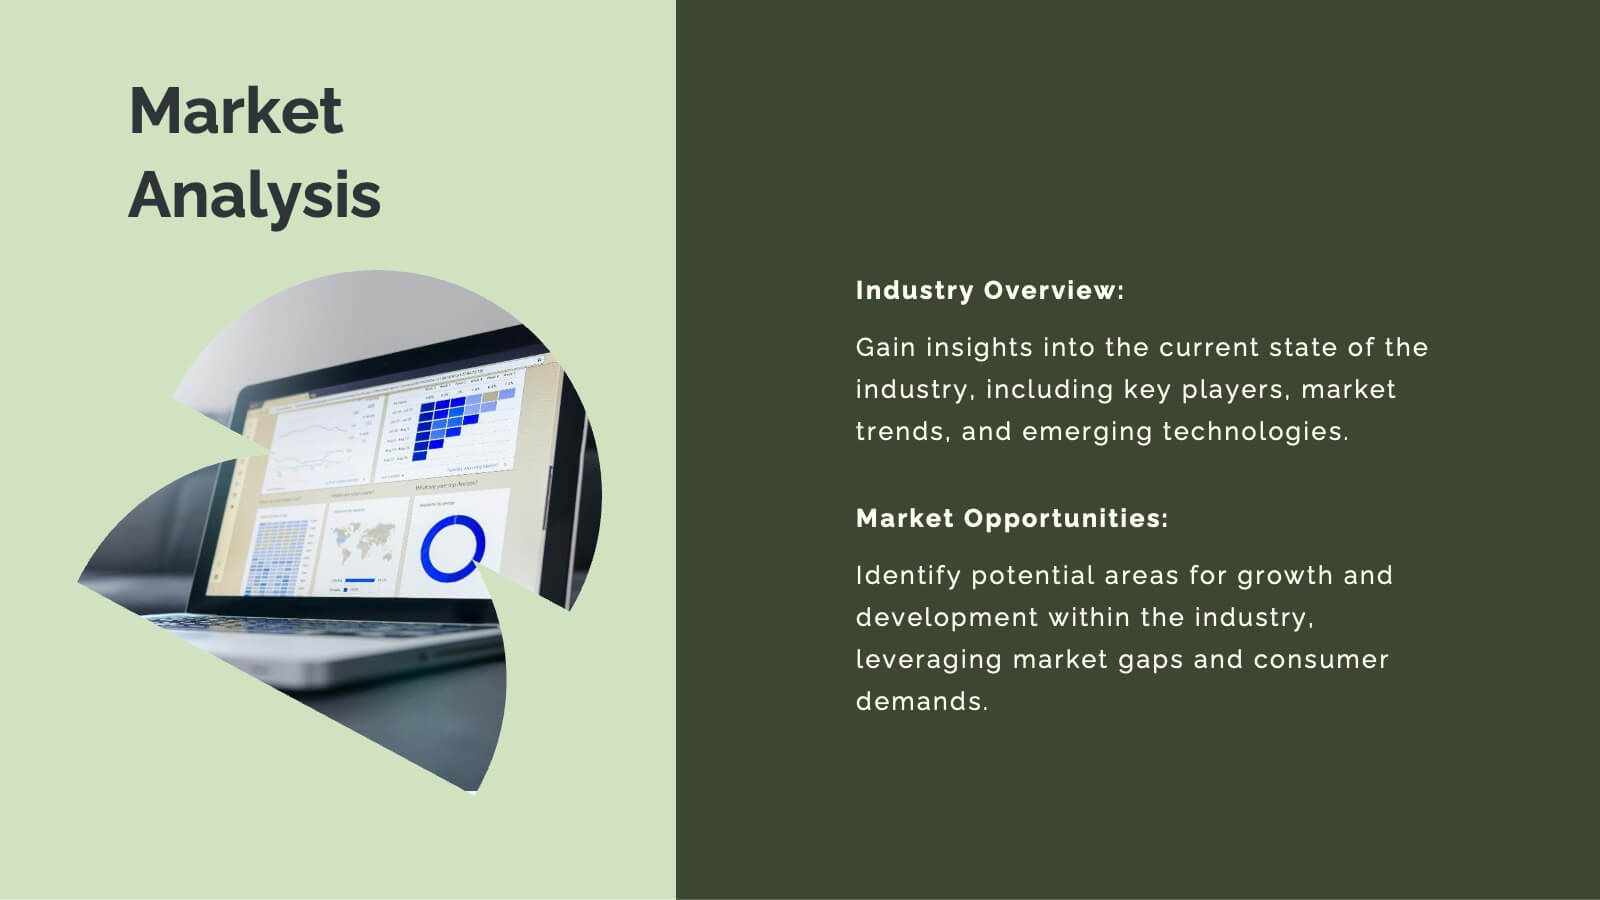
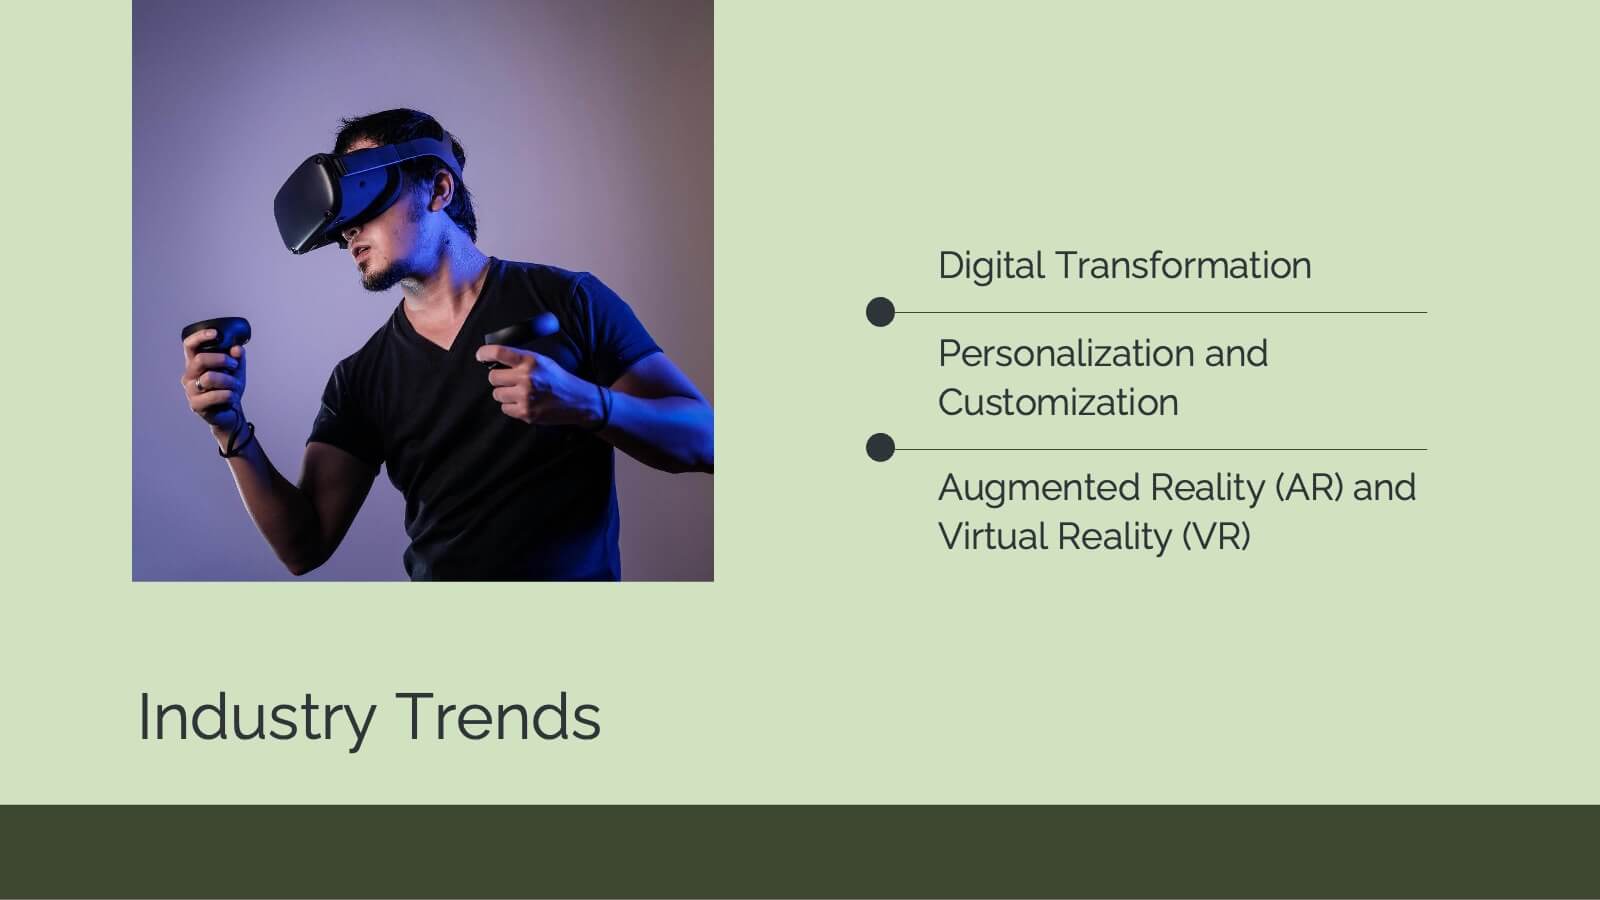
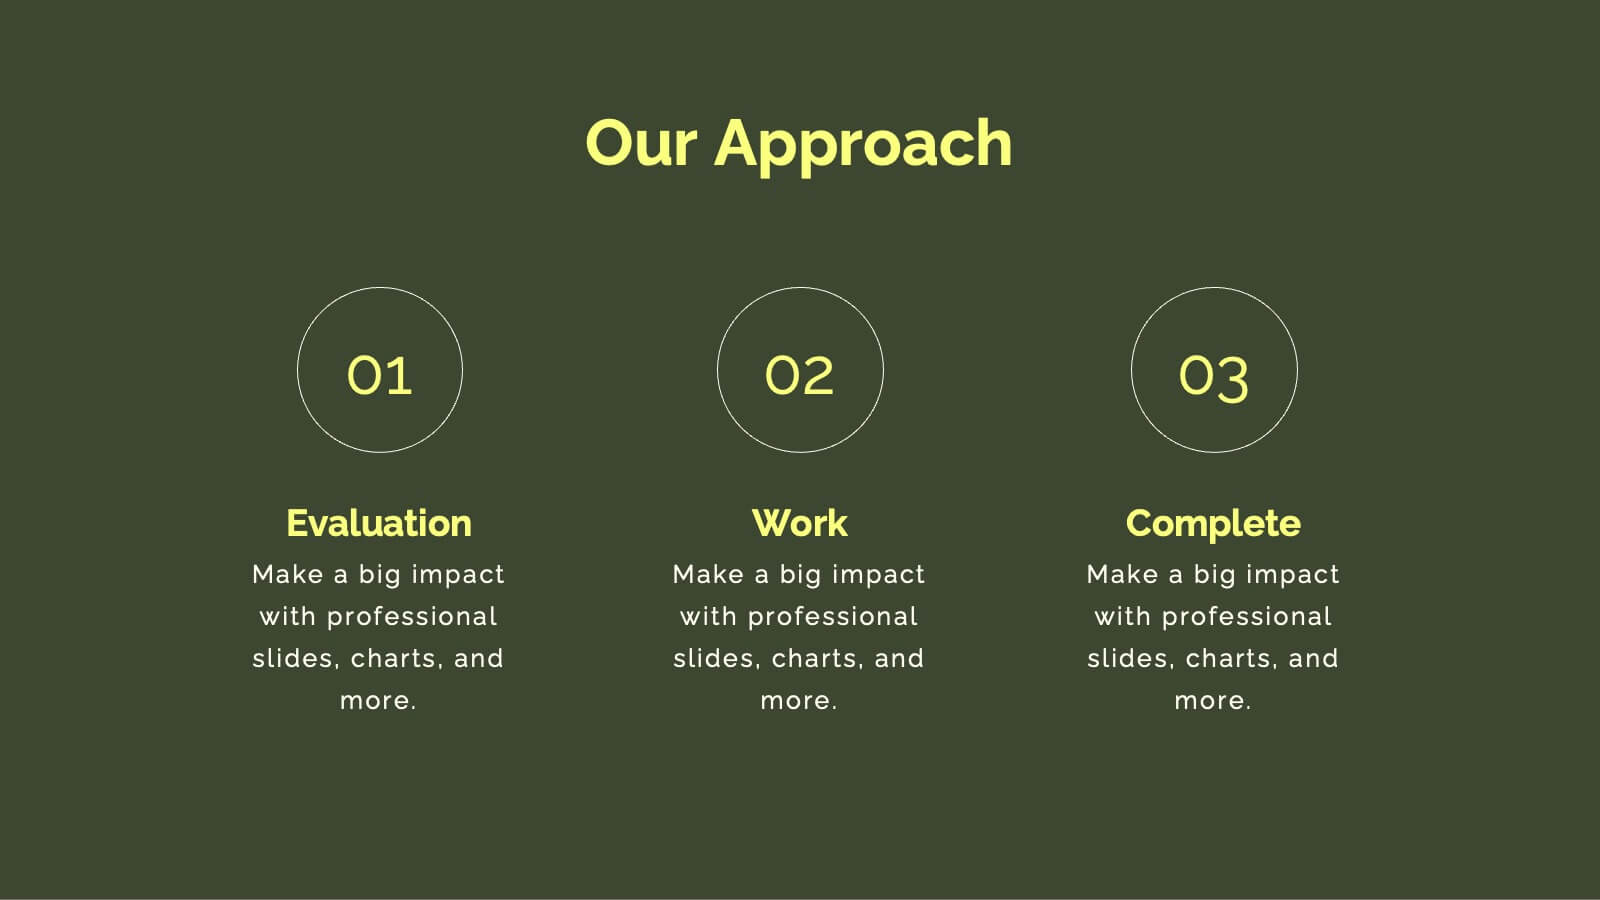
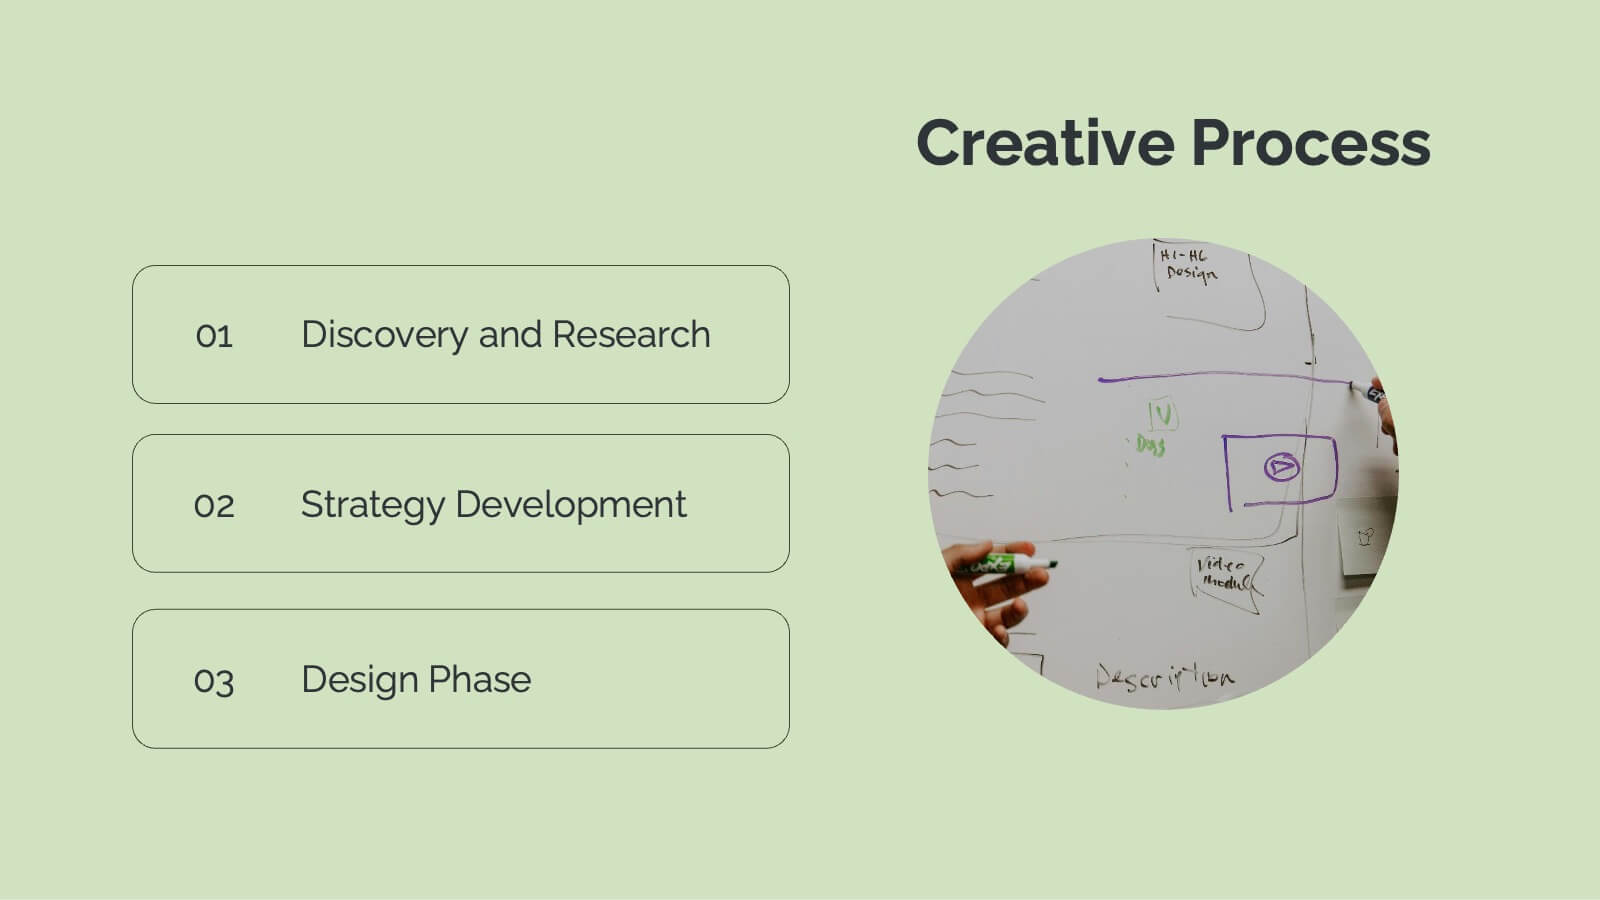
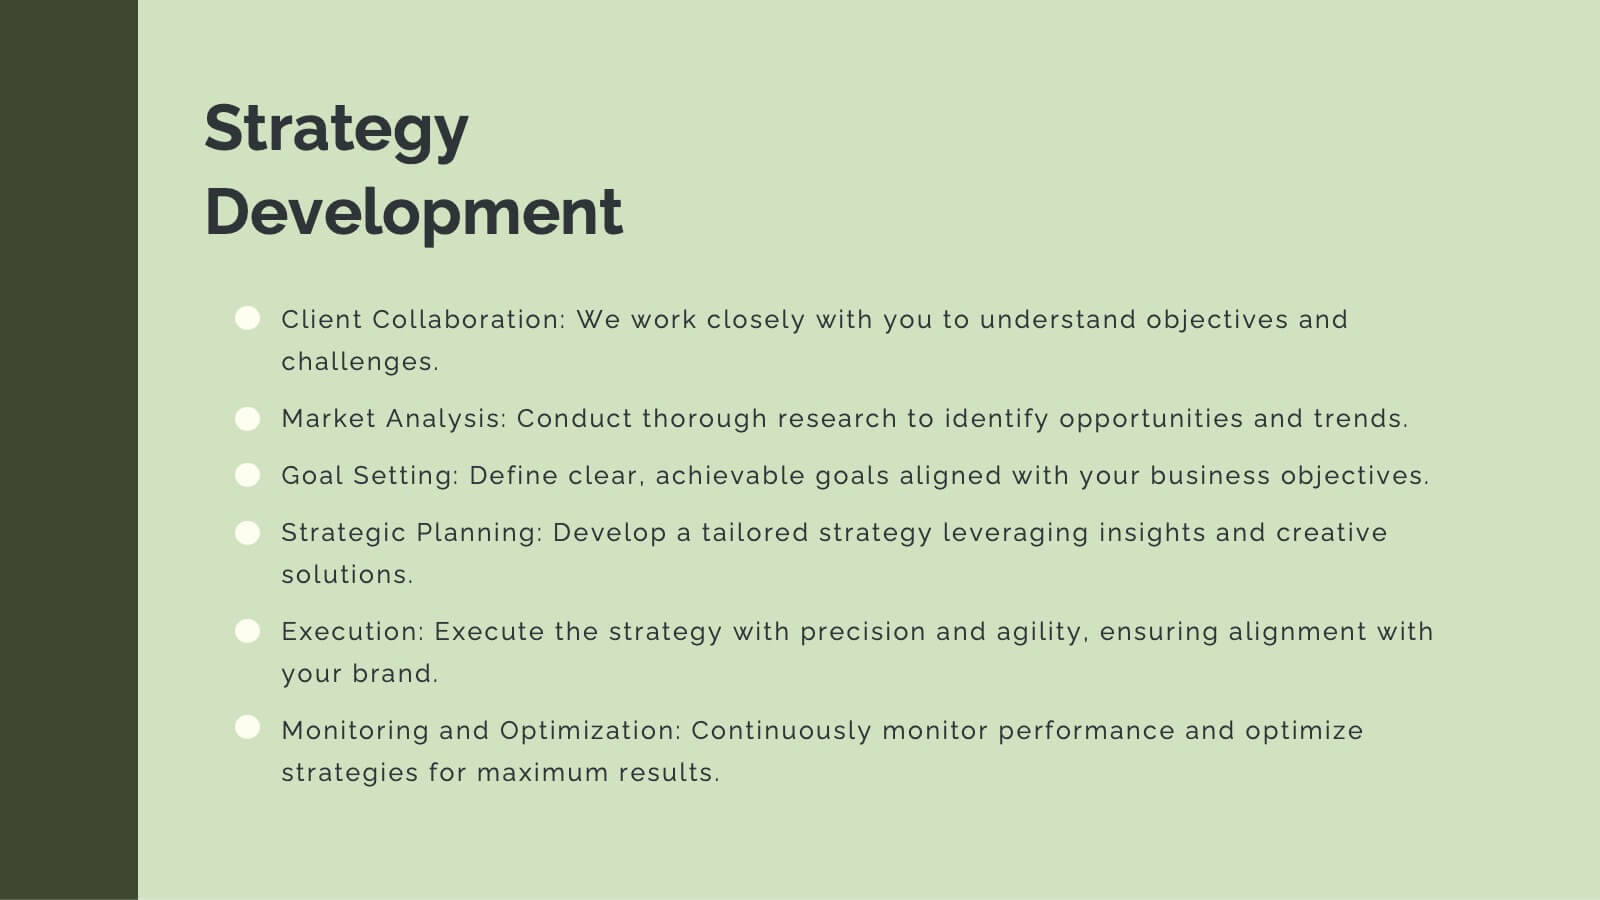
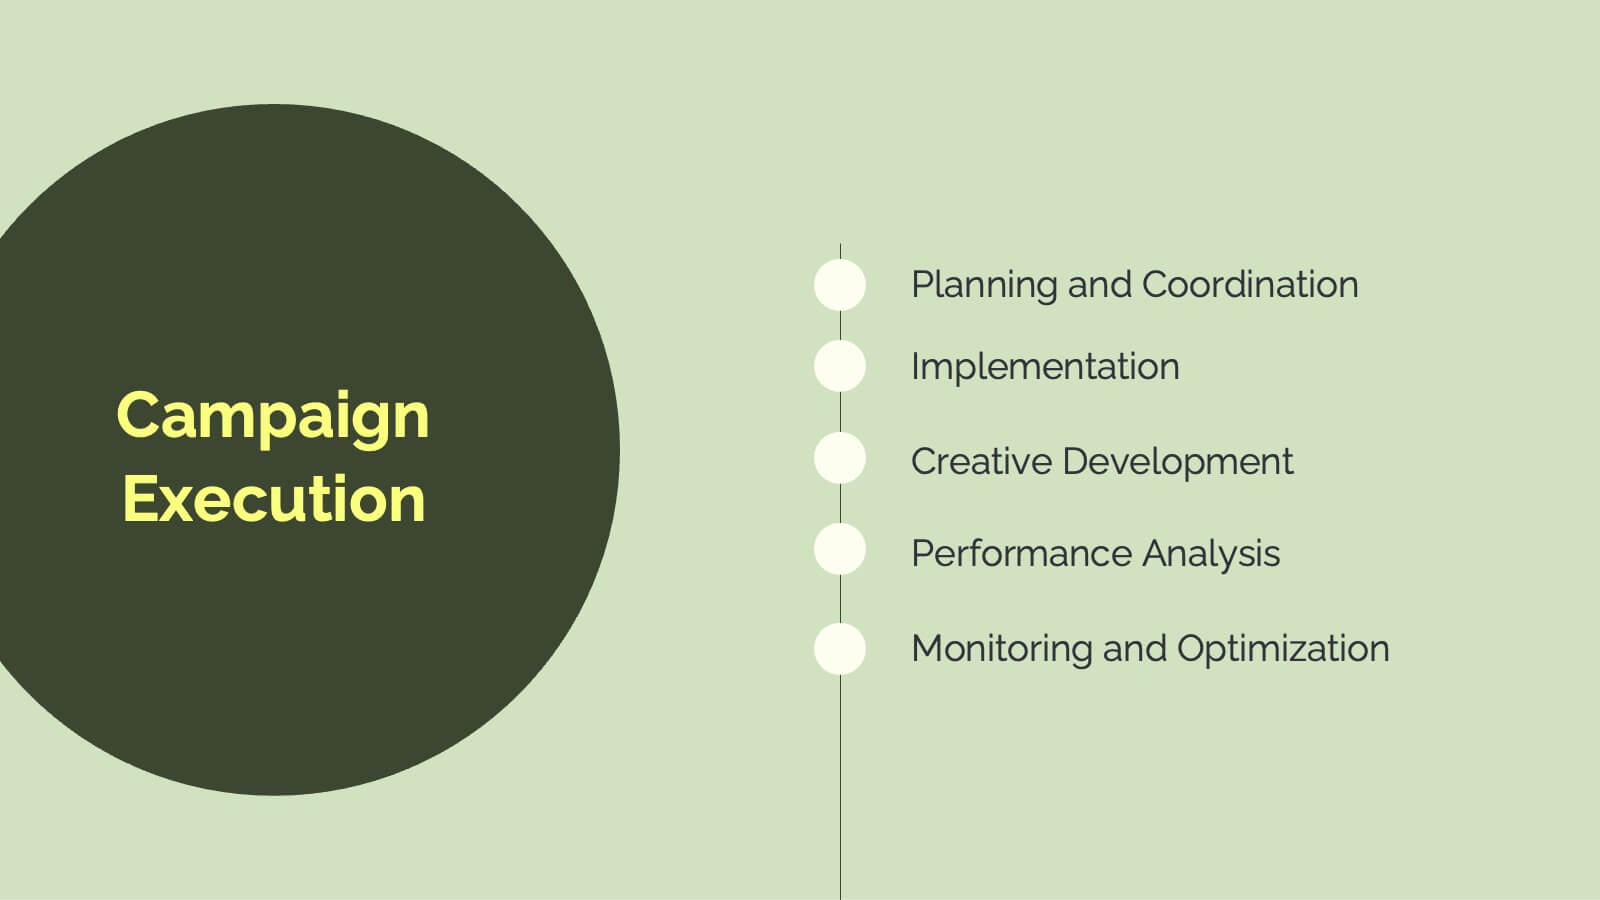
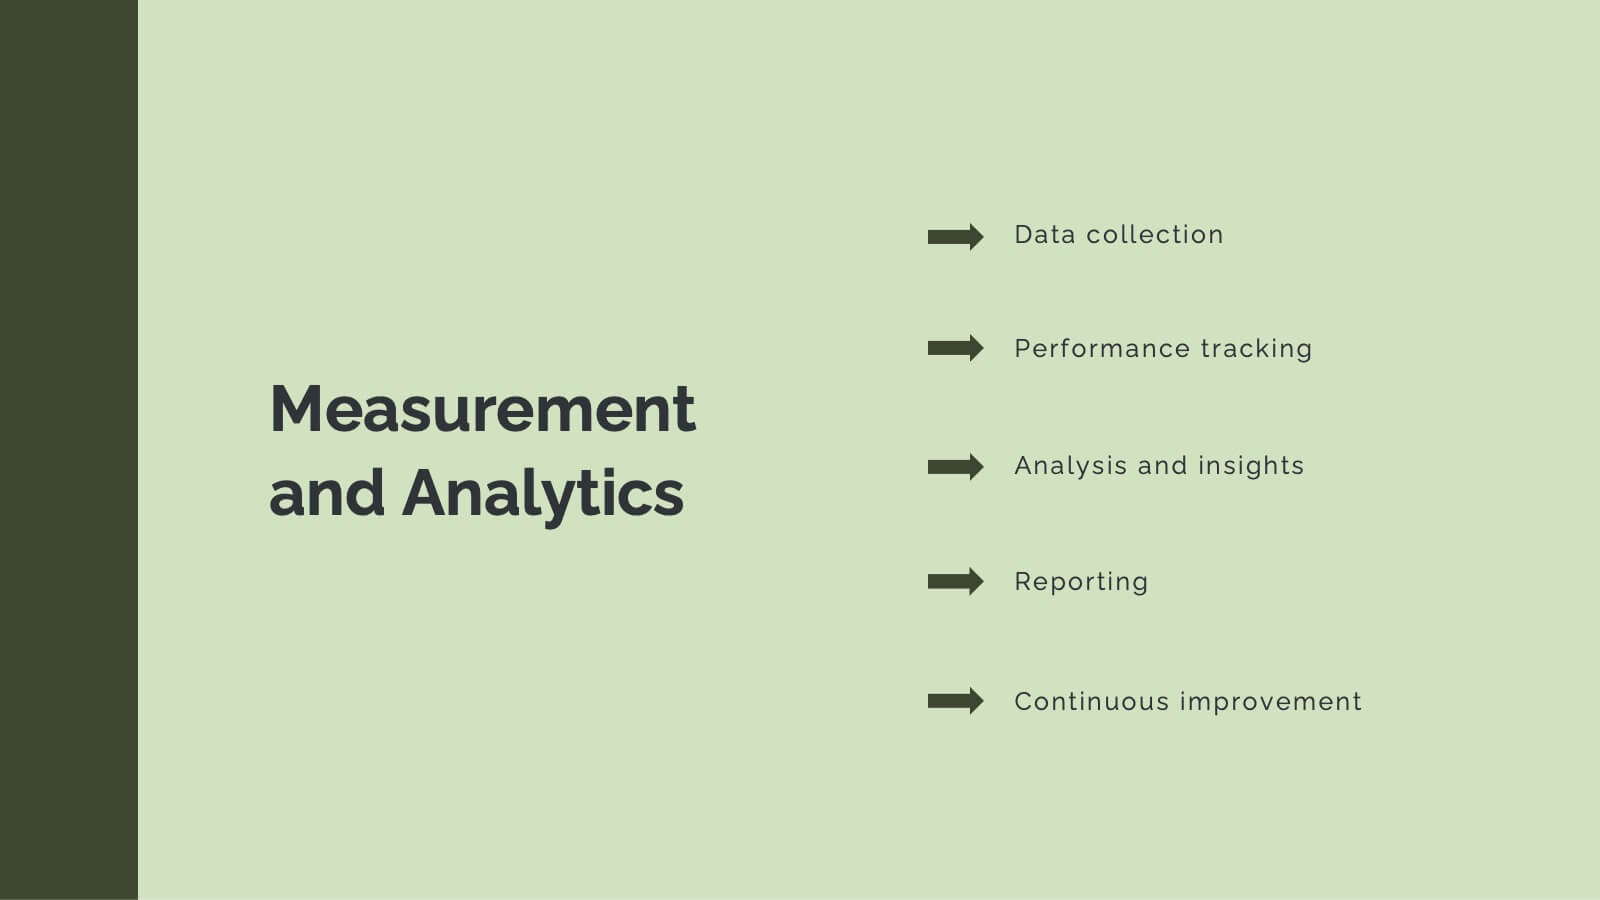
Horizon Advertising Agency Proposal Presentation
Elevate your advertising impact with this comprehensive agency proposal template. It’s meticulously designed to showcase your agency’s capabilities from strategic planning to creative execution, ensuring a persuasive presentation of services like market analysis, campaign strategies, and client success stories. Each slide is formatted to facilitate understanding and engagement, making it perfect for highlighting your team's expertise and unique approach. Compatible with major presentation platforms like PowerPoint, Google Slides, and Keynote, this template supports your efforts to secure new clients and projects seamlessly across various devices.


4 diapositivas
Technology Device Mockup Presentation
Bring your ideas to life with a sleek, modern slide that showcases your digital product in a clean smartphone mockup. This presentation explains key features or app benefits with clear, structured text that keeps your message focused and professional. Fully compatible with PowerPoint, Keynote, and Google Slides for easy editing and use.


4 diapositivas
Culinary Business Branding Deck Presentation
Visualize your culinary identity with the Culinary Business Branding Deck Presentation. Designed with a segmented chef hat illustration, this slide helps you showcase four brand pillars—perfect for restaurants, food startups, and culinary consultants. Use it to highlight your cuisine focus, customer experience, service style, and ambiance. Fully editable in PowerPoint, Keynote, Google Slides, and Canva.


2 diapositivas
Startup Company Illustrations
Ignite your startup spirit with our startup company illustrations pack! These are an exhilarating collection of visuals designed to infuse your presentations with the electrifying energy of new beginnings and innovation. Fully compatible with Powerpoint, Keynote, and Google Slides. Get ready to turbocharge your designs with the infectious excitement of startup culture. Infuse your designs with the boundless possibilities of the startup universe—download our startup company illustrations pack today!


8 diapositivas
Project Goals and Deliverables
Visualize your project milestones with this dynamic layout, designed to clearly differentiate between goals and deliverables. Use color-coded hexagons and numbered segments to communicate each stage with clarity and impact. Fully editable in PowerPoint, Keynote, and Google Slides.


6 diapositivas
AIDA Diagram
The AIDA Diagram is a simple and effective marketing tool used to guide the design of advertising and promotional materials with the goal of attracting and retaining customers. AIDA stands for Attention, Interest, Desire, and Action, and it represents the four stages a potential customer goes through when exposed to marketing content. This infographic template is a classic marketing and advertising framework used to understand and guide the consumer's journey through the buying process. This infographic is completely customizable and compatible with Powerpoint, Keynote, and Google Slides.


21 diapositivas
Ruby Startup Funding Proposal Presentation
Get ready to pitch your startup in style with this vibrant and engaging presentation template! Perfect for showcasing your startup’s founding story, business model, market analysis, and financial overview, this template ensures you’ll impress potential investors. Fully customizable and compatible with PowerPoint, Keynote, and Google Slides, it’s ideal for securing funding and support.


4 diapositivas
Simple RACI Matrix Overview Presentation
Bring instant clarity to every role with a clean, puzzle-style layout designed to map responsibilities without confusion. This presentation helps teams outline who leads, supports, approves, and stays informed in any project, turning tasks into a simple visual grid. Fully editable and compatible with PowerPoint, Keynote, and Google Slides.


7 diapositivas
Urban Ecology Illustrated Infographics
Ecology is the scientific study of the interactions between organisms and their environment. This ecology template will help you explain the science behind our world. This is great for anyone who is presenting information about ecology, environment, or sustainability. You can use this infographic as is or customize it by changing the colors and fonts of each slide. You can also add your own images, and text by downloading in Powerpoint, Keynote, or Google Slides. This Template comes with a wealth of key facts and figures on eco-friendly living and presents them in an infographic style.


6 diapositivas
Meeting Planner Infographics
Efficiently plan and organize meetings with our Meeting Planner infographic template. This template is fully compatible with popular presentation software like PowerPoint, Keynote, and Google Slides, allowing you to easily customize it to illustrate and communicate the key steps and strategies for effective meeting planning. The Meeting Planner infographic template offers a visually engaging platform to outline the meeting planning process, including scheduling, agenda creation, participant coordination, and follow-up actions. Whether you're a project manager, event planner, or business professional, this template provides a user-friendly canvas to create informative presentations and educational materials on meeting planning best practices. Optimize your meeting planning skills and efficiency with this SEO-optimized Meeting Planner infographic template, thoughtfully designed for clarity and ease of use. Customize it to showcase tips for successful meetings, tools for scheduling, and strategies for engaging participants, ensuring that your audience becomes more proficient in planning and executing productive meetings. Start crafting your personalized infographic today to become a more effective Meeting Planner.