


Características


¿Tienes alguna pregunta?
Recomendar


5 diapositivas
Meeting Minutes and Notes Presentation
Keep every discussion organized and every detail accounted for with this clean and structured layout. Perfect for summarizing key decisions, attendees, and next steps, it helps teams capture essential meeting insights efficiently. This easy-to-edit template works flawlessly with PowerPoint, Keynote, and Google Slides for a polished professional presentation.


7 diapositivas
Communication Skills Infographics
Effective communication skills are essential in every aspect of life, including personal relationships, professional relationships, and societal interactions. This template provides you with a great resource for presenting your communication skills. This can help you present your ideas in an effective way. This template features customizable slide designs and graphics allowing you plenty of room to add your own content. The format makes this presentation easy to follow and understand visually as it focuses on what are the most important aspects of delivering effective communication skills.


3 diapositivas
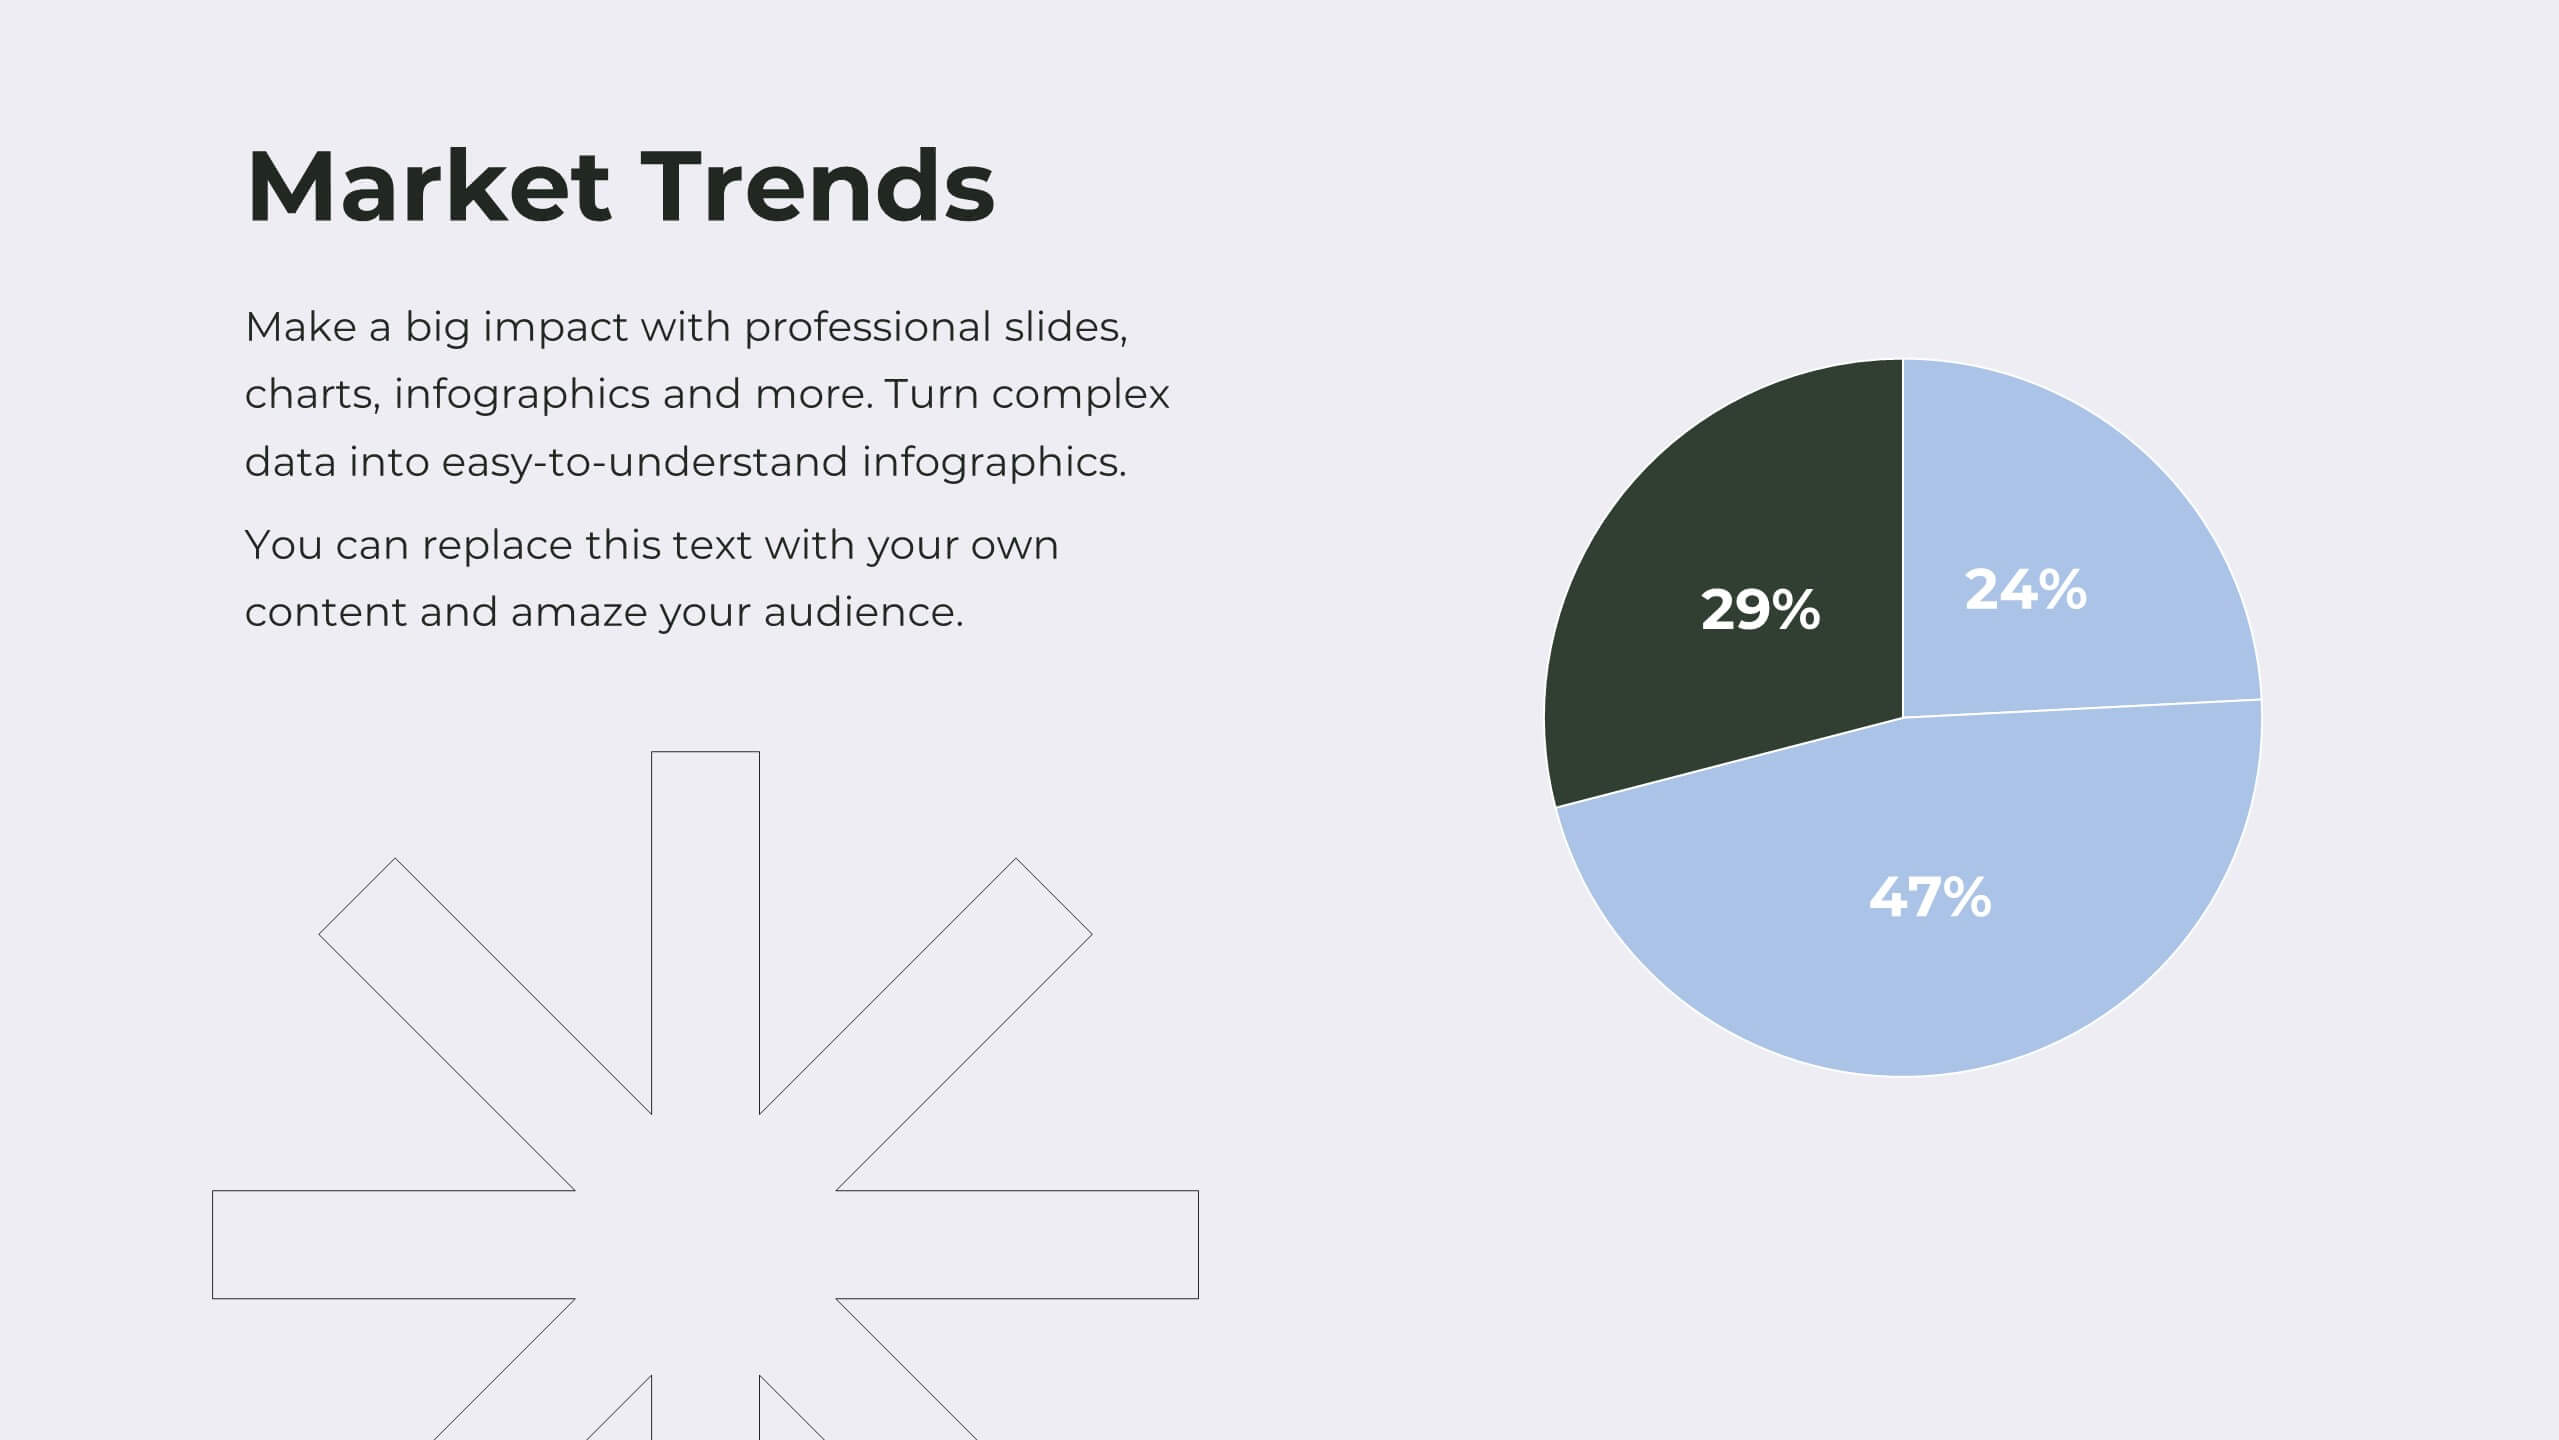
Market Size and Scaling Insights Presentation
Understand your market potential with the Market Size and Scaling Insights Diagram. This visually engaging template helps you analyze market segments, growth trends, and scaling opportunities with clarity. Ideal for business strategists, analysts, and investors, this slide ensures a concise and professional presentation of key market data. Fully customizable and compatible with PowerPoint, Keynote, and Google Slides.


28 diapositivas
Ignite Rebranding Project Plan Presentation
Ignite your brand with this vibrant project plan template! Perfect for defining brand identity, vision, and strategy. Ideal for marketers and brand managers aiming to create a cohesive and compelling brand presence. Compatible with PowerPoint, Keynote, and Google Slides, this template ensures your branding is impactful and professional. Make your brand unforgettable!


5 diapositivas
Educational Planning & Class Activities Presentation
Organize your lessons with this creative education-themed layout. Featuring a playful stack of books and apple illustration, this slide is ideal for outlining academic plans, class objectives, or weekly activities. Fully editable in PowerPoint, Keynote, and Google Slides—perfect for teachers, homeschoolers, and education professionals seeking clarity and visual appeal.


5 diapositivas
Four-Part Puzzle Business Integration
Unify complex components with the Four-Part Puzzle Business Integration Presentation. This gear-inspired design uses interlocking puzzle visuals to symbolize collaboration, systems thinking, or functional alignment. Each quadrant is paired with an icon and description area—ideal for presenting departments, initiatives, or integration steps. Fully customizable in PowerPoint, Keynote, and Google Slides.


4 diapositivas
Breast Cancer Awareness Campaign Presentation
Raise awareness with impact using the Breast Cancer Awareness Campaign Presentation. This visually engaging design uses symbolic visuals to highlight key messages, educate audiences, and inspire action. Perfect for nonprofit initiatives, educational sessions, or health campaigns. Fully editable in PowerPoint, Google Slides, Keynote, and Canva for easy customization.


6 diapositivas
Human Resources Project Infographics
This series of infographics from a Human Resources (HR) presentation provides a visual breakdown of key HR functions and strategies. The slides encompass various elements critical to effective HR management: Adoption & Integration: Showcases the initial stages of HR processes, including adoption rates and integration strategies for new systems or policies. Training & Development: Highlights the importance of ongoing employee development through training programs, critical for fostering employee skills and organizational growth. Retention & Maintenance: Focuses on strategies to retain talent within the organization, such as engagement initiatives and competitive compensation structures. Performance & Evaluation: Details the methods for assessing employee performance and the criteria used for evaluations, ensuring alignment with organizational goals. Recruitment to Retirement: Outlines the employee lifecycle from recruitment to retirement, showing the comprehensive approach of HR in managing employee journeys. Each slide utilizes charts, process diagrams, and bullet points to clearly communicate the steps and processes involved, making it easier for the audience to grasp complex HR activities. These visuals are crucial for HR professionals aiming to improve workplace efficiency and employee satisfaction.


4 diapositivas
Task List and To-Do Management Presentation
Boost productivity with this engaging task management template. Designed for clear visualization, it helps organize priorities, track progress, and streamline workflows efficiently. Featuring a structured layout, it's perfect for professionals managing daily to-dos, project timelines, or business strategies. Fully compatible with PowerPoint, Keynote, and Google Slides for seamless use.


7 diapositivas
Frequently Asked Question (FAQ) Guide Infographic
Unravel the art of answers with our "FAQ Guide" Infographic Template—your next step in revolutionizing how you communicate with curious customers. With its bold, eye-catching design, this template turns the routine task of answering questions into an engaging experience. Dive into a layout that blends vibrant visuals and crisp, clear typography to ensure your answers not only catch the eye but also stick in the mind. Whether you're in tech, retail, or any service-oriented industry, our template flexes to fit your brand’s unique flair. Customize with your colors, integrate your style, and transform your customer service into an impressive visual journey. Perfect for websites, marketing materials, or quick training sessions, this template makes information fun and accessible. Equip your team with the tools to engage, enlighten, and excite with every FAQ presented. Compatible with all leading graphic design software, it's ready to go whenever you are.


26 diapositivas
Premium Finance for Daily Life Presentation
Introducing our Premium Finance for Daily Life Presentation template this is a comprehensive and informative tool to educate individuals about the concept of premium finance and its relevance in everyday life. This presentation aims to provide valuable insights on how premium finance can be utilized to manage and optimize personal finances. The slides are fully customizable and compatible with PowerPoint, Keynote, and Google Slides. It features a professional design with clean layouts, visually appealing graphics, and icons related to finance and daily life activities. The presentation can cover various topics related to premium finance.


26 diapositivas
Melo Presentation Template
Are you looking for a presentation to make your product stand out? Melo is a beautifully elegant presentation with modern elements and light neutral color palette. Perfect for furniture brands, or any one looking for a modern presentation. These slides include world maps, company slides, mockups and charts perfect for businesses, this template has everything you'll need. It's simple yet chic design makes it stand out and at the same time keep your audience engaged. This is the perfect choice for businesses, brands or anyone who needs to make a great looking template on their next presentation


23 diapositivas
Infinitum Business Plan Presentation
Present your ideas with confidence using this sleek and professional business plan presentation template. Designed for entrepreneurs, startups, and business professionals, this template offers a clear structure to articulate your vision, strategy, and goals effectively. Featuring sections for executive summaries, SWOT analysis, market research, and financial forecasts, this template ensures every detail is covered. Visually engaging charts, graphs, and infographics make data presentation straightforward and compelling. Team profiles, product highlights, and future projections allow you to showcase your competitive edge. Fully editable in PowerPoint, Google Slides, and Keynote, this template is easy to adapt to your branding and business requirements. With its modern design and structured format, it’s perfect for pitching to investors, stakeholders, or clients. Make an impact and leave a lasting impression with this versatile and comprehensive business plan presentation tool.


5 diapositivas
Marketing Sales Funnel Presentation
Watch your customer journey come to life with a clean, visual flow that makes each stage easy to understand at a glance. This presentation breaks down your funnel into clear steps, helping you explain conversions, behaviors, and strategy with confidence. Fully compatible with PowerPoint, Keynote, and Google Slides.


4 diapositivas
Project Workflow Steps and Flowchart Presentation
Map out each phase of your project with clarity using the Project Workflow Steps and Flowchart Presentation. This detailed template offers a visual grid layout for illustrating task sequences, decision points, and team responsibilities. Ideal for project managers, analysts, and operations teams. Fully editable and compatible with PowerPoint, Keynote, and Google Slides.


5 diapositivas
Healthcare Facts Infographics
Healthcare facts help promote health literacy, empower individuals to make informed decisions, and contribute to improved healthcare outcomes for individuals and communities. These infographic templates are designed to present key healthcare facts and statistics in a clear and concise manner. These are perfect for creating educational materials, presenting research findings, or raising awareness about healthcare issues, this template will help you effectively communicate important information. Compatible with Powerpoint, Keynote, and Google Slides you can ensures that your healthcare infographics are visually compelling and impactful.


23 diapositivas
Blade Corporate Strategy Proposal Presentation
Prepare to captivate your audience with the Blade Corporate Strategy Proposal template! This sleek and modern design is perfect for professionals looking to present their strategic objectives with clarity and impact. The template features a balanced color palette of blue and white, exuding professionalism while ensuring your content stands out. From analyzing the current landscape to outlining key challenges and growth opportunities, each slide is meticulously crafted to convey your strategic vision effectively. The clean layout ensures that complex data, such as SWOT analysis, performance metrics, and competitive analysis, is easily digestible. With dedicated sections for team roles, resource allocation, and timelines, this template helps you guide your audience through every step of your strategic plan. Fully compatible with PowerPoint, Keynote, and Google Slides, the Blade template is your go-to choice for delivering presentations that resonate with decision-makers and stakeholders alike.