


Características


¿Tienes alguna pregunta?
Recomendar


5 diapositivas
Collaboration Tools for Team Efficiency Presentation
Visualize teamwork like never before with the Collaboration Tools for Team Efficiency Presentation. Featuring a puzzle-style layout, this slide highlights four interconnected ideas or steps—perfect for team workflows, project milestones, or tool comparisons. Easy to customize in Canva, PowerPoint, or Google Slides.


21 diapositivas
Synergywave Financial Report Presentation
Deliver your financial insights with clarity using this comprehensive report presentation! It covers key sections like performance metrics, sales updates, market trends, and strategic initiatives, ensuring all critical data is well-organized. Whether for stakeholders or internal reviews, this template ensures seamless communication. Fully compatible with PowerPoint, Keynote, and Google Slides.


5 diapositivas
Easy Asian Recipes Infographics
Asian cuisine is incredibly diverse and offers a wide range of delicious and flavorful recipes from various countries and regions. These vertical infographics are designed in a user-friendly design that showcase a collection of simple and delicious Asian recipes. These are perfect for home cooks, food bloggers, and anyone interested in exploring the flavors of Asian cuisine. These infographics include beautifully designed recipes for a variety of popular Asian dishes, such as ramen, teriyaki chicken, and more. Each recipe provides a list of ingredients needed and step-by-step instructions to guide users through the cooking process.


5 diapositivas
Risk Mitigation Strategies
Visualize your risk response plan with this layered diagram that highlights five strategic levels of mitigation. Each tier features bold directional arrows guiding the viewer from risk source to solution, perfect for decision-makers, auditors, or risk managers. Fully editable and easy to adapt to any industry. Compatible with PowerPoint, Keynote, and Google Slides.


7 diapositivas
E-Learning Solutions Infographic
Elevate the e-learning experience with our E-Learning infographic. Featuring a harmonious blend of serene purple and crisp white, this infographic encapsulates the transformative world of digital learning. Tailored for educators, e-learning consultants, and instructional designers, it vividly illustrates the nuances of online education. Incorporated within are ingenious graphics, relevant icons, and dedicated image placeholders, all set to anchor your content and enhance comprehension. Regardless of your preferred platform – PowerPoint, Keynote, or Google Slides – this template is your tool to effectively convey the dynamism of e-learning.


6 diapositivas
Project Timeline Calendar Presentation
Kick your planning into high gear with a clean, colorful layout that makes tracking progress feel effortless. This presentation helps you map tasks across the week, visualize timelines, and communicate project schedules with absolute clarity. It’s fully editable and works seamlessly in PowerPoint, Keynote, and Google Slides.


7 diapositivas
Creative Cloud Infographic
A cloud infographic is a graphical representation or visual aid that presents information, data, or concepts related to cloud computing in a clear, engaging, and easily understandable manner. The goal of our creative cloud infographic is to simplify complex concepts related to cloud computing, making it easier for the audience to grasp the fundamental ideas and advantages associated with utilizing cloud-based services and technologies. This template is a valuable tool for both educating individuals about cloud computing and aiding decision-making processes when considering cloud solutions for businesses or projects.


7 diapositivas
Smile Rating Operation Infographic
A smile rating is a way to measure or gauge satisfaction, happiness, or approval, often used in customer service, feedback systems, or surveys. This infographic template involves the use of smiley faces or emojis to represent different levels of contentment or approval. The purpose is to make feedback collection more engaging and easier for you and your audience. This template allows you to introduce the concept of a smile rating that celebrates smiles and rates experiences. This infographic will showcase how collective smiles paint a powerful picture of happiness and customer satisfaction.


6 diapositivas
Results & Milestones Shown with Numbers
Track progress and showcase success with the Results & Milestones Shown with Numbers Presentation. This visual timeline highlights five key steps using numbered markers connected by a path—perfect for reporting achievements, product phases, or strategic milestones. Fully editable in PowerPoint, Keynote, and Google Slides.


22 diapositivas
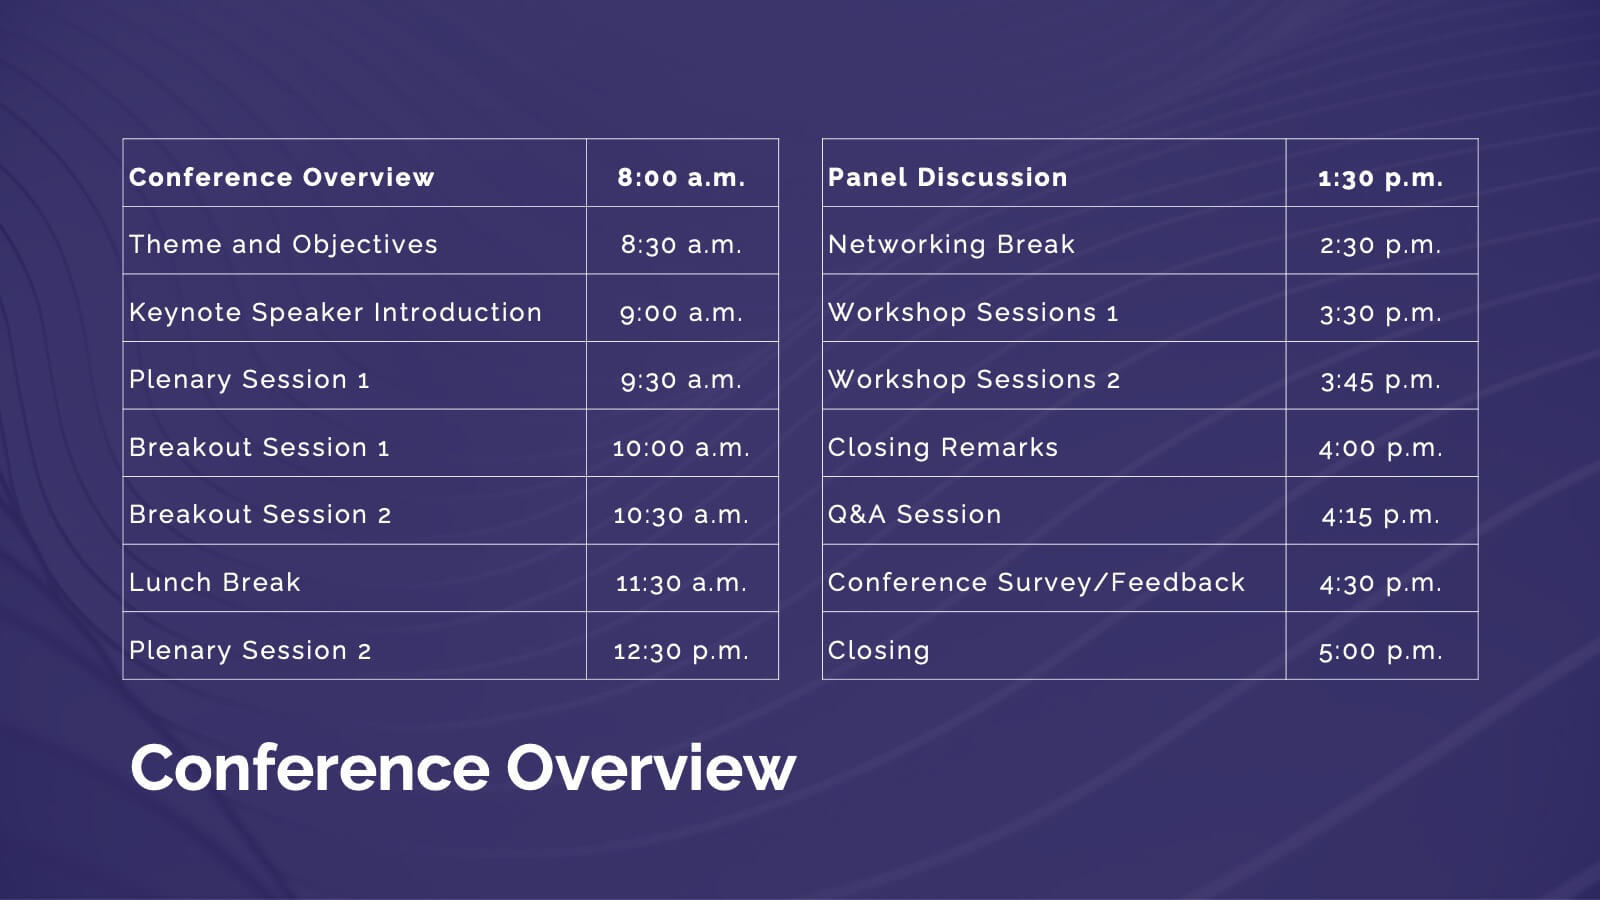
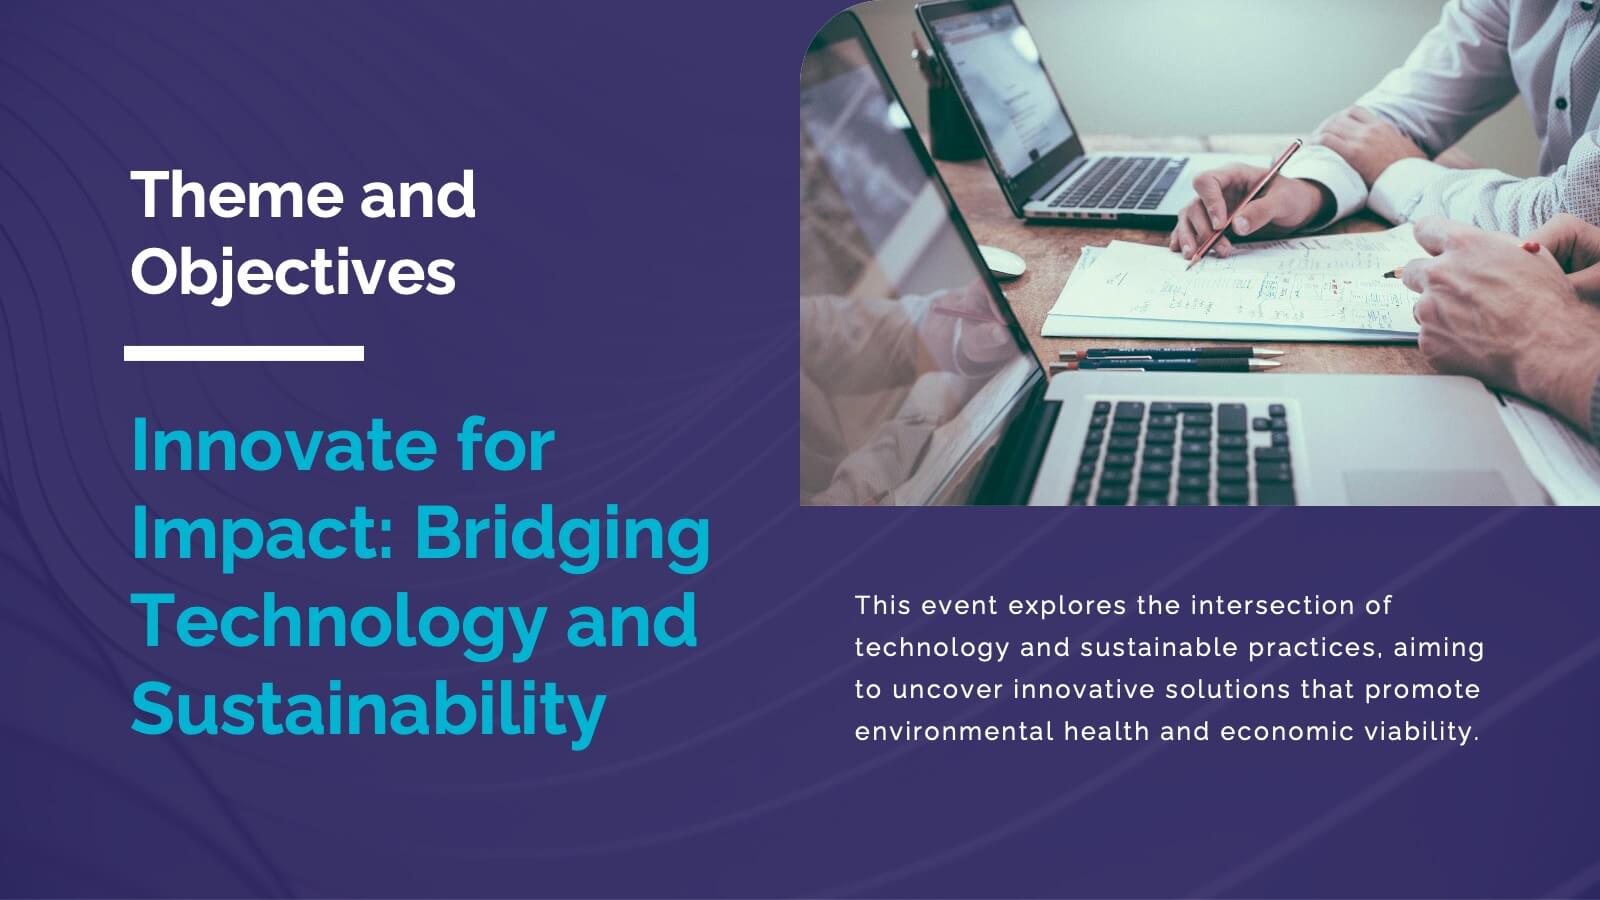
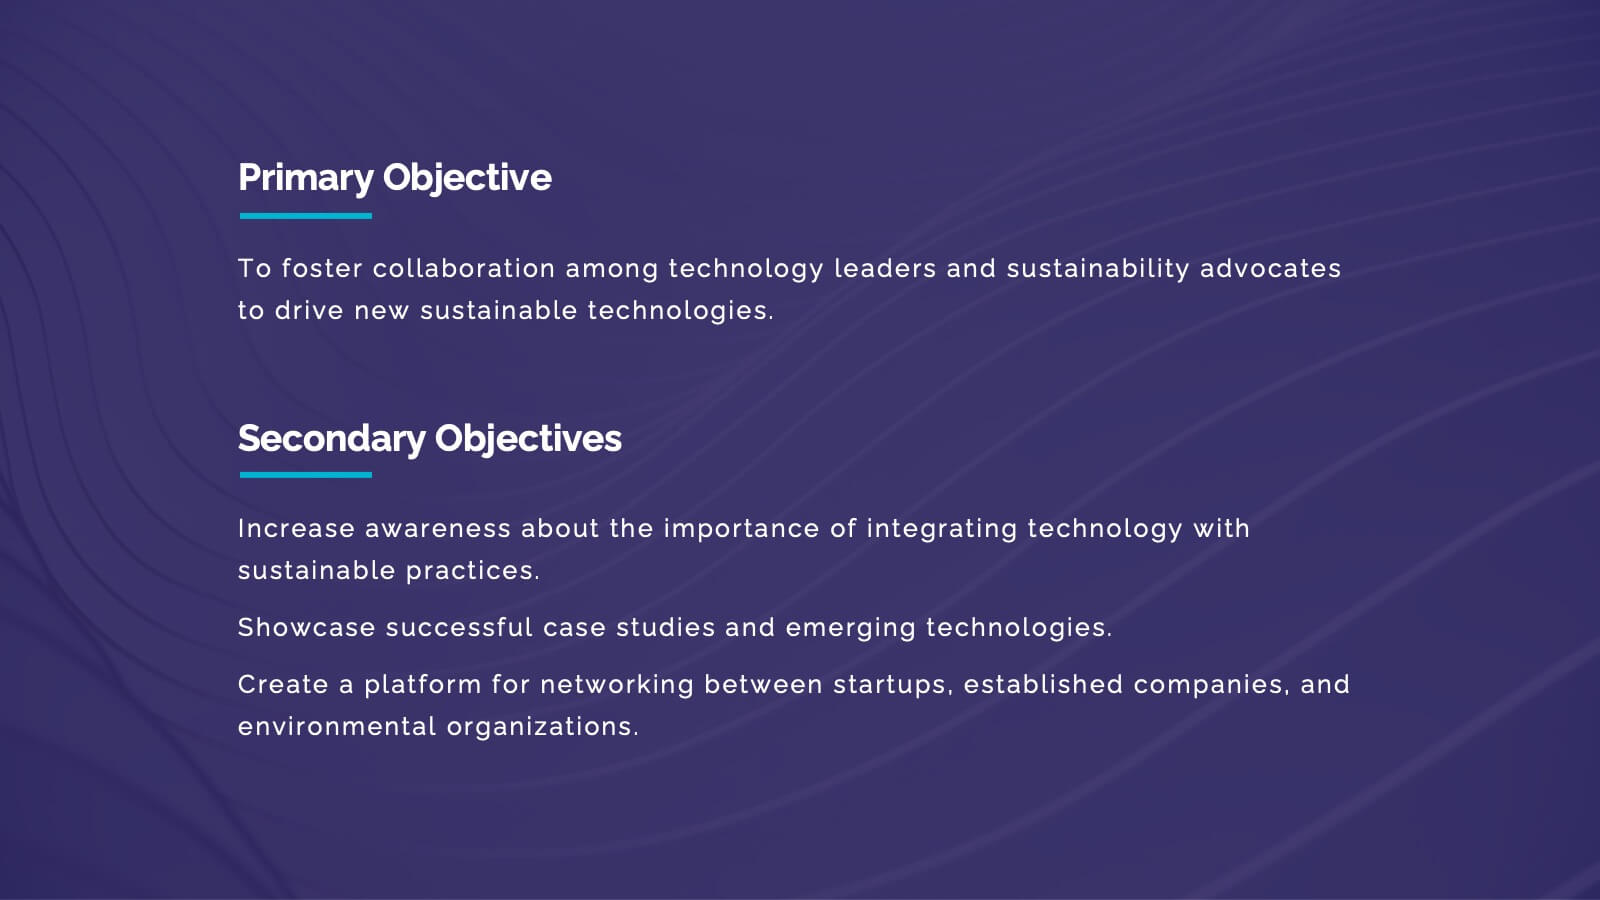
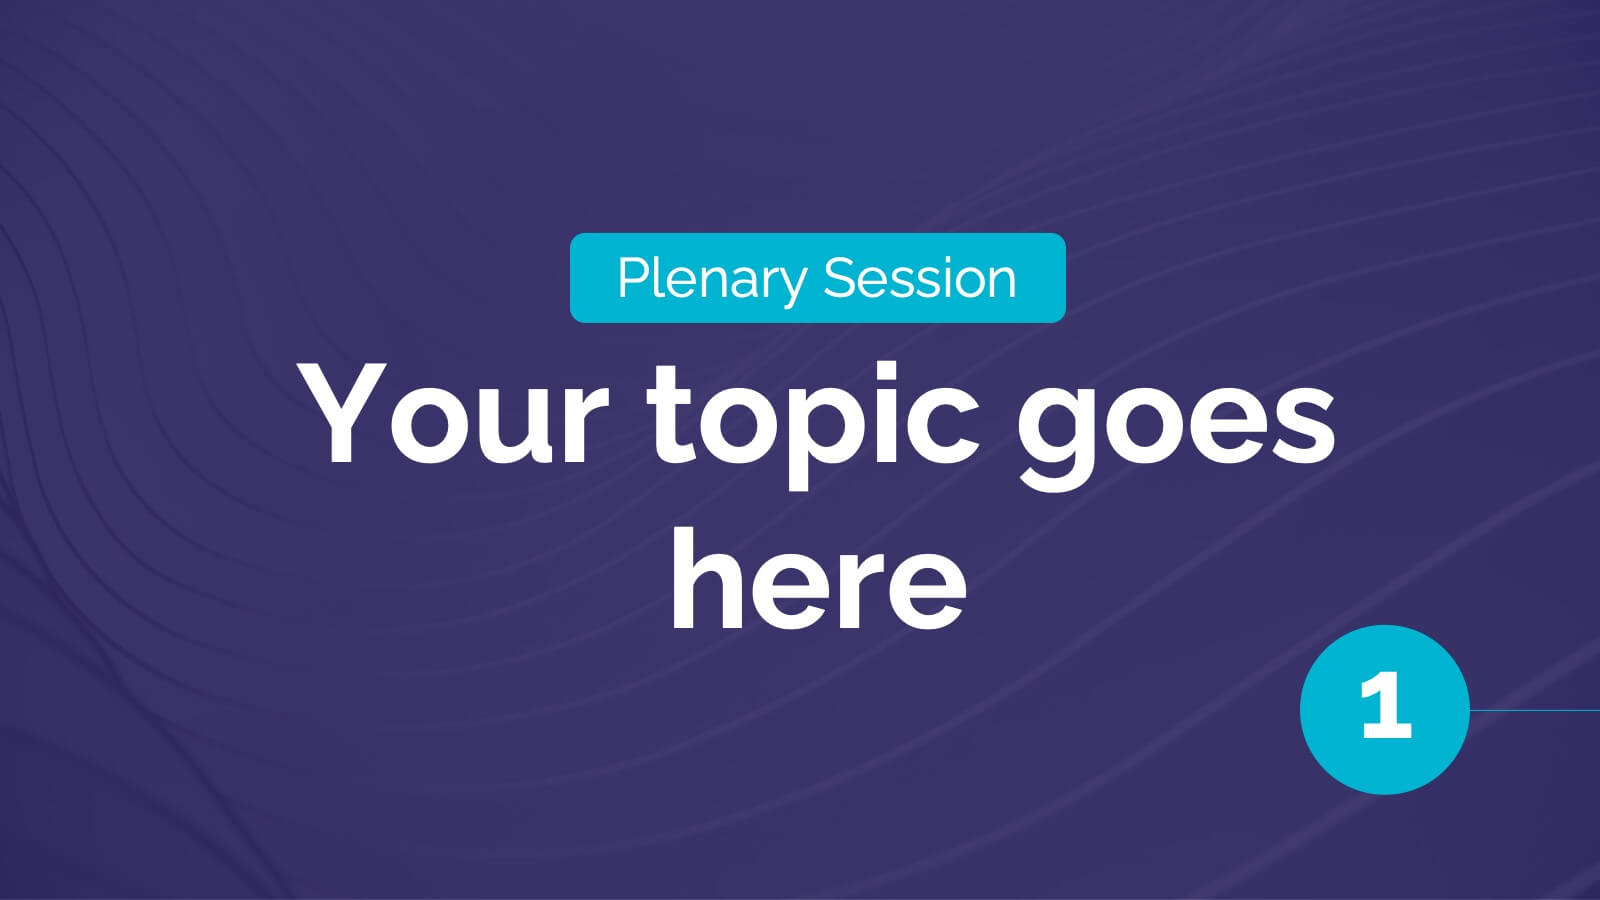
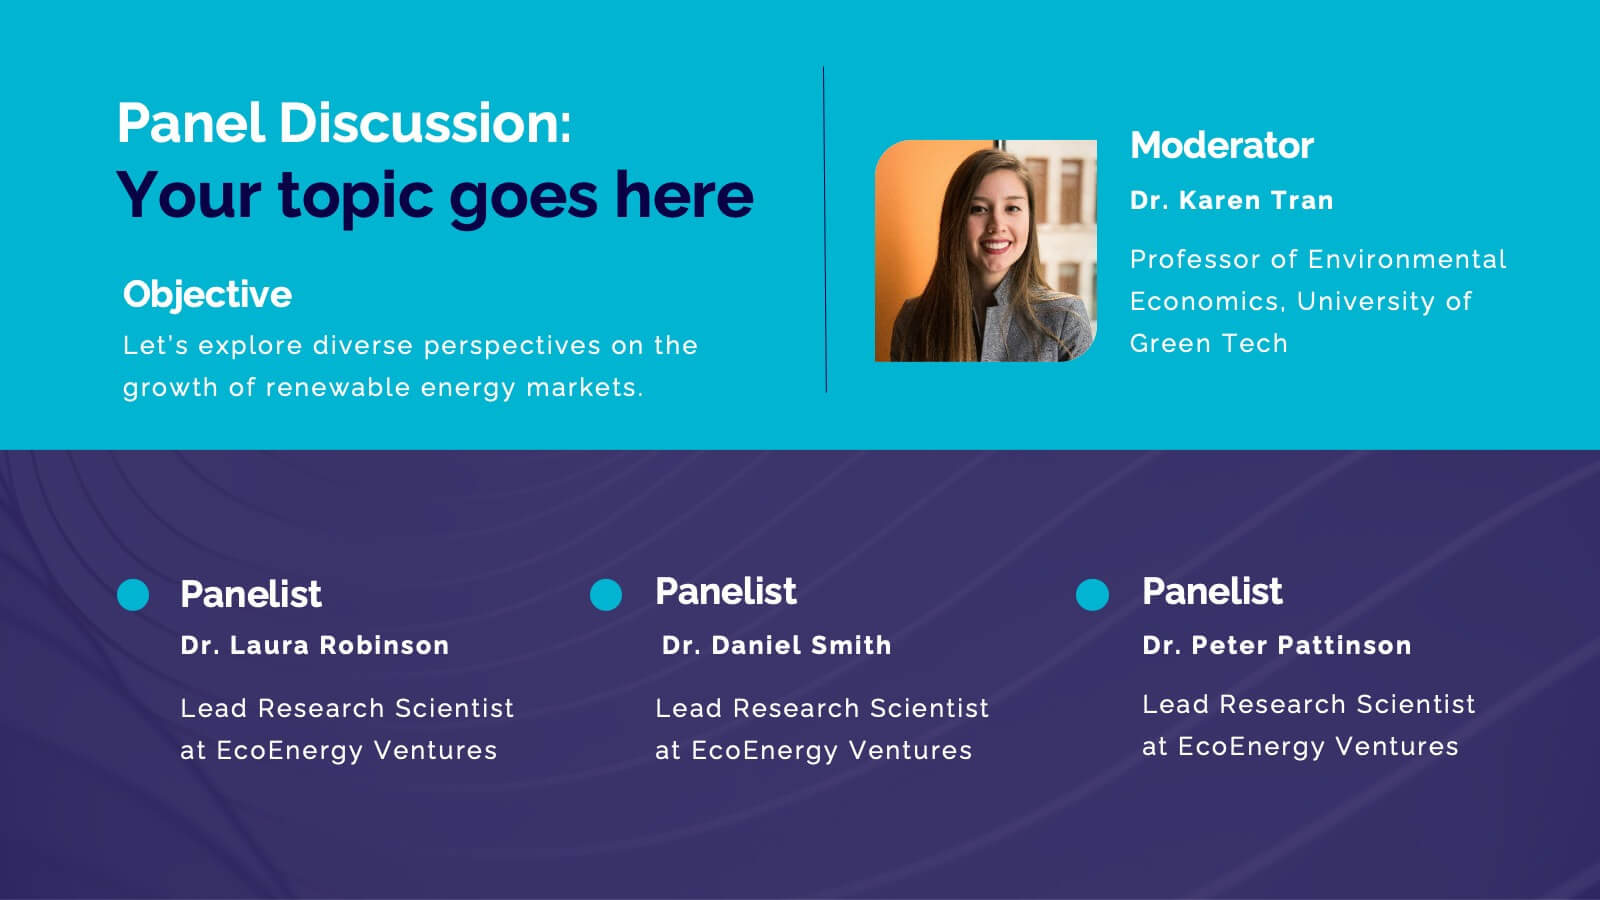
Nimbus Business Development Proposal Presentation
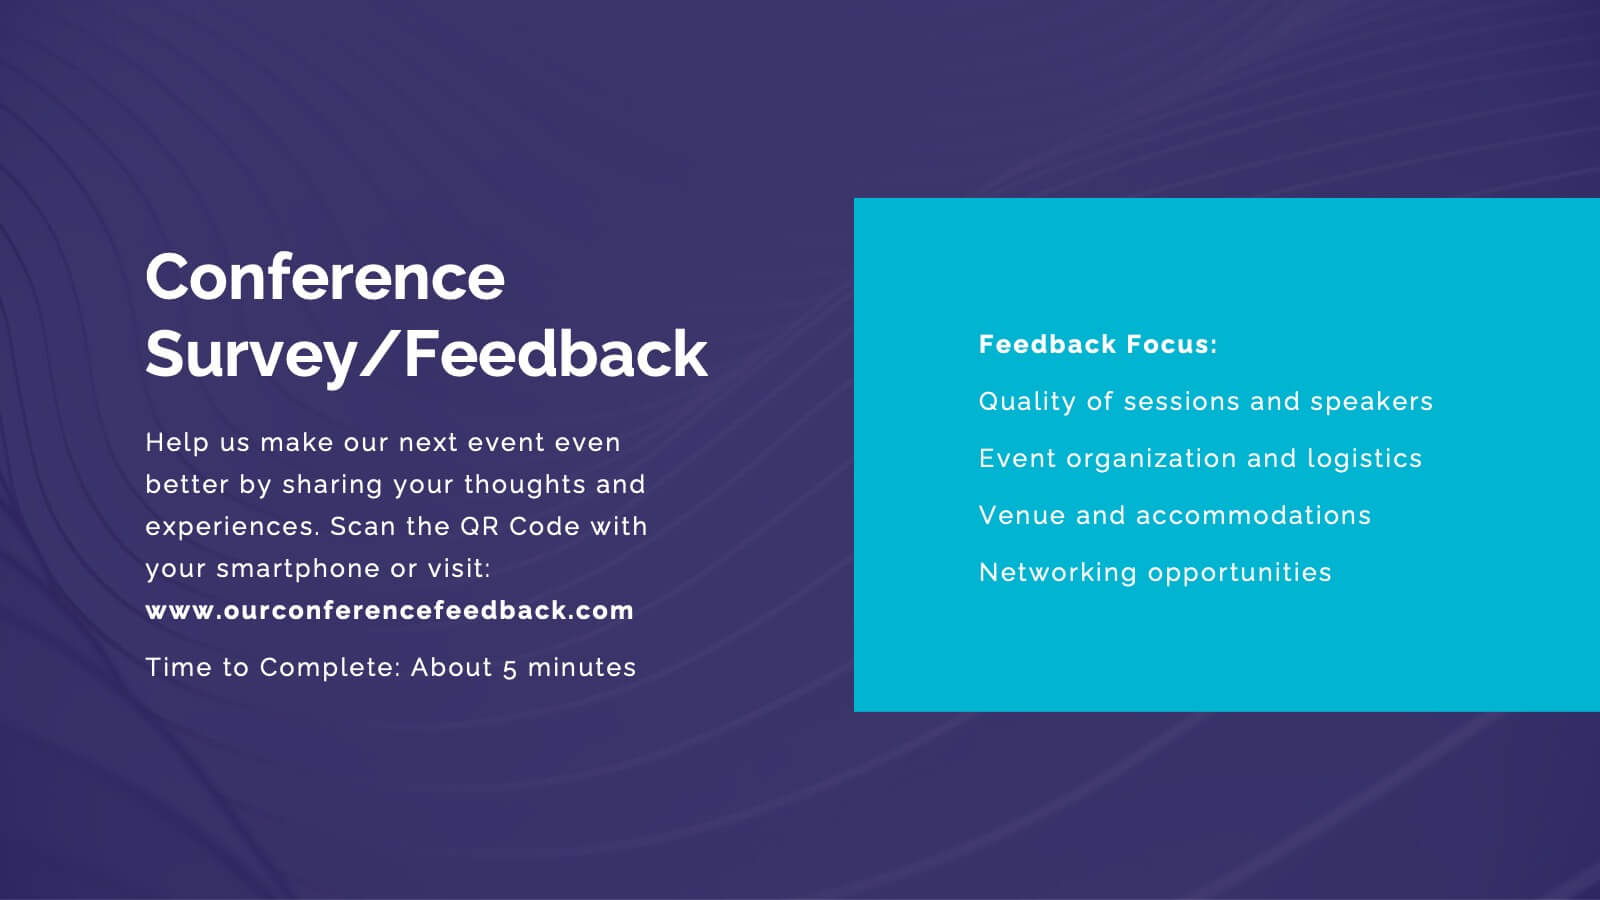
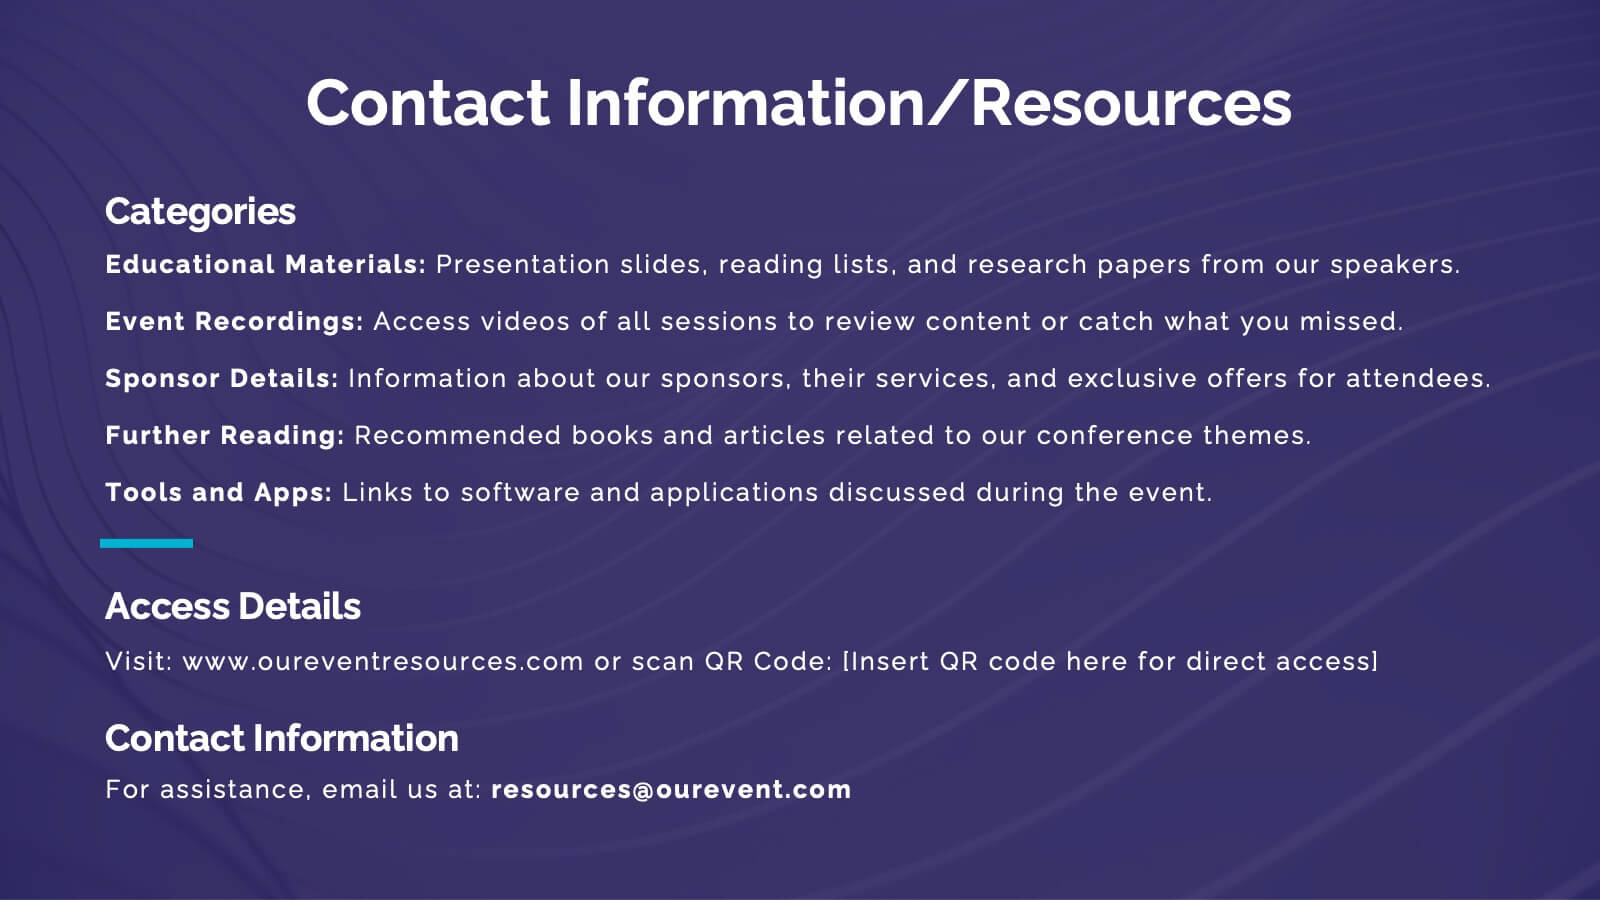
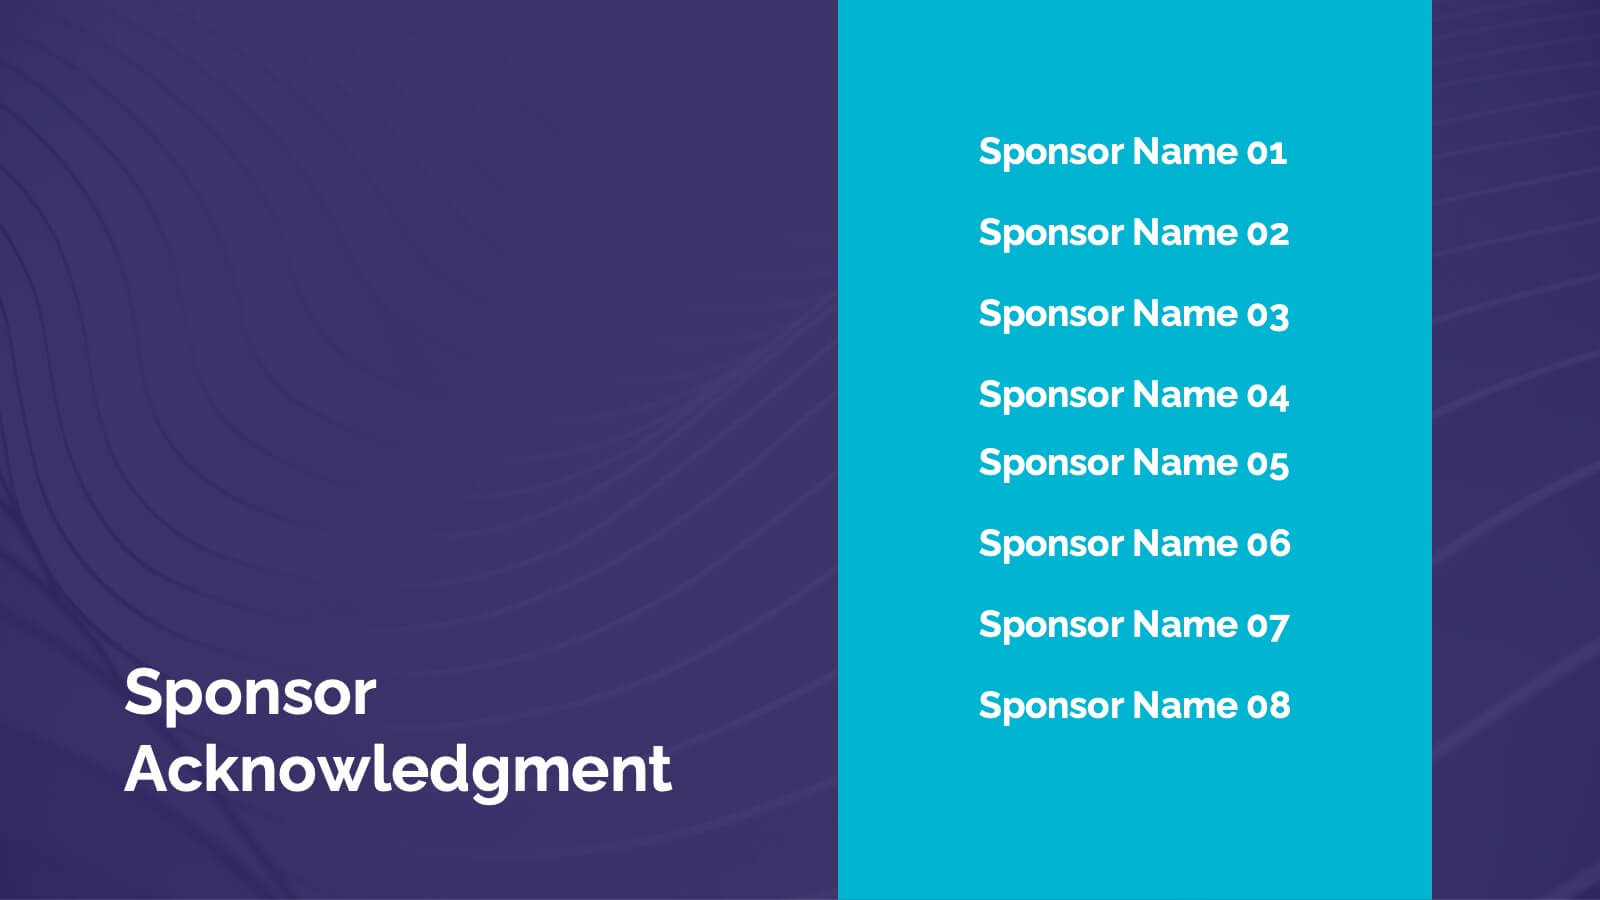
Boost your business presentations with this vibrant, professional template designed for business development proposals. Perfect for detailing conference overviews, themes, objectives, and keynotes, it features a clean and engaging layout. Highlight critical sessions and networking opportunities to captivate your audience. Compatible with PowerPoint, Keynote, and Google Slides, it ensures seamless presentations on any platform.


7 diapositivas
Numbers Infographic Presentation Template
This Numbers Infographic Presentation is a great resource for business and education. Designed to give you a quick and easy way to educate in an infographic presentation to use as an overview, or specific product description of what you are selling. This template features a smart object to insert text, images and logos which allow for easy customization. Each design is specially made and crafted in the highest quality possible to help bring your message to life in an exciting new way. This template is ideal for conveying statistical information in a visually stunning and engaging way.


7 diapositivas
Business Model Canvas Segments Infographic Presentation
The Business Model Canvas is a strategic management and entrepreneurial tool that helps businesses to visualize, analyze, and develop their business models. This template gives you the ability to create a visually attractive infographic while presenting your business model in a professional format. This eye-catching template is made to help your audience visualize the business model you are presenting and easily follow it with the instructive text slides. Customize this template in just a couple of minutes. Simple and easy to use, ready to be edited with colors and graphics of your choice.


7 diapositivas
Milestones in Project Management Infographic
Showcase the journey of your projects with our Milestones in Project Management Infographic, perfect for project managers, team leaders, and business strategists. This infographic is designed to visually communicate the key achievements and phases of your project timeline. Our infographic allows for a clear depiction of project progress, with markers for each significant milestone achieved. It's an effective tool for reflecting on past successes, current status, and future objectives. With customizable timelines and milestone markers, you can illustrate the path your project has taken, highlight critical deliverables, and forecast upcoming targets. This SEO-friendly infographic is crafted to enhance reports, presentations, and project reviews, making it a valuable asset for stakeholder communication. Employ this infographic to present a cohesive narrative of your project's development, celebrate accomplishments, and maintain momentum towards your project goals.


6 diapositivas
Macro Environment PESTEL Framework
Navigate market forces with confidence using this dynamic PESTEL framework layout—designed to help you assess Political, Economic, Social, Technological, Environmental, and Legal factors with clarity. Whether for strategy planning or external analysis, this slide keeps your insights visually organized and easy to explain. Fully compatible with PowerPoint, Keynote, and Google Slides.


7 diapositivas
Corporate Sustainability Management
Visualize your sustainability priorities with this hexagon-based framework slide, designed to highlight areas like environmental impact, health, welfare, and ethical governance. Ideal for CSR reporting, ESG strategy sessions, or internal sustainability initiatives. Easy to customize in PowerPoint, Keynote, and Google Slides.


6 diapositivas
Internal and External Communication Plan
Visualize your communication strategy with this dual-channel megaphone infographic, perfect for showcasing internal and external messaging flows. Ideal for corporate updates, PR plans, or stakeholder communications. Fully editable in PowerPoint, Keynote, and Google Slides.


3 diapositivas
Future of Aviation Technologies Presentation
Soar into the future of flight with this sleek, data-driven layout that visualizes progress and innovation in aviation. Perfect for showcasing new technologies, sustainability efforts, or industry growth trends, it balances clarity and impact. Fully customizable and compatible with PowerPoint, Keynote, and Google Slides for effortless presentation design.