


Características


¿Tienes alguna pregunta?
Recomendar


4 diapositivas
HR Policies and Employee Management Presentation
Clearly outline your workplace strategies with this HR Policies and Employee Management slide. Featuring four color-coded segments alongside an illustration of employee analysis, this layout is ideal for presenting onboarding steps, employee benefits, internal policies, or training procedures. Fully editable and compatible with PowerPoint, Keynote, and Google Slides for seamless customization.

21 diapositivas
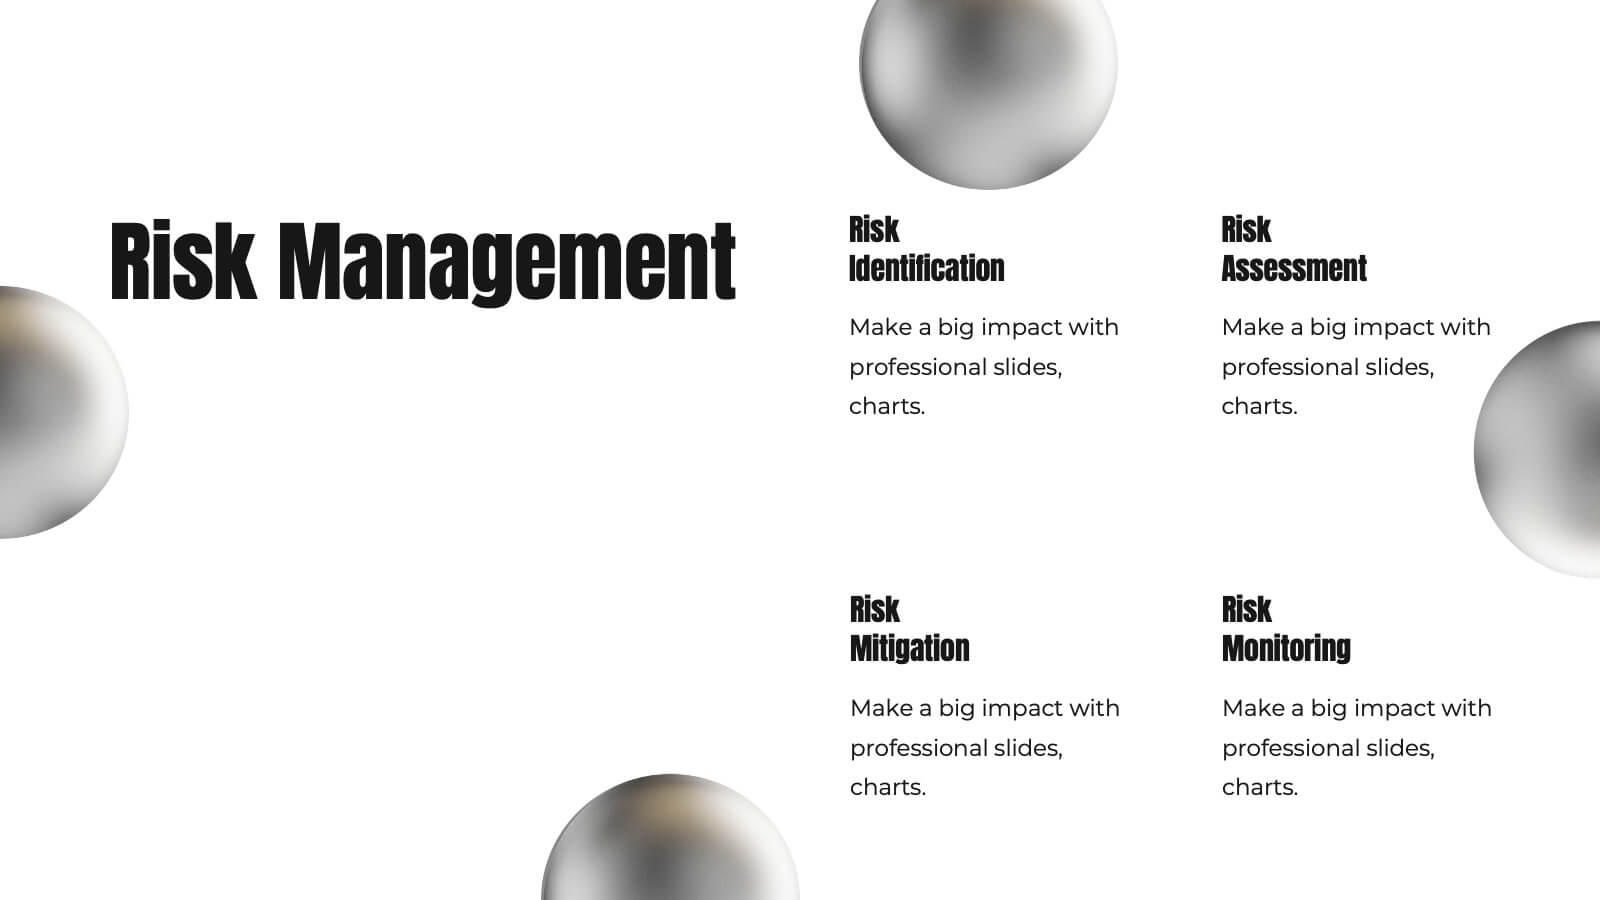
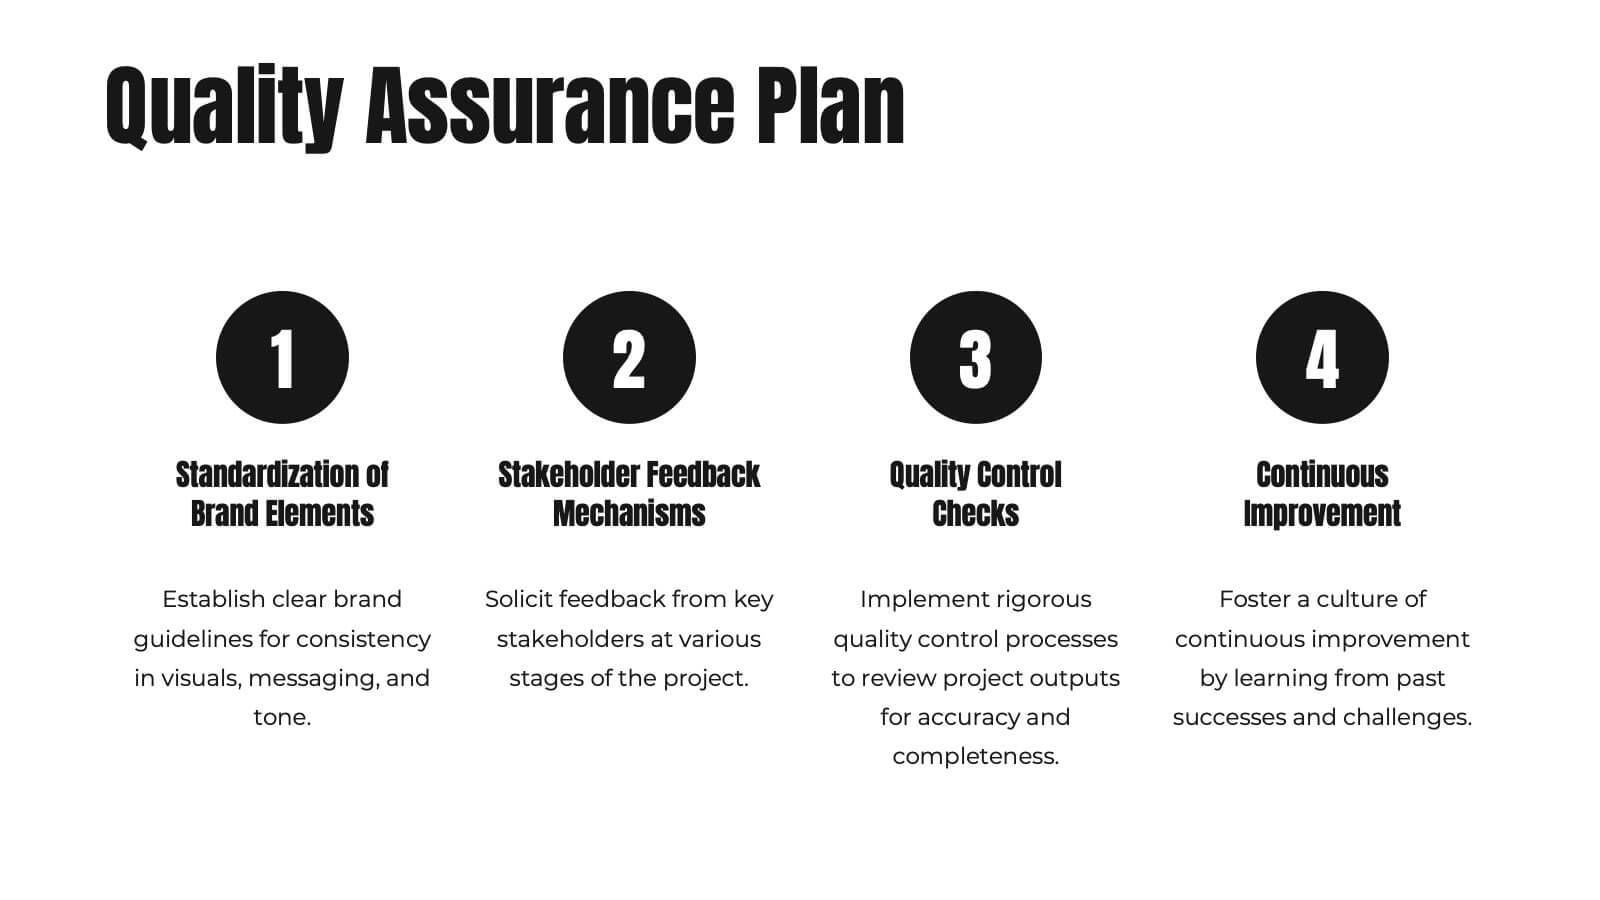
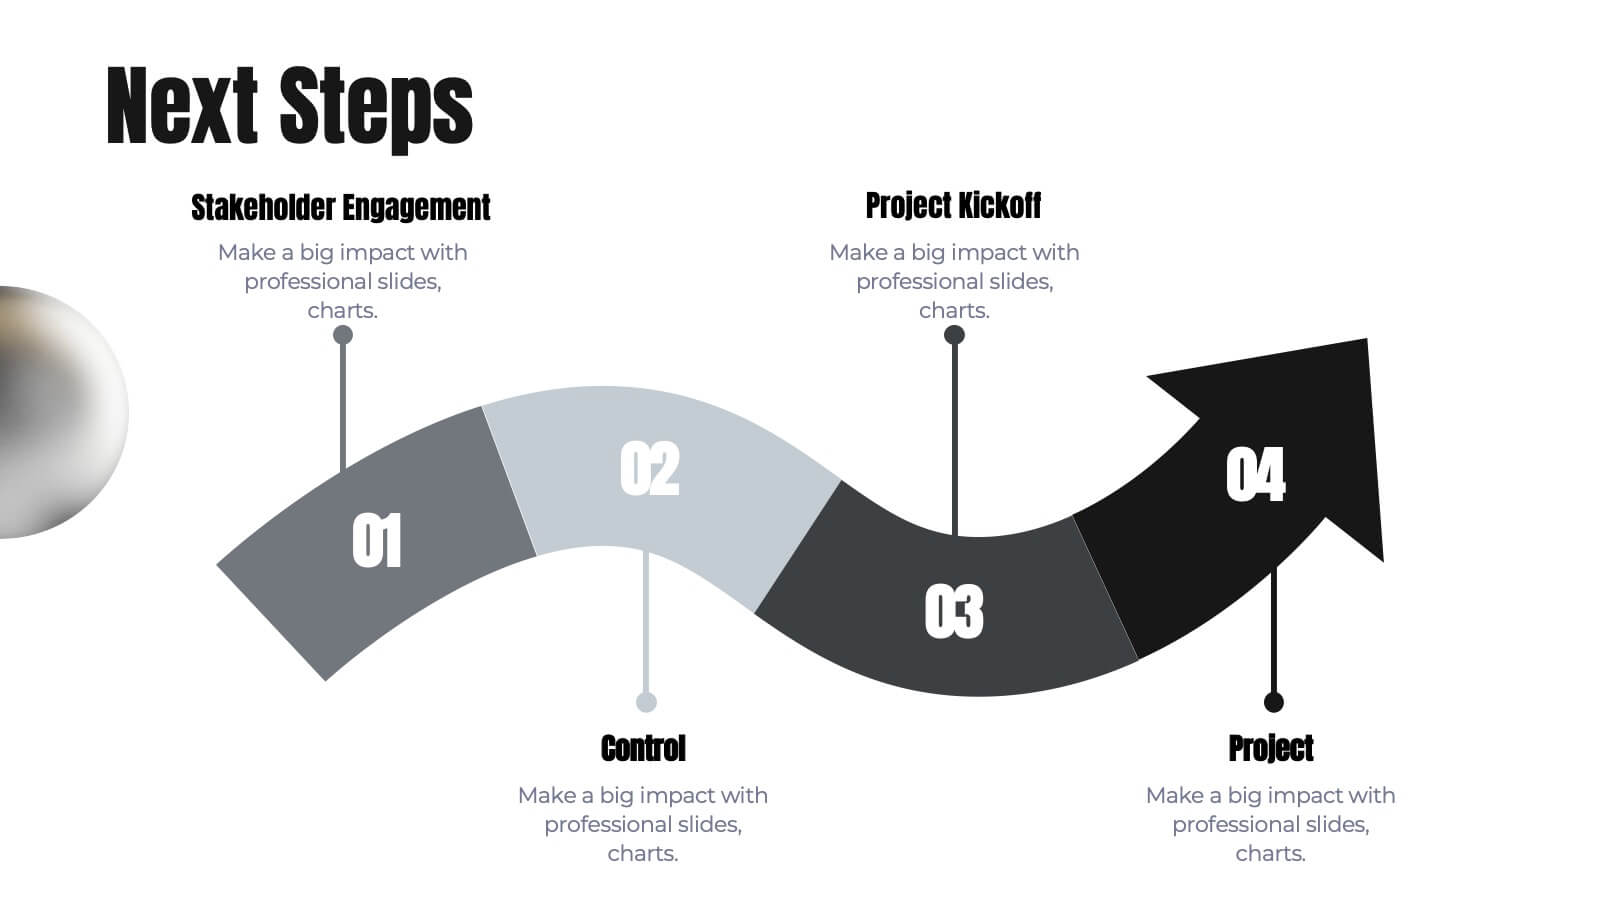
Janus Project Timeline Presentation
Craft a seamless project plan with this sleek and professional presentation template! Designed to guide you through every step, from project overview and scope of work to risk management and resource allocation, this template covers all the essentials. It's perfect for keeping your team on track with clear deliverables, timelines, and evaluation criteria. Compatible with PowerPoint, Keynote, and Google Slides for effortless presentations.


5 diapositivas
Hidden Risks Iceberg Model Diagram Presentation
Spotlight what lies beneath the surface with the Hidden Risks Iceberg Model Diagram Presentation. This slide helps you visually distinguish between visible issues and deeper, less obvious risks—perfect for risk assessments, compliance, safety briefings, and executive strategy discussions. Fully editable in PowerPoint, Keynote, and Google Slides for quick customization.


4 diapositivas
Tech Industry Report Slide Presentation
Spark curiosity from the first glance with a clean, modern layout that turns complex digital insights into clear, engaging visuals. This presentation helps you summarize key developments, highlight industry shifts, and communicate tech-focused findings with confidence. Perfect for reports, updates, and executive briefings. Fully compatible with PowerPoint, Keynote, and Google Slides.


6 diapositivas
Corporate Governance Strategy
Present your company’s leadership structure with clarity using this corporate governance strategy slide. This hexagonal framework highlights key areas such as vision, objectives, and strategy—surrounded by six supporting pillars. Each section includes editable icons and text for board responsibilities, ethics, oversight, and more. Ideal for executive updates, policy reviews, and stakeholder reports. Fully customizable in PowerPoint, Keynote, and Google Slides.


20 diapositivas
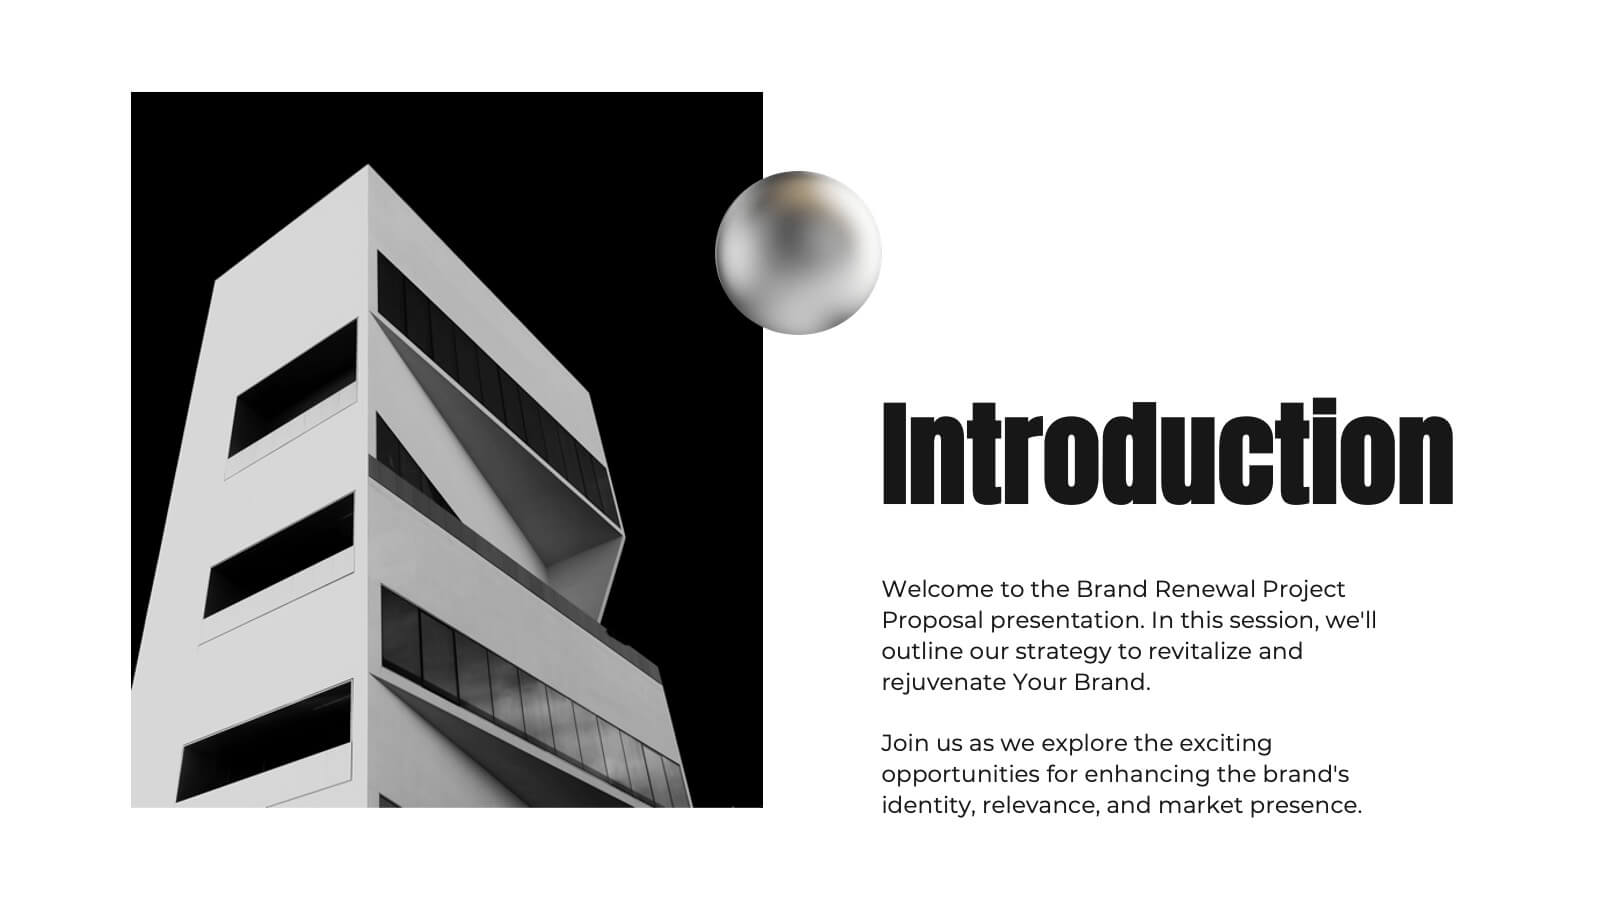
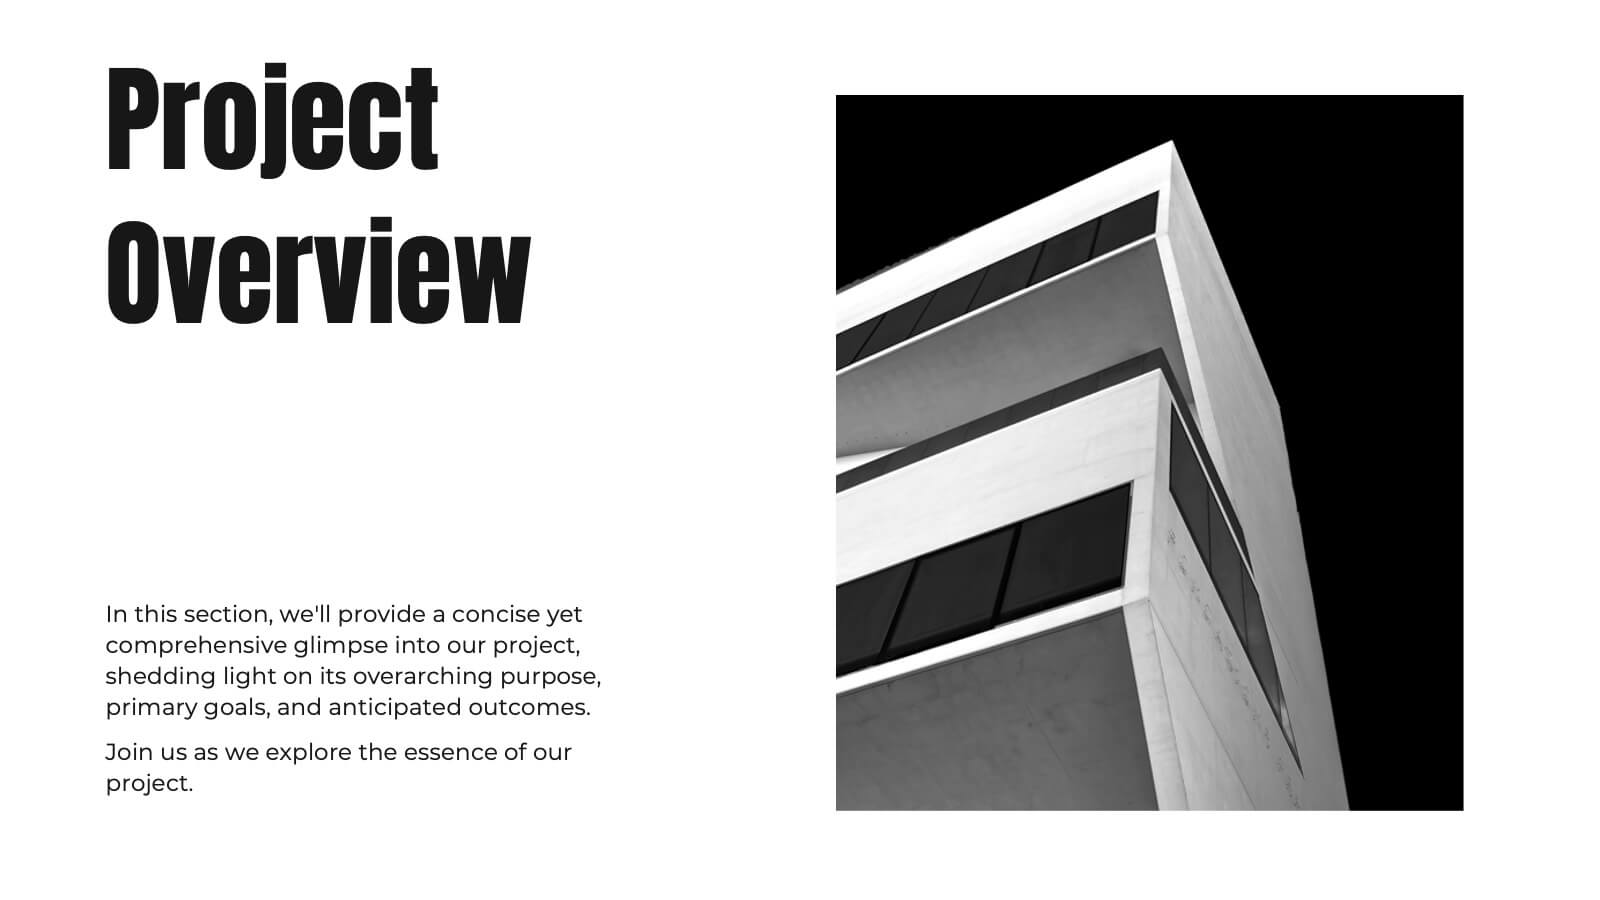
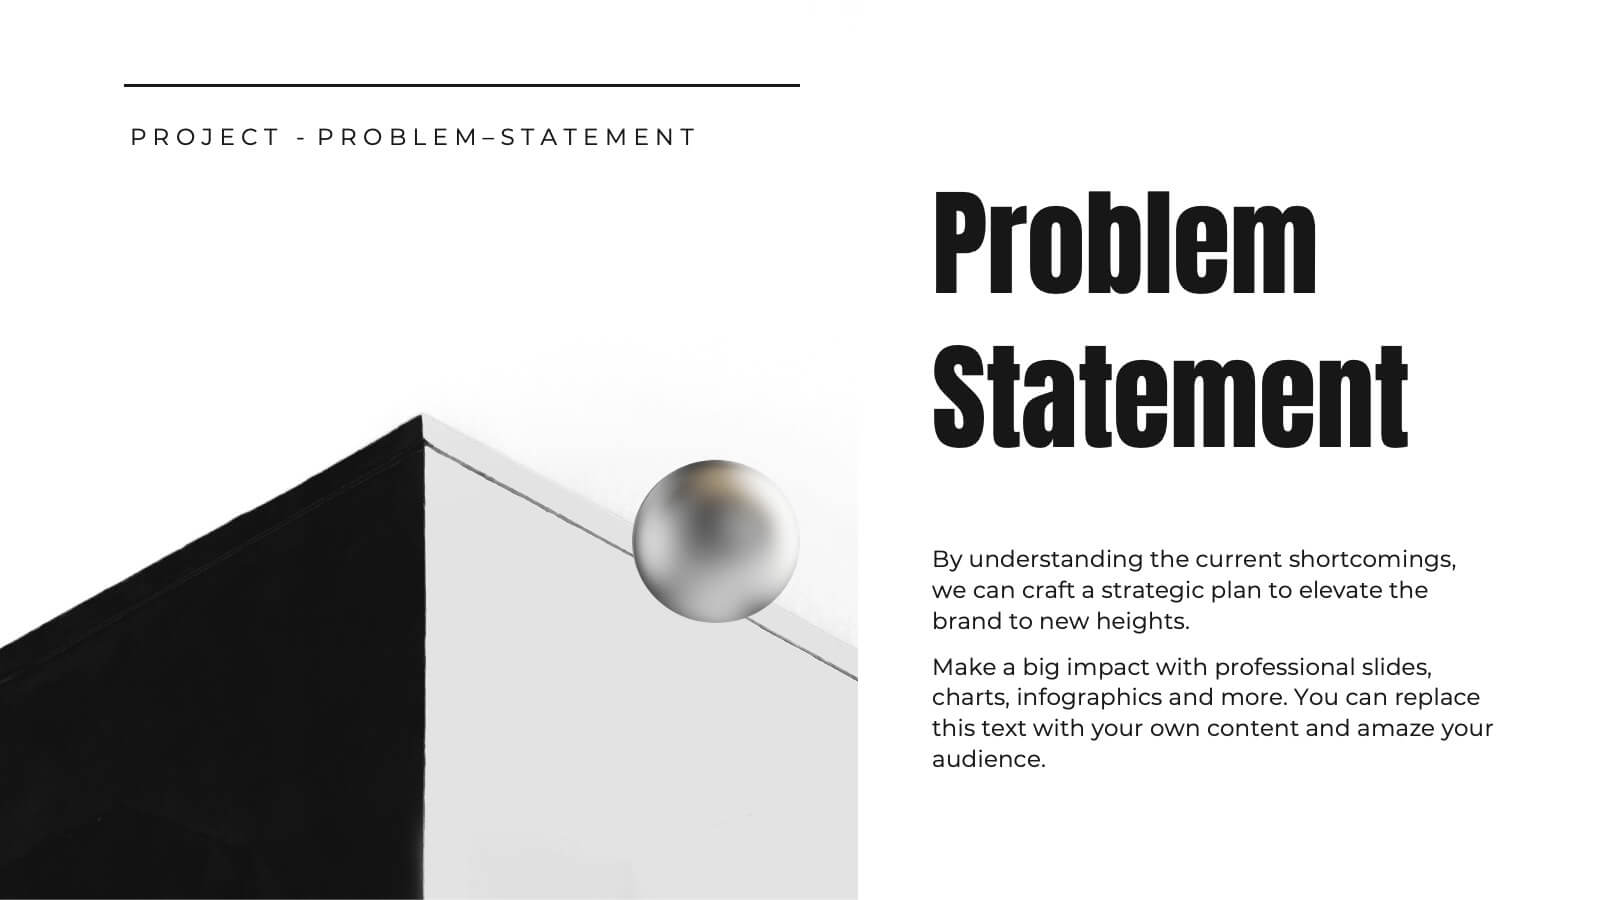
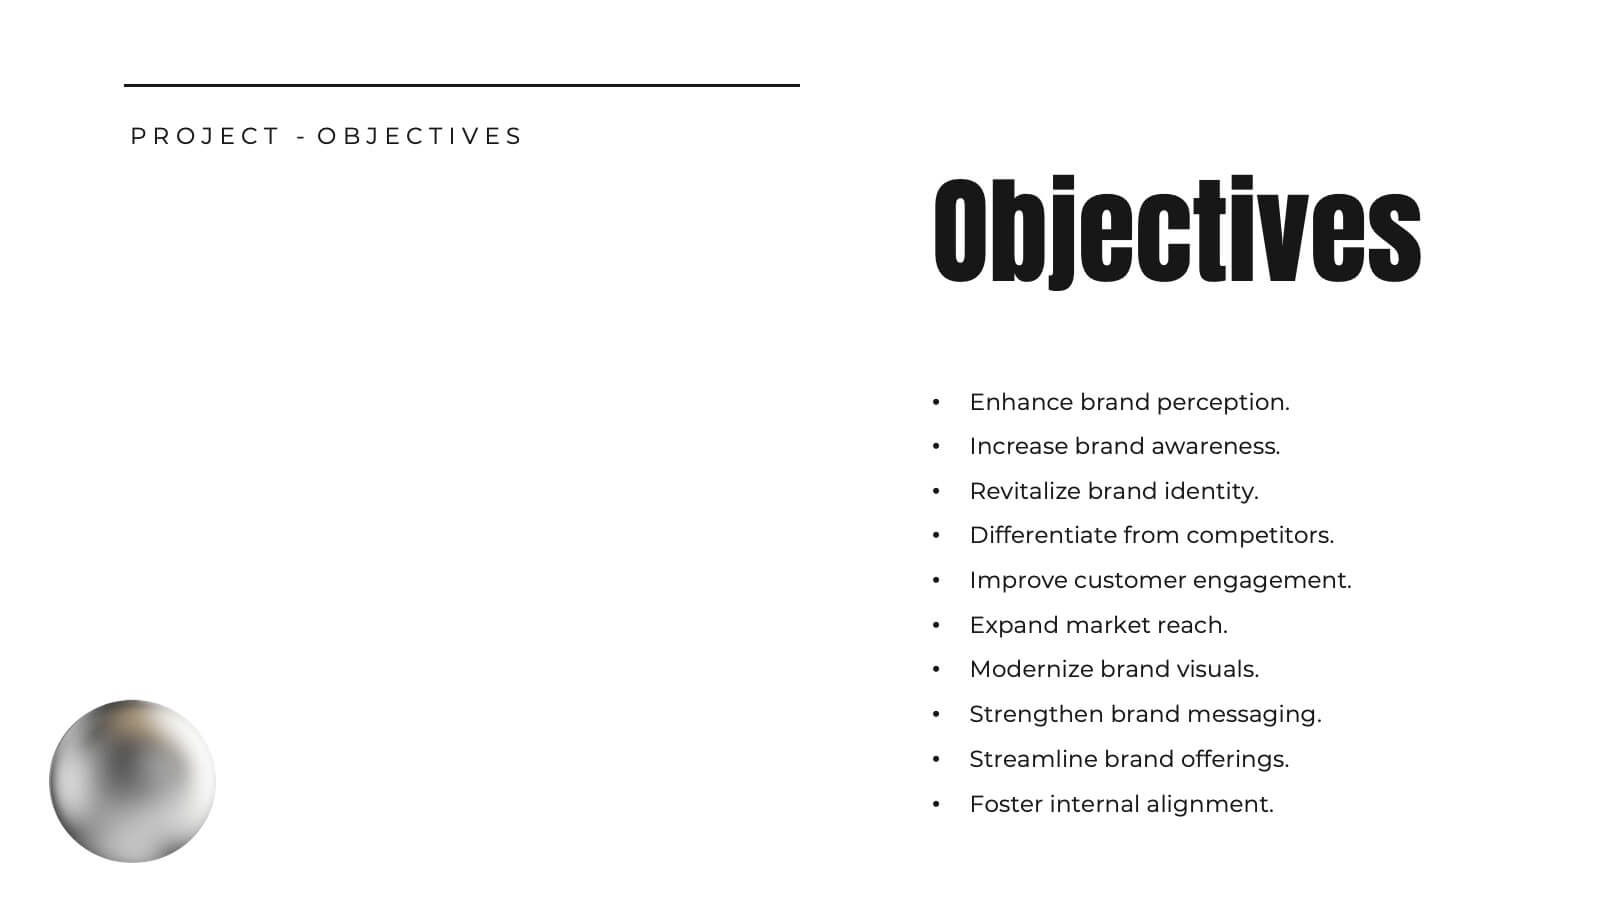
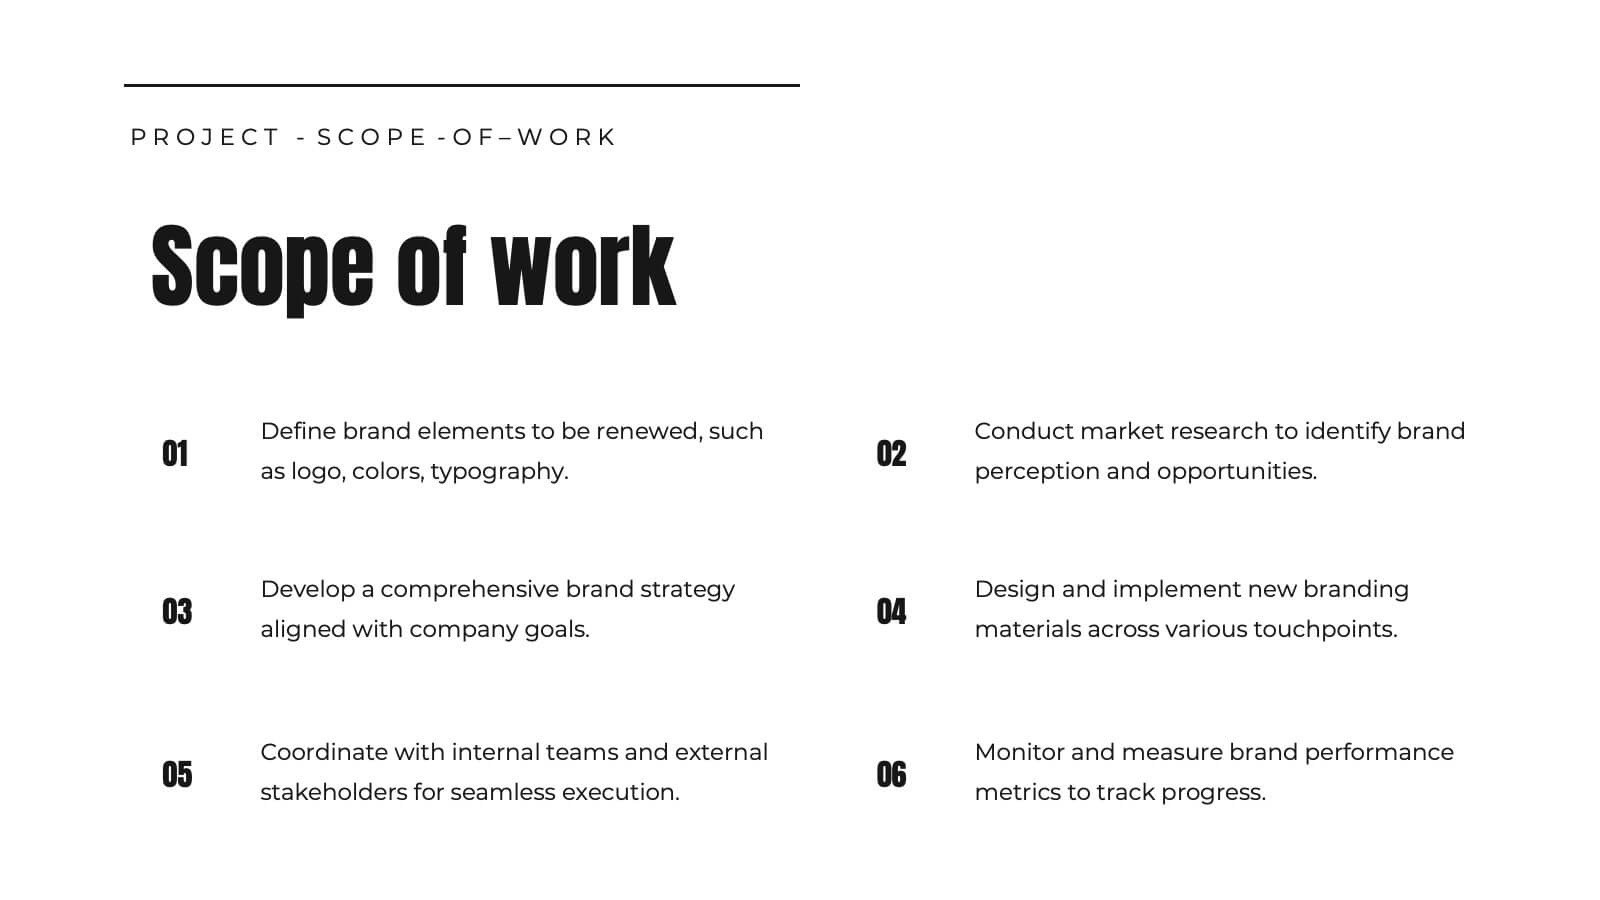
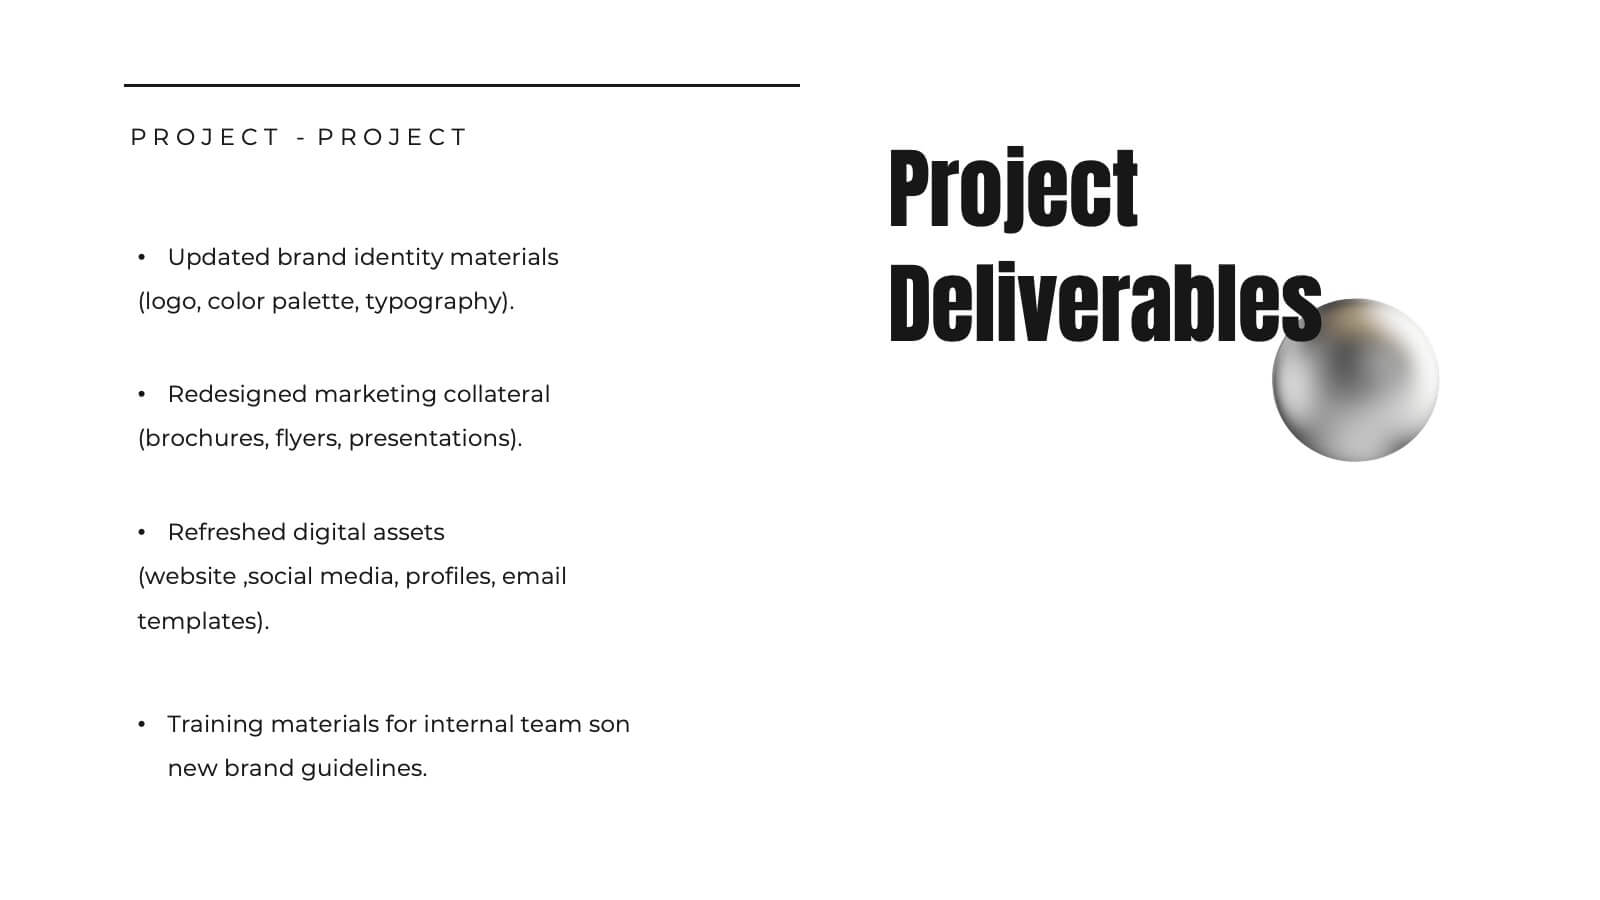
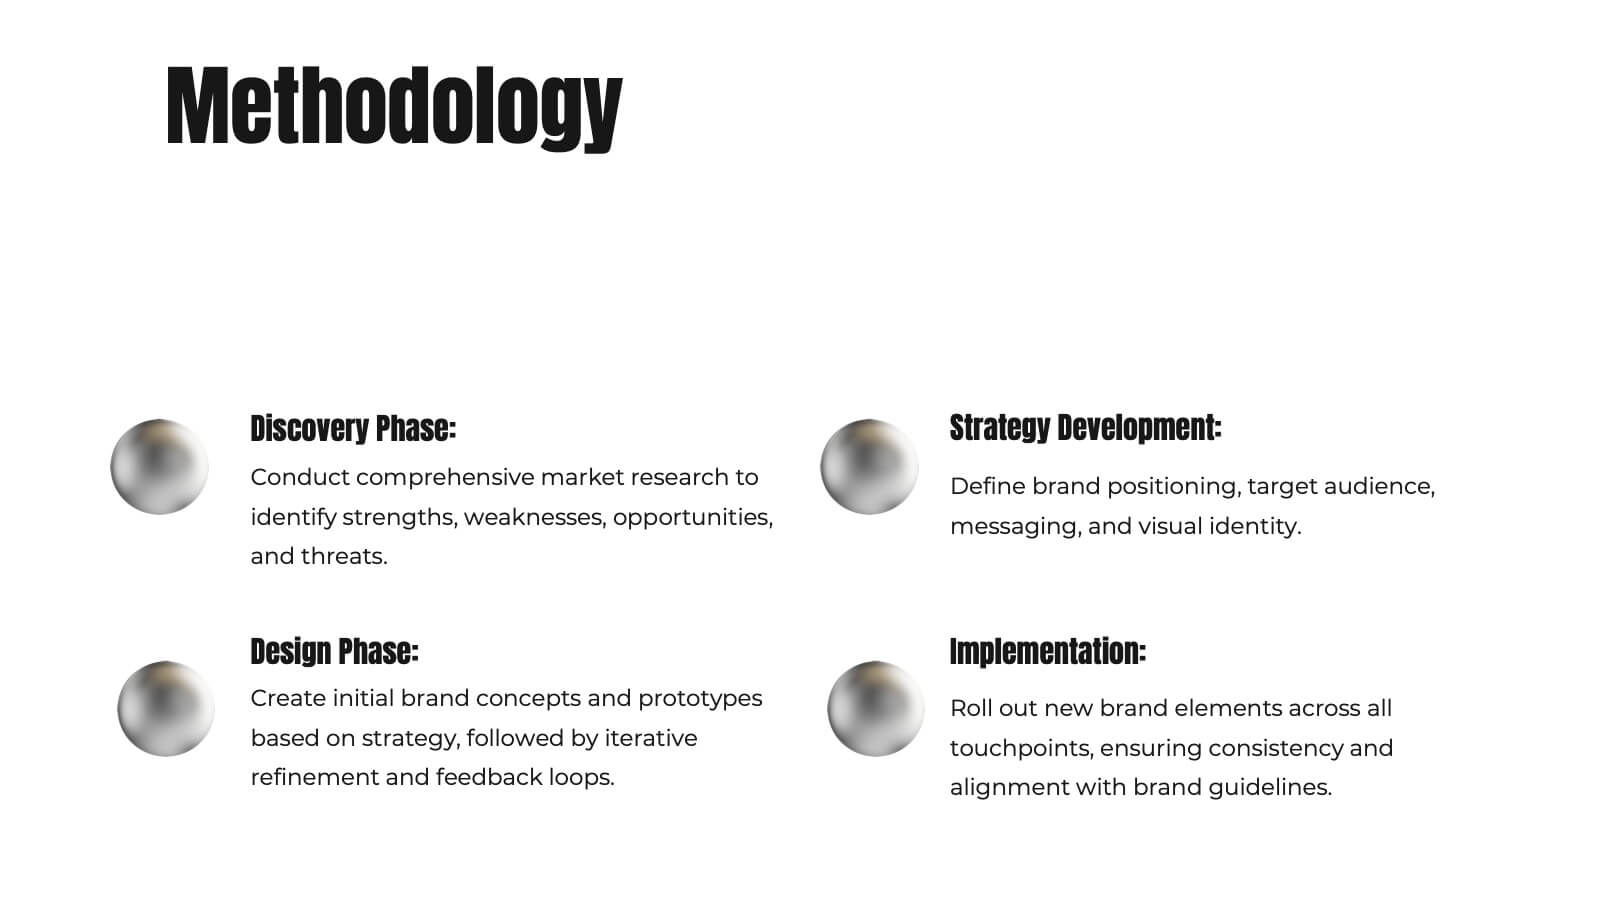
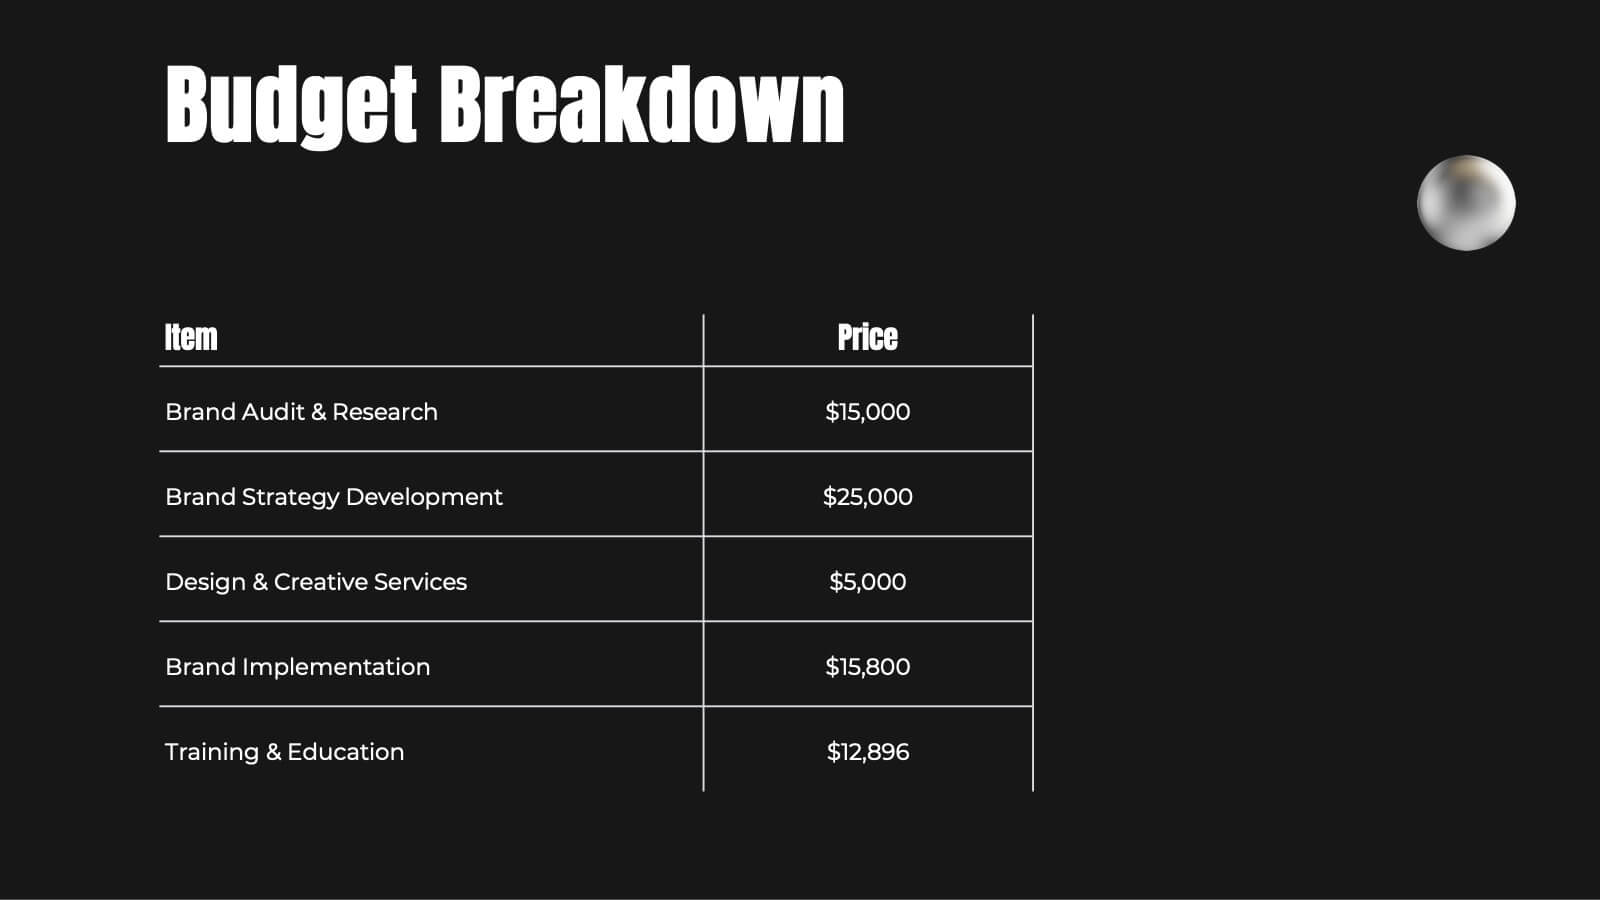
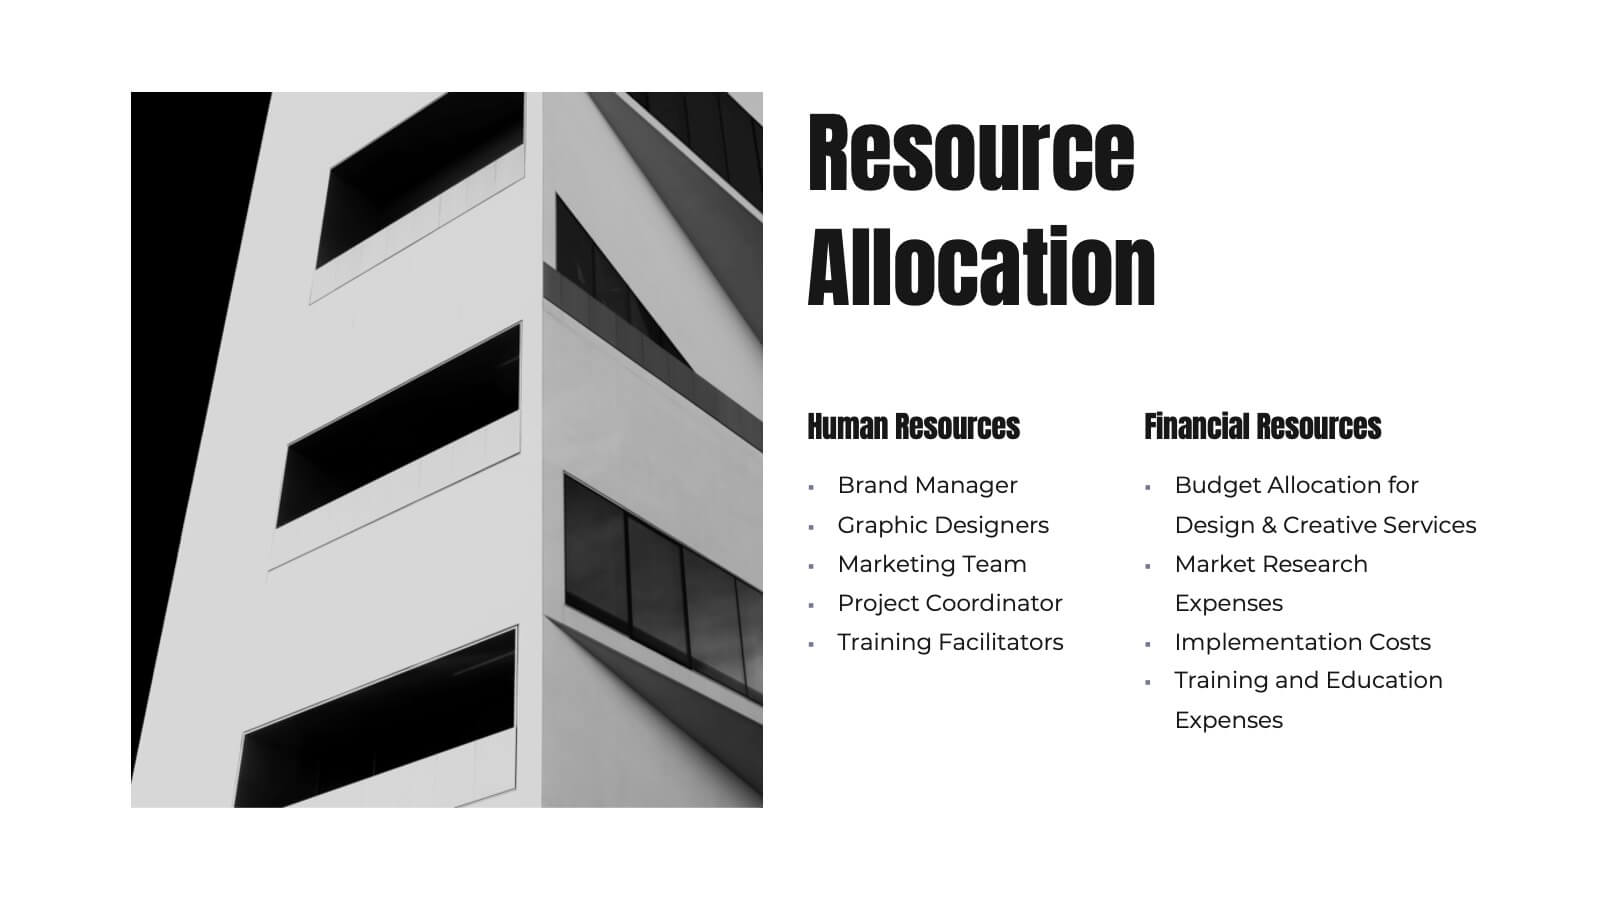
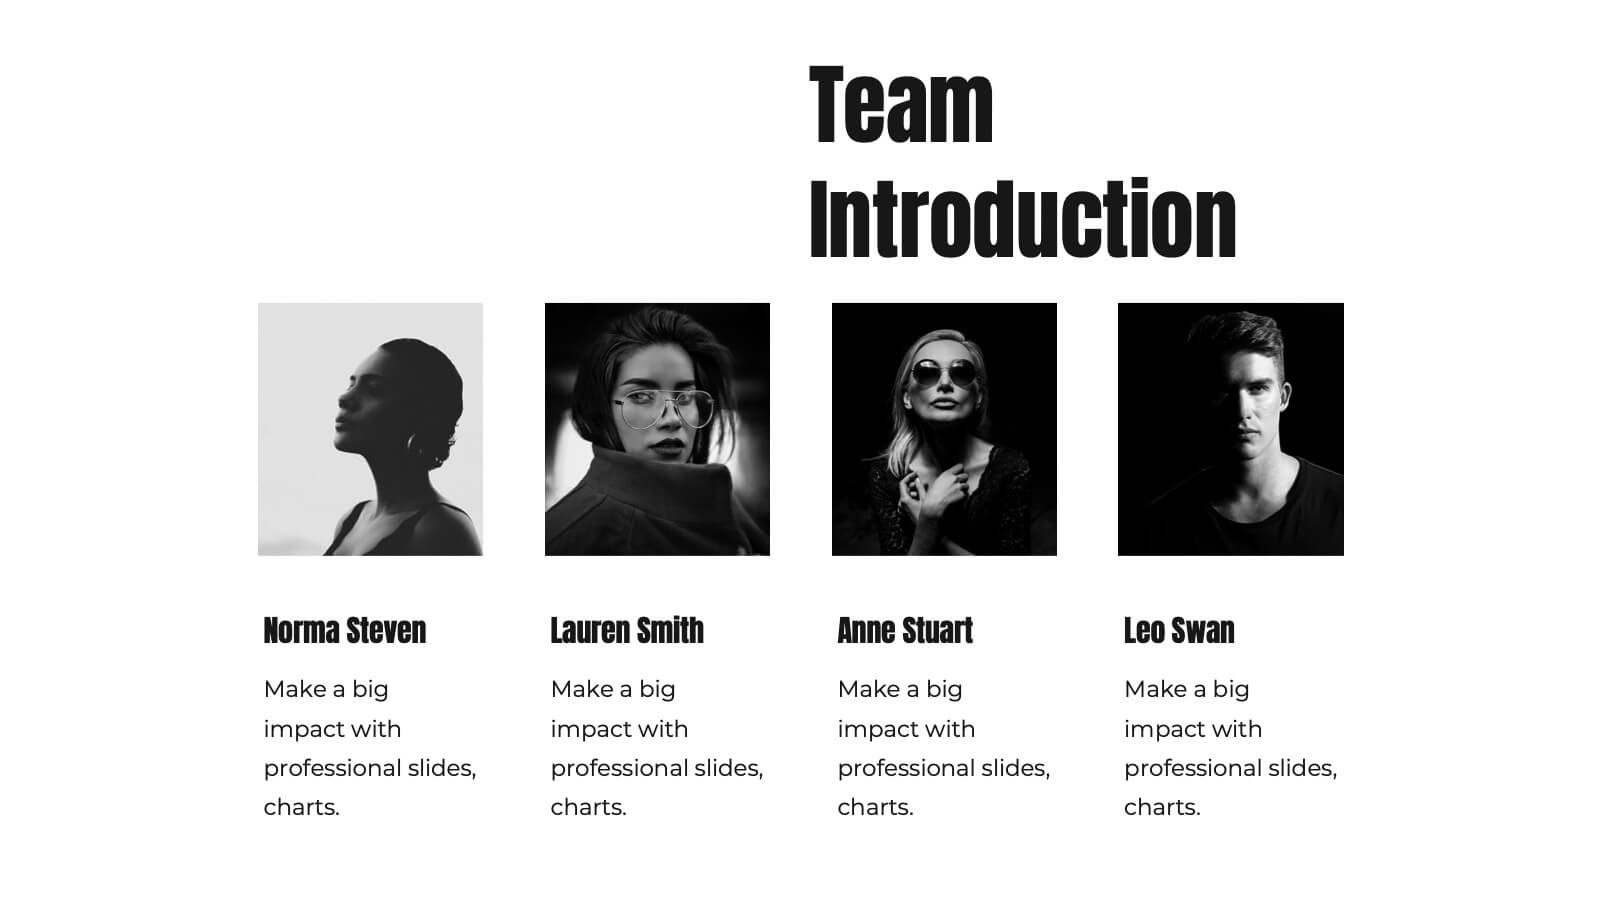
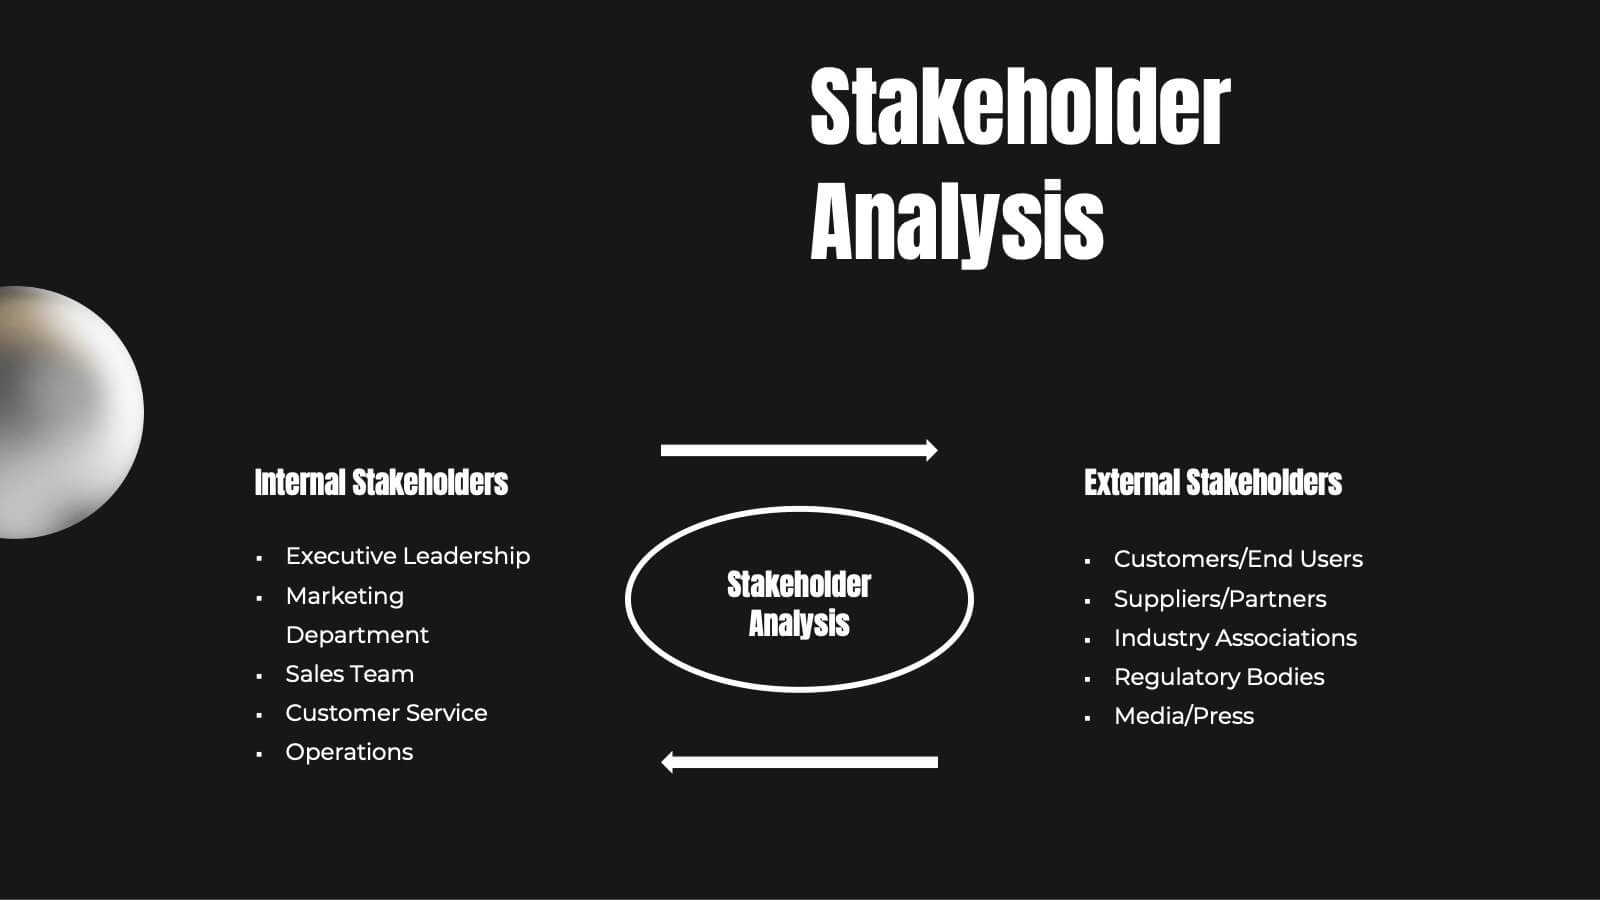
Oscillation Project Proposal Presentation
This project proposal template is designed to captivate your audience with a bold purple and yellow color scheme, adding a modern flair to your presentation. It includes comprehensive sections like company overview, objectives and goals, methodology, deliverables, and budget breakdown. Perfect for clearly communicating your project vision and strategy, this template streamlines your content while highlighting your professional approach. Compatible with PowerPoint, Keynote, and Google Slides, it provides versatility for seamless delivery across platforms.


8 diapositivas
Workforce Engagement Strategy Presentation
Visualize employee engagement plans with the Workforce Engagement Strategy Presentation. This template includes timeline-style layouts to communicate team initiatives, motivation tactics, and HR strategies effectively. Ideal for team leads, HR managers, and consultants. Fully customizable in PowerPoint, Keynote, and Google Slides to suit your brand and communication goals.


21 diapositivas
Alchemos UX Case Study Presentation
Showcase your UX process with clarity and impact using this sleek case study presentation. Covering key aspects like user research, interaction design, prototyping, and responsive design, this template helps you tell a compelling design story. Fully customizable and compatible with PowerPoint, Keynote, and Google Slides for a seamless presentation experience.


6 diapositivas
Psychology Mind Map Template Presentation
Unlock the brain’s potential with this smart and sleek visual! Perfect for organizing complex concepts, this mind map template helps you visualize psychological theories, thoughts, or data connections in a head-shaped layout using colored hexagons. Easily editable and professionally designed, it works seamlessly in PowerPoint, Keynote, and Google Slides.


5 diapositivas
Experience-Based Smile Scorecard Presentation
Measure sentiment with ease using this Experience-Based Smile Scorecard slide. Designed with a vertical battery-style layout, each tier represents a distinct emotional level—from dissatisfied to happy. Ideal for visualizing user experiences, customer feedback, or service quality. Fully editable and compatible with PowerPoint, Canva, and Google Slides.


6 diapositivas
Environmental Ecology Report Presentation
Bring sustainability to life with a clear, refreshing design that makes complex environmental insights easy to share. This presentation helps you explain key ecological data, conservation efforts, and resource impact using simple visuals and structured points. Perfect for reports or awareness talks. Fully compatible with PowerPoint, Keynote, and Google Slides.


23 diapositivas
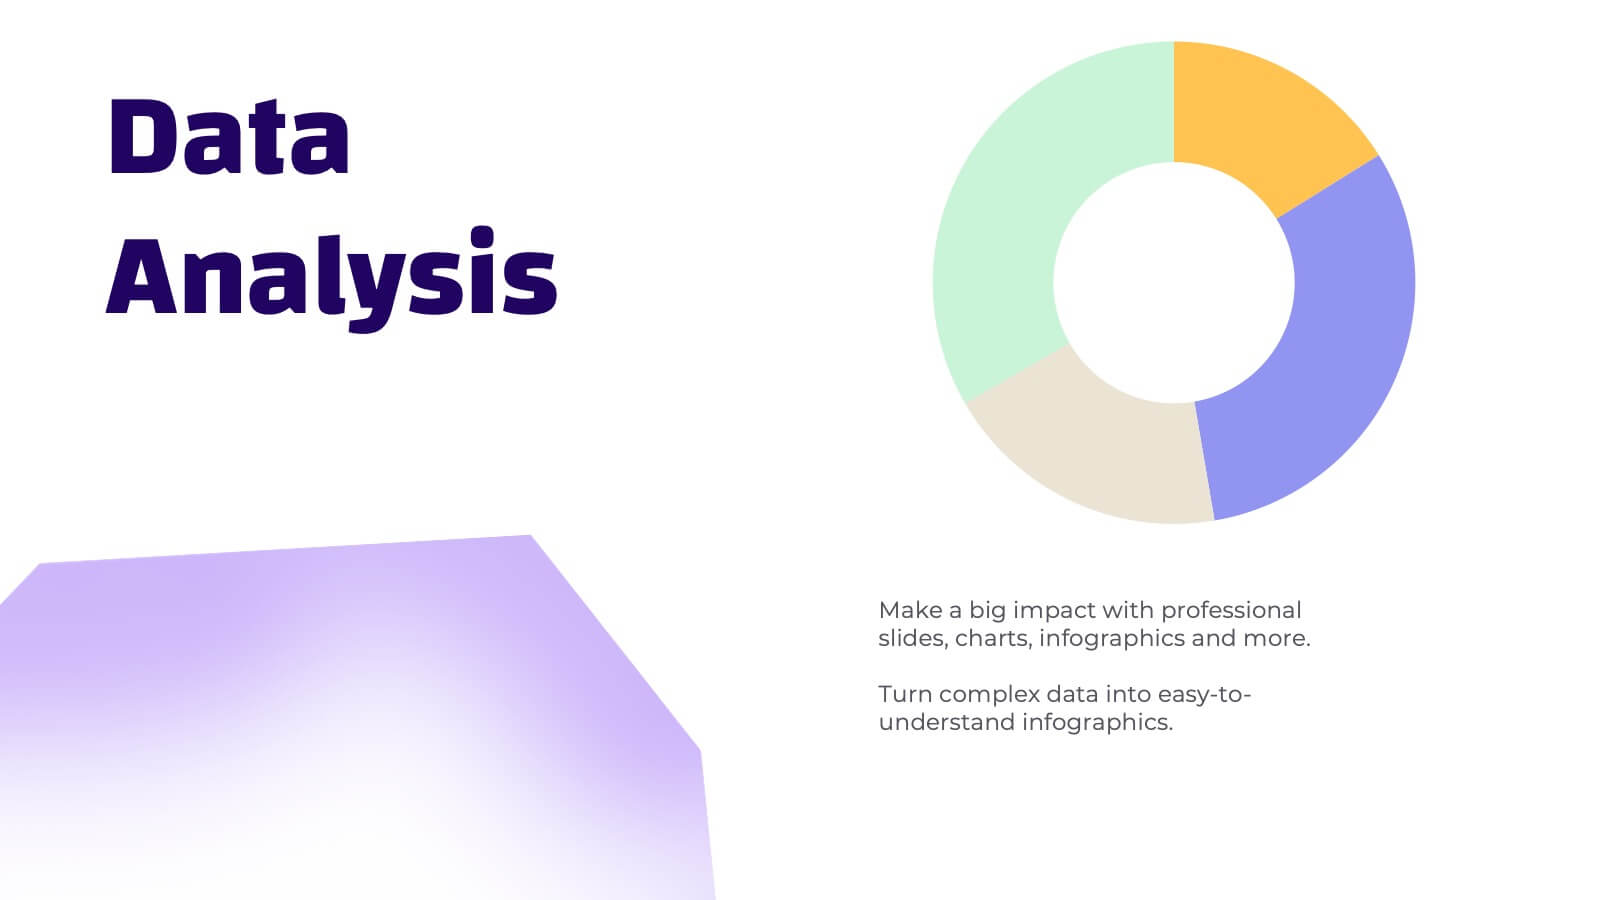
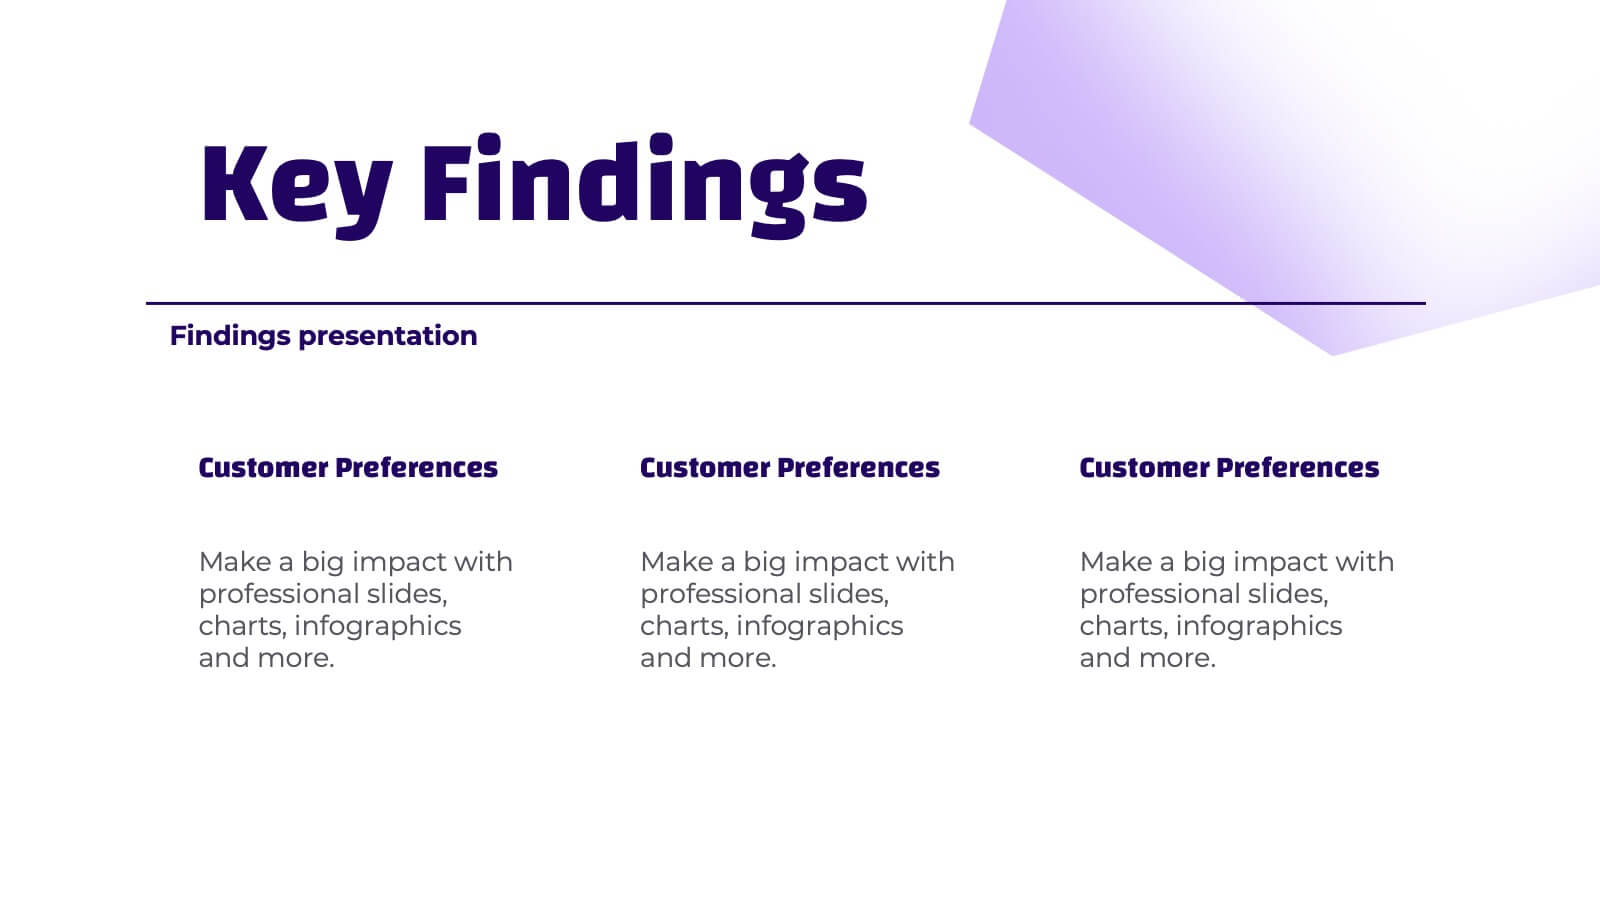
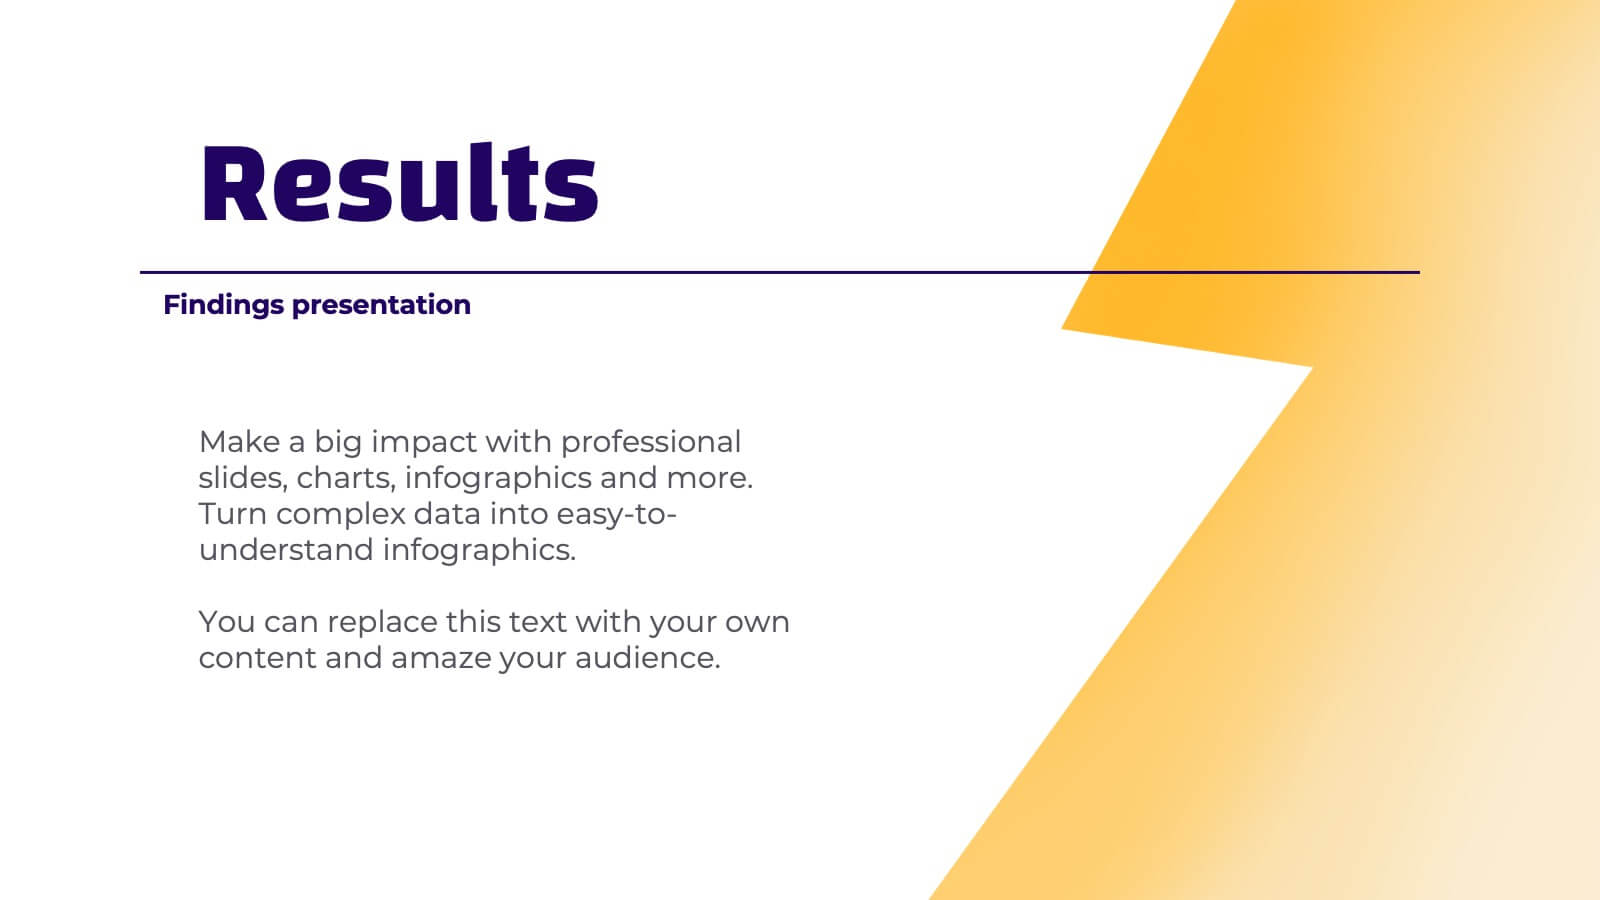
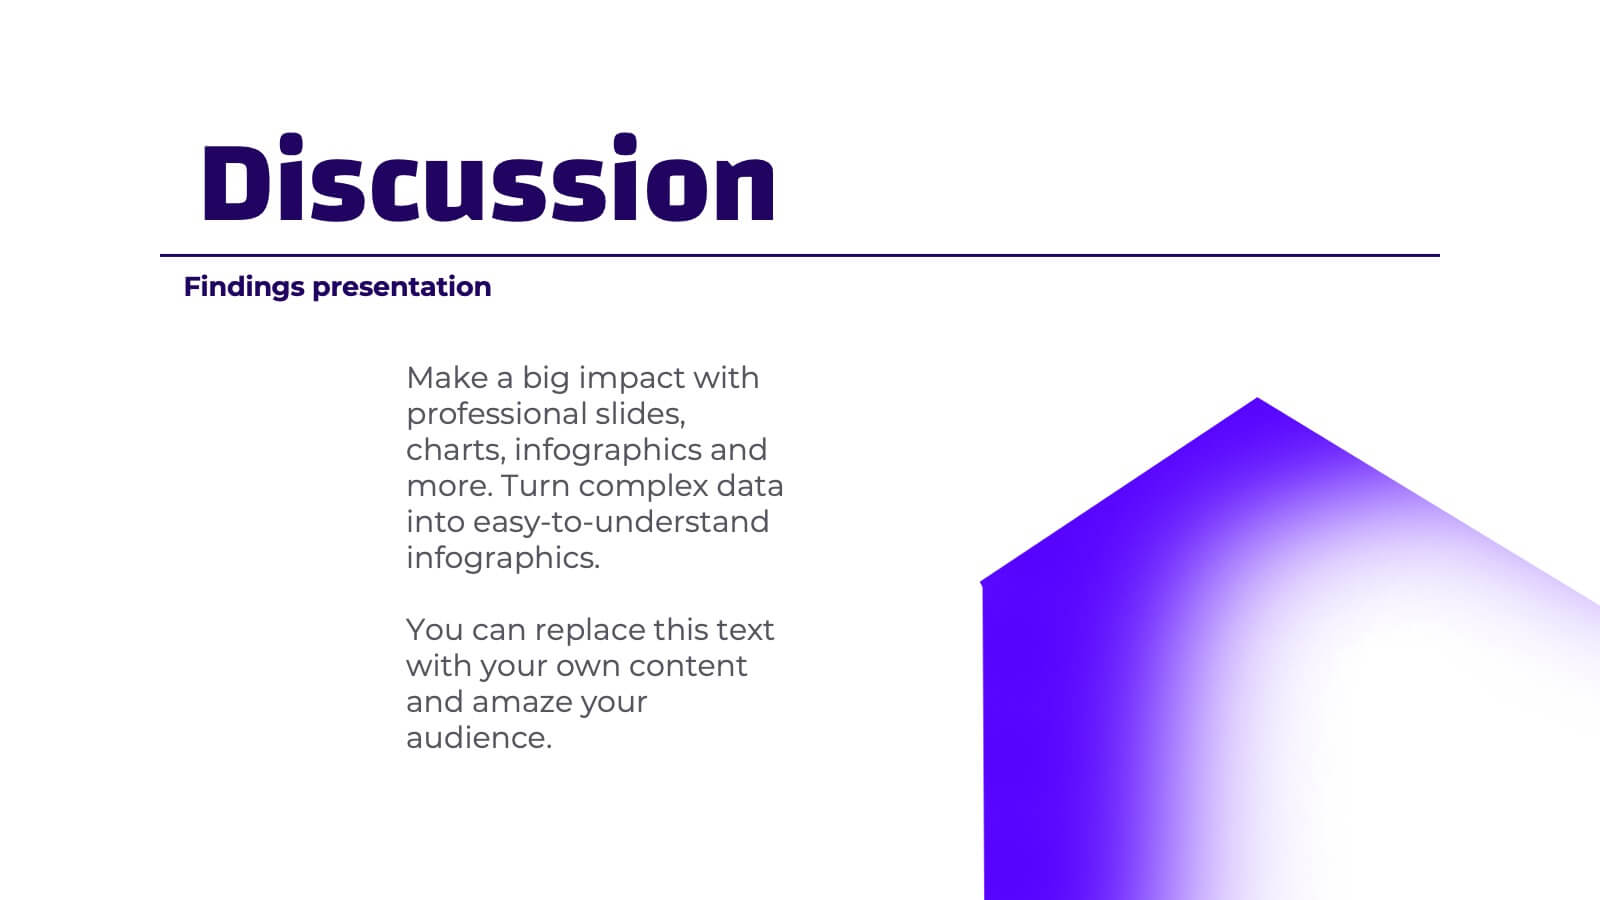
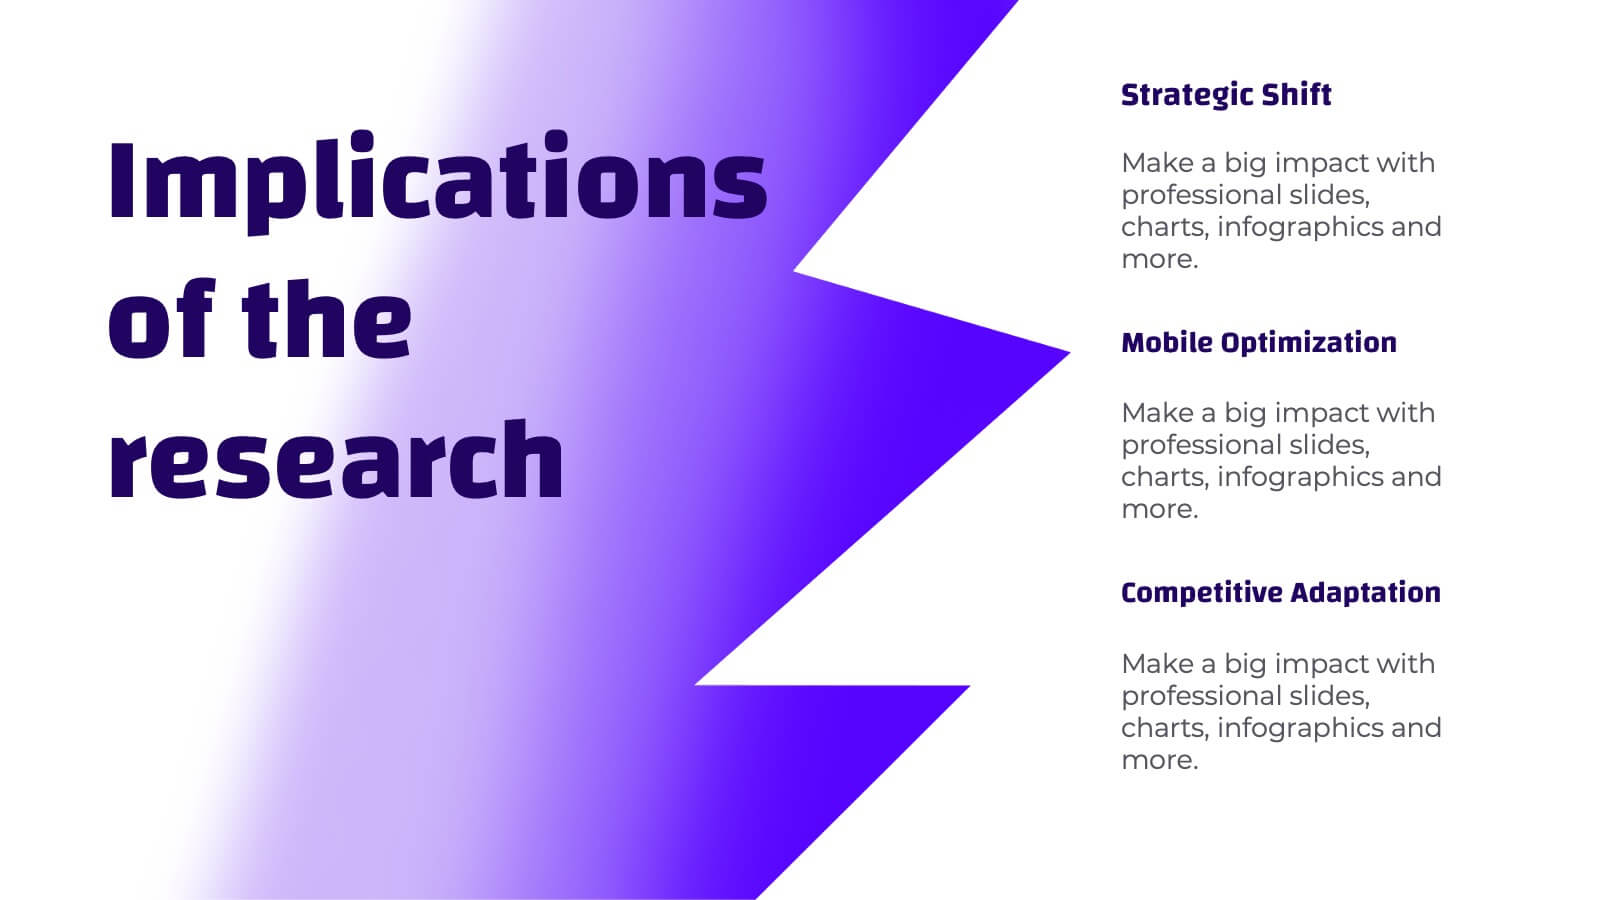
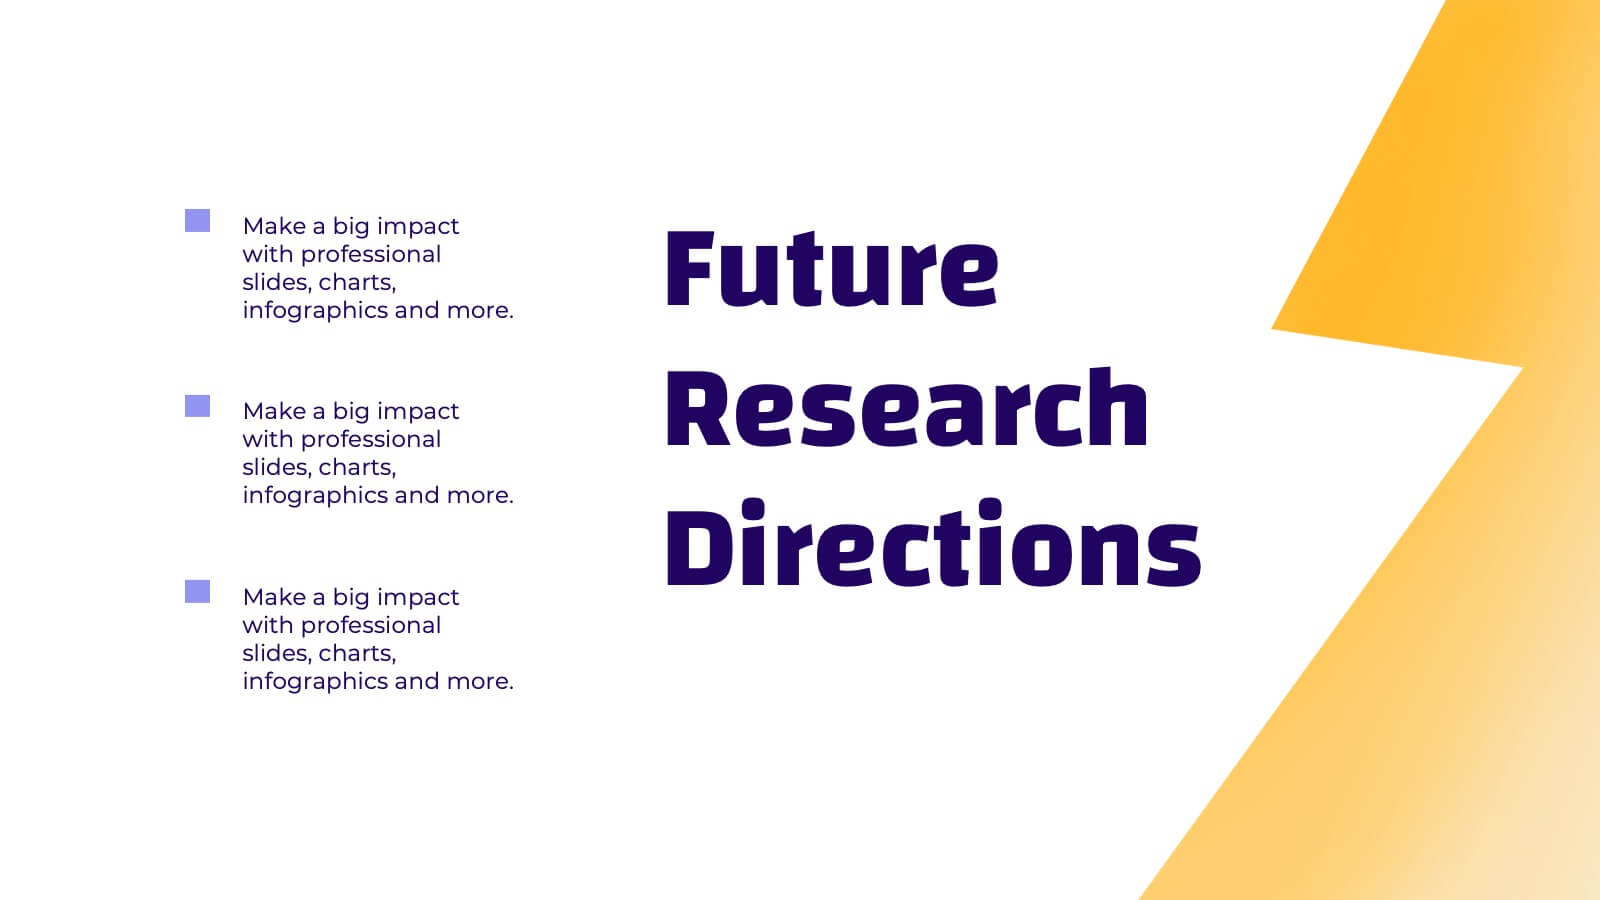
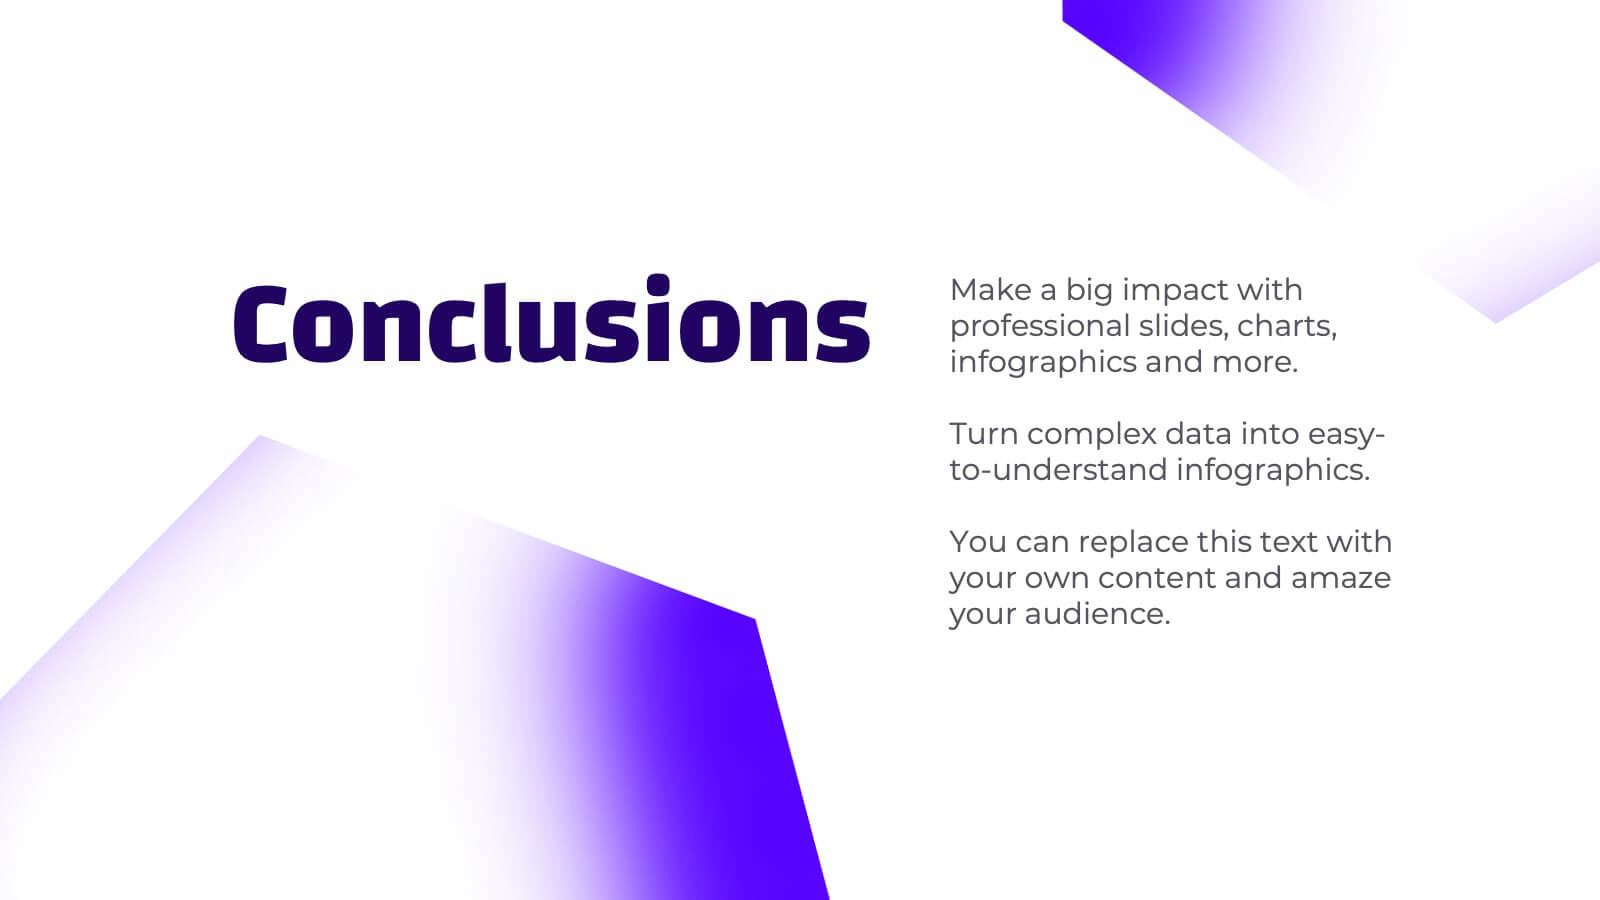
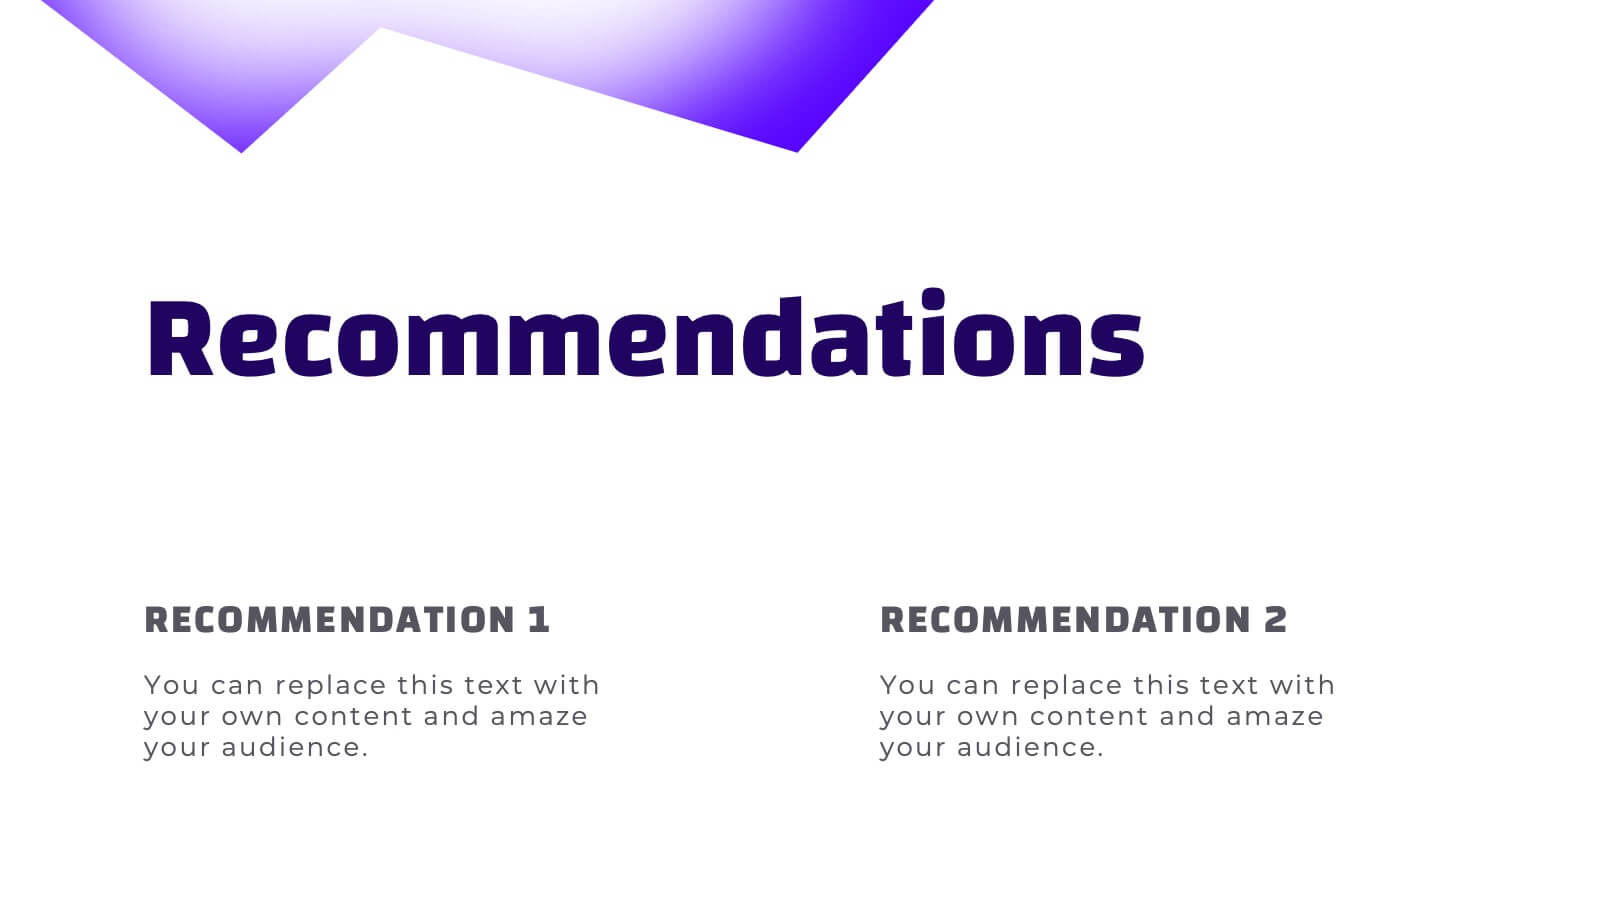
Naiad Qualitative Research Findings Presentation
Dive into your data with this refreshing, Naiad-inspired presentation template, perfect for sharing qualitative research findings! Designed to showcase insights, trends, and key conclusions with clarity, this visually appealing layout ensures your research captivates and informs. Make your data flow effortlessly. Compatible with PowerPoint, Keynote, and Google Slides for easy customization.


22 diapositivas
Jade Graphic Design Project Plan Presentation
Unleash creativity with this vibrant Graphic Design Project template! Perfect for showcasing your design process, prototypes, and assets, it keeps the audience captivated with clean visuals and a fresh, modern look. Whether you're outlining color palettes or final designs, every slide exudes style. Ideal for PowerPoint, Keynote, and Google Slides!


7 diapositivas
Mission Infographic
The showcased templates are meticulously designed to articulate the mission of an organization effectively, making them an invaluable tool for any corporate or non-profit entity aiming to communicate its core purpose and objectives. Each slide is crafted to guide the audience through the foundational elements that define the company’s ethos, goals, and strategic approaches. These templates feature a clean and professional layout, incorporating subtle design elements that draw attention without overwhelming the content. They utilize a harmonious blend of typography, iconography, and spacing, which helps in making the presentation not only visually appealing but also highly readable. The versatility of these templates allows them to be adapted for various contexts, whether it's part of an employee onboarding packet, investor presentations, or external company introductions. The color schemes and design motifs can be customized to align with specific brand guidelines, ensuring consistency across all corporate communications. By employing these slides, organizations can effectively communicate their mission, foster a cohesive understanding among stakeholders, and reinforce their commitment to their foundational values and objectives. This not only enhances internal morale but also strengthens the organization’s image externally, making these templates a strategic asset for any business.
5 diapositivas
Performance Progress Tracking Presentation
Monitor performance with precision using this Performance Progress Tracking template. This visually engaging dashboard helps you track progress across multiple stages, from planning to testing. With interactive bar graphs and percentage indicators, you can evaluate real-time performance, identify bottlenecks, and make data-driven decisions. Fully customizable for PowerPoint, Keynote, and Google Slides, ensuring seamless adaptability.


5 diapositivas
Supply Chain Process Infographics
Unravel the complexities of logistics with supply chain process infographics. This vibrant template, splashed with energetic shades of orange, purple, and green, is designed to streamline the convolutions of supply chain management into an easily digestible format. Ideal for business analysts and logistics professionals, these vertical infographics offer a visually engaging narrative. The template features innovative graphics, intuitive icons, and versatile image placeholders, meticulously crafted to aid in visualizing the intricate processes within supply chain dynamics. These infographics are the tool you need to bring clarity to your audience.


22 diapositivas
Sky Drop Full-Service Agency Project Plan Presentation
Step into the world of strategic creativity with the Sky Drop Agency Project Plan template! Designed for modern agencies looking to impress clients and stakeholders, this template offers a sleek and professional design that highlights your agency's strengths, processes, and successes. With dedicated sections for mission and vision, team introduction, services, and client testimonials, this template provides a comprehensive overview of your agency's capabilities. It's perfect for showcasing case studies, market analysis, and future outlooks, helping you to build trust and establish credibility. Whether you're presenting a new project plan or updating clients on progress, this template ensures your information is communicated clearly and effectively. Fully customizable and compatible with PowerPoint, Keynote, and Google Slides, the Sky Drop template is your go-to for creating presentations that leave a lasting impact. Impress your audience and elevate your agency's brand with this powerful presentation tool!