


Características


¿Tienes alguna pregunta?
Recomendar


21 diapositivas
Ionforge Startup Pitch Deck Presentation
Impress investors and showcase your startup's potential with this structured pitch deck! It covers key areas like market analysis, business model, value proposition, and financial overview, ensuring a complete story of your growth plan. Perfect for startup presentations and funding pitches, this template is fully compatible with PowerPoint, Keynote, and Google Slides.


19 diapositivas
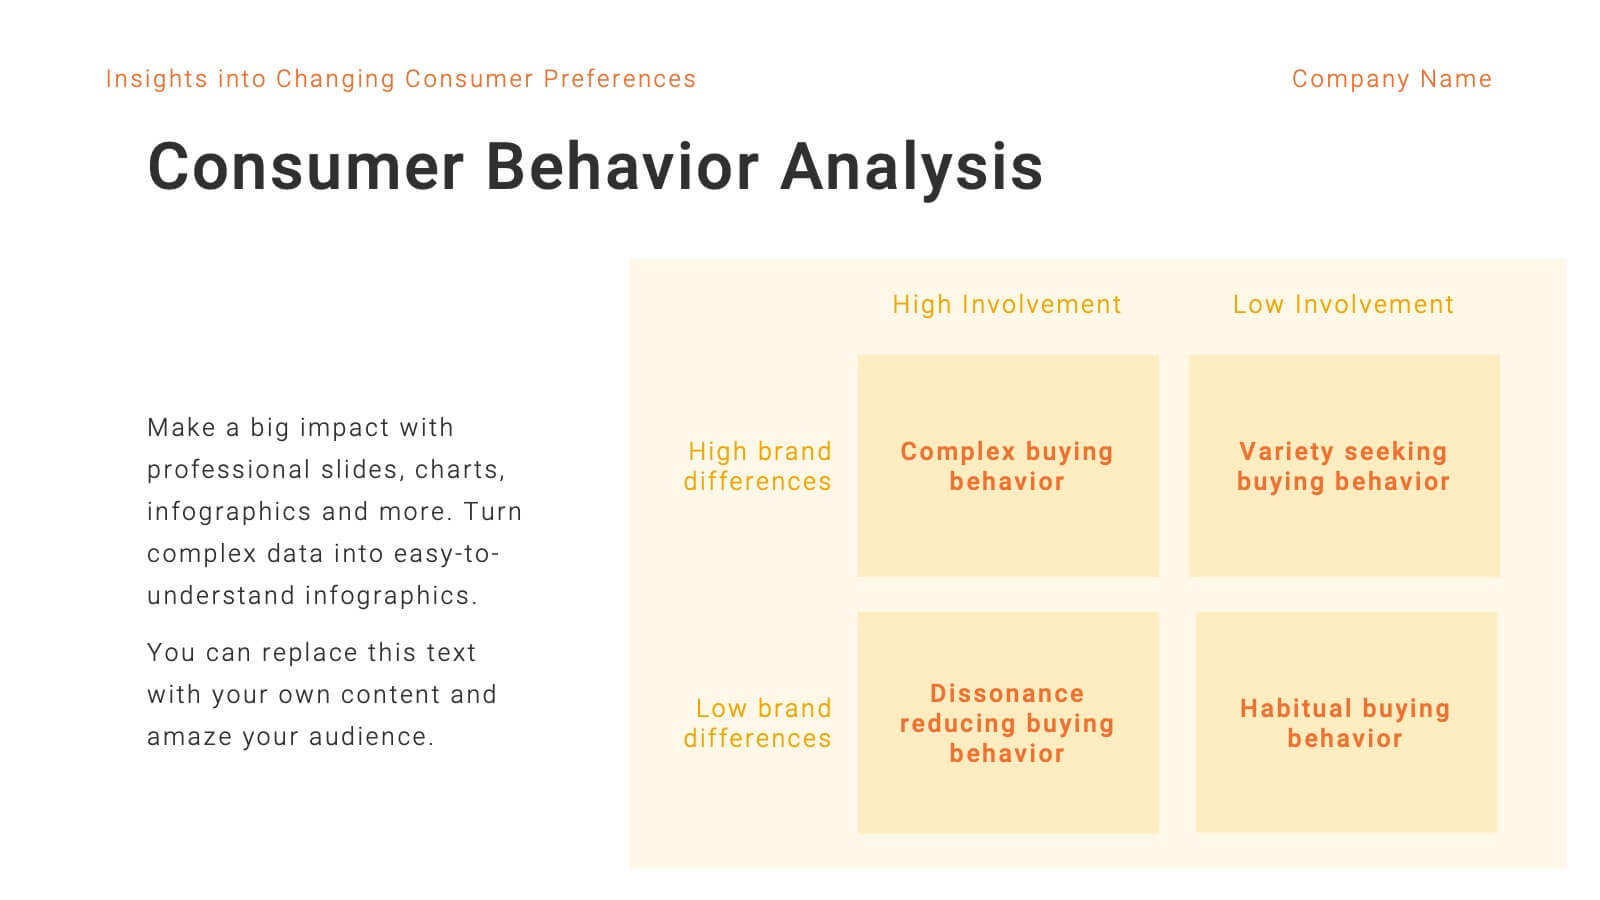
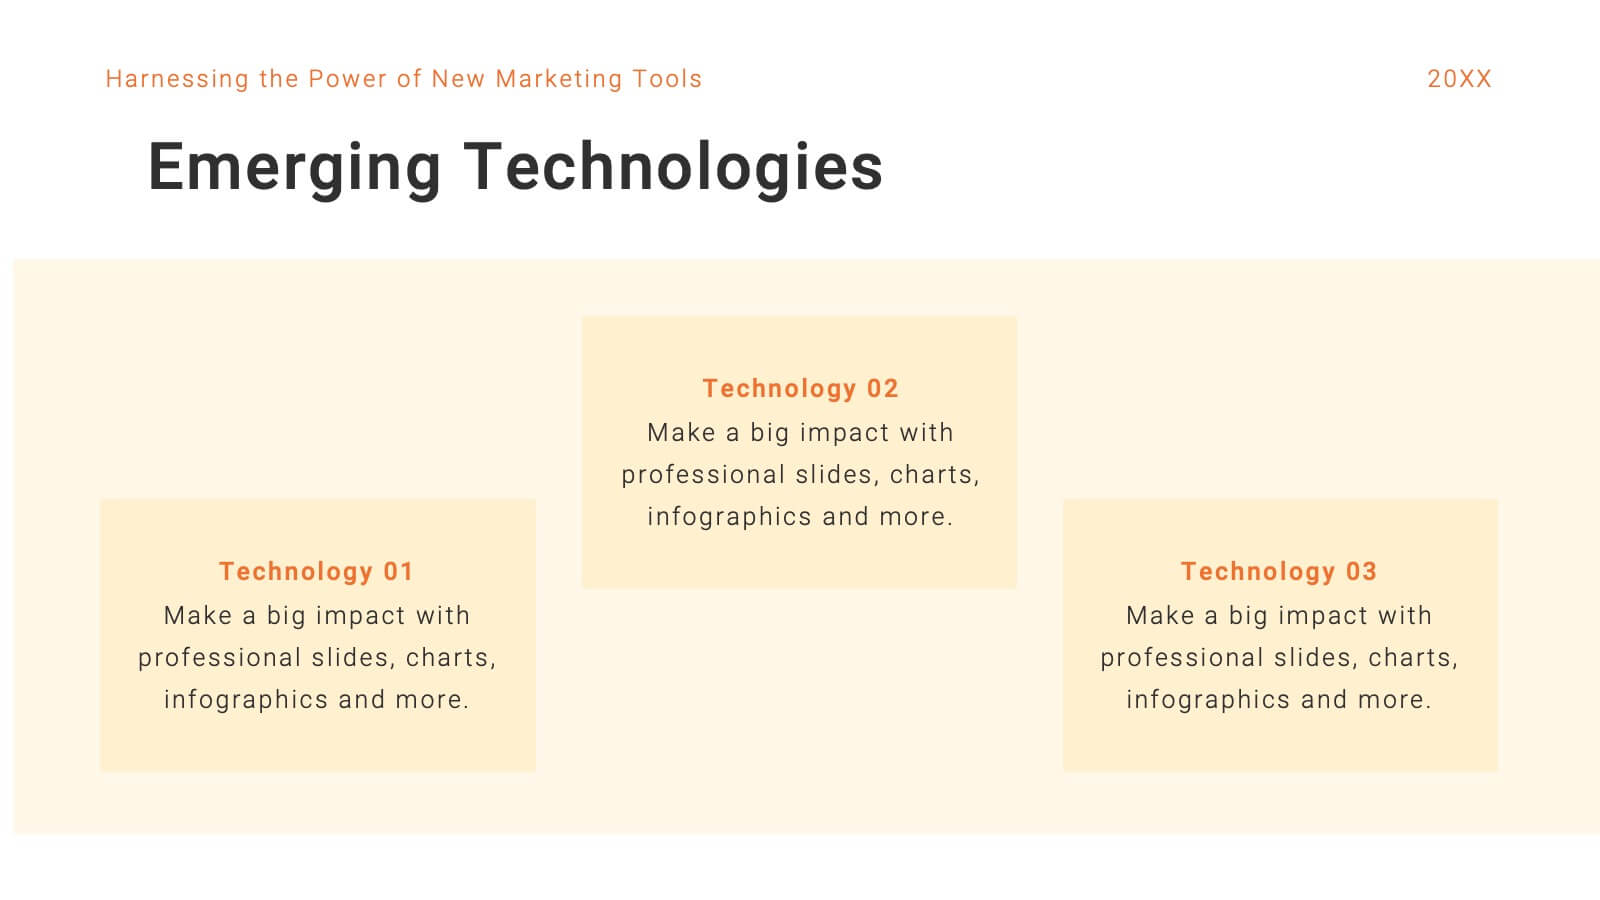
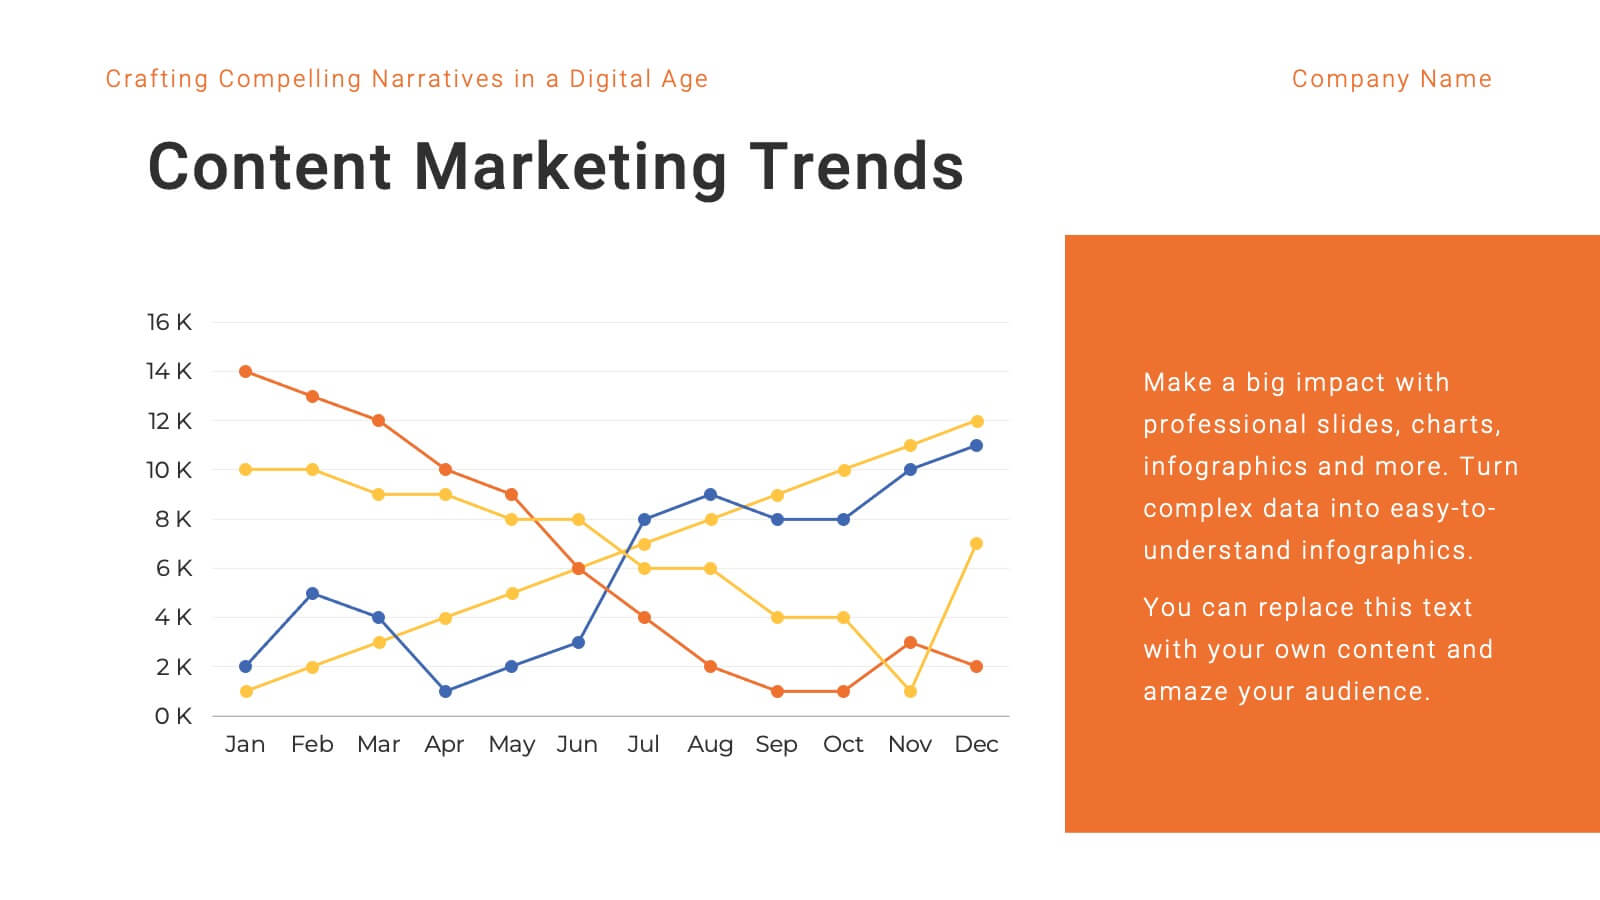
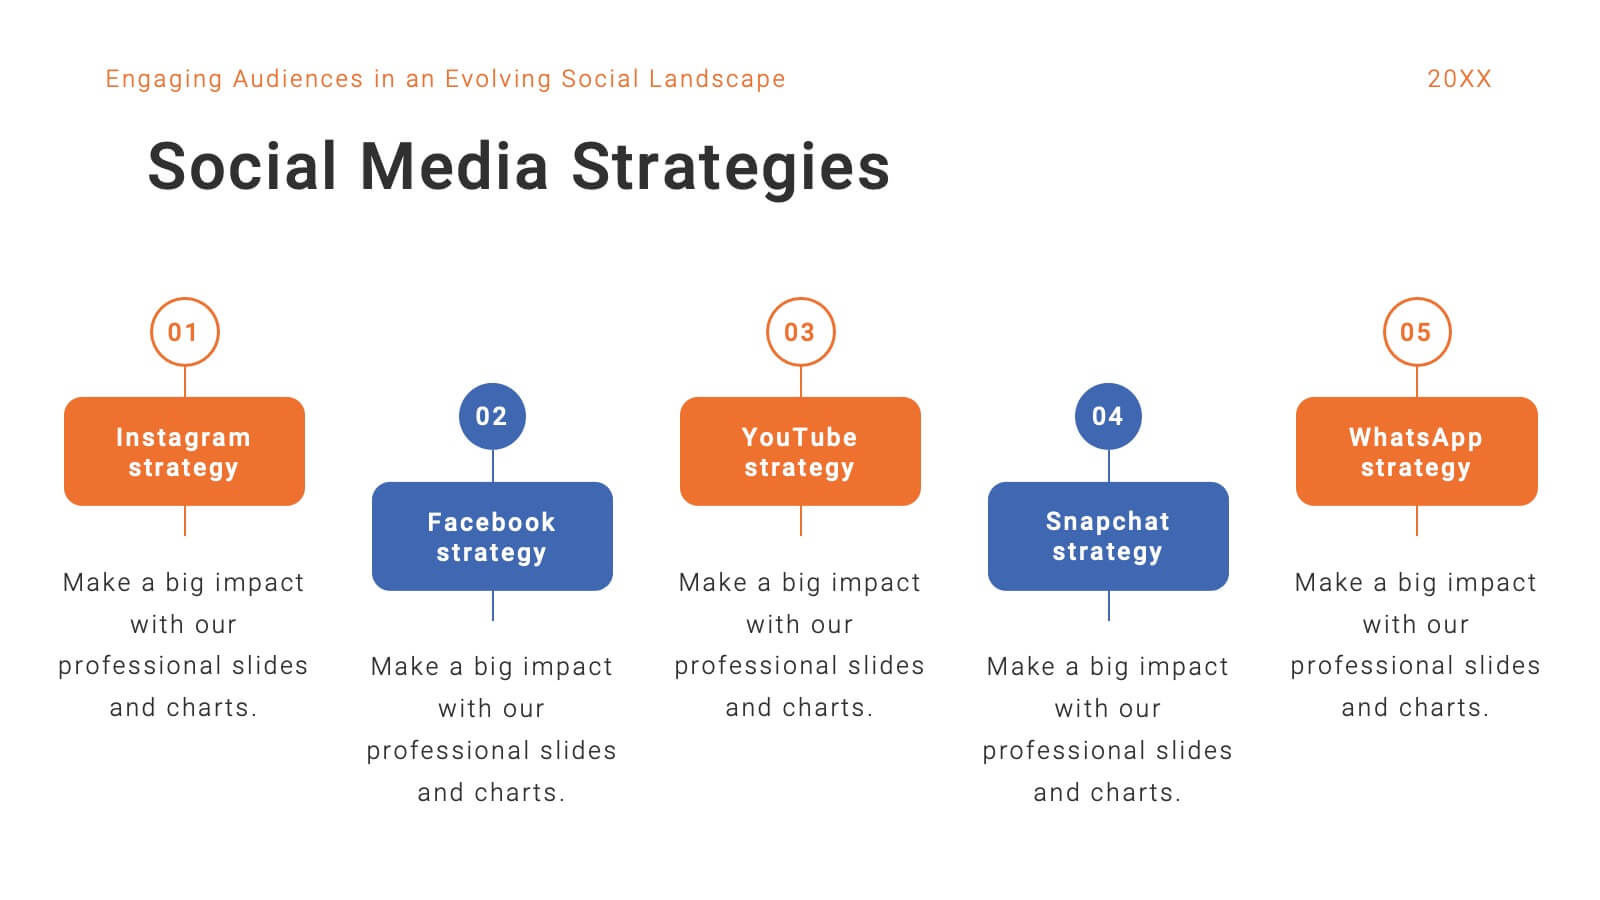
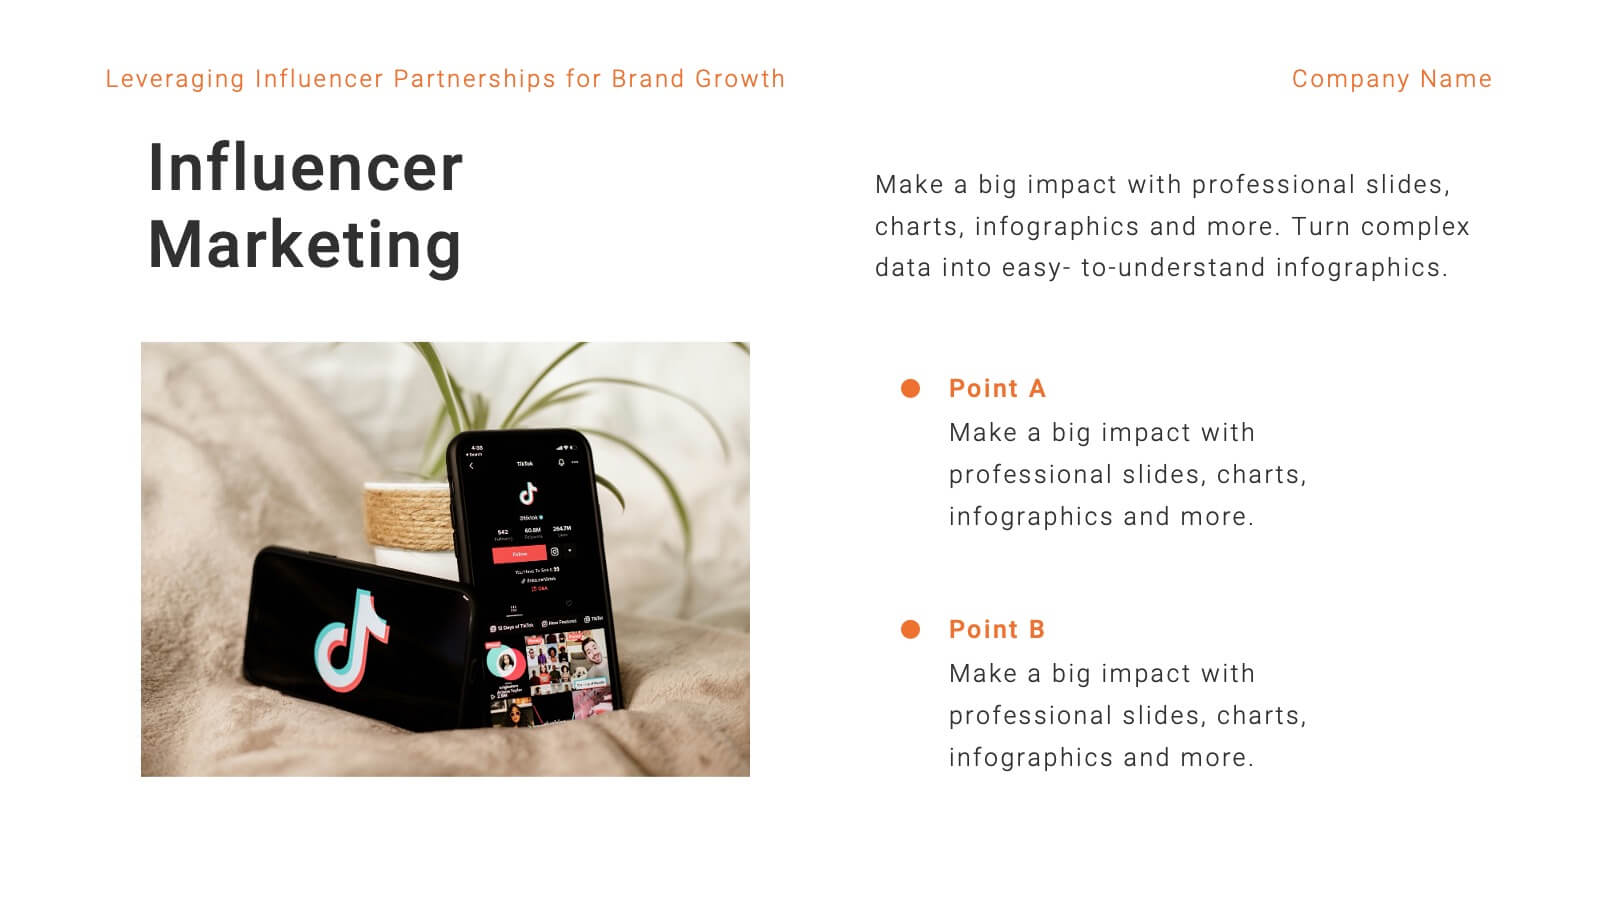
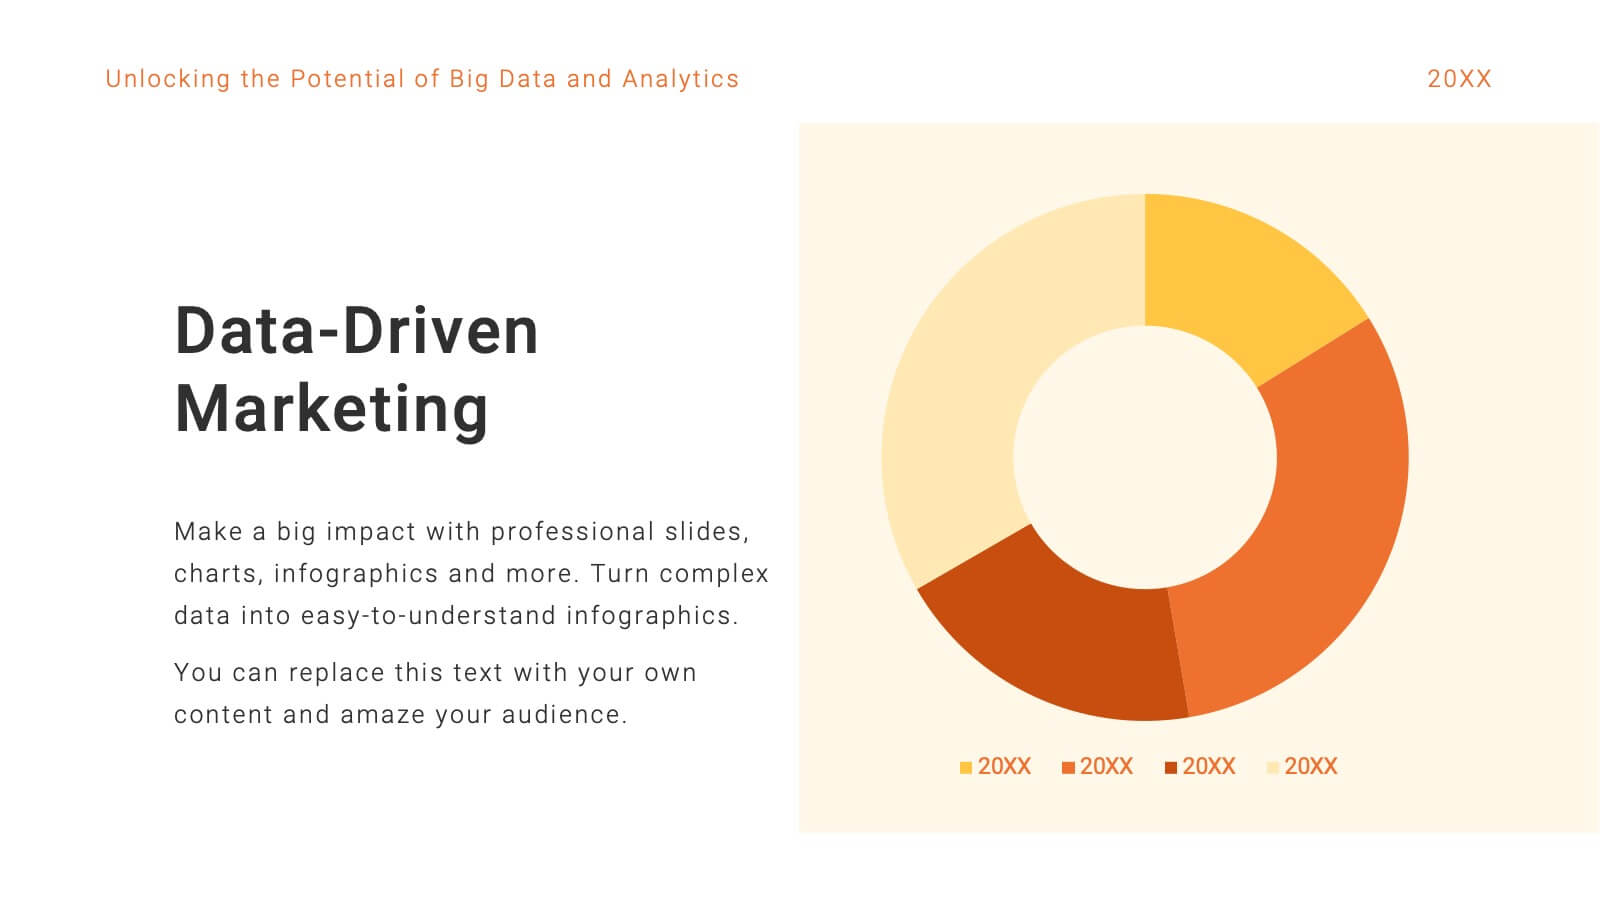
Fableia Marketing Research Report Presentation
Deliver data-driven insights with a professional and visually engaging marketing research report presentation. This template is tailored for marketing professionals, agencies, and businesses looking to showcase research findings with precision and clarity. Highlight key sections such as market trends, consumer behavior analysis, and campaign performance using dynamic visuals and well-structured layouts. Share your insights on emerging technologies, social media strategies, and customer targeting with easy-to-edit graphs, charts, and infographics. Use dedicated slides for SEO analytics, value propositions, and recommendations to present actionable strategies that resonate with your audience. This template is fully customizable and works seamlessly with PowerPoint, Google Slides, and Keynote, ensuring you can adapt it to your unique needs. Present your research with confidence and leave a lasting impact on stakeholders and decision-makers.


10 diapositivas
Customer Conversion Funnel Presentation
Optimize your customer journey presentations with our "Customer Conversion Funnel Presentation" template. This infographic elegantly depicts the conversion process across distinct stages, using a funnel design that visually narrows from awareness to action. Each segment is clearly labeled, simplifying the task of presenting strategies to enhance each phase of the customer experience. Ideal for marketers, sales teams, and strategists, this template helps clarify customer behavior and improve conversion rates. It’s a vital tool for any business focused on customer engagement and optimization. Fully compatible with PowerPoint, Keynote, and Google Slides, this template is crucial for effective communication and strategic planning.


6 diapositivas
Demographic Transition Infographics
Embark on a journey through the fascinating concept of demographic transition! This infographic opens the door to understanding how societies evolve over time in terms of population growth and age structure. From the early stages of high birth and death rates to the advanced stages of low birth and death rates, we unveil the intricate phases of demographic transition that shape our world. Discover the profound impacts of demographic transition on societies and economies. Learn how changes in population structure affect labor markets, healthcare systems, and social welfare. Understand the opportunities for economic growth and development that can arise from a favorable demographic transition. With this engaging infographic, compatible with PowerPoint, Keynote, and Google Slides, sharing your understanding of demographic transition has never been more accessible. Empower yourself with the knowledge to comprehend and discuss this vital aspect of our world's development. Dive into the complexities of demographic transition and embark on a journey of exploration and enlightenment.


7 diapositivas
Alphabet Letters Infographic
An alphabet infographic is a visual representation or graphic that presents information related to the alphabet, often used for educational purposes or to convey information in a creative and engaging manner. Get ready to embark on a joyful journey through the wonderland of letters and words with our alphabet letters infographic. This infographic template includes various elements like letters, words, examples, pronunciation guides, or related images. This is more than just an infographic—it's a vibrant celebration of language, learning, and pure happiness. Dive into the kaleidoscope of alphabets and spread the cheer!


7 diapositivas
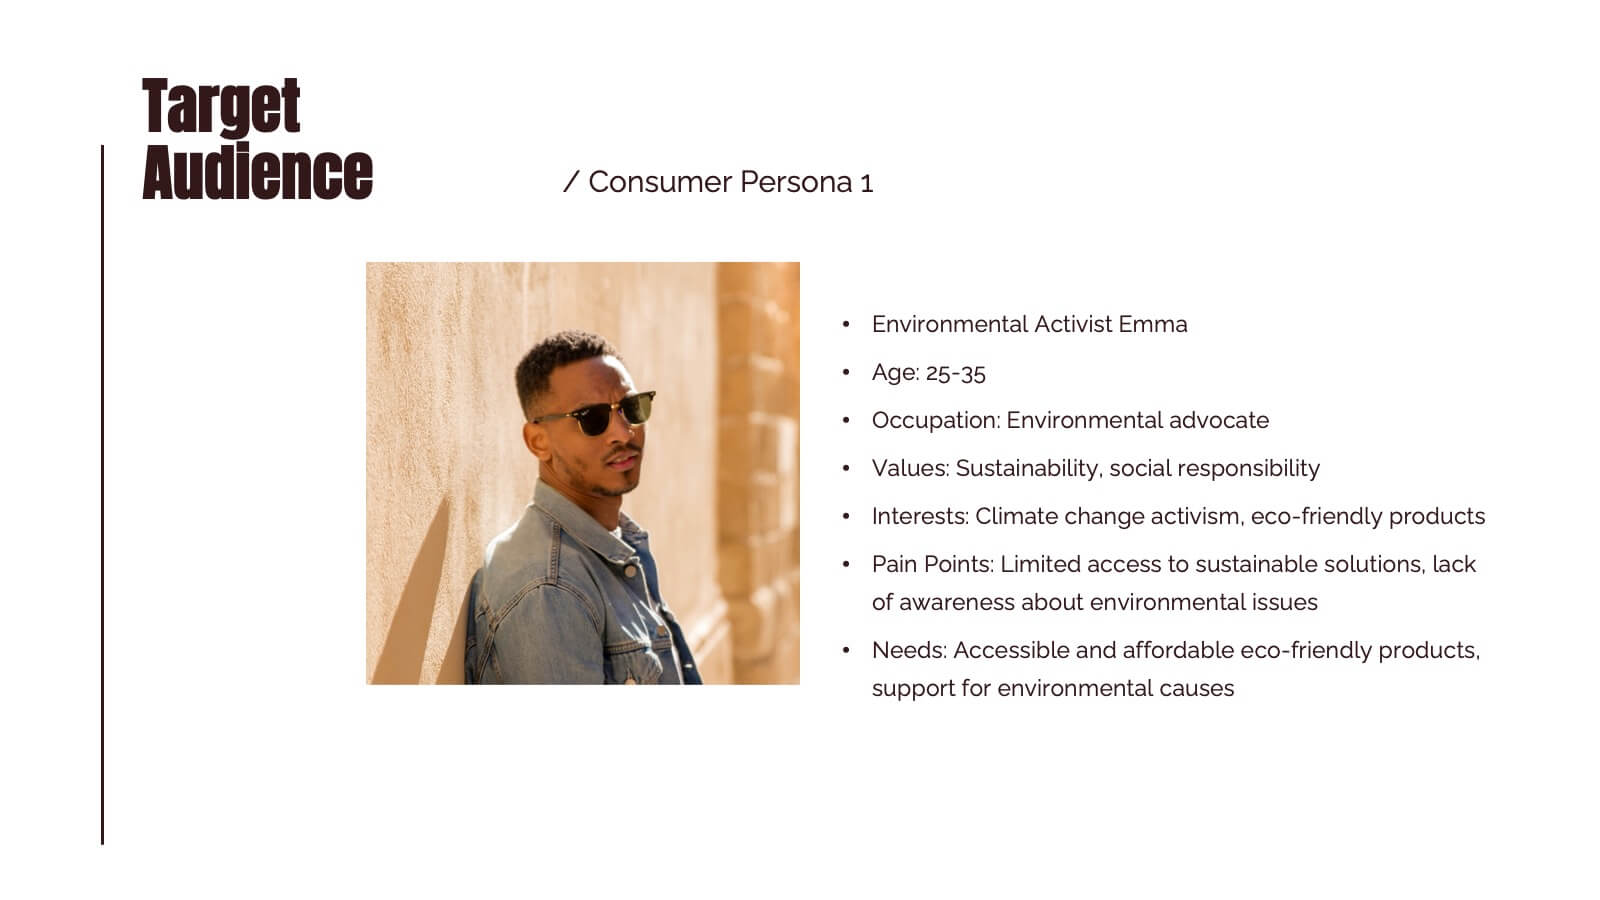
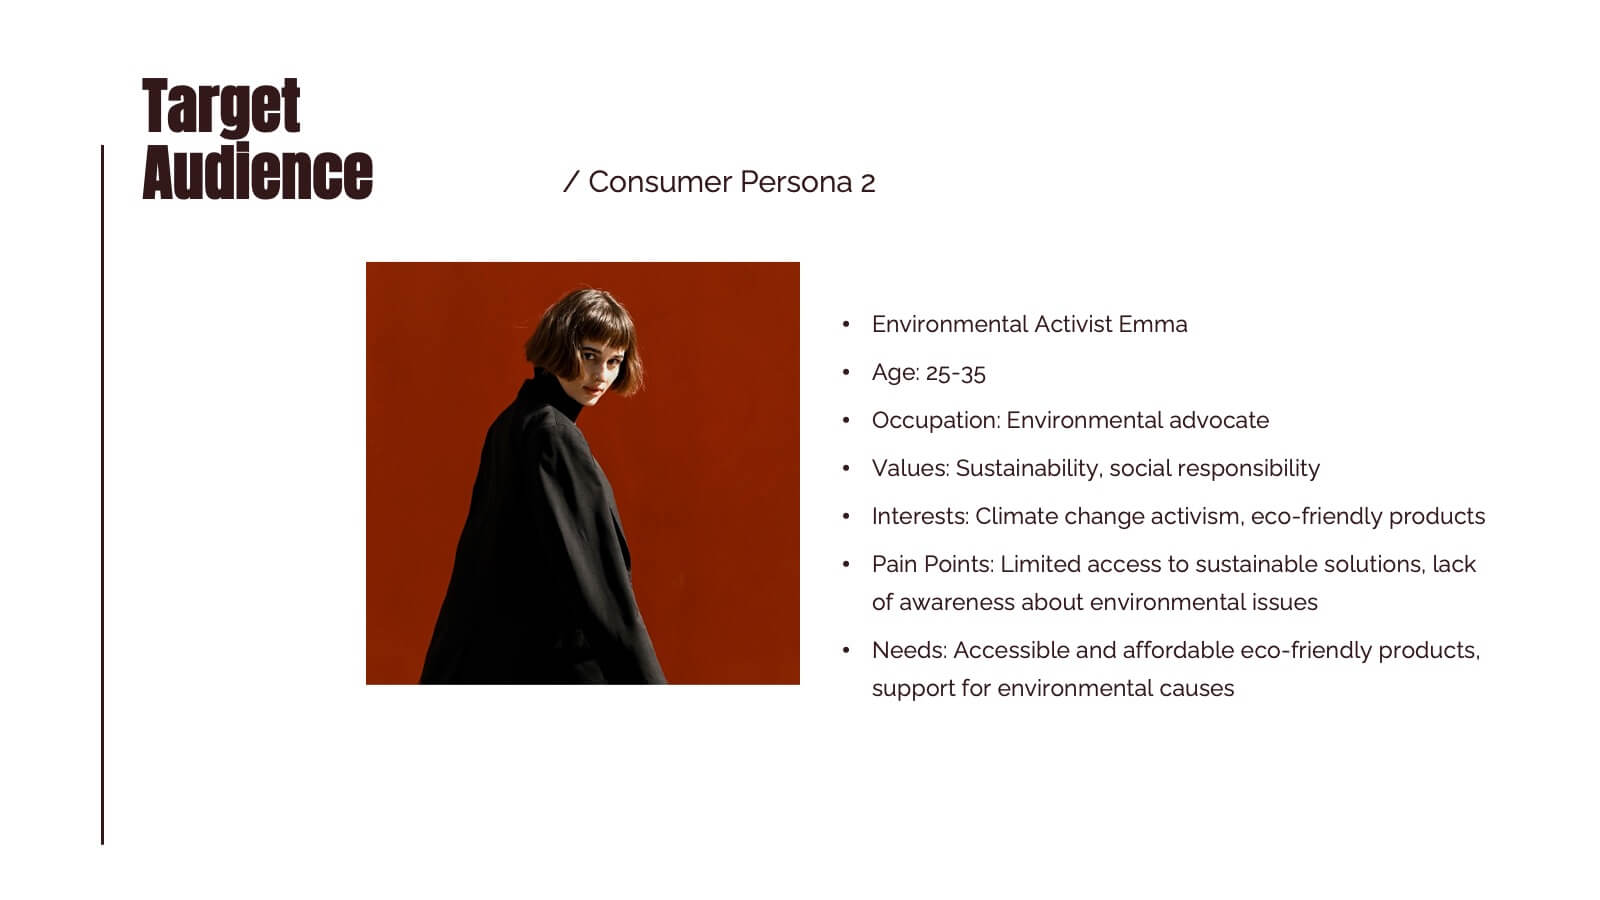
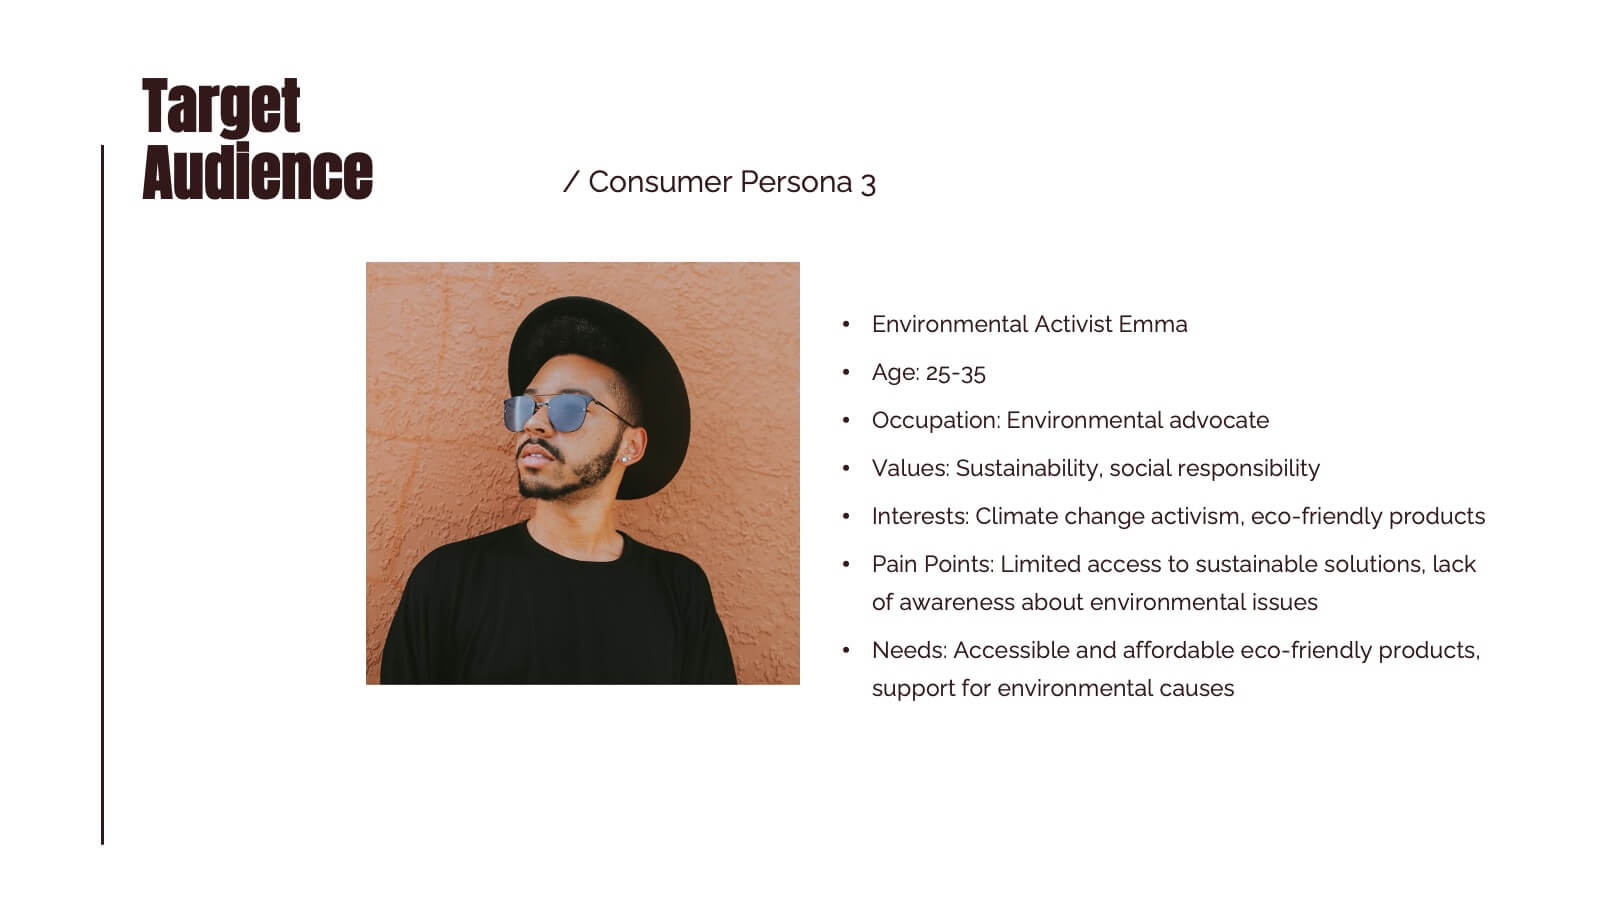
Target Market Infographic Presentation Template
A target market Infographic is a visual representation of a specific group of consumers that a business has determined to be the focus of its marketing efforts. This infographic is designed to understand the demographics, behaviors, and motivations of the potential consumers. This infographic can be used to show the size and growth potential of the target market, and how it compares to other market segments. This template is designed to display your information in the form of charts, graphs, or other data visualizations, and is accompanied by written descriptions of your data and insights.


7 diapositivas
McKinsey 7S Management Infographic Presentation
The McKinsey 7S model is designed to help organizations understand the various components that need to be aligned for effective performance. This Infographic is a visually engaging way to describe the 7S framework. Use it to deliver an informative message and get your ideas across clearly using the well designed graphics. This template is fully customizable to portray your company's key points and challenges in your specific business domain. It has all the elements to make a powerful business presentation and can create engaging templates with Powerpoint, Keynote, Google Slides and more.


7 diapositivas
Decision Process Infographic Presentation
A Structured Decision Process is crucial for individuals and organizations to make informed and effective decisions. This is a flexible template that allows you to create your presentation using PowerPoint, Google Slides or Keynote. It includes decision illustrations so that you have everything you need to explain the decision and to present the pros and cons of each option. With a stylish design and eye-catching elements you can use this infographic for presentations of any kind. For promoting a new product or service, making recommendations or simply to explain your next steps and decisions.


7 diapositivas
Pillar Infographics Presentation Template
Our Pillar Infographic will present your information in a hierarchical format, with a main "pillar" section at the center and supporting information or sections branching out from it like pillars or columns. This template is designed to provide a simple overview of your topic, while also allowing for more in-depth exploration of specific aspects. The central pillar featured may be used to contain a brief summary or key message, while the surrounding columns or sections may provide more detailed information, data, or visualizations. Grow your audience and increase sales with this template!


7 diapositivas
Corporate Sustainability Management
Visualize your sustainability priorities with this hexagon-based framework slide, designed to highlight areas like environmental impact, health, welfare, and ethical governance. Ideal for CSR reporting, ESG strategy sessions, or internal sustainability initiatives. Easy to customize in PowerPoint, Keynote, and Google Slides.


4 diapositivas
Green Business and Climate Goals Presentation
Bring your sustainability message to life with a fresh and vibrant layout that guides viewers through key milestones. This template helps communicate eco-friendly initiatives and climate strategies in a simple timeline format. Ideal for showcasing goals, progress, and impact. Fully compatible with PowerPoint, Keynote, and Google Slides for easy editing.


4 diapositivas
Meet the Business Team Presentation
Ignite curiosity from the start with a clean, modern layout designed to introduce your team with clarity and confidence. This presentation highlights key roles, expertise, and contributions, helping audiences quickly understand who drives the work forward. Fully editable and easy to customize in PowerPoint, Keynote, and Google Slides.


6 diapositivas
Agenda Network Infographic
Elevate your networking events with our sophisticated collection of agenda slide templates. These slides are crafted to structure and present the flow of activities at networking events, making them essential for coordinators who aim to foster professional connections among attendees. Each template is designed with clarity and style, featuring clean lines and modern graphics to outline key segments of your event, such as welcome remarks, networking sessions, panel discussions, and closing statements. The thoughtful layout includes designated spaces for time slots, session titles, and speaker details, ensuring that participants can easily follow the event's progression and plan their participation accordingly. These slides are fully customizable, allowing you to match the visual design with your event’s theme or corporate branding. The adaptable format makes it simple to insert or remove sections based on the specific needs of your event. Ideal for business conferences, industry meet-ups, or any professional gathering, these agenda slides help you manage and execute a seamless networking experience.

25 diapositivas
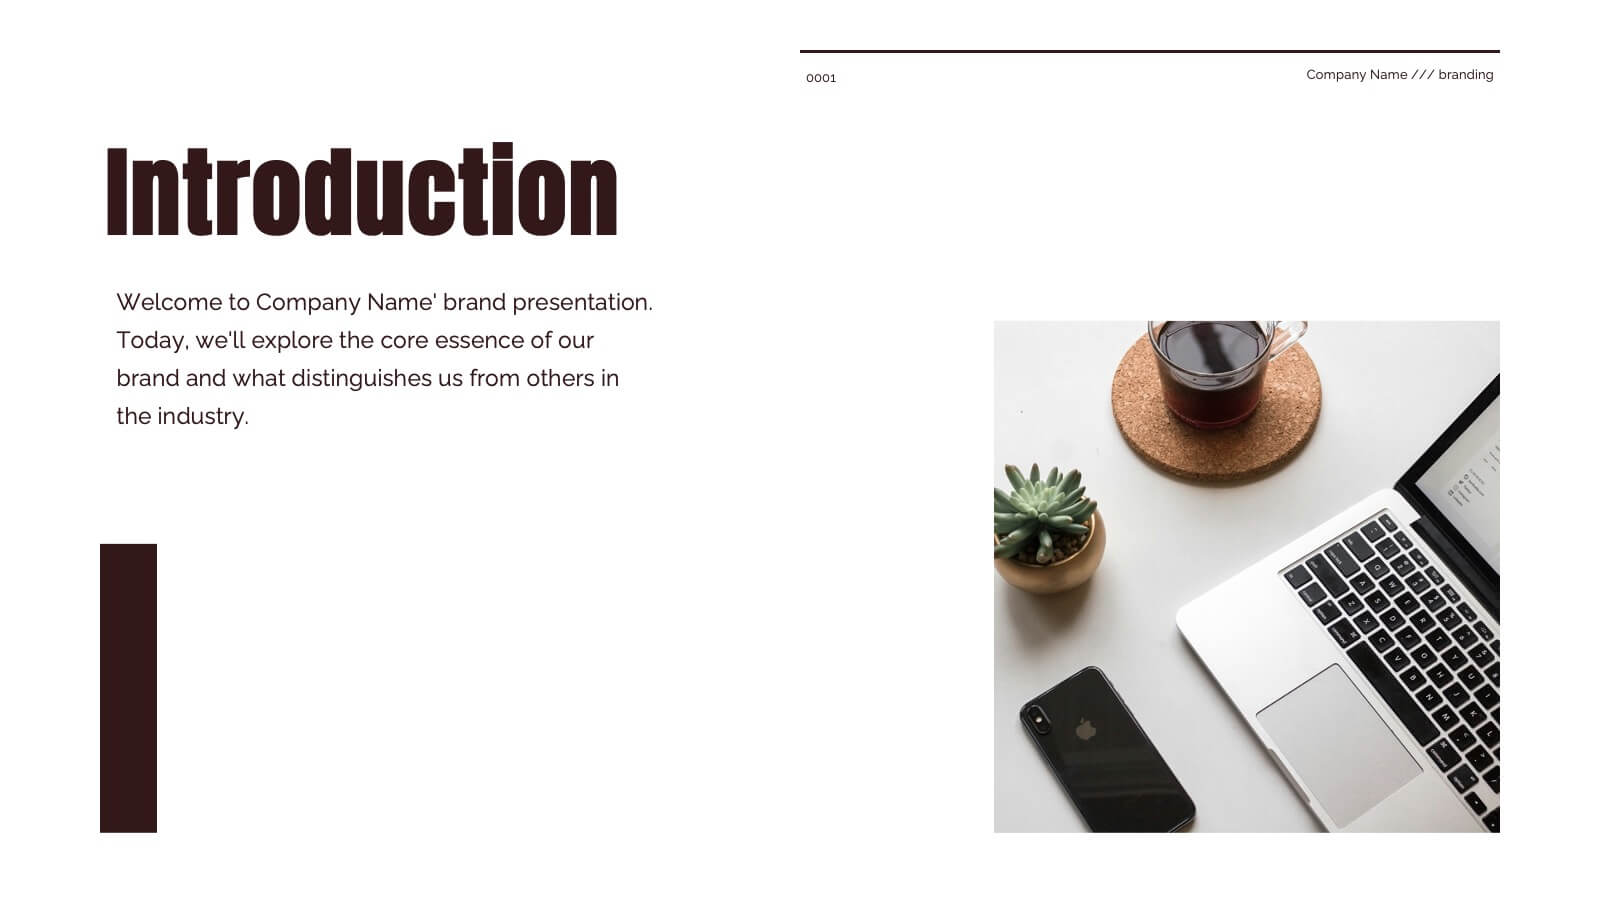
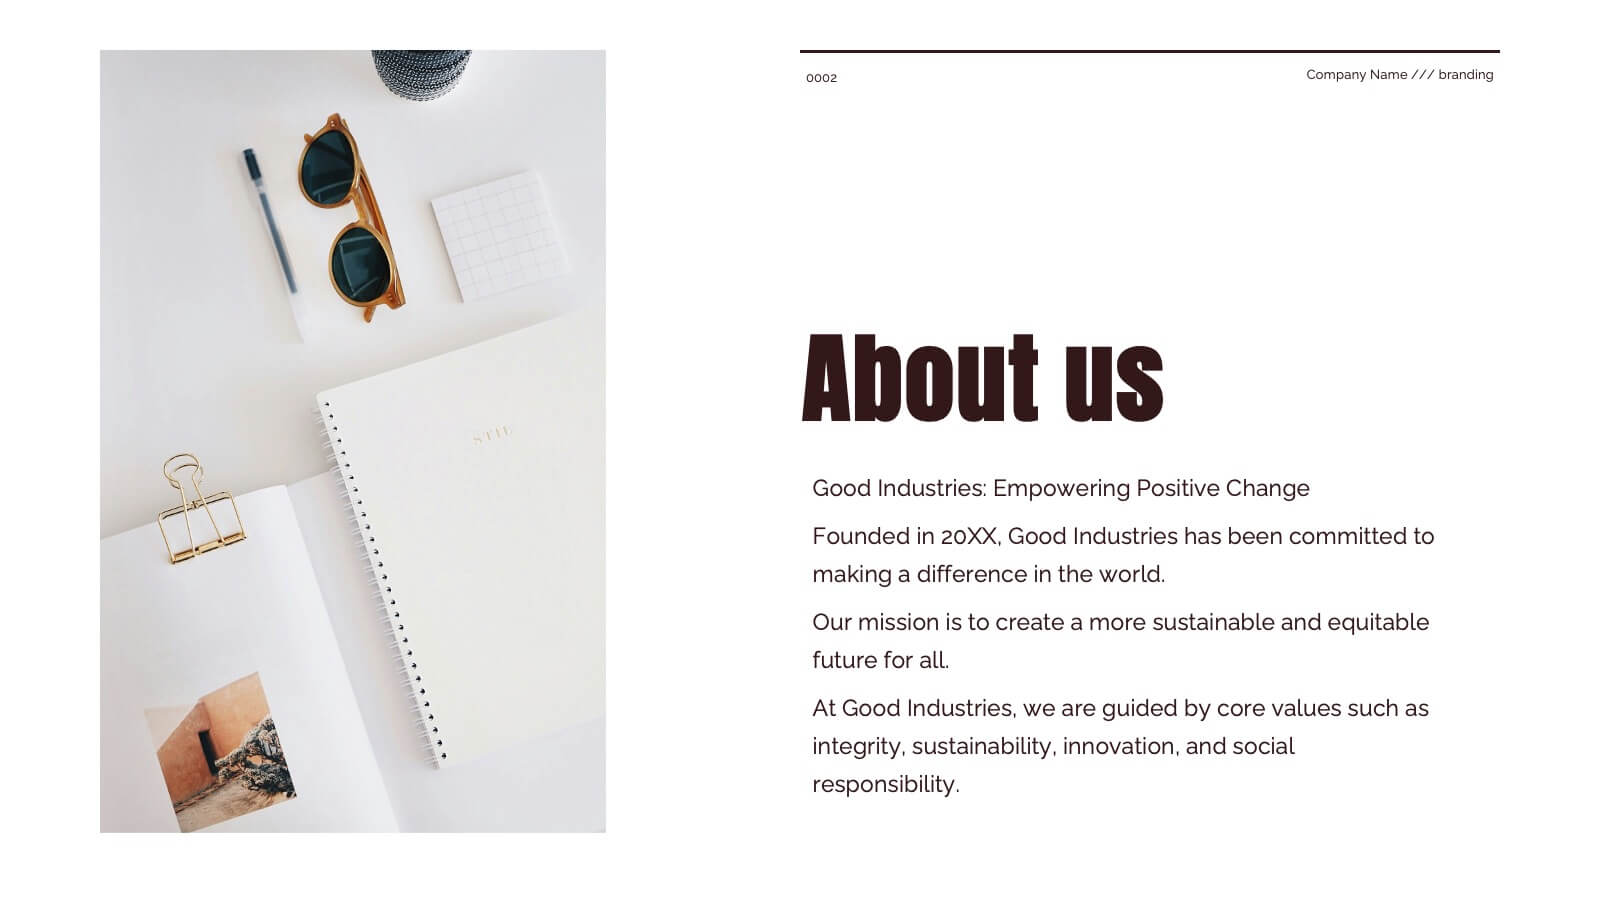
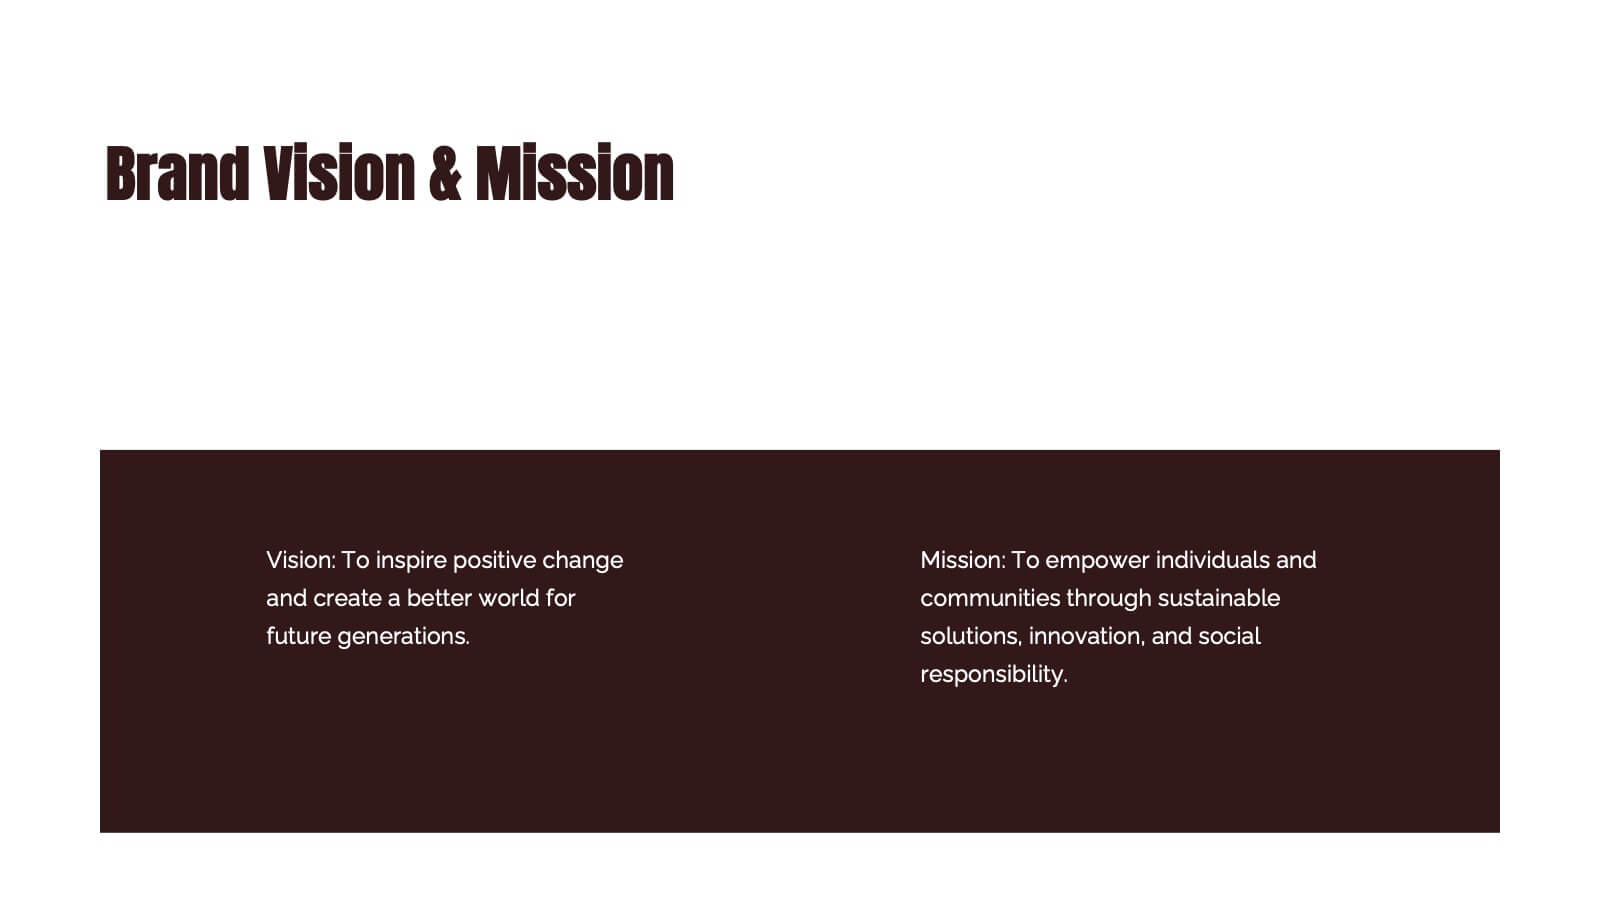
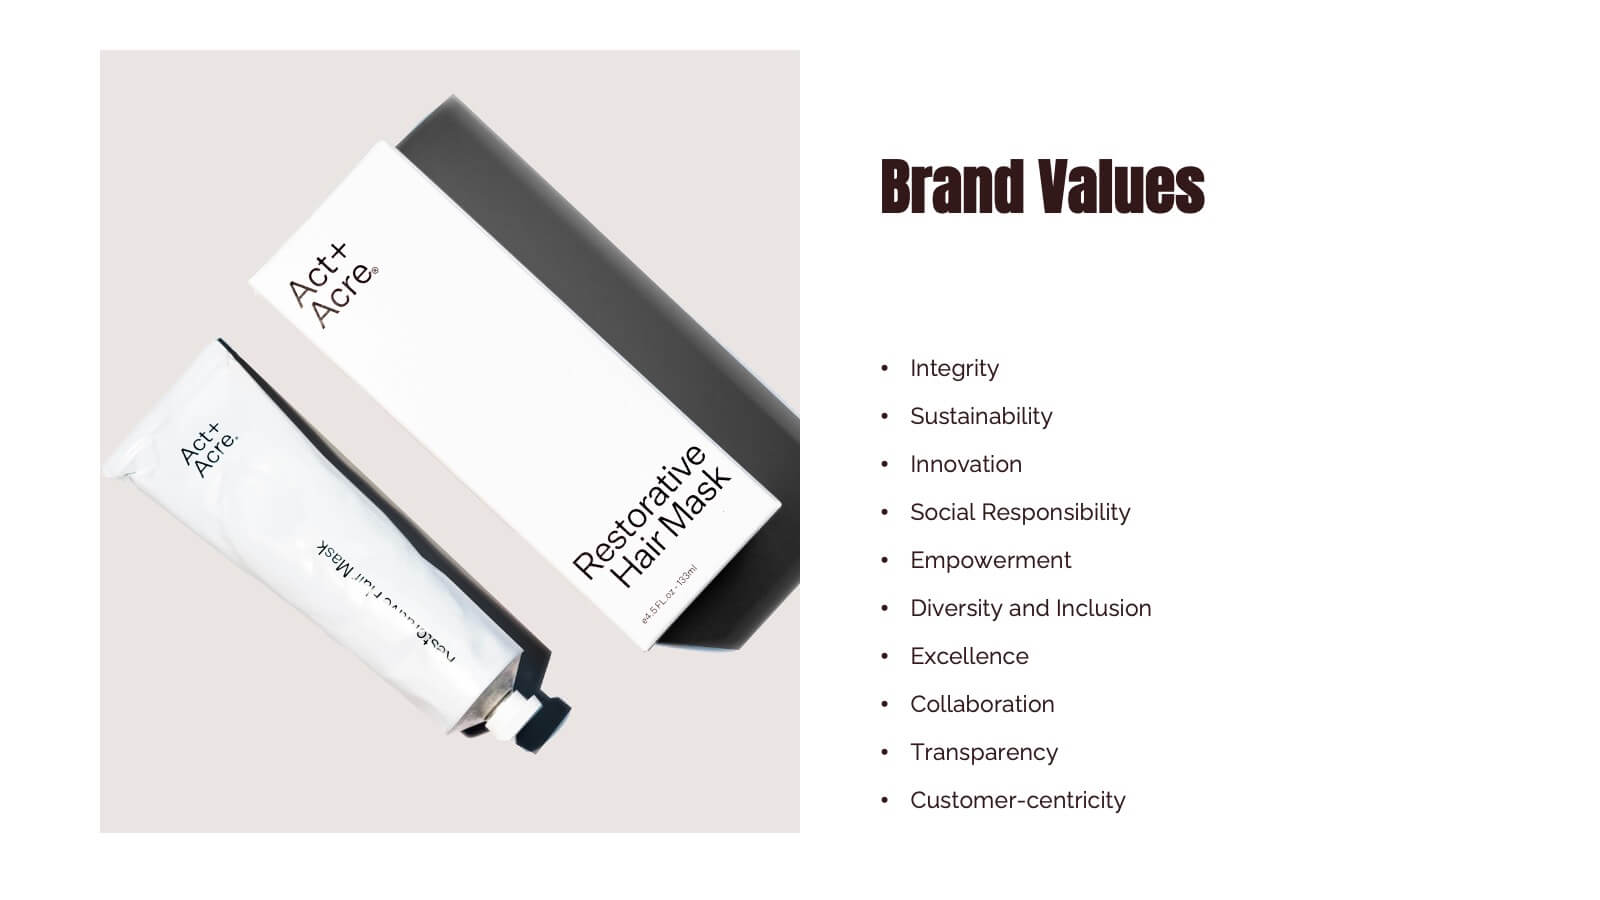
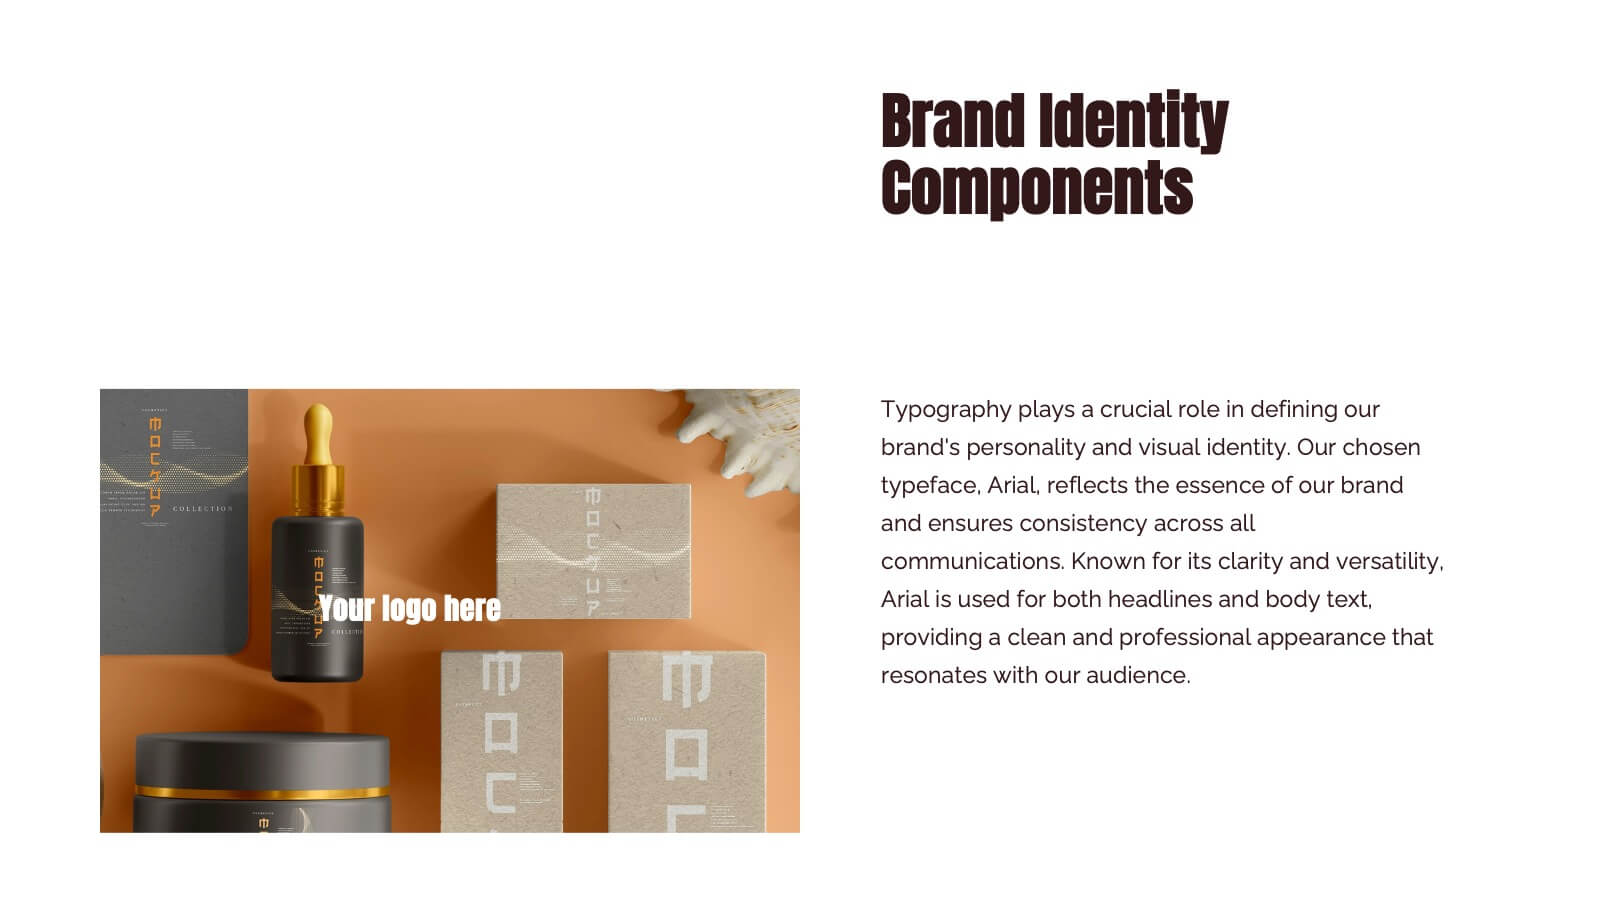
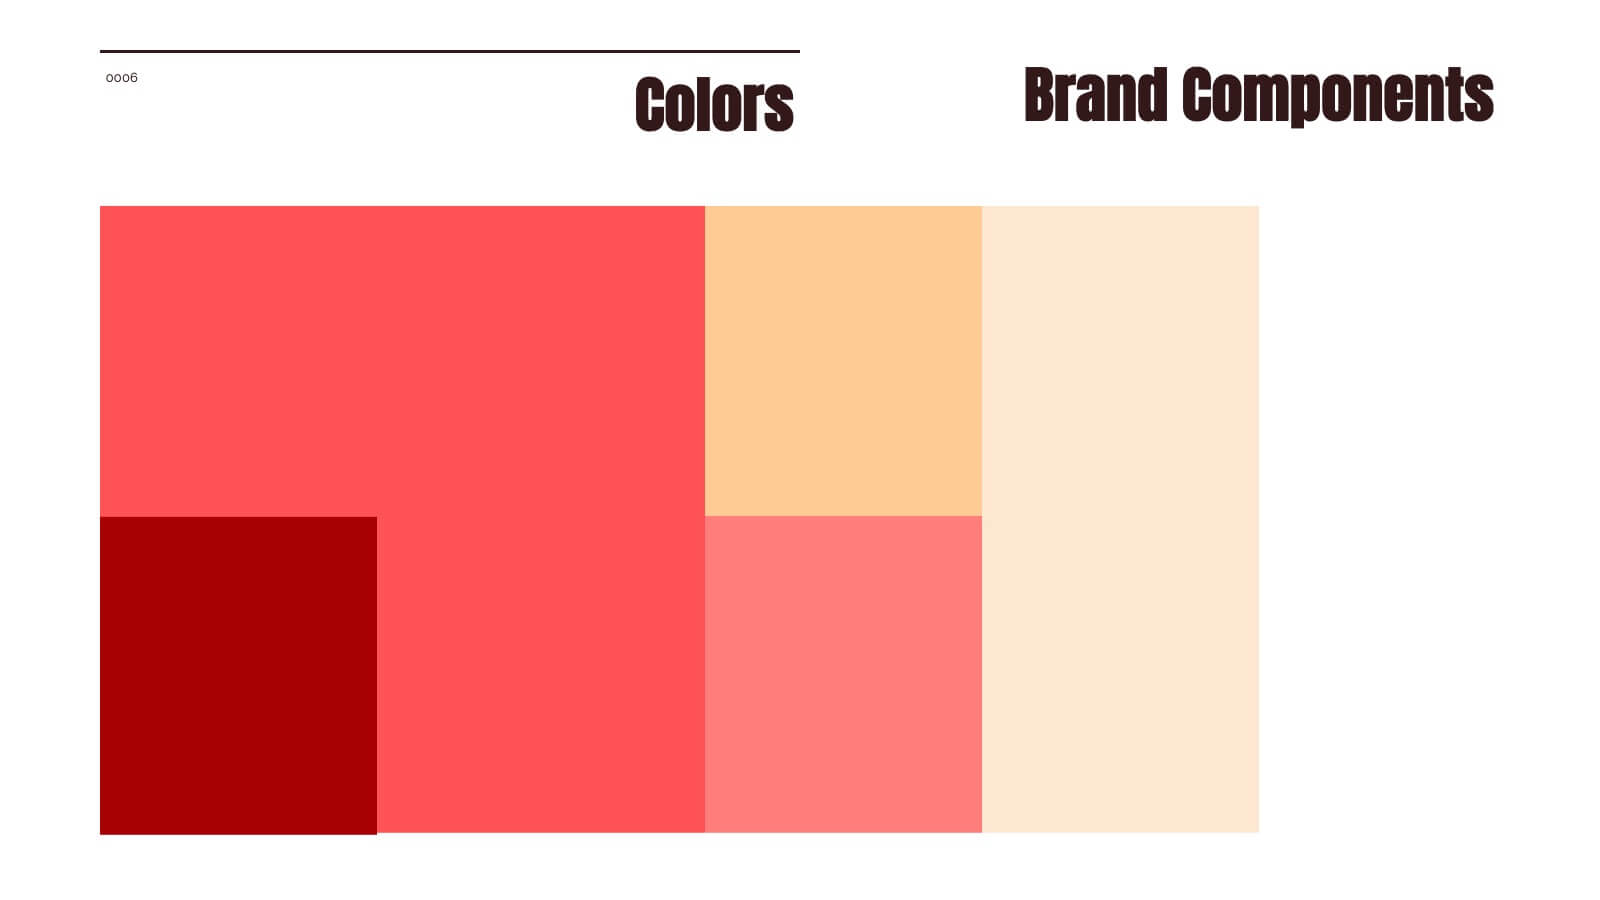
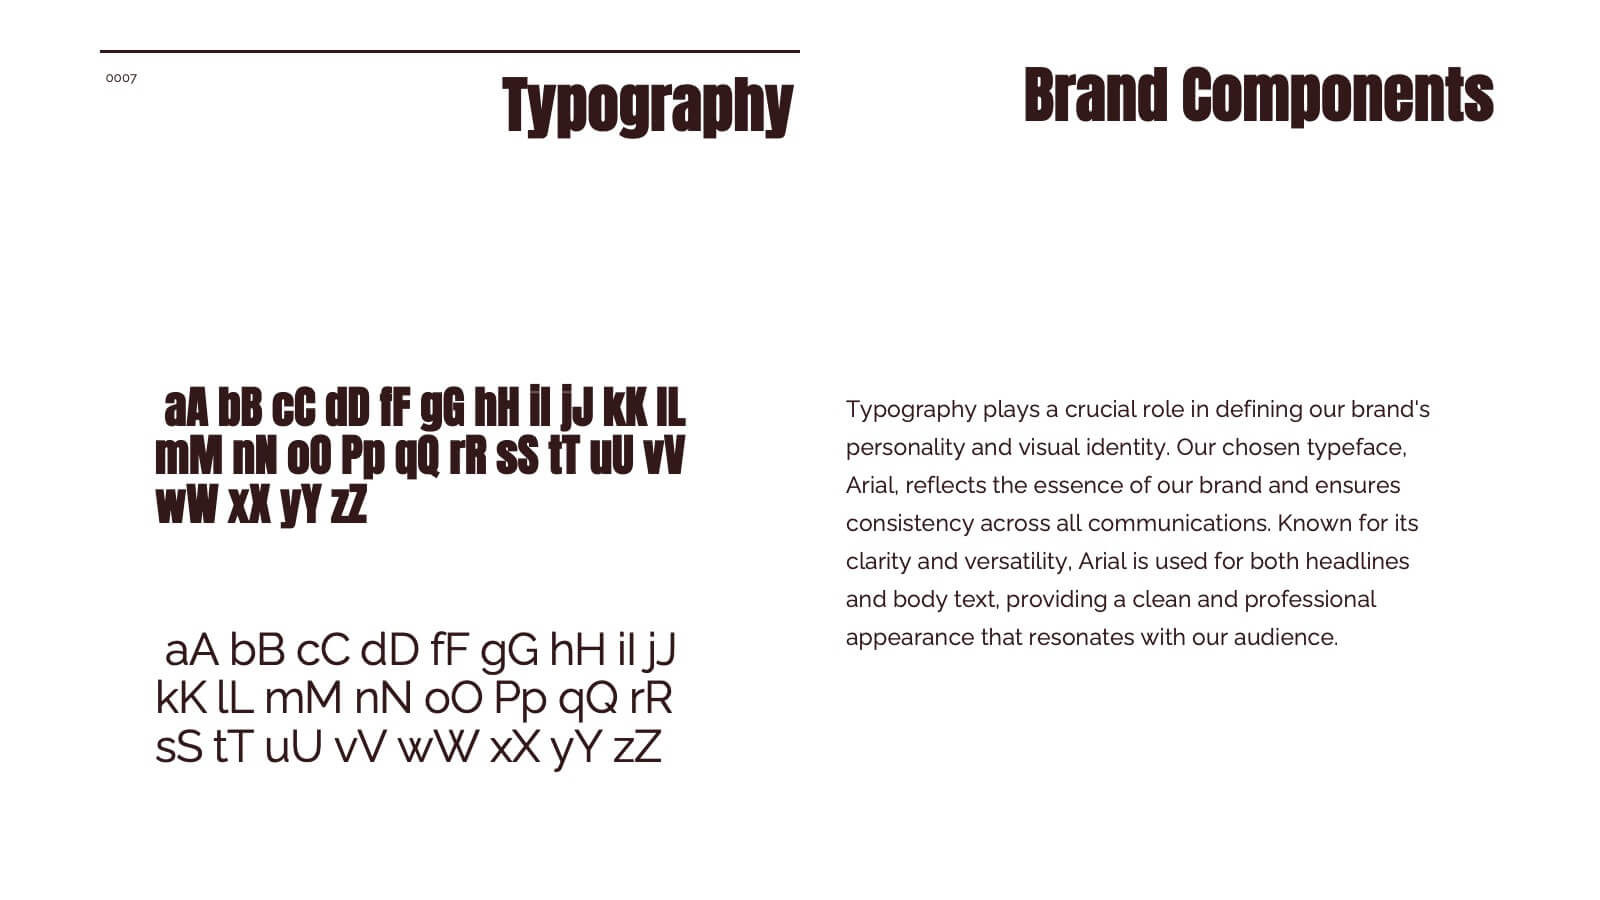
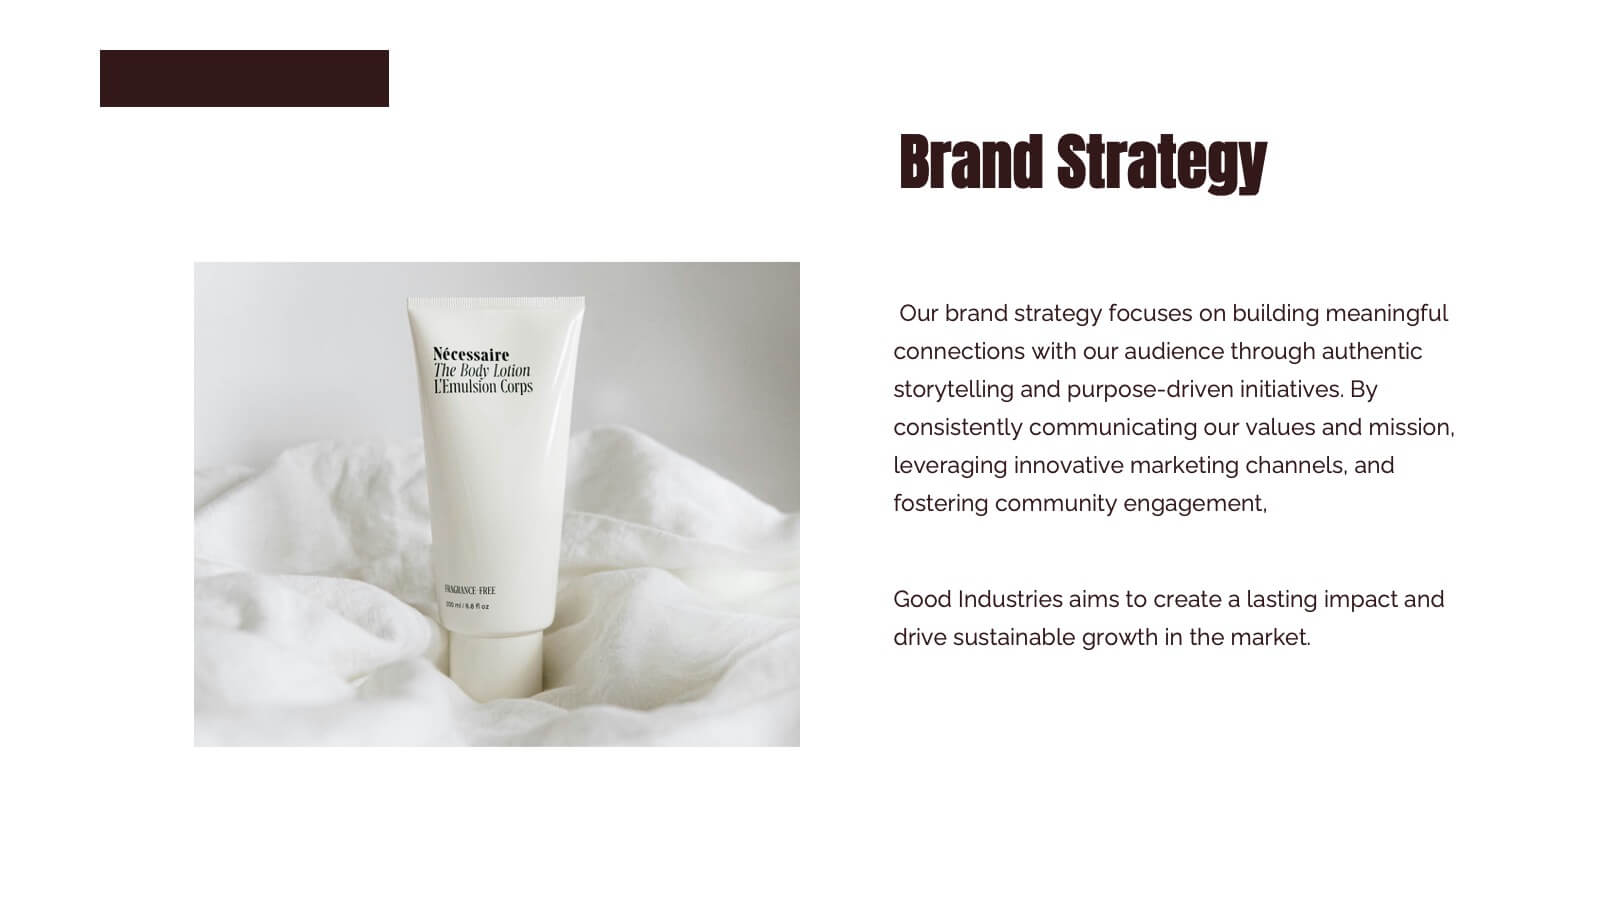
Blaze Brand Identity Presentation
Ignite your brand's potential with this vibrant, blaze-inspired presentation! Ideal for showcasing your brand identity, this template highlights key elements like logo design, color palette, and brand messaging with bold visuals and a modern layout. Perfect for making your brand stand out. Compatible with PowerPoint, Keynote, and Google Slides.


5 diapositivas
Scientific Research Data Presentation
Bring your research to life with a clean, dynamic layout designed to simplify complex findings and highlight key scientific insights. This presentation offers a structured flow for showcasing data, experiments, or results in a clear and engaging way. Fully compatible with PowerPoint, Keynote, and Google Slides.

21 diapositivas
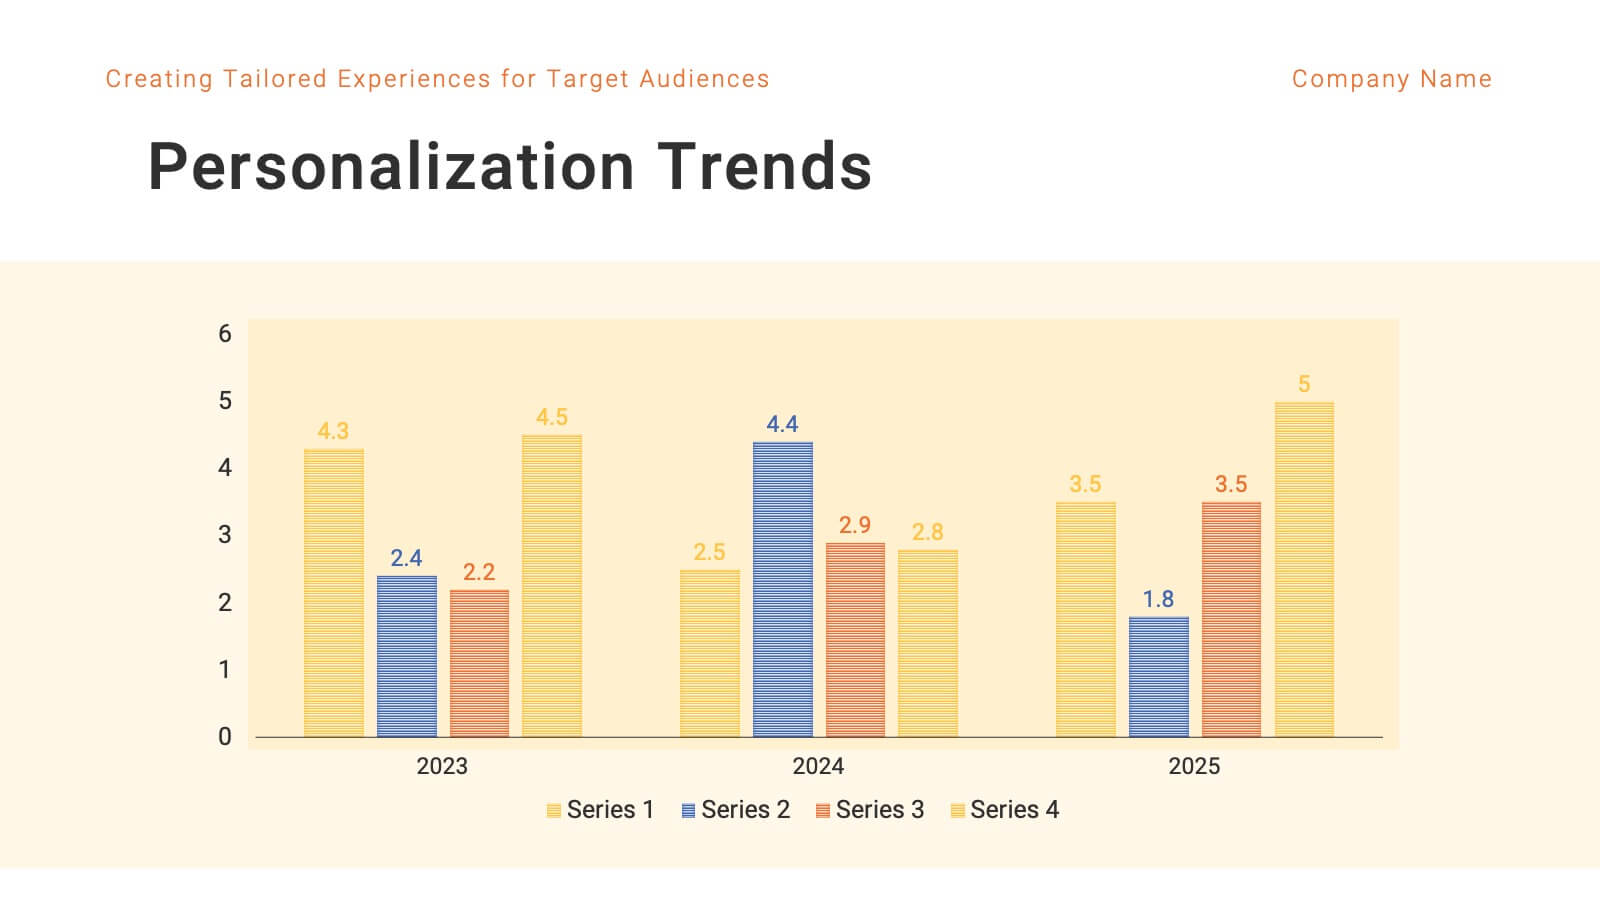
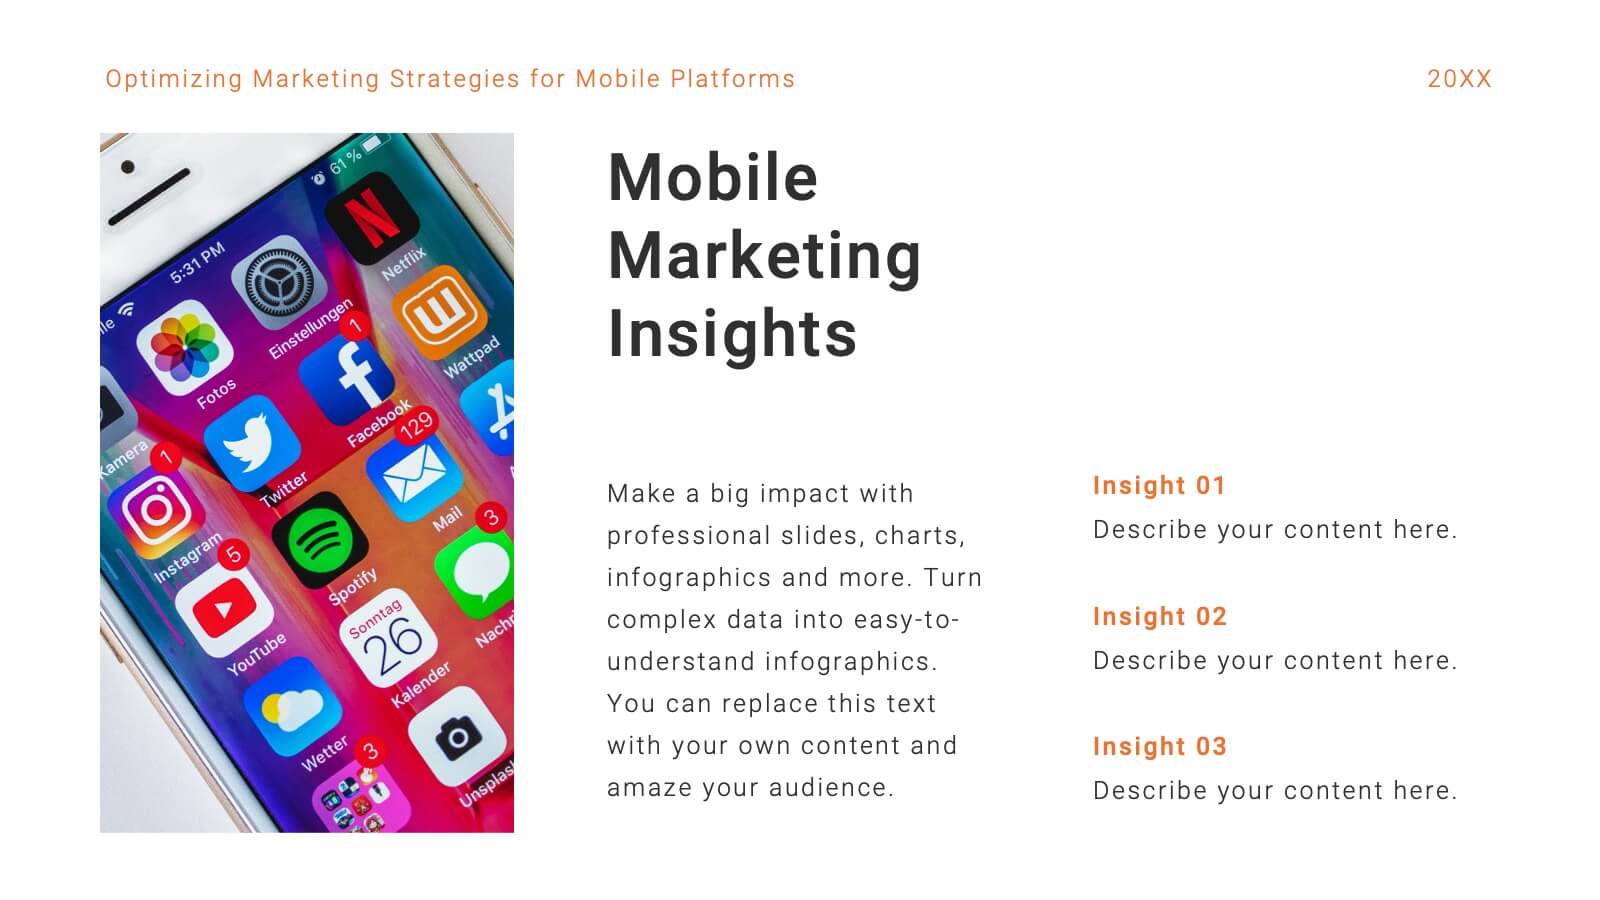
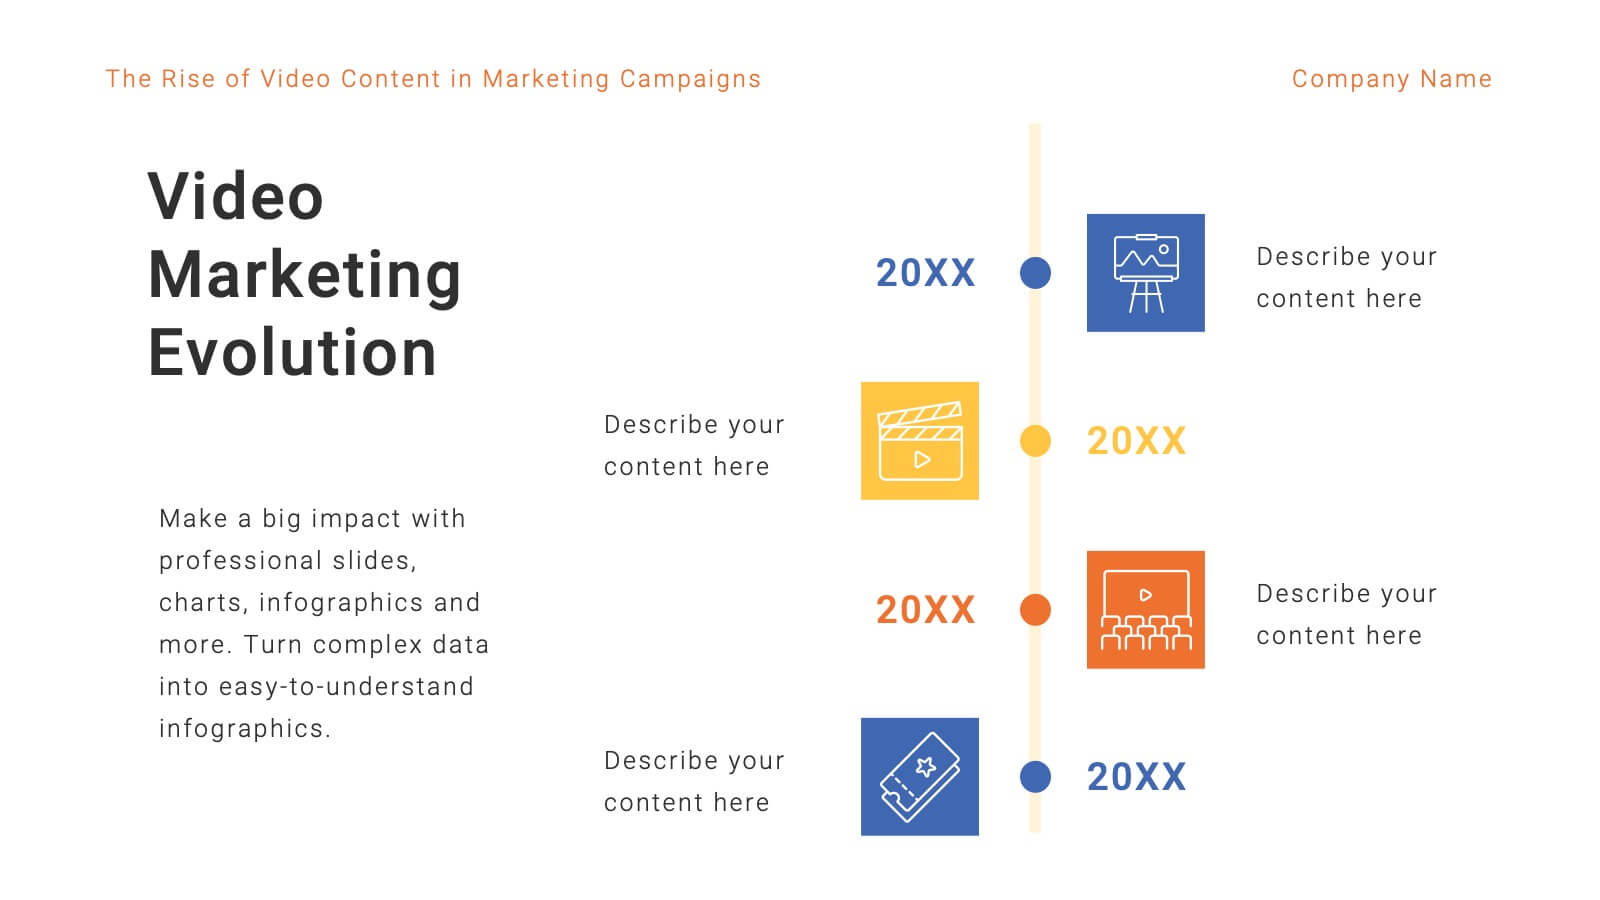
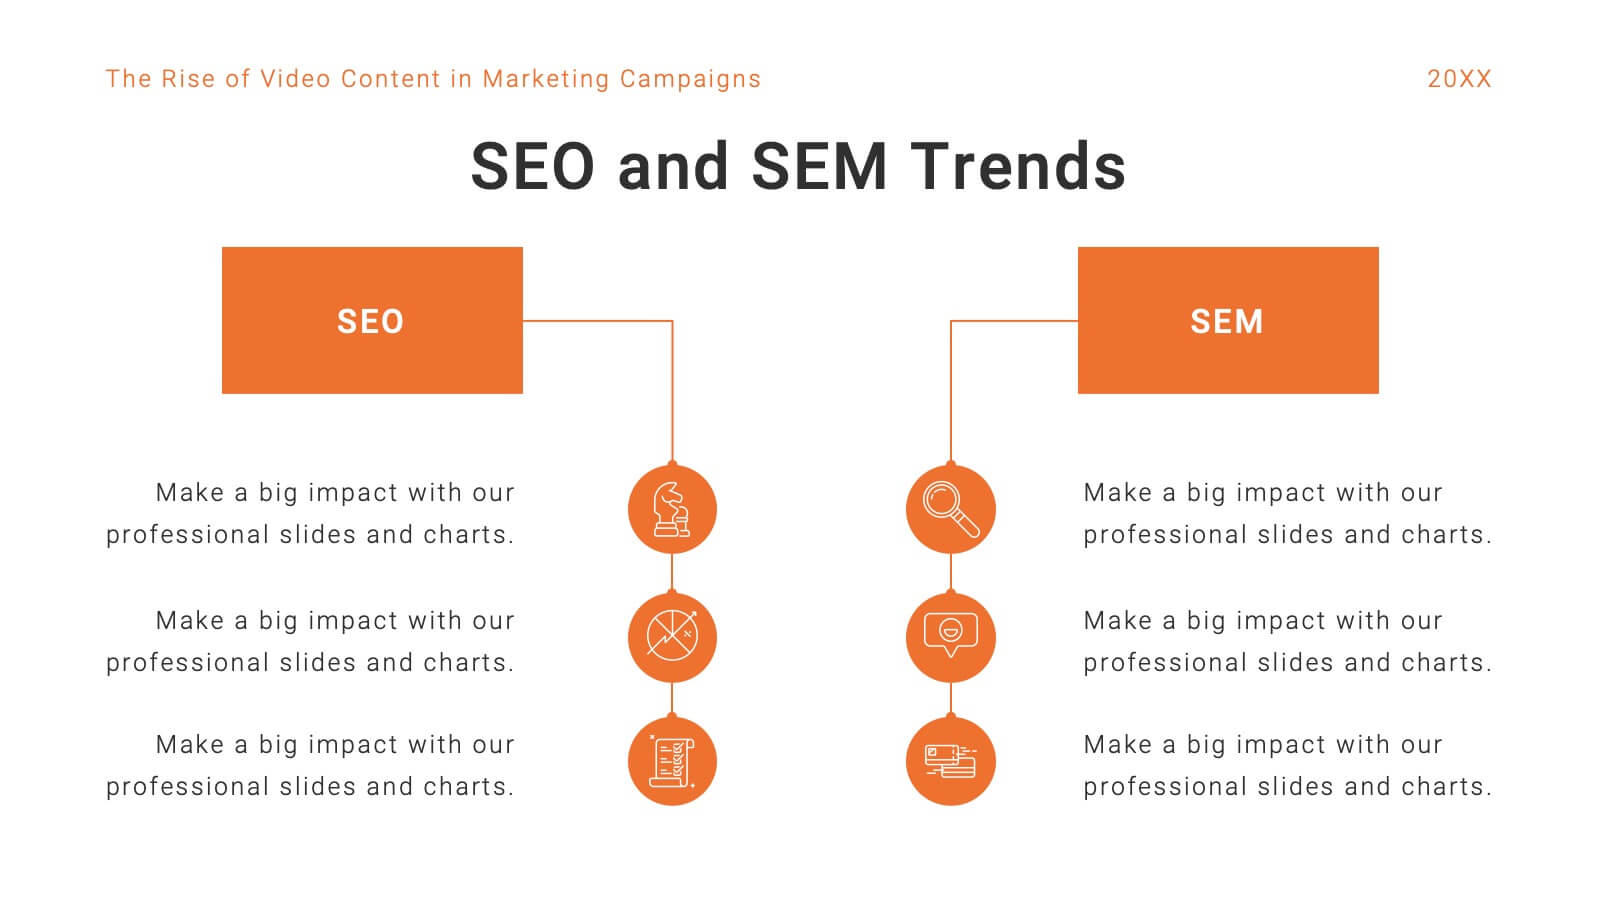
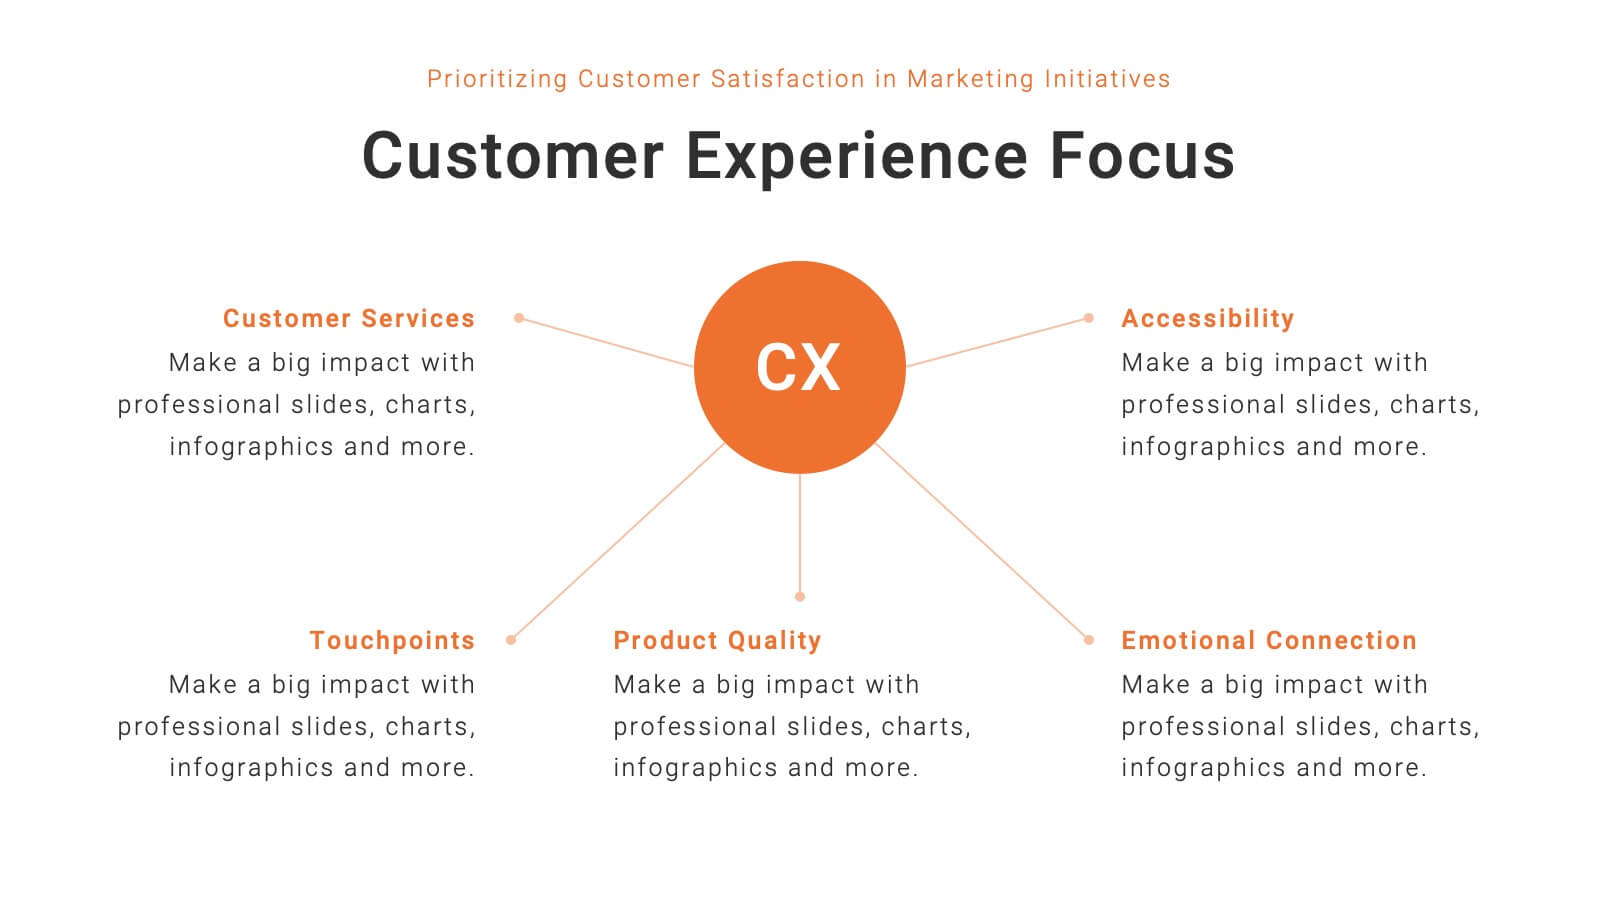
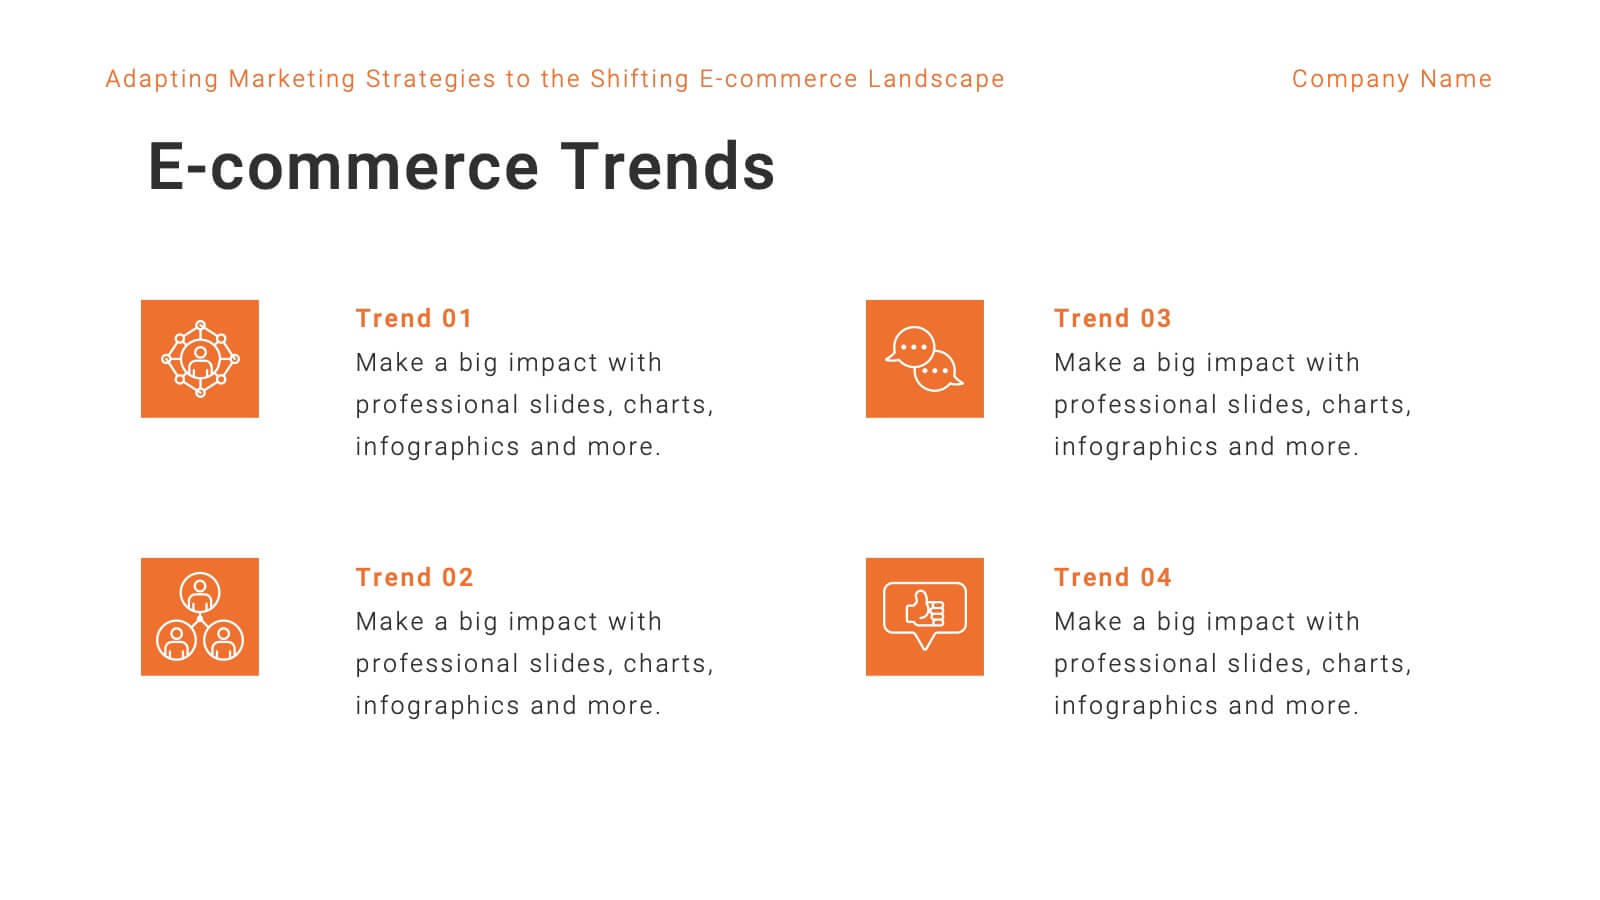
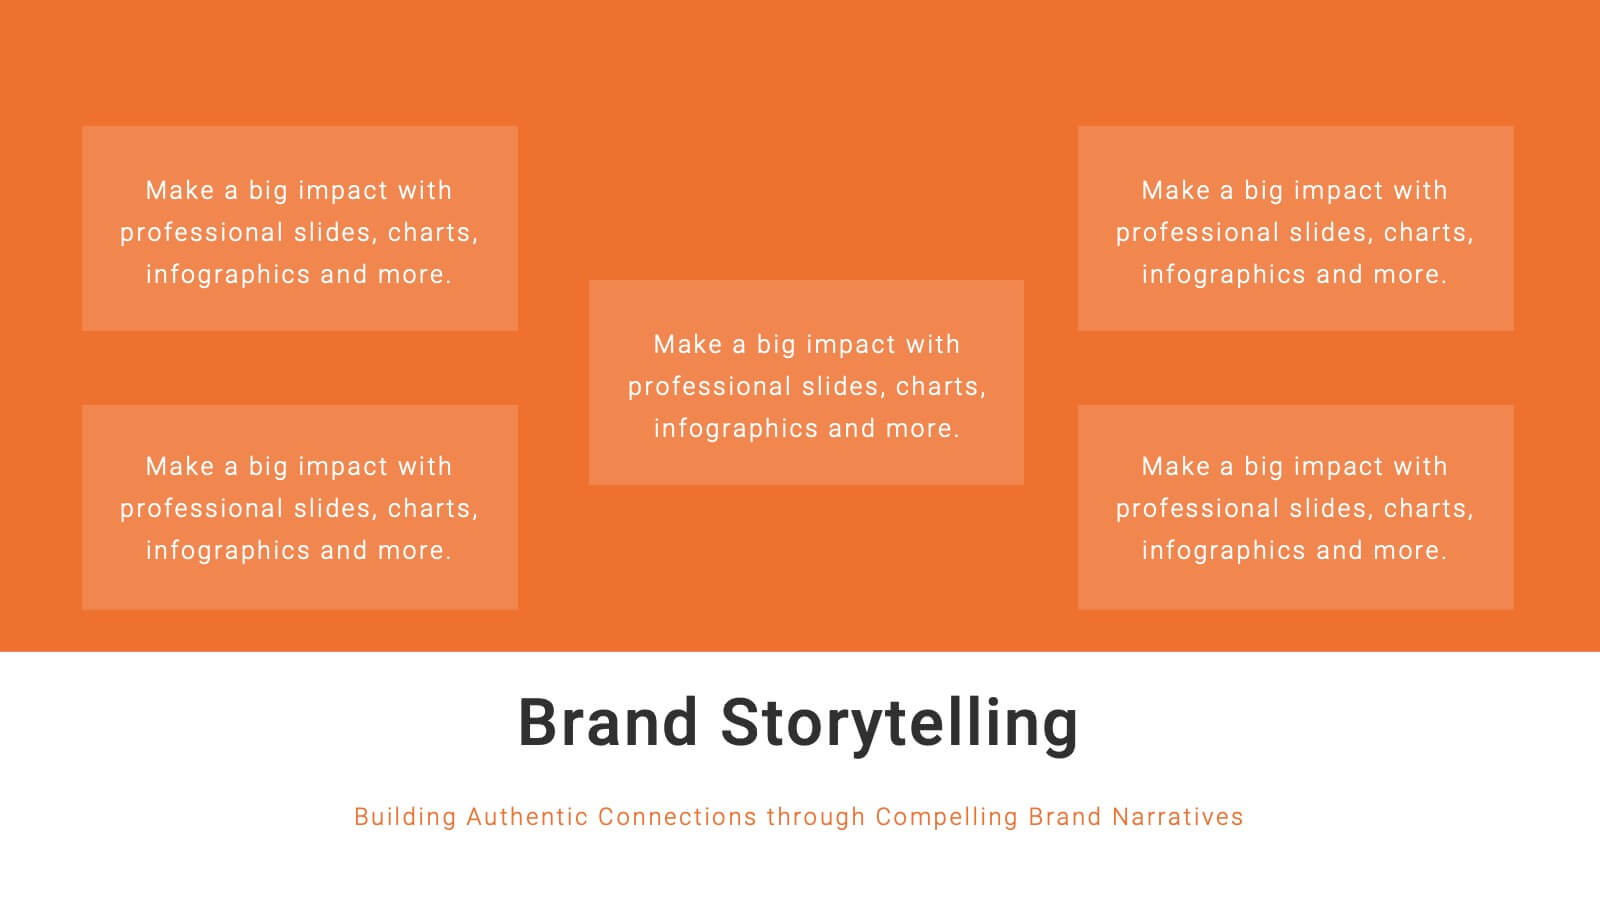
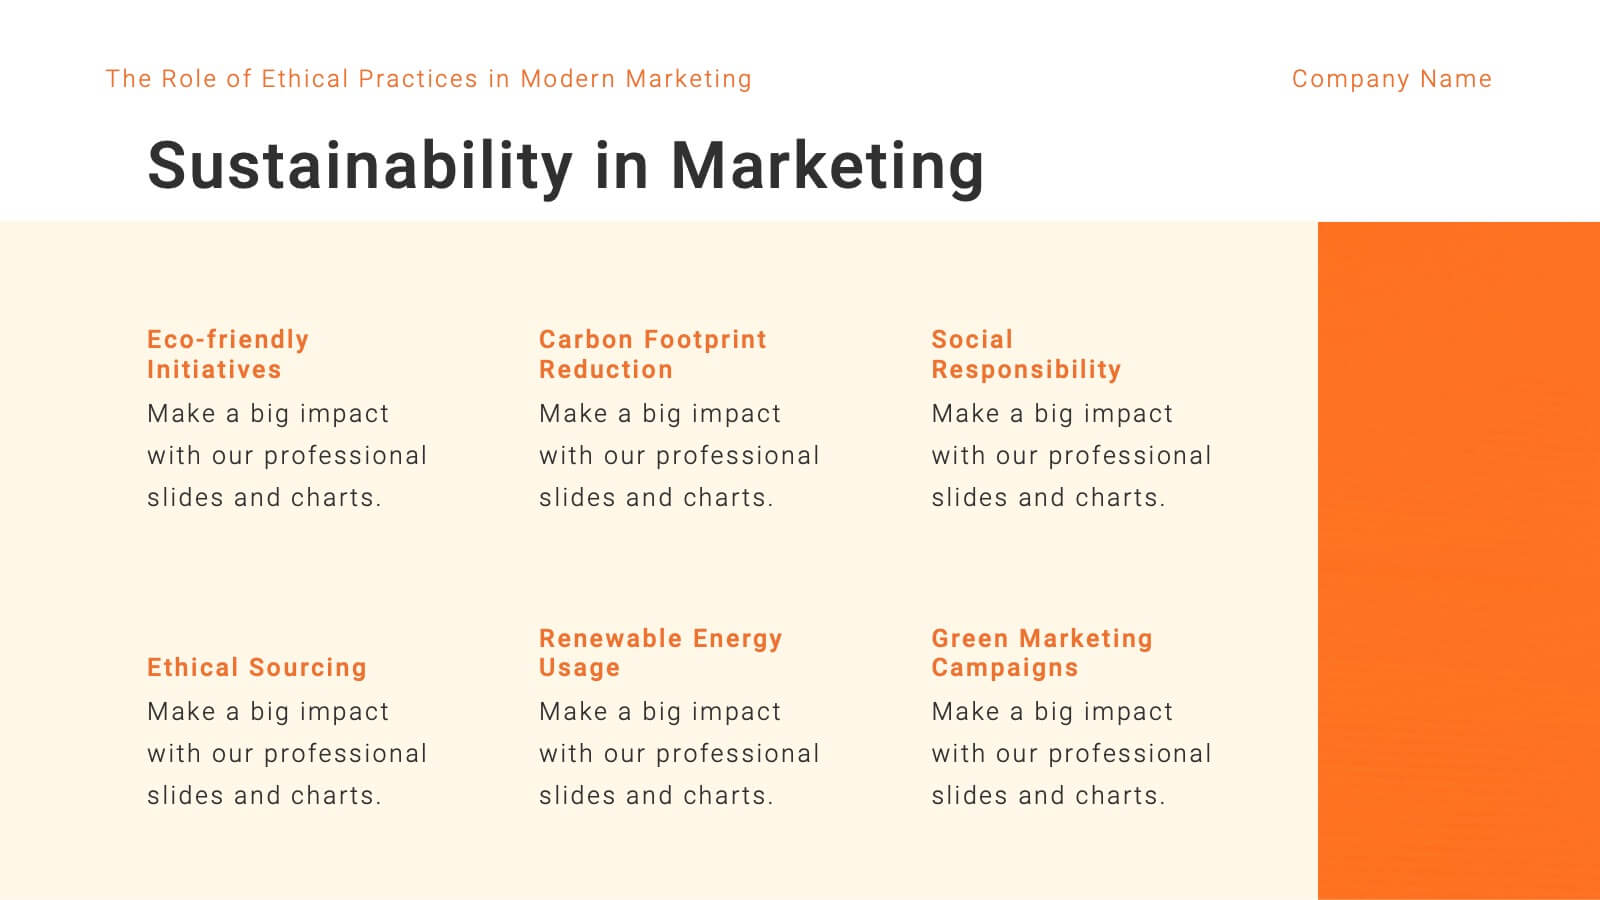
Mercury Marketing Research Report Presentation
Elevate your marketing strategy with this insightful and data-driven presentation template! Perfect for analyzing trends, consumer behavior, and emerging technologies, this template provides a thorough overview of today’s marketing landscape. From social media strategies to e-commerce trends, it covers all key areas. Fully customizable and compatible with PowerPoint, Keynote, and Google Slides for easy use.


14 diapositivas
IT Service Operations Strategy
Simplify complex IT operations into an intuitive visual strategy. This slide features a dynamic radial flow diagram and labeled segments to illustrate service components, support tiers, or incident flows. Perfect for IT managers, consultants, and teams aligning service delivery with business goals. Fully editable in PowerPoint, Keynote, or Google Slides