


Características


¿Tienes alguna pregunta?
Recomendar


7 diapositivas
Safety Rules Infographic
Safety rules are crucial in various settings, including workplaces, public spaces, and homes, because they play a fundamental role in protecting individuals from harm and ensuring their well-being. This infographic template aims to present essential safety rules and guidelines in a visually appealing manner. Compatible with Powerpoint, Keynote, and Google Slides. Tailor the content to suit your specific safety guidelines and ensure the infographic effectively communicates the importance of safety across different contexts. This will allow you to effectively communicate essential safety guidelines in your presentations.


21 diapositivas
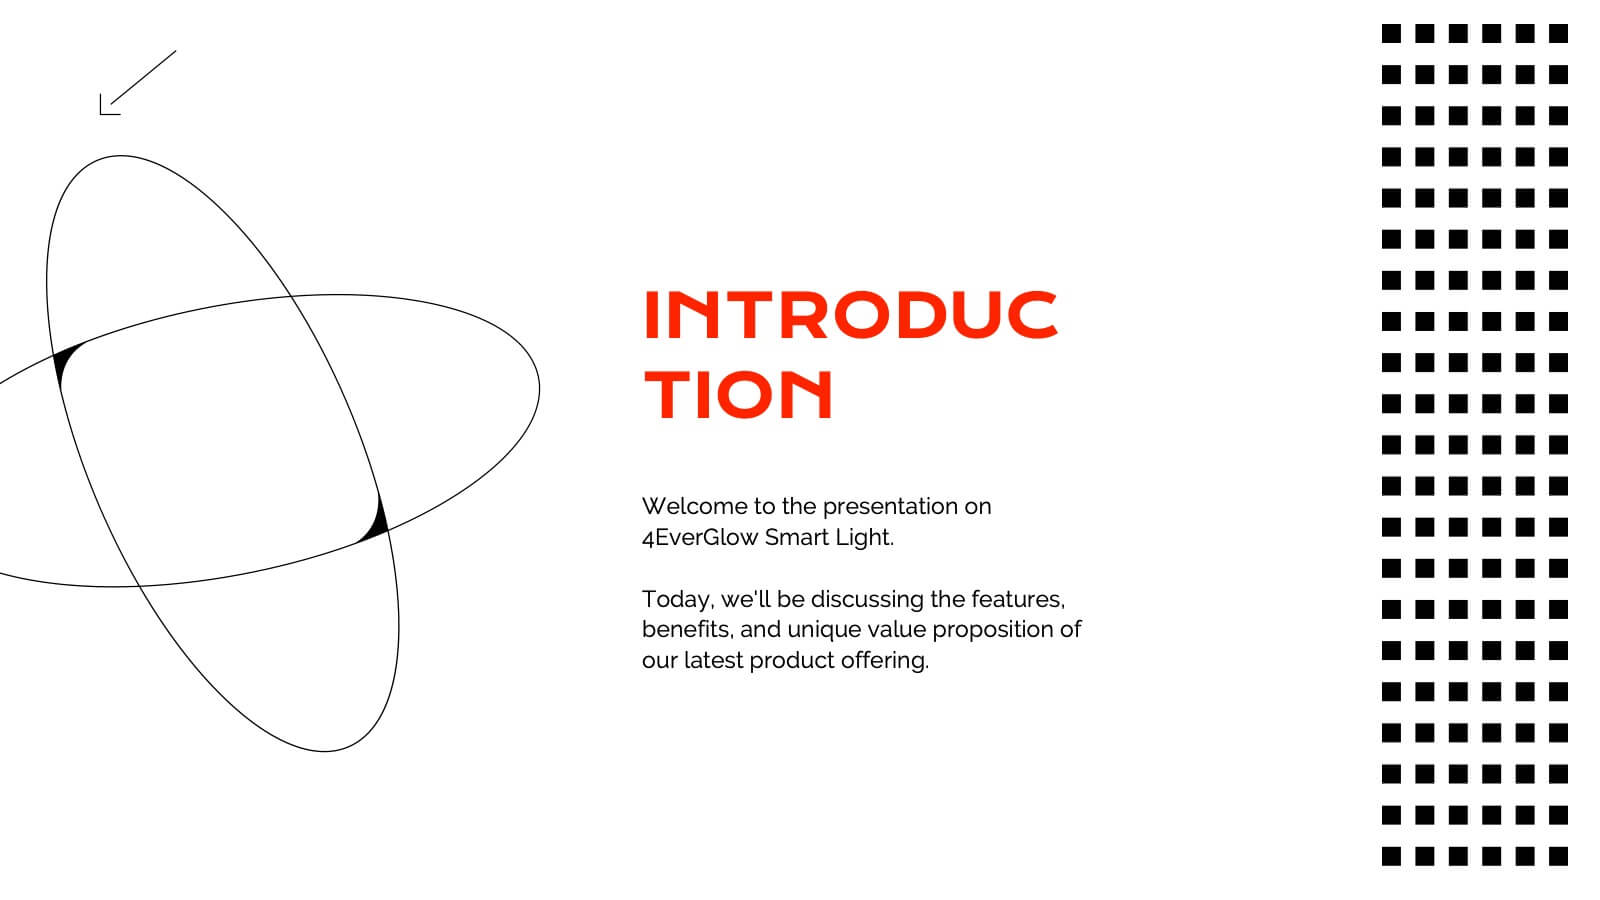
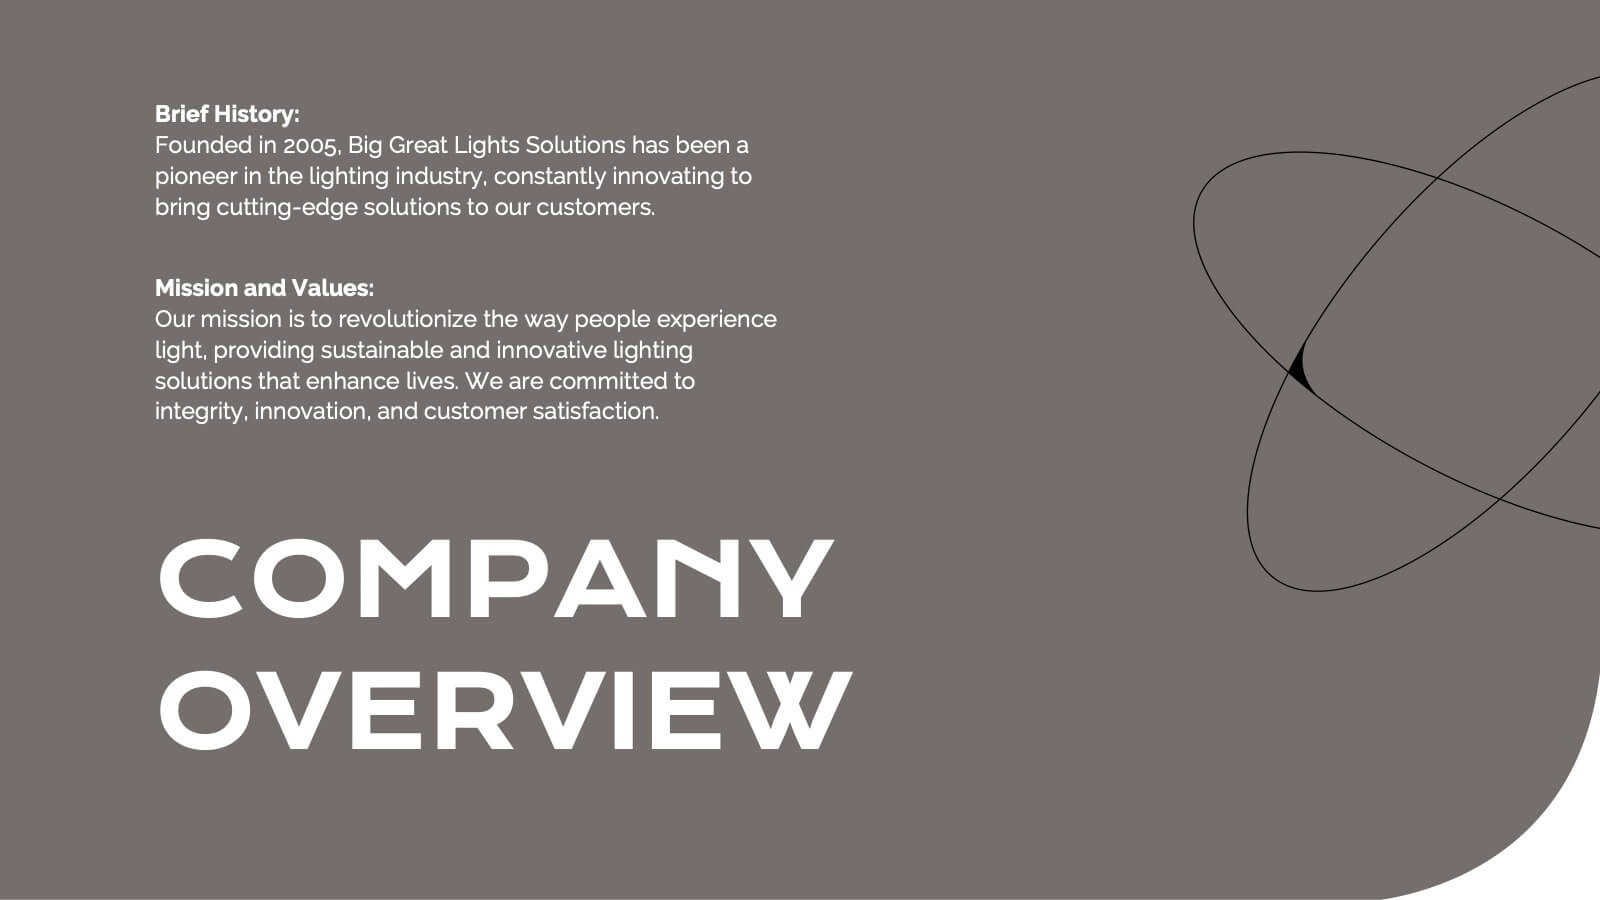
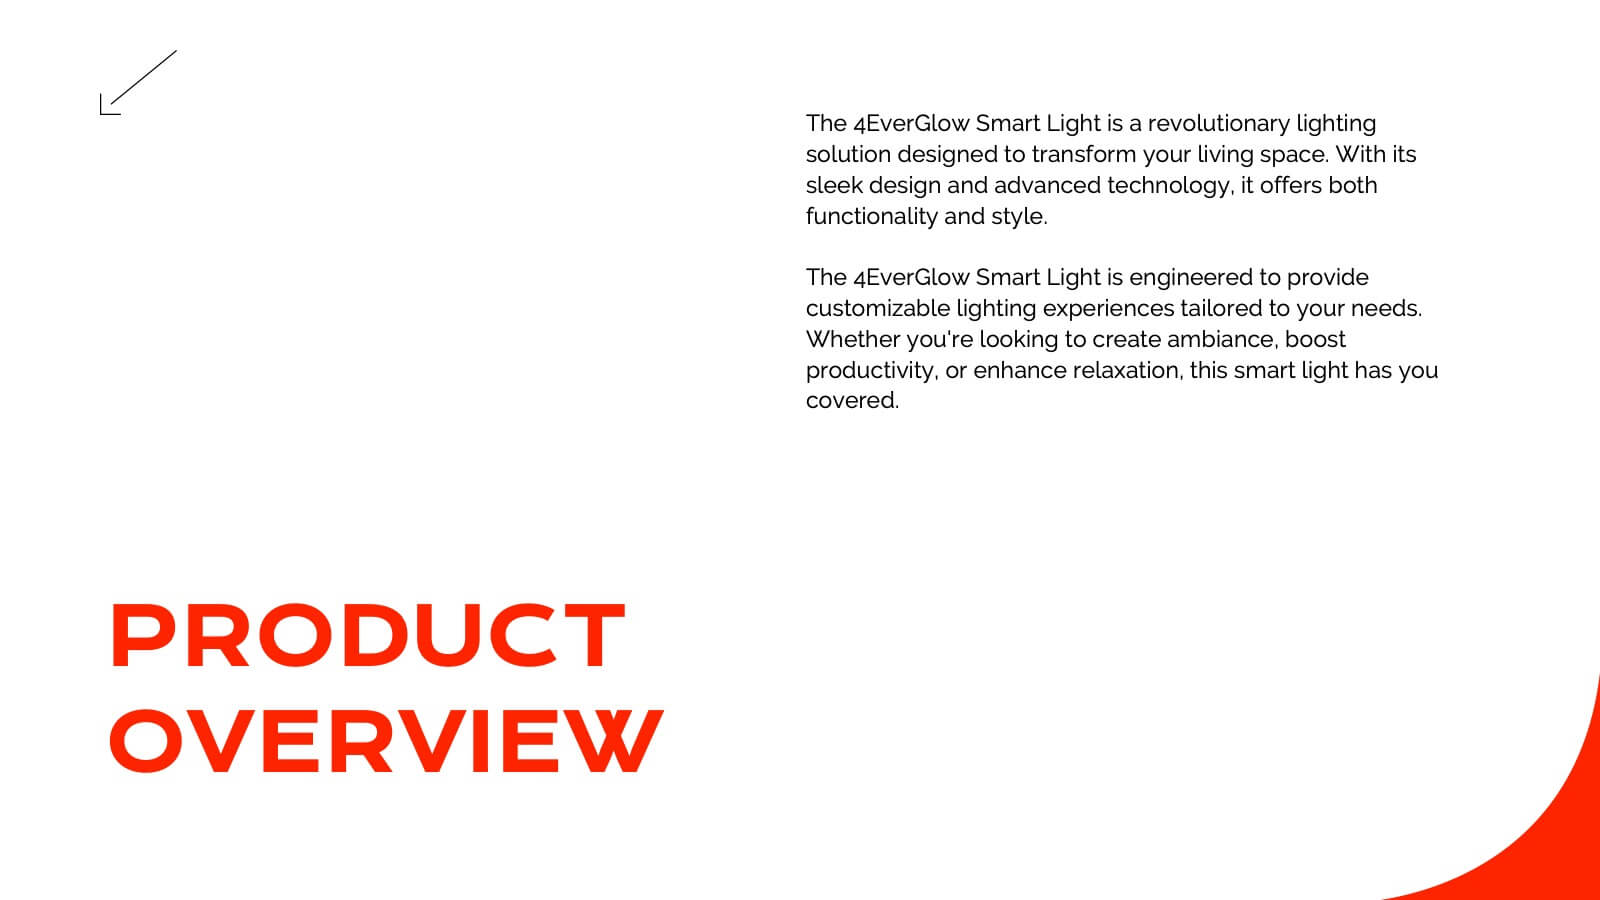
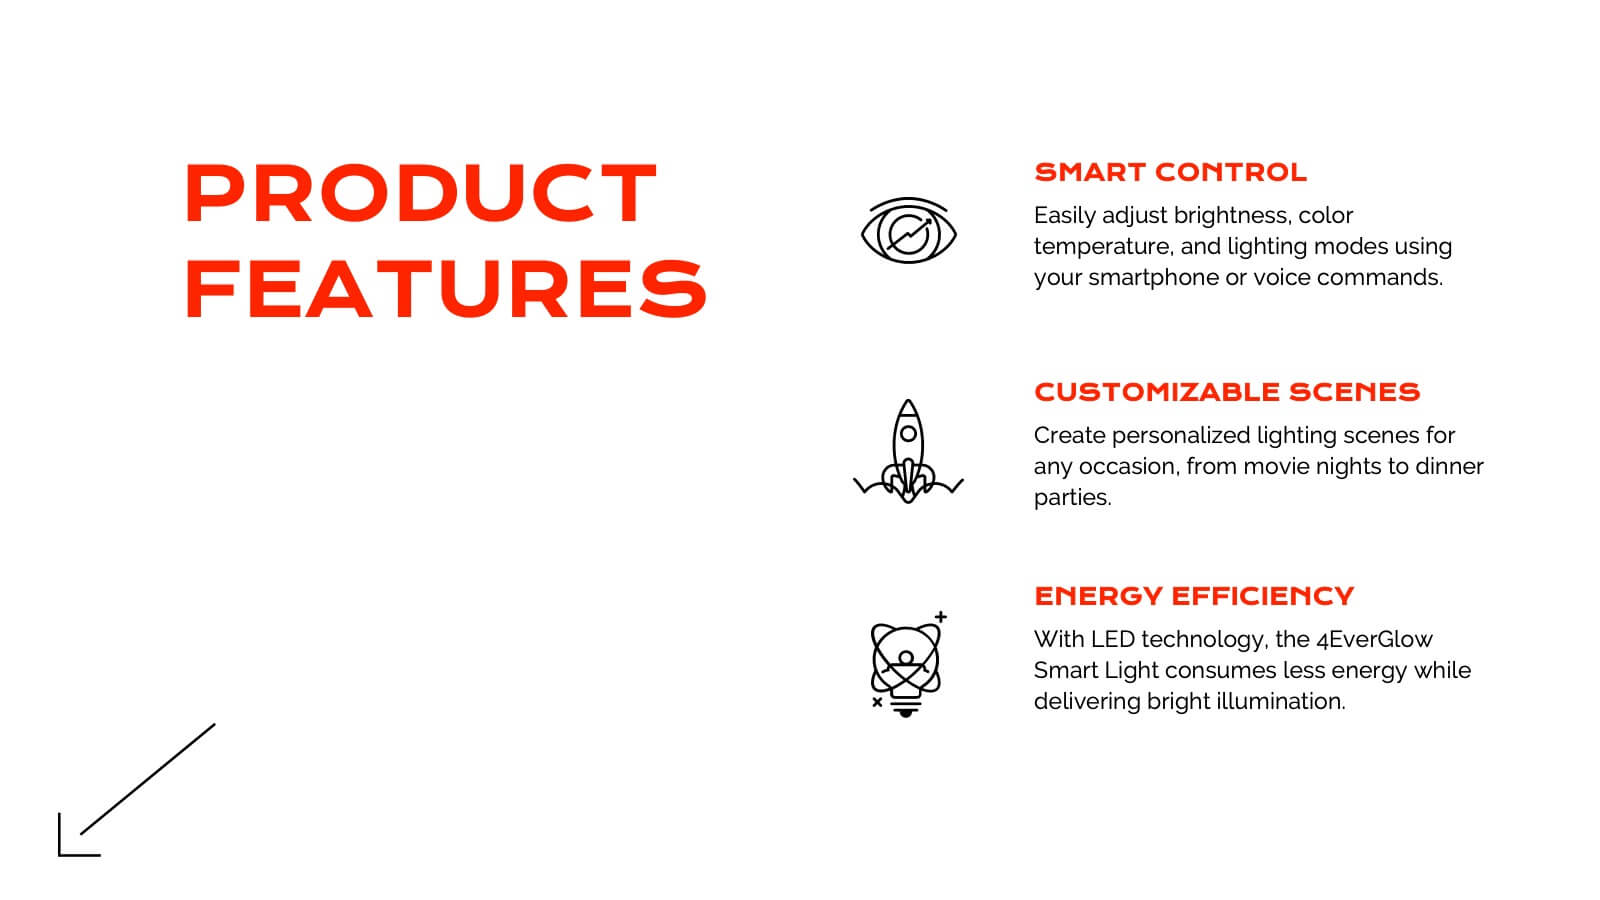
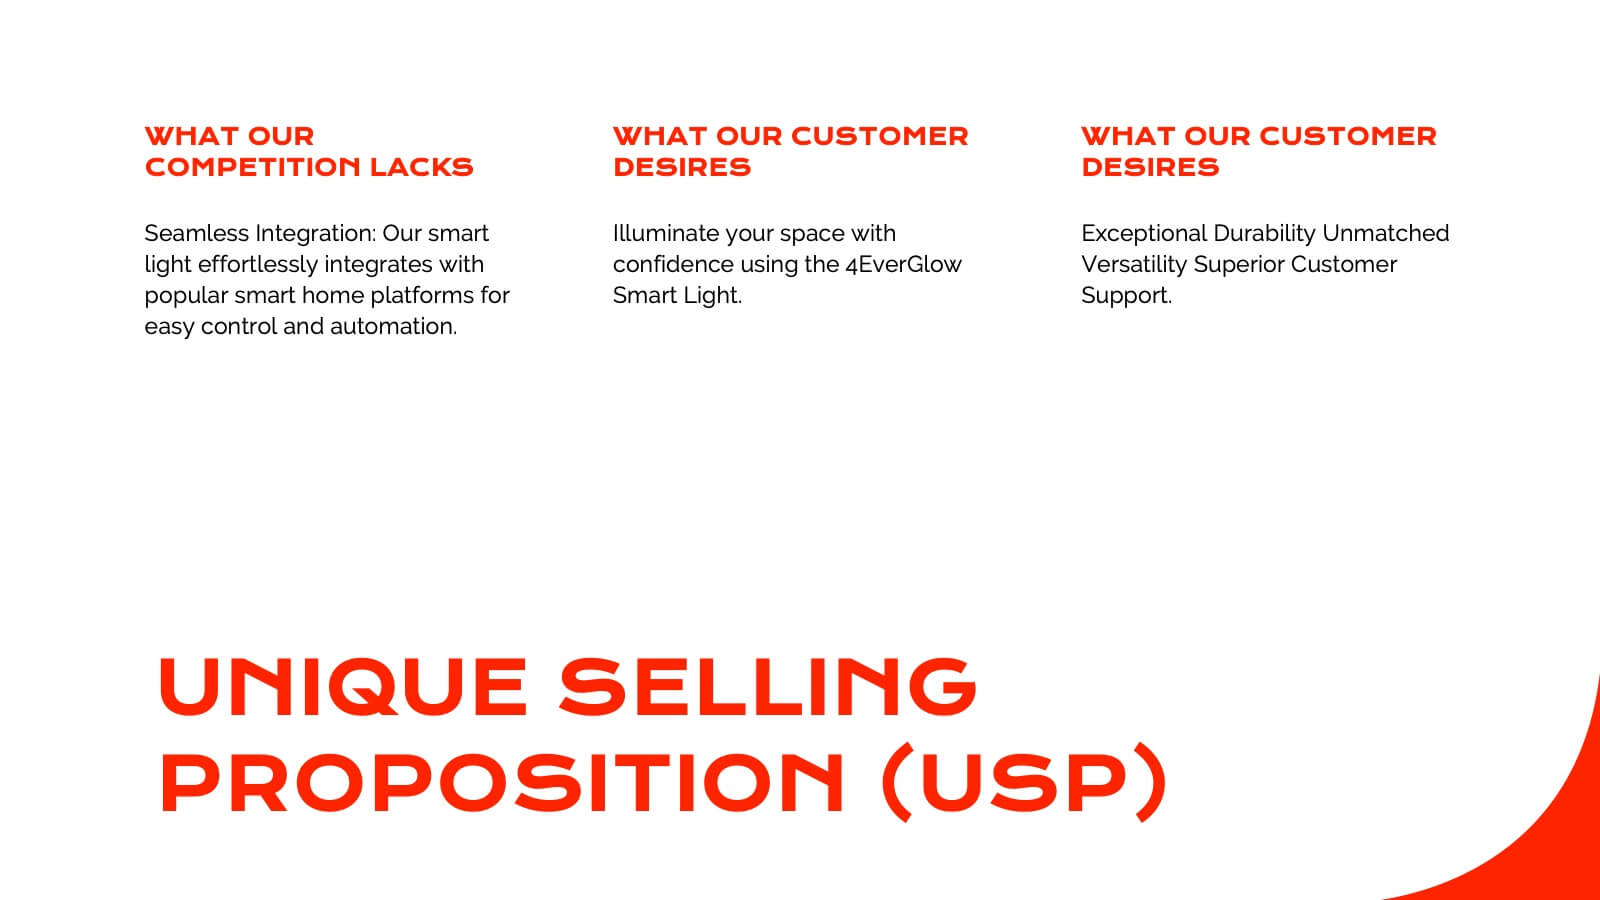
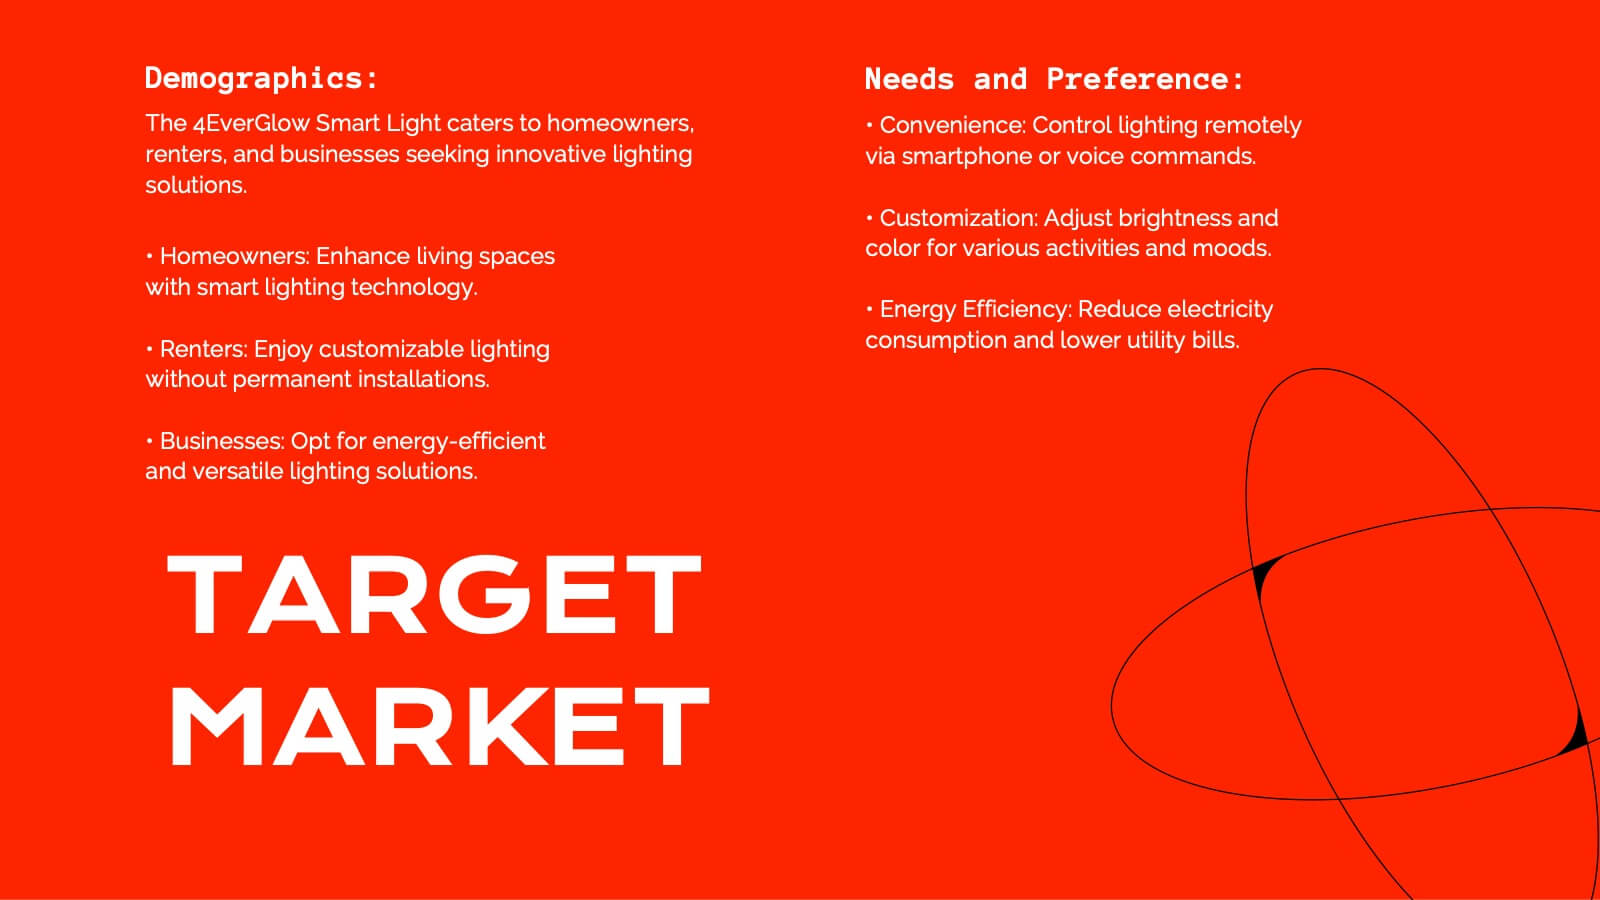
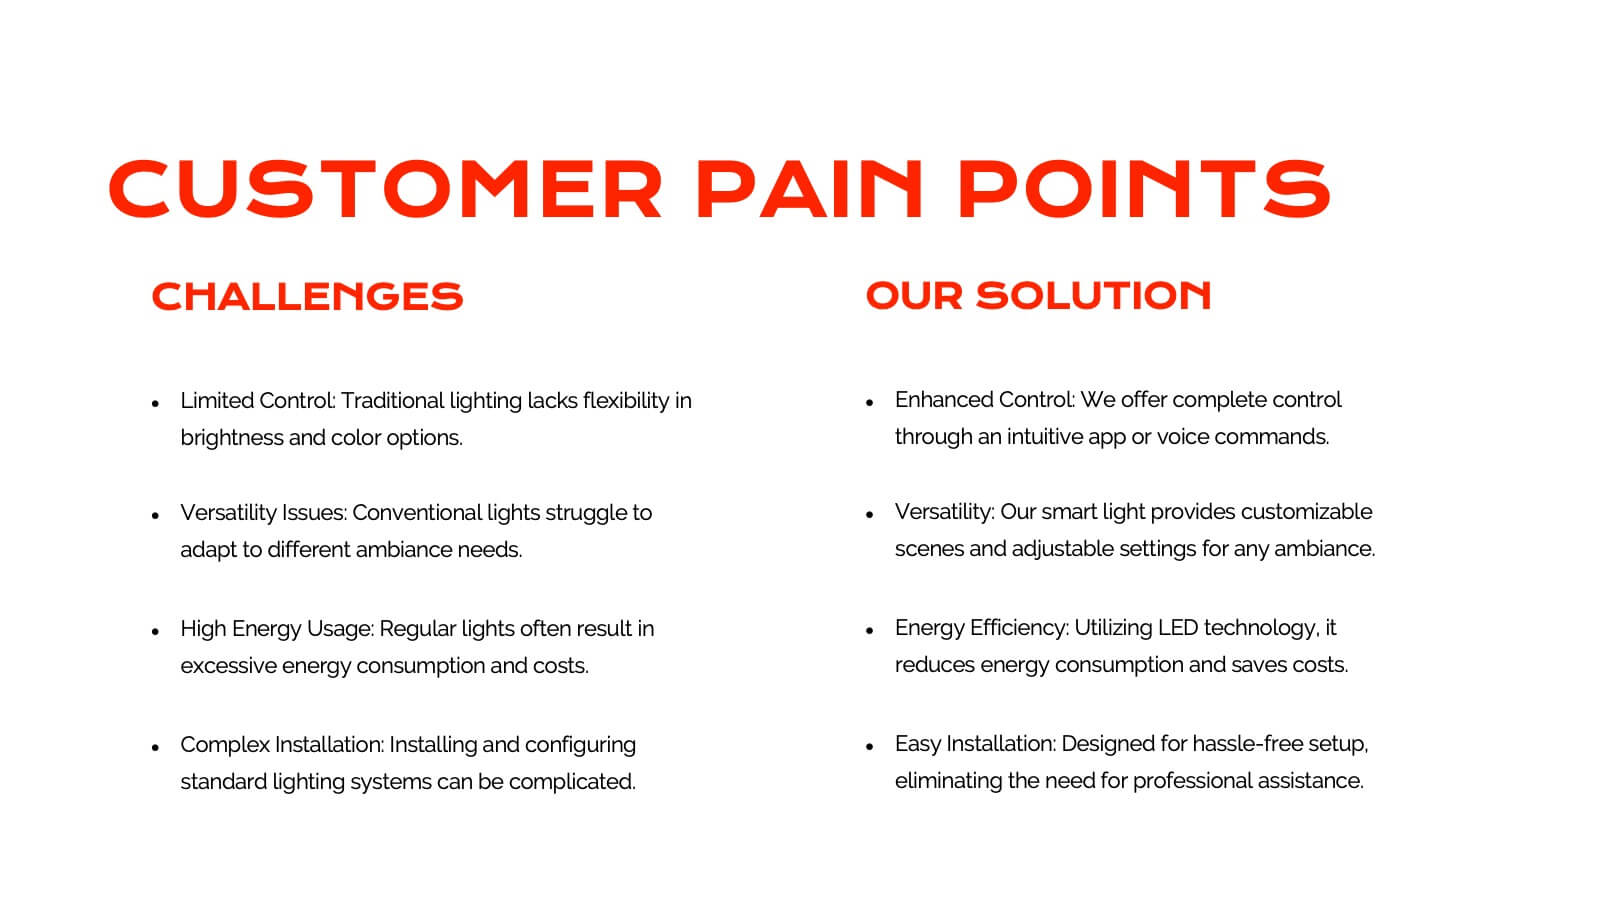
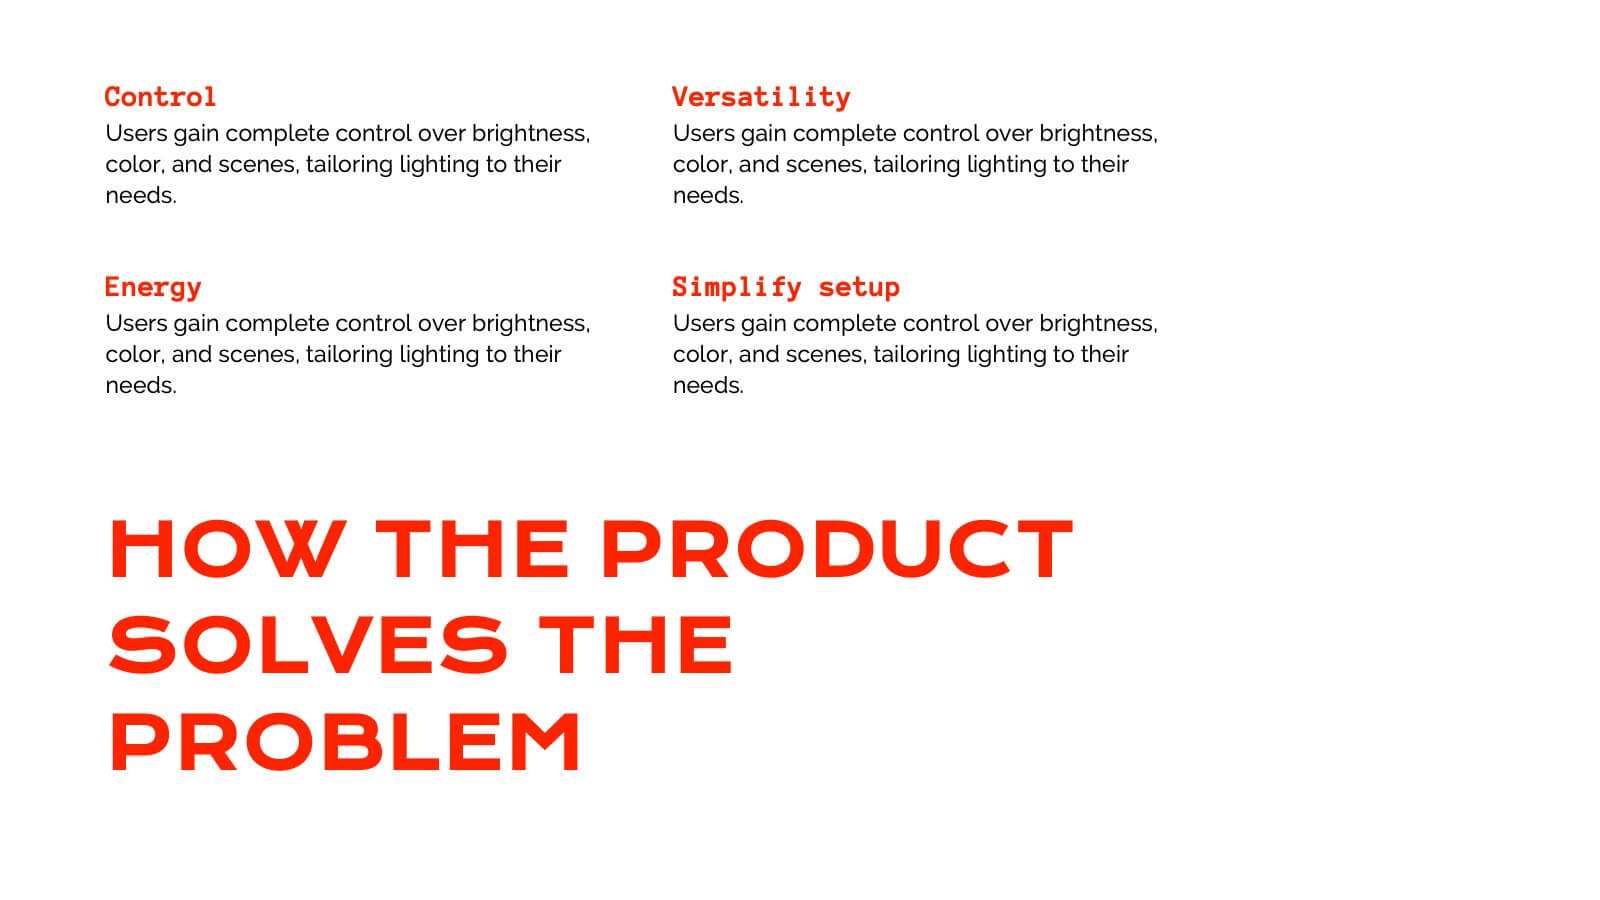
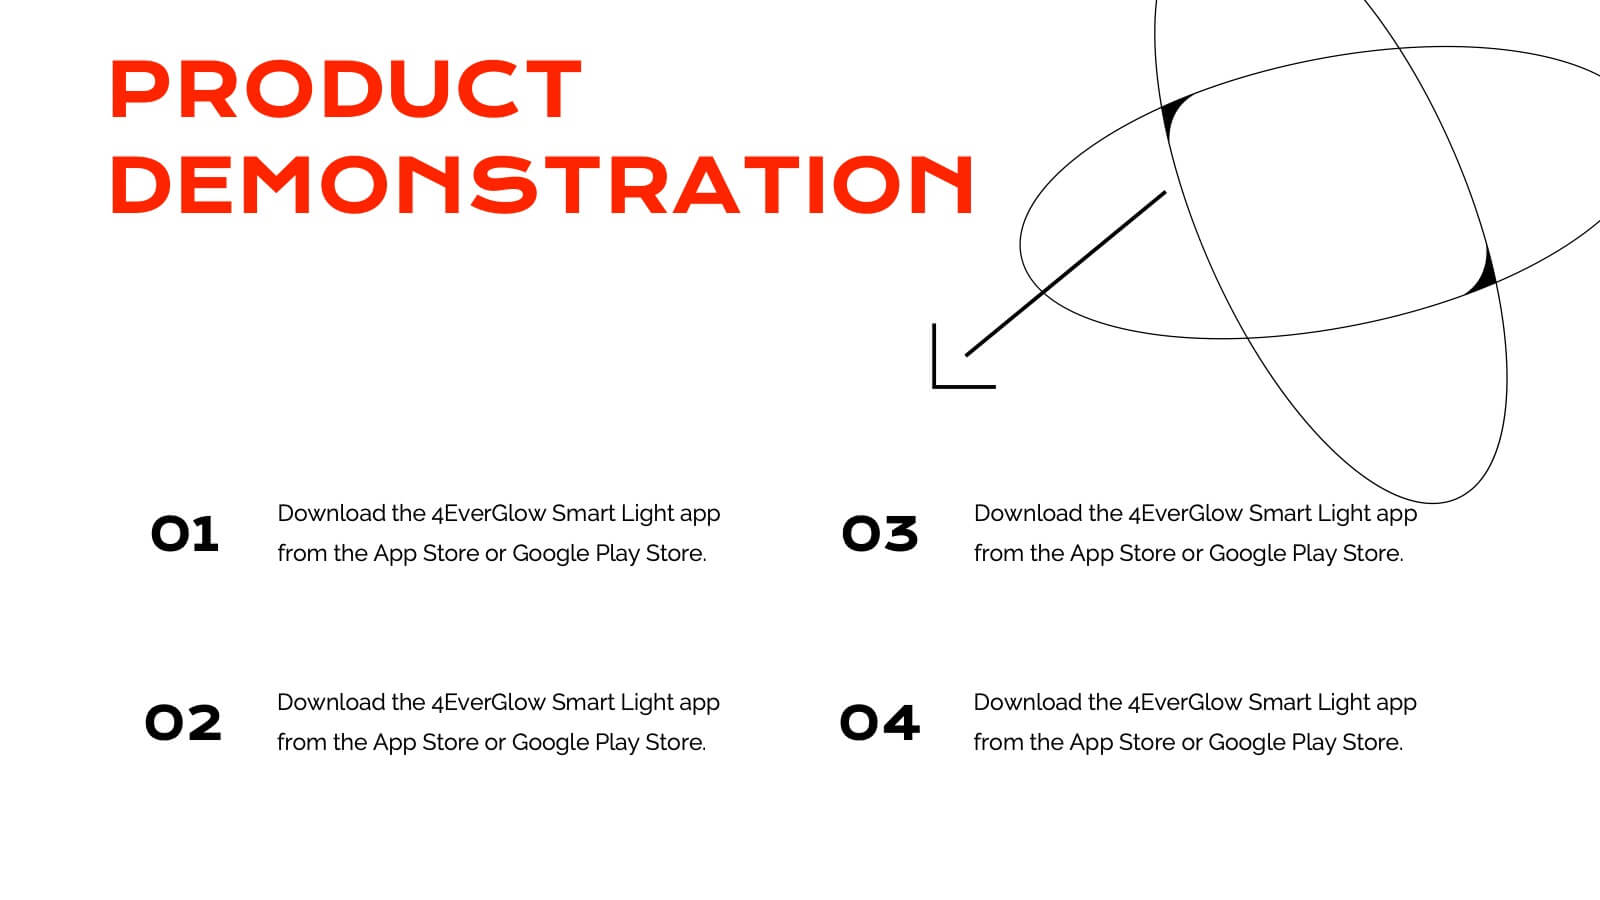
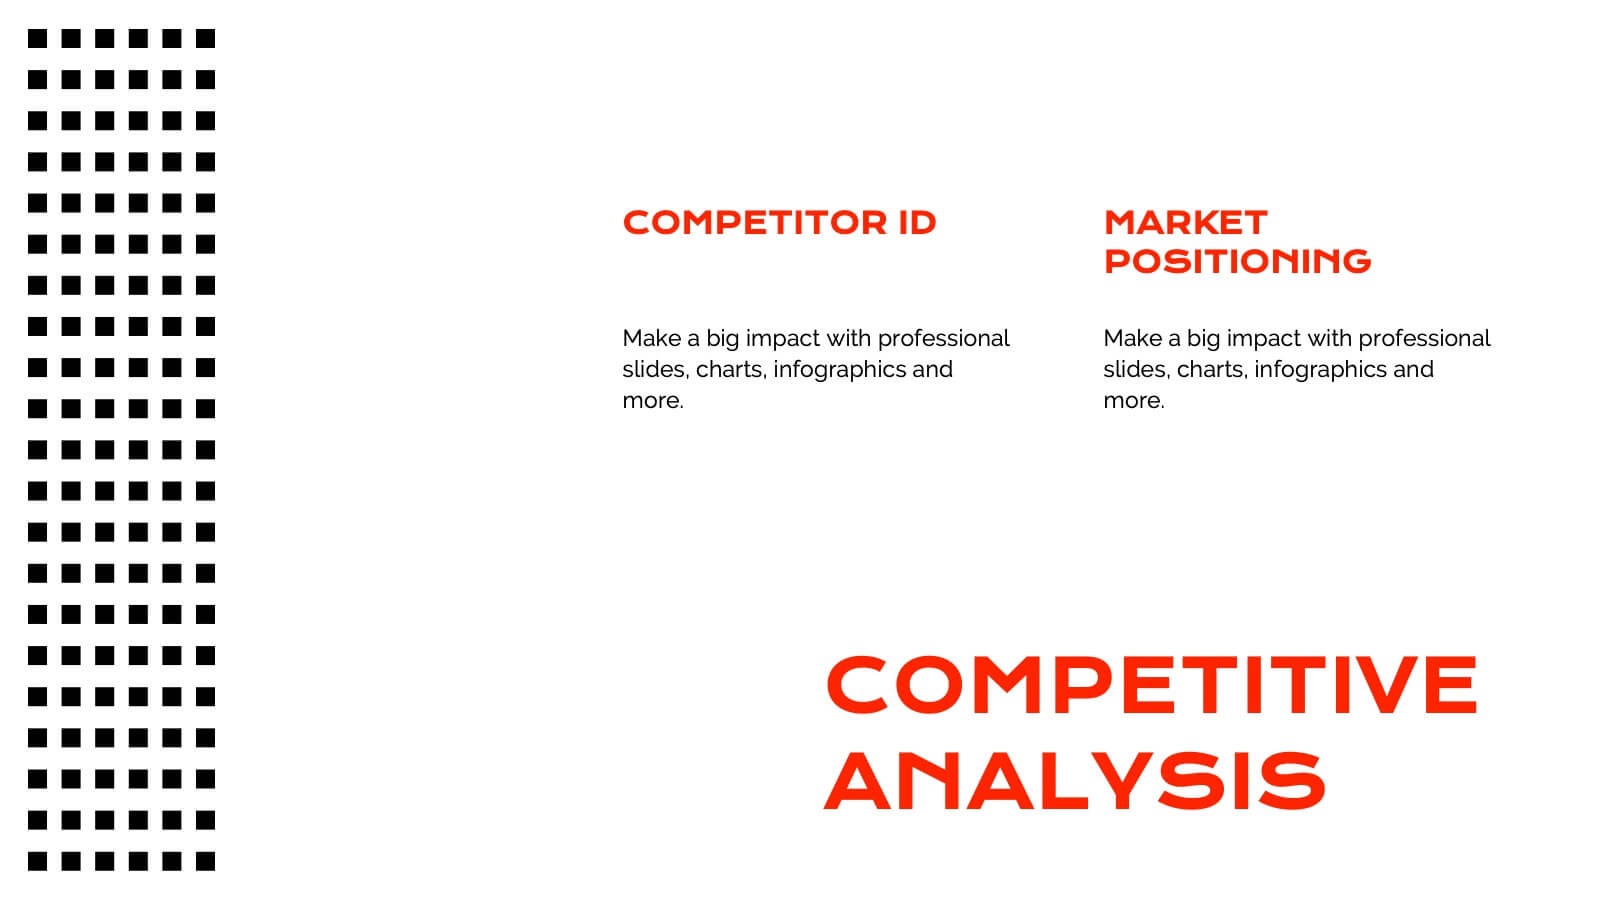
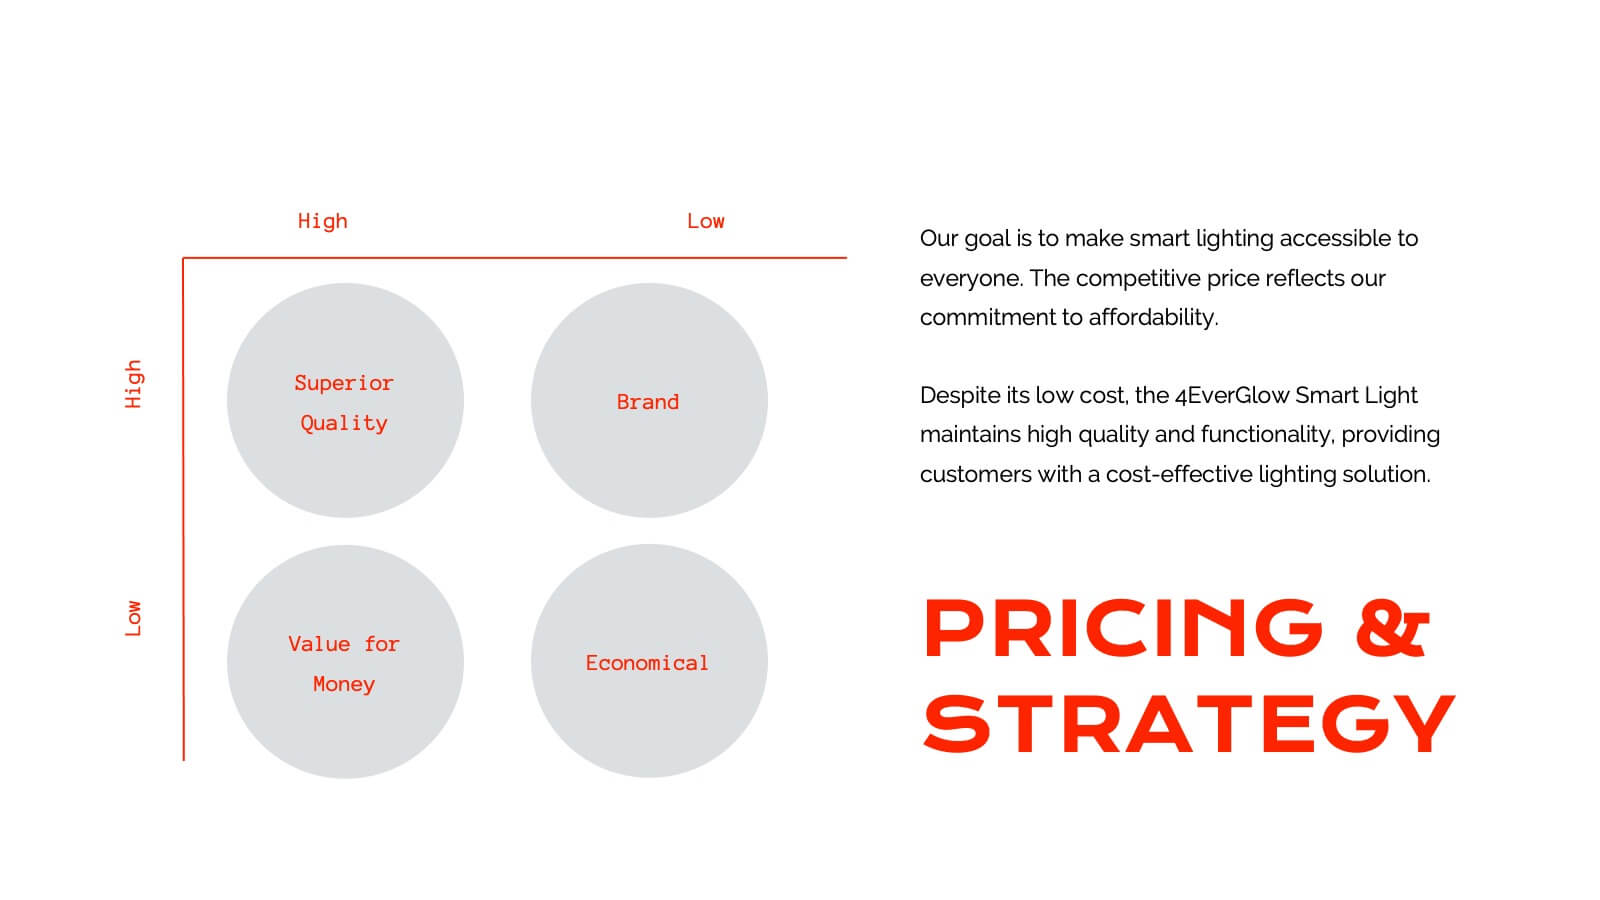
Juventas Product Roadmap Presentation
Get ready to dazzle your audience with a visually striking presentation that takes them through the entire product journey! This template covers essential areas such as product features, target market analysis, and competitive positioning. With its sleek, modern design, it's perfect for capturing attention and delivering clear information. Compatible with PowerPoint, Keynote, and Google Slides for effortless use across platforms.


8 diapositivas
Africa Development & Market Potential Presentation
Showcase regional opportunities with the Africa Development & Market Potential Presentation. This professional slide highlights four key countries across the continent using vibrant map markers and icons, ideal for data comparison, investment potential, or development tracking. Cleanly structured and easy to edit in PowerPoint, Keynote, Google Slides, and Canva.


5 diapositivas
Cybersecurity Risk Management Presentation
Simplify your security strategy with this clean, lock-themed visual. This layout organizes five key points with corresponding icons, perfect for presenting IT safeguards, data protection plans, or risk response actions. The vertical structure ensures clarity, while the design remains professional and editable in PowerPoint, Keynote, and Google Slides.


9 diapositivas
Sales Pitch Proposal Presentation
Win over your prospects with our Sales Pitch Proposal presentation template, crafted to highlight the strengths of your product or service compellingly and convincingly. The template opens with a bold title slide, immediately capturing attention, followed by a well-organized agenda that outlines the flow of your pitch. Dive into the 'Problem' slide to articulate the challenges your target audience faces, followed by the 'Solution - Steps' slide where you can break down how your offering addresses these challenges in phases. Showcase the 'Key Features' of your product, highlighting the unique benefits that set you apart from the competition. The 'Target Audience' slide allows you to visually represent the demographics of your ideal customer, making your proposal more relatable. The 'Pricing' slide is neatly designed for a clear display of your pricing tiers, ensuring transparency. Conclude with a 'Thank You' slide that leaves a lasting impression and a 'Credits' slide for due diligence. This template is adaptable for PowerPoint, Keynote, and Google Slides, ensuring a seamless presentation experience.
6 diapositivas
Investment Insights and Budget Tracker Presentation
Stay on top of your financial strategy with the Investment Insights and Budget Tracker Presentation. This slide layout organizes six financial metrics or priorities into clear, color-coded blocks—ideal for summarizing investment options, budget breakdowns, or cost categories. Perfect for finance teams, analysts, or consultants. Fully editable in Canva, PowerPoint, Google Slides, and Keynote.


6 diapositivas
Customer Feedback Smile Rating Scale
Visualize customer satisfaction with this editable Smile Rating Scale Presentation. Featuring five emotive icons, it’s perfect for showcasing feedback, survey results, or performance reviews. Fully customizable in PowerPoint, Keynote, and Google Slides, it simplifies data presentation while adding a friendly, professional touch to your report or presentation.


8 diapositivas
Mission Objectives and Long-Term Goals Presentation
Clearly define your roadmap with this Mission Objectives and Long-Term Goals presentation. This clean, step-by-step layout is ideal for showcasing strategic milestones, vision pillars, or future goals. Each point is visually aligned for logical progression, making it perfect for planning sessions. Fully editable in Canva, PowerPoint, or Google Slides.


6 diapositivas
5G Technology Rollout and Future Vision Presentation
From 1G to 5G, tell the story of progress with this visually engaging infographic slide. Perfect for showcasing mobile network evolution, telecom innovation, or digital transformation strategies, each stage is clearly marked for simple, informative storytelling. Fully compatible with PowerPoint, Keynote, and Google Slides for easy editing and seamless presentation.


20 diapositivas
Solstice Startup Funding Proposal Presentation
This sleek startup funding proposal deck showcases your company’s objectives, services, sales process, and pricing strategy. Perfect for pitching investors or stakeholders, its modern design ensures a professional presentation. Compatible with PowerPoint, Keynote, and Google Slides, it's ideal for making a strong impression with minimal effort.


20 diapositivas
Windsong Sales Proposal Presentation
Craft a persuasive sales proposal with this sleek and professional template. Perfectly suited for communicating your value proposition, this design includes slides for introductions, company overviews, and a detailed service summary. Address critical business factors with sections for target markets, competitive analysis, and clearly defined sales objectives. Highlight your sales process, showcase the team's expertise, and build trust through customer testimonials. Dedicated slides for pricing strategies, promotions, and discounts allow you to present a compelling financial offer. Wrap up with an actionable next steps plan and a feedback section to reinforce client engagement. Fully customizable and compatible with PowerPoint, Google Slides, and Keynote, this template combines modern design with functional layouts to ensure your proposal stands out. Ideal for creating a lasting impression.


5 diapositivas
Overcoming Strategic Business Challenges Presentation
Break down complex obstacles with this step-by-step "Overcoming Strategic Business Challenges" presentation. Featuring a stair-like 3D visual with figures symbolizing progress and setbacks, each slide is divided into four clear milestones. Ideal for showcasing pain points, strategic pivots, or recovery plans. Customize each step with your insights in PowerPoint, Keynote, or Google Slides.


5 diapositivas
Education Department Infographics
The Education Department, also known as the department of education or ministry of education, is a government or administrative body responsible for overseeing and regulating education within a particular jurisdiction. This infographic template is designed to showcase the key aspects and functions of an education department within an organization or institution. It provides an informative overview of the department's goals, initiatives, programs, and achievements. This is the perfect template for educational institutions, government departments, or organizations with an education-focused division. Compatible with Powerpoint, Keynote, and Google Slides.


6 diapositivas
First-Time Buyer Tips Infographic
Navigate the thrilling world of first-time purchases with our "First Time Buyer Tips" Infographic Template. This vibrant tool is crafted to guide newcomers through the buying process with clarity and confidence. Each slide is a step-by-step beacon, illuminating the path with expert advice, from understanding budgeting basics to mastering negotiation tactics. Designed with the novice buyer in mind, this template features a series of easy-to-follow visuals and succinct tips that demystify the complexities of making major purchases. The clean, engaging design ensures that each piece of advice is both accessible and memorable, ideal for personal finance websites, real estate blogs, or consumer education workshops. Customize the color schemes, fonts, and layouts to align with your branding, making it a seamless addition to your educational materials. Equip your audience with the knowledge they need to make informed, confident decisions with this indispensable guide.


5 diapositivas
Coffee Tasting Infographics
Coffee Tasting, also known as coffee cupping, is the process of evaluating and appreciating the flavors, aromas, and characteristics of different coffee beans. These infographic templates are designed to educate participants about the art of coffee tasting. The captivating visuals will empower your audience to appreciate the flavors and nuances of different coffee varieties. Whether you're hosting a coffee tasting event or sharing information with coffee enthusiasts, this template will help you deliver an engaging and visually appealing presentation that celebrates the joy of coffee tasting. Compatible with Powerpoint, Keynote, and Google Slides.


7 diapositivas
Finance Infographic Presentation Template
Finance is a field that deals with the study of investments and the management of money. Finance Infographics are visual representations of financial information, data, and concepts. This template uses charts, graphs, diagrams, and illustrations to help explain complex financial information in a simple and easy-to-understand way. This Finance Infographic can cover a range of topics including budgeting, investments, expenses, and market analysis, among others. This is the perfect template to use for businesses, financial organizations, and educators to help people understand financial concepts.


7 diapositivas
Mockup Infographic
Elevate your presentation game with this versatile collection of mockup templates, designed to showcase your digital projects in a sleek, professional manner. Each template features a clean and modern design, highlighting your work on various digital devices including smartphones, tablets, and computer screens. With a focus on simplicity and visual appeal, these mockups provide the perfect canvas for demonstrating websites, apps, and other digital products. The well-organized layouts allow for easy customization, letting you quickly insert your own images and text to match your project’s needs. Ideal for professionals in web development, app design, or digital marketing, this collection helps convey the functionality and aesthetics of your digital creations effectively. Utilize these mockups in client presentations, marketing materials, or portfolio showcases to give your audience a realistic preview of your digital solutions.