


Características


¿Tienes alguna pregunta?
Recomendar


6 diapositivas
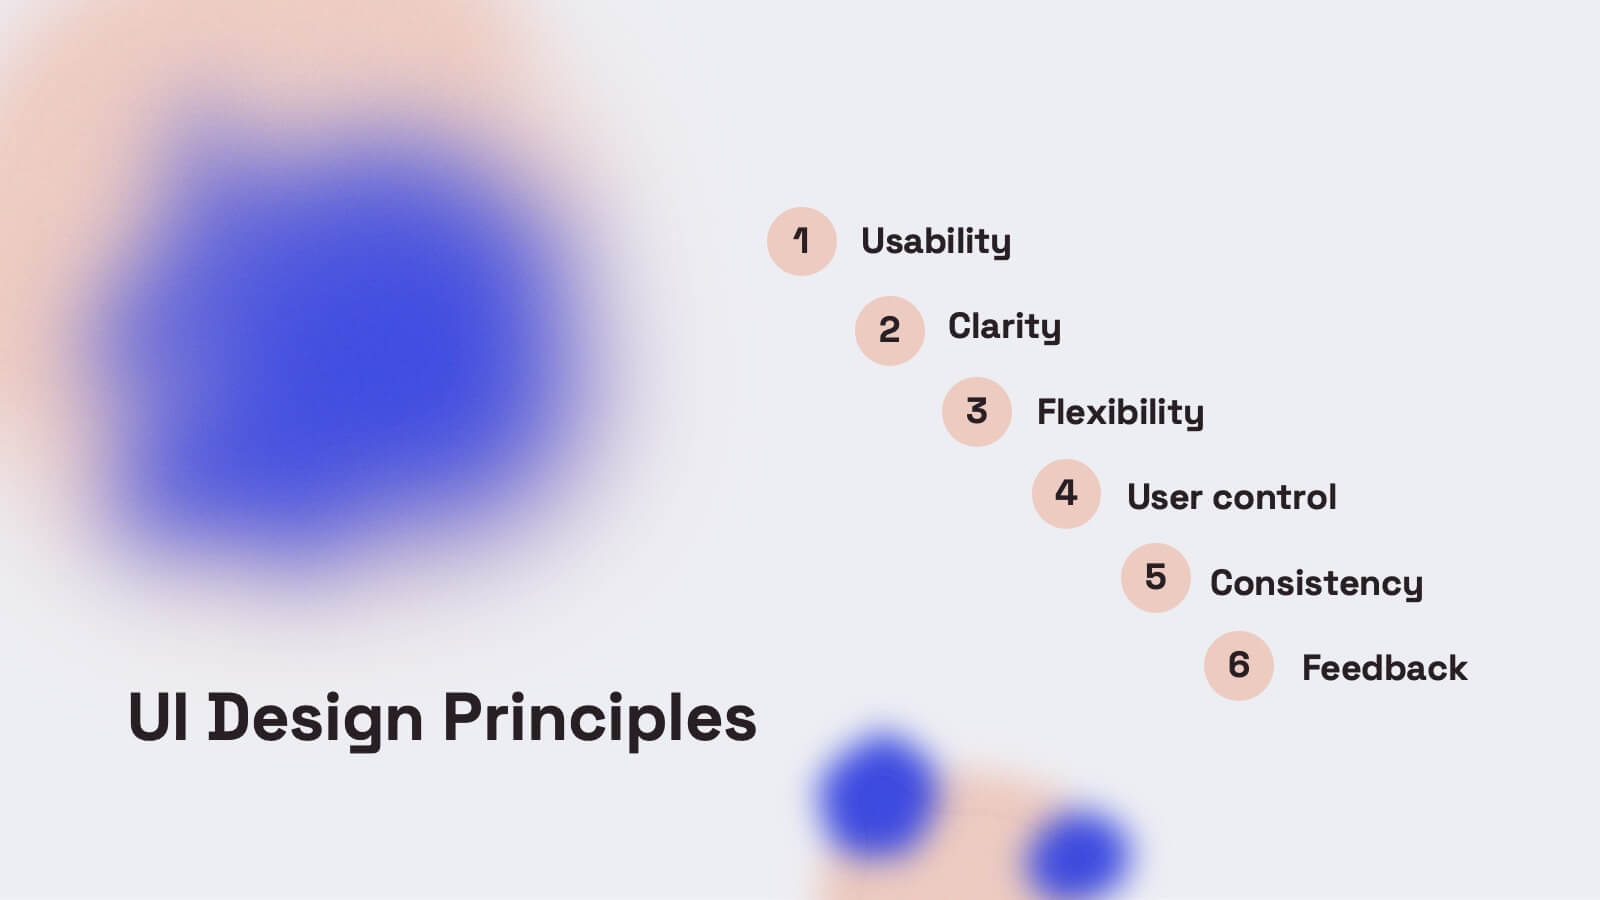
Vision Statement Development Guide
Craft a powerful company vision with this eye-catching layout—literally. Centered around a bold visual icon, this slide helps you organize six core ideas or values that shape your future direction. It’s perfect for strategy workshops, leadership meetings, or branding sessions. Fully compatible with PowerPoint, Keynote, and Google Slides.


8 diapositivas
Team Time Allocation and Planning Presentation
Stay on top of your team's workload with the Team Time Allocation and Planning presentation slide. This template features a clear, month-by-month Gantt-style layout, helping you visualize team tasks, priorities, and resource distribution across the year. Ideal for project managers, department leads, or operations teams aiming to streamline scheduling and improve collaboration. Fully customizable in PowerPoint, Keynote, and Google Slides.


5 diapositivas
Business Communication Strategy Presentation
Enhance your Business Communication Strategy with this dynamic infographic template. Designed for corporate presentations, team collaboration, and workflow optimization, it visually organizes key communication pillars for seamless engagement. Fully editable in PowerPoint, Keynote, and Google Slides, ensuring adaptability for diverse business needs.


5 diapositivas
Teaching Framework Presentation
Bring your teaching steps to life with a clear, uplifting layout that turns educational progression into an easy-to-follow visual journey. This presentation helps you break down concepts, outline stages, and guide learners smoothly from one level to the next. Fully compatible with PowerPoint, Keynote, and Google Slides.


6 diapositivas
Change Management Process Infographic
Change management is a structured approach used by organizations to transition from their current state to a desired future state. This infographic template is designed to showcase the steps and components involved in managing organizational changes effectively. This template helps viewers understand the process and key elements required for successful change management. This informative infographic can be shared with employees, managers, or students to provide a clear understanding of the steps and strategies involved in successfully implementing organizational changes. Compatible with Powerpoint, Keynote, and Google Slides.


5 diapositivas
Colorful Circular Flow Chart Presentation
Bring your ideas full circle with a vibrant, energetic flow that instantly grabs attention and makes complex processes feel effortless to follow. This presentation is perfect for illustrating cycles, workflows, or interconnected stages in a clear, dynamic way. Fully compatible with PowerPoint, Keynote, and Google Slides.


5 diapositivas
IT Technology Revolution Infographics
Navigate the digital wave with our IT technology revolution infographics. Crafted in a sleek blue and white palette, this template is a nod to the informational era's sophistication. It's an essential tool for IT professionals, educators, tech enthusiasts, or students stepping into the world of informational technology. Compatible with Powerpoint, Keynote, and Google Slides. With a design that speaks innovation, it features cutting-edge graphics, icons, and image placeholders, tailored to dissect complex tech jargons into digestible visuals. Engage your audience with data and trends that encapsulate the IT landscape's ever-evolving nature.


7 diapositivas
Business Model Canvas Infographic Presentation Template
The Business Model Canvas is a tool for articulating a strategy in the form of a business model for a start-up or existing enterprise. This template provides a visual overview for entrepreneurs and innovators to write about the critical components of their business, from different perspectives. With this template presenting information in graphical format, the Canvas aids communication between business people with different backgrounds and skill sets, helping to align ideas. We created a simple and effective presentation that will help you to grasp the concepts of this tool in a few minutes!


5 diapositivas
Creative Bubble Map Infographic Presentation
Bring your ideas to life with dynamic visuals that make connections clear and storytelling effortless. This modern infographic presentation is perfect for showcasing relationships, categories, or data insights in a bold and engaging way. Fully editable and compatible with PowerPoint, Keynote, and Google Slides for seamless customization.


8 diapositivas
Business Value Proposition
Clearly communicate your brand’s core value with this quadrant-style slide, ideal for pitching key benefits, market differentiators, or service pillars. Designed for product managers, marketers, and business consultants. Fully editable in PowerPoint, Keynote, and Google Slides—customize icons, titles, and layout with ease.


7 diapositivas
Problem Infographic
These slides focus on presenting problem statements and their contexts in a professional and accessible format. The use of a soft, consistent color palette helps to keep the presentation visually appealing while ensuring that the content remains the focal point. Each slide is designed with ample space for text and icons, which aids in breaking down complex issues into understandable segments. The variety of layouts ensures that you can tailor the presentation to the nature of the problem being addressed, whether it requires more textual explanations or benefits from the use of infographics and icons. These templates are well-suited for business meetings, academic presentations, or any scenario where clear communication of challenges is necessary. They can be effectively used to initiate discussions, brainstorm solutions, or simply to highlight issues that need attention in a structured and organized manner.


23 diapositivas
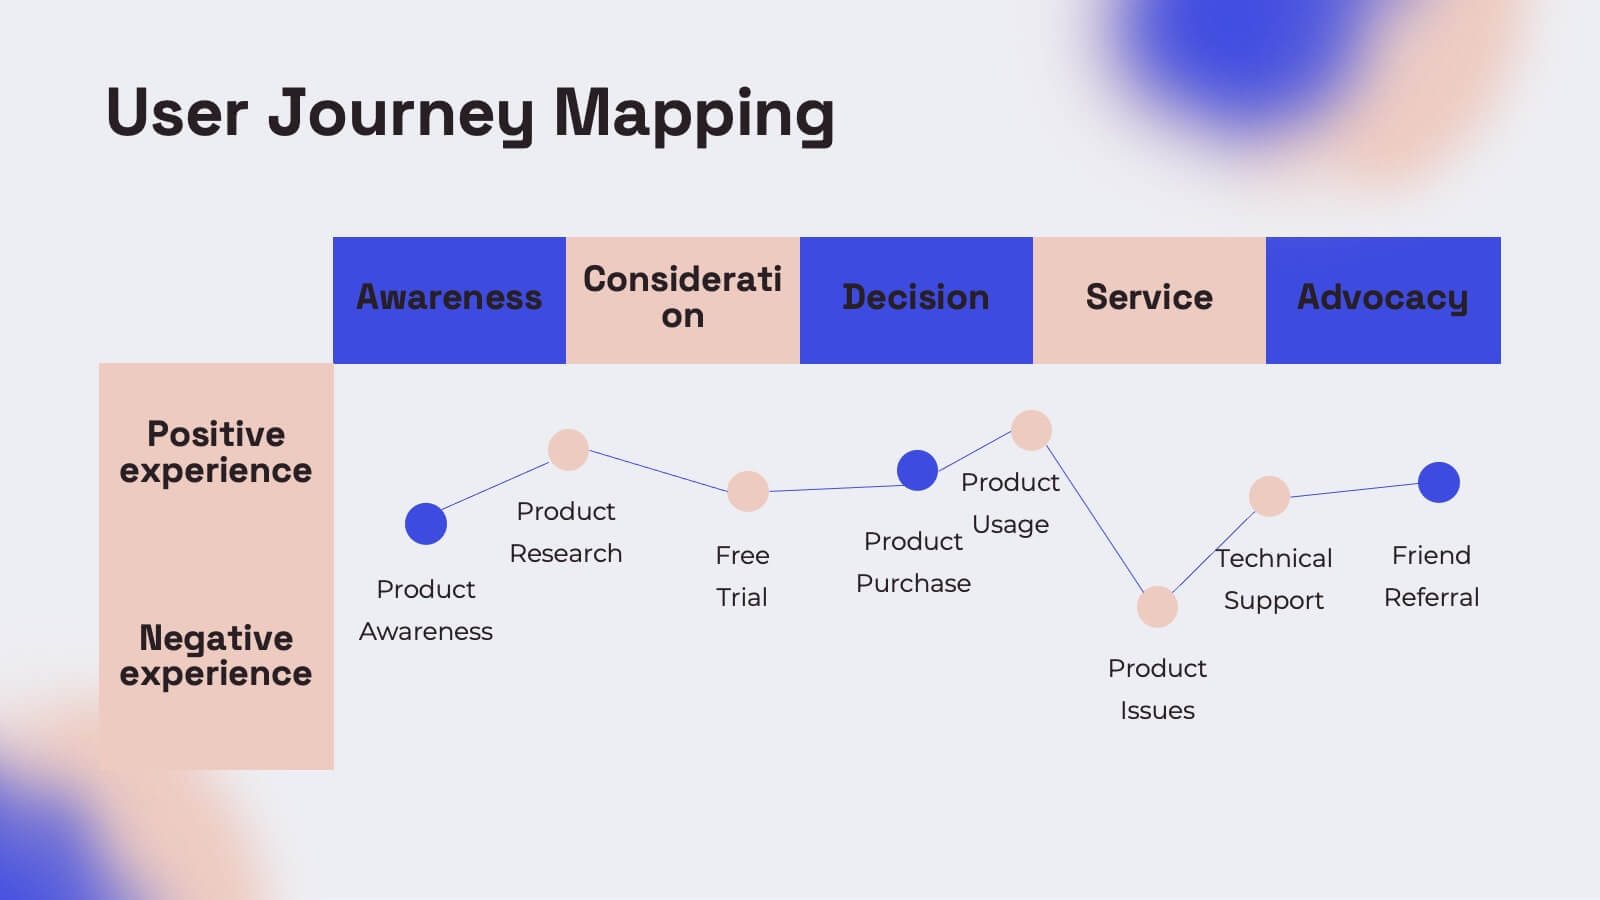
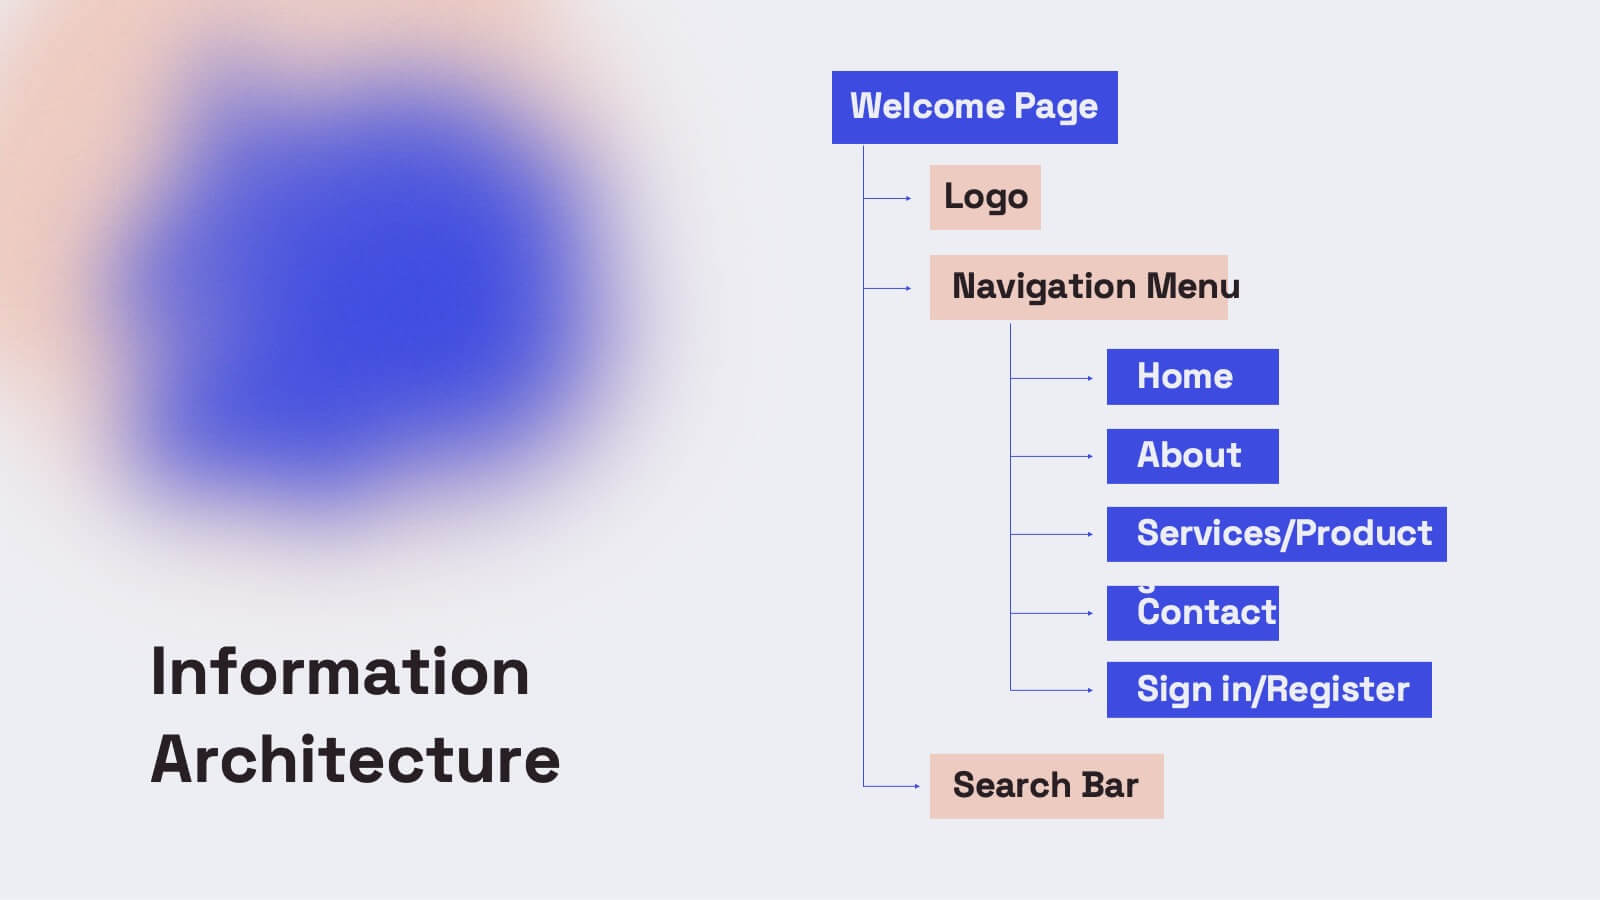
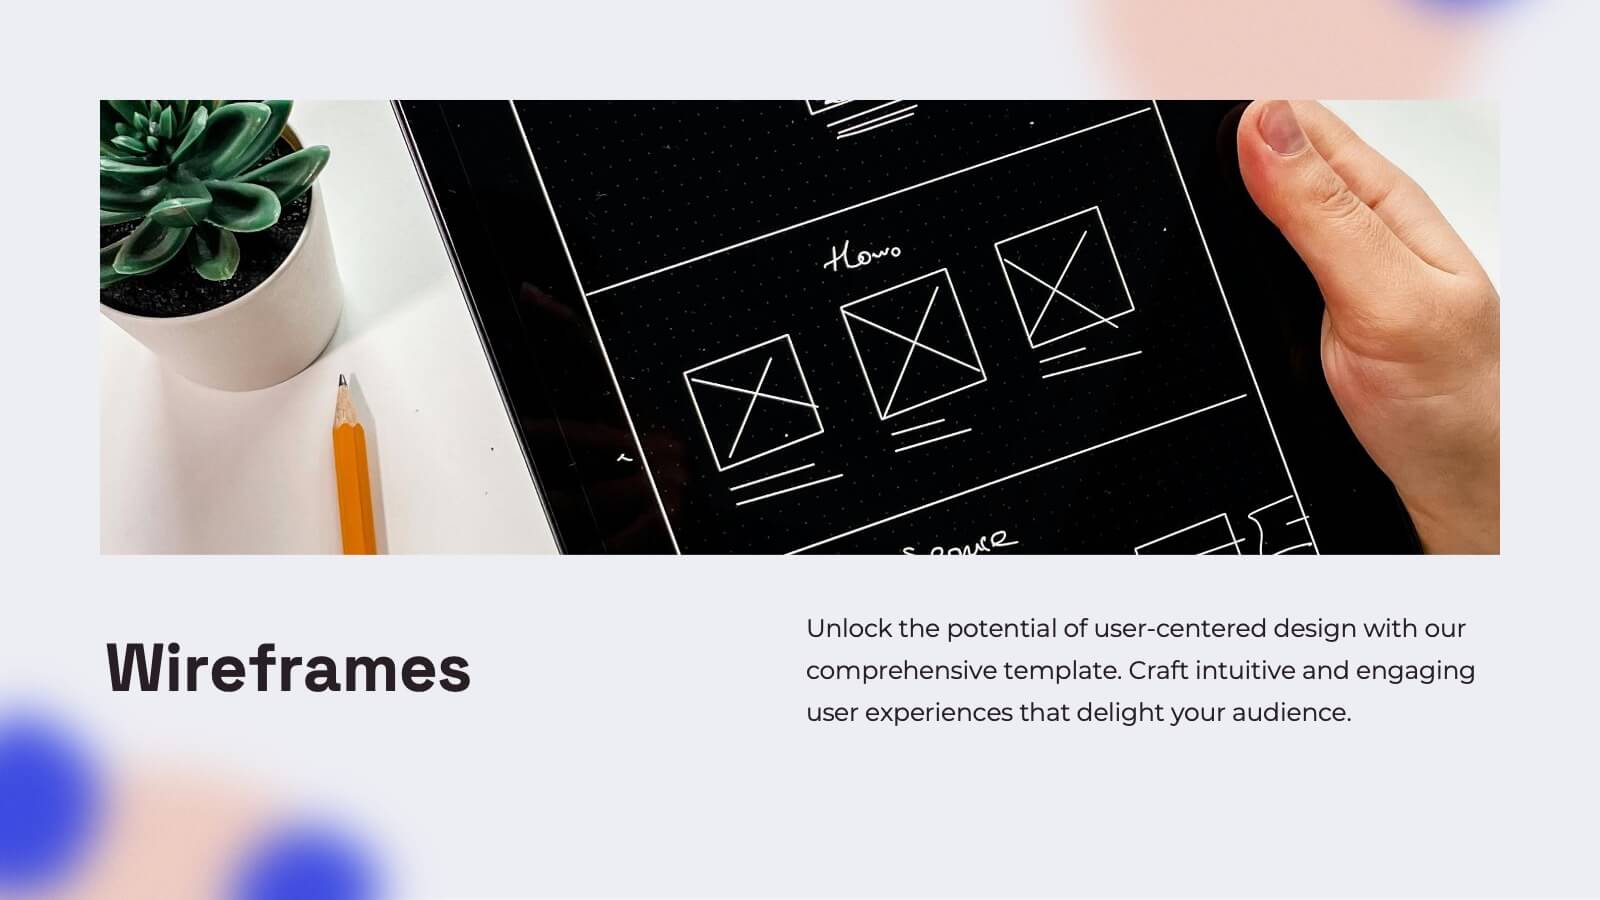
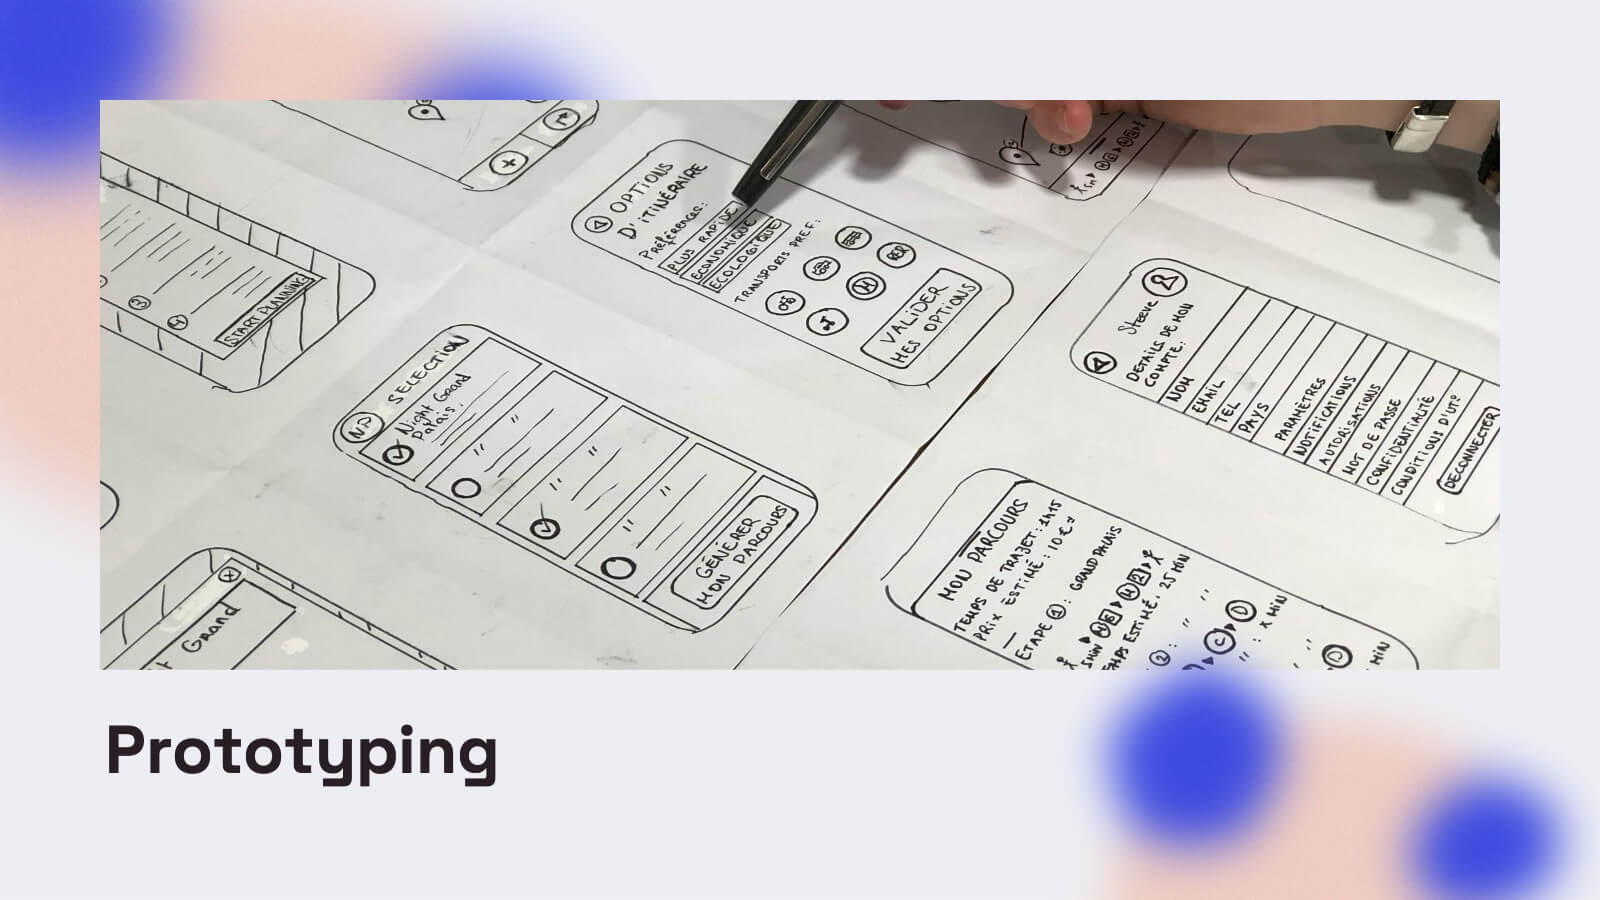
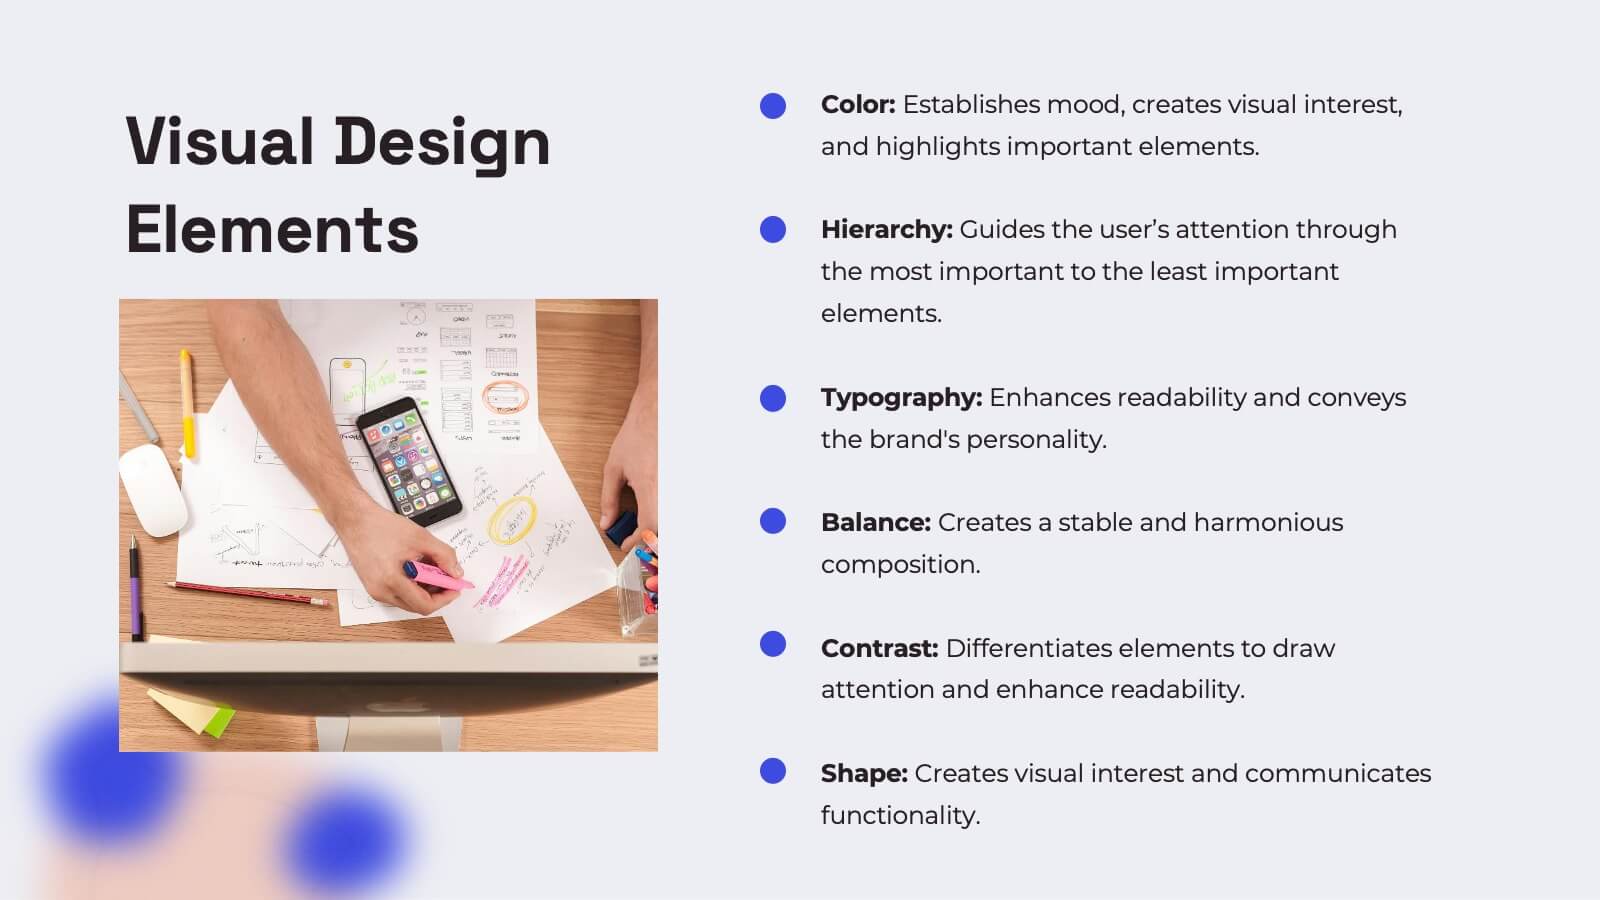
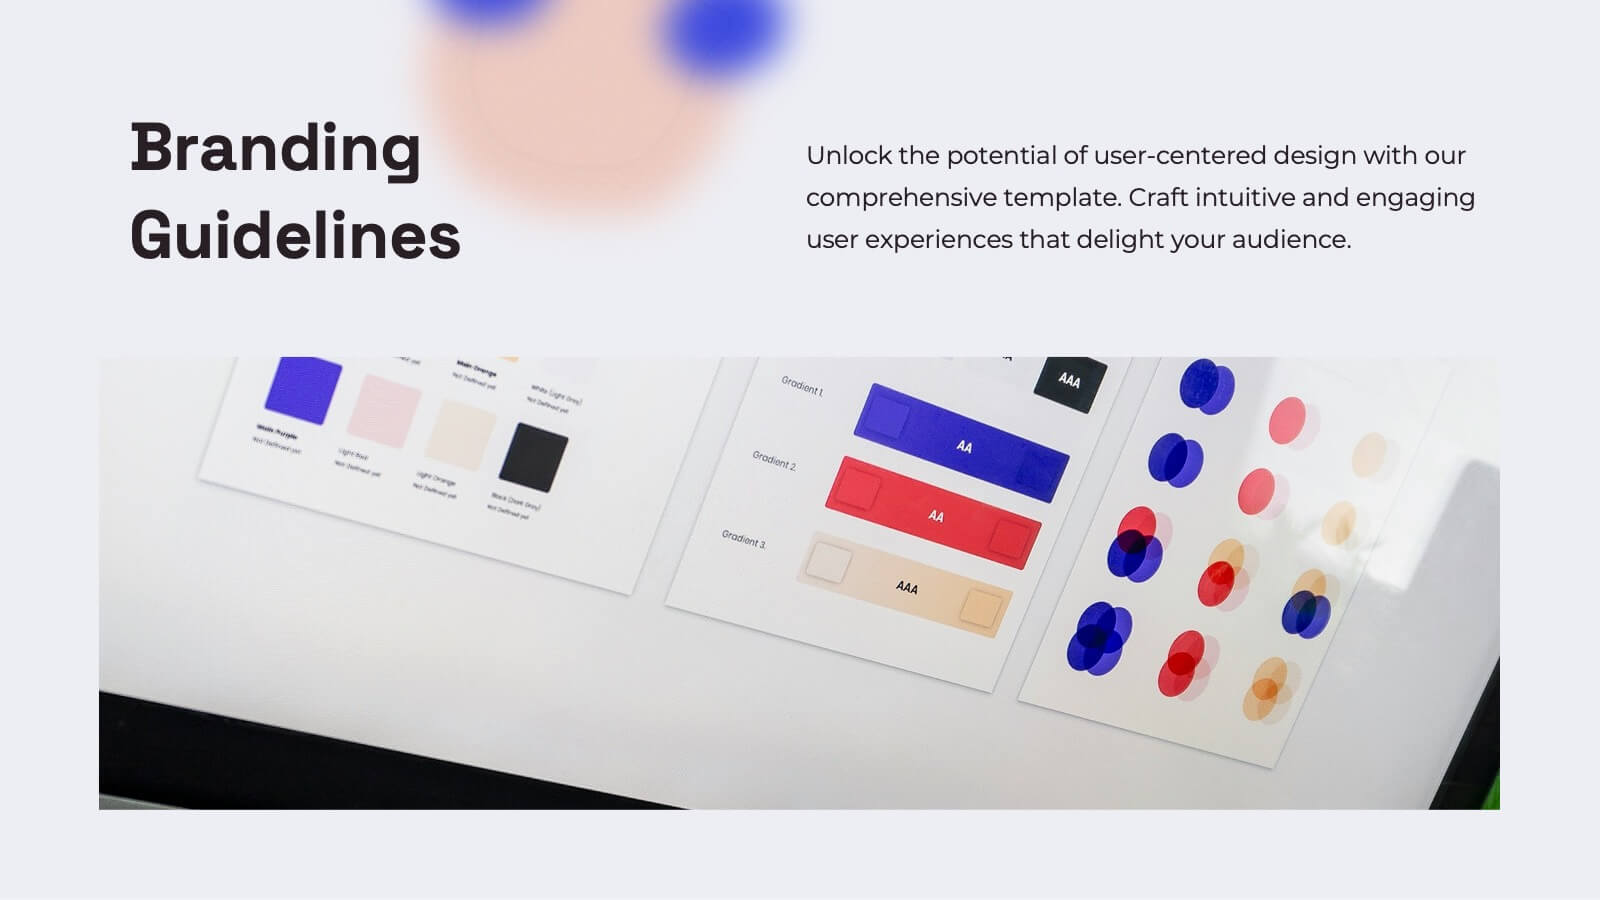
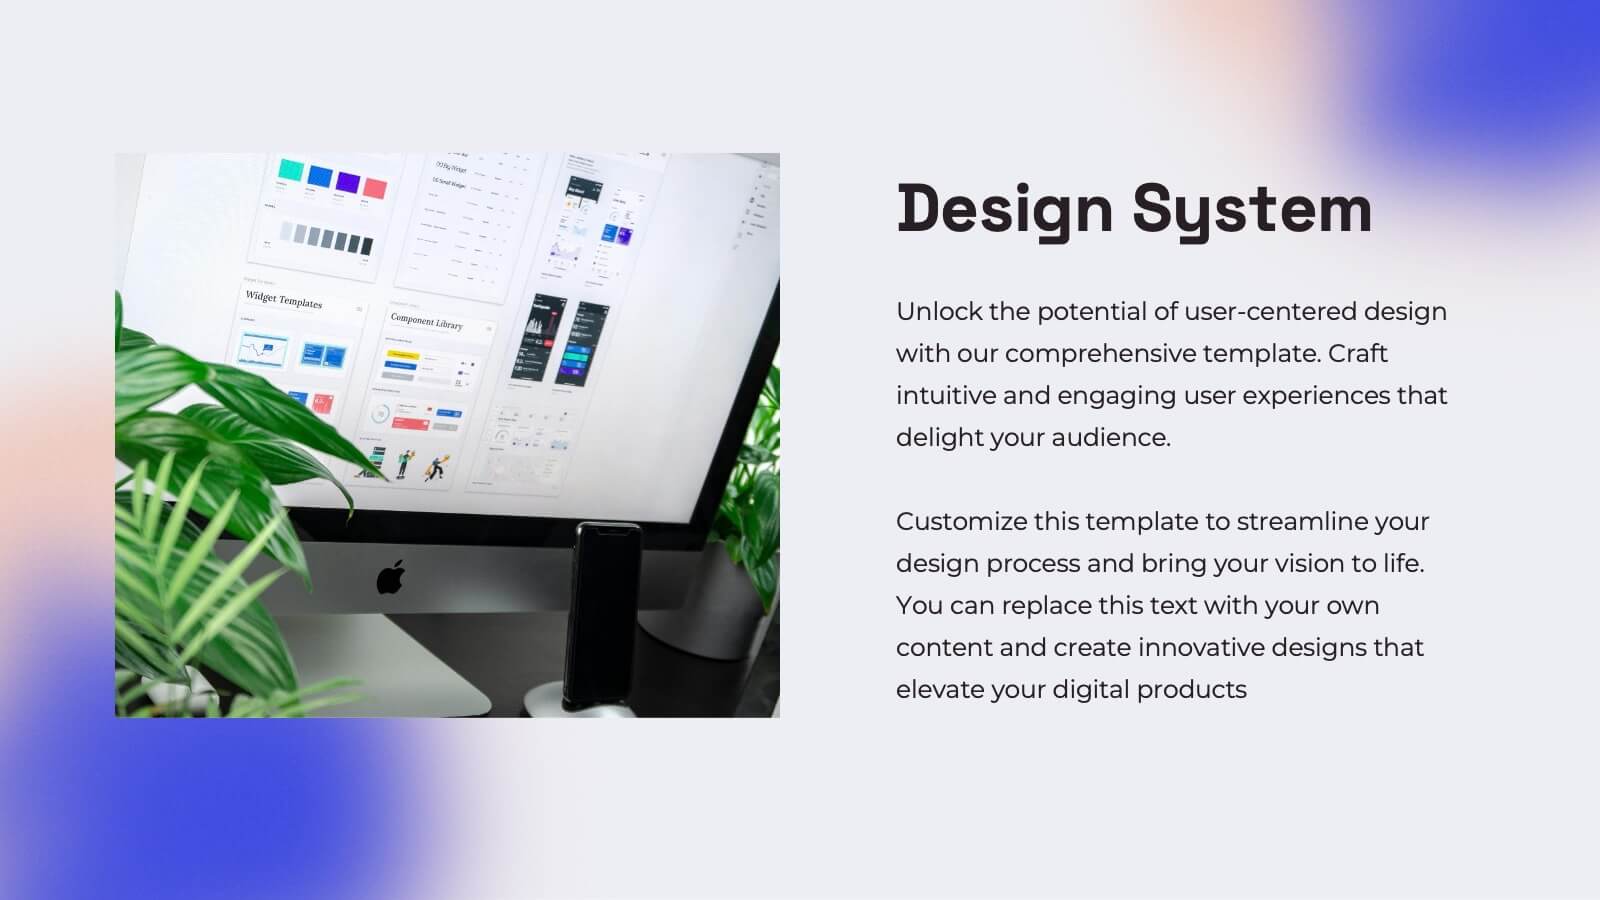
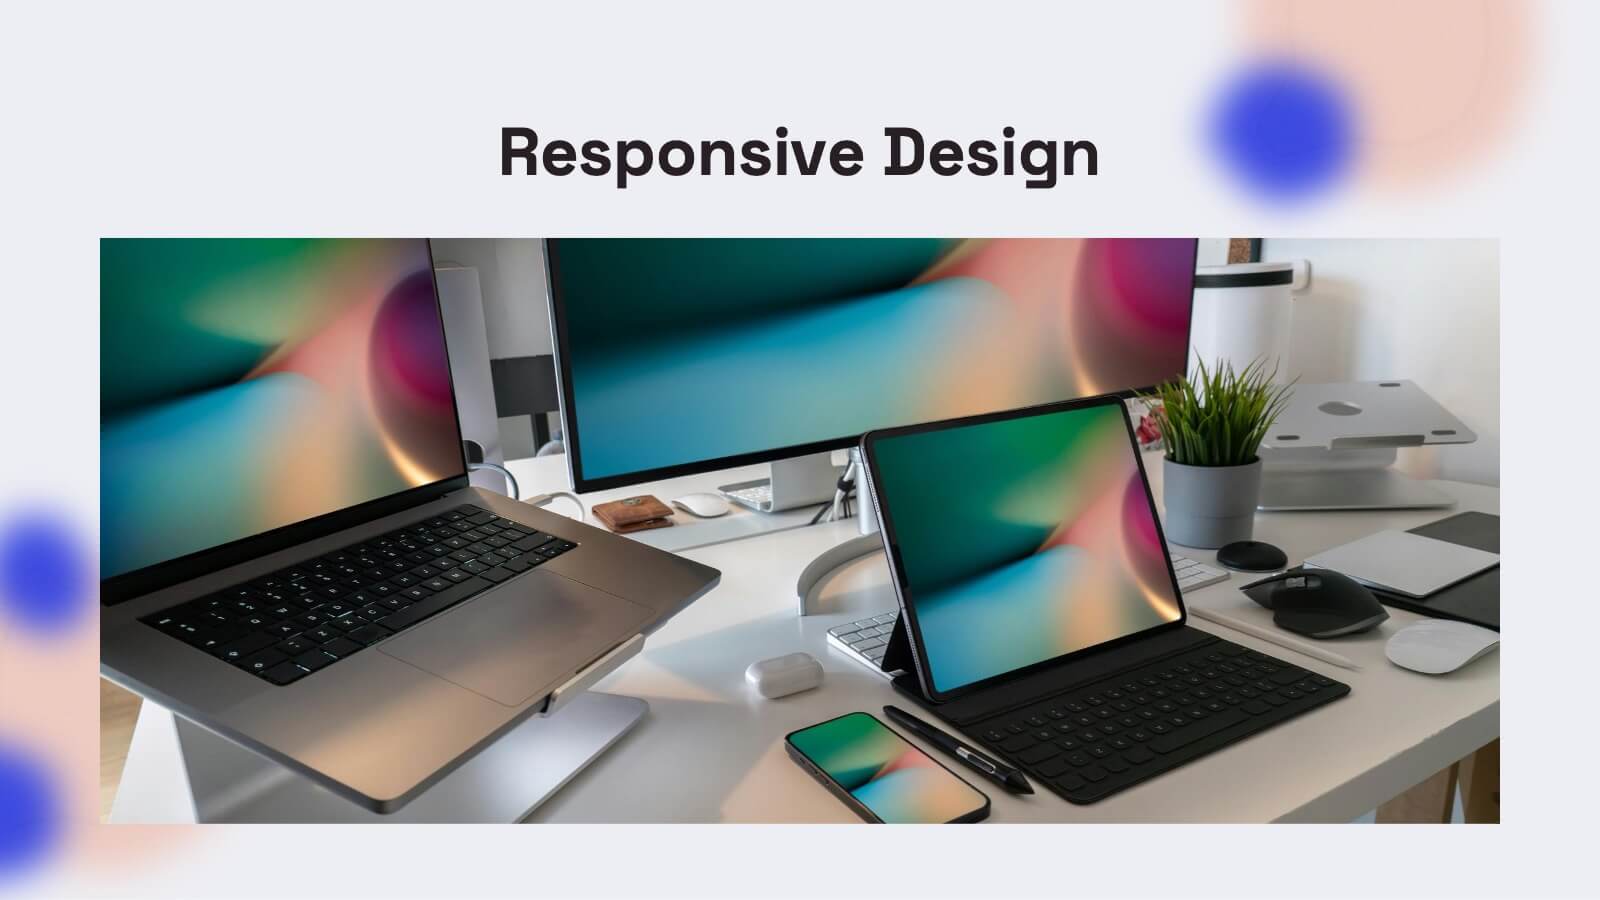
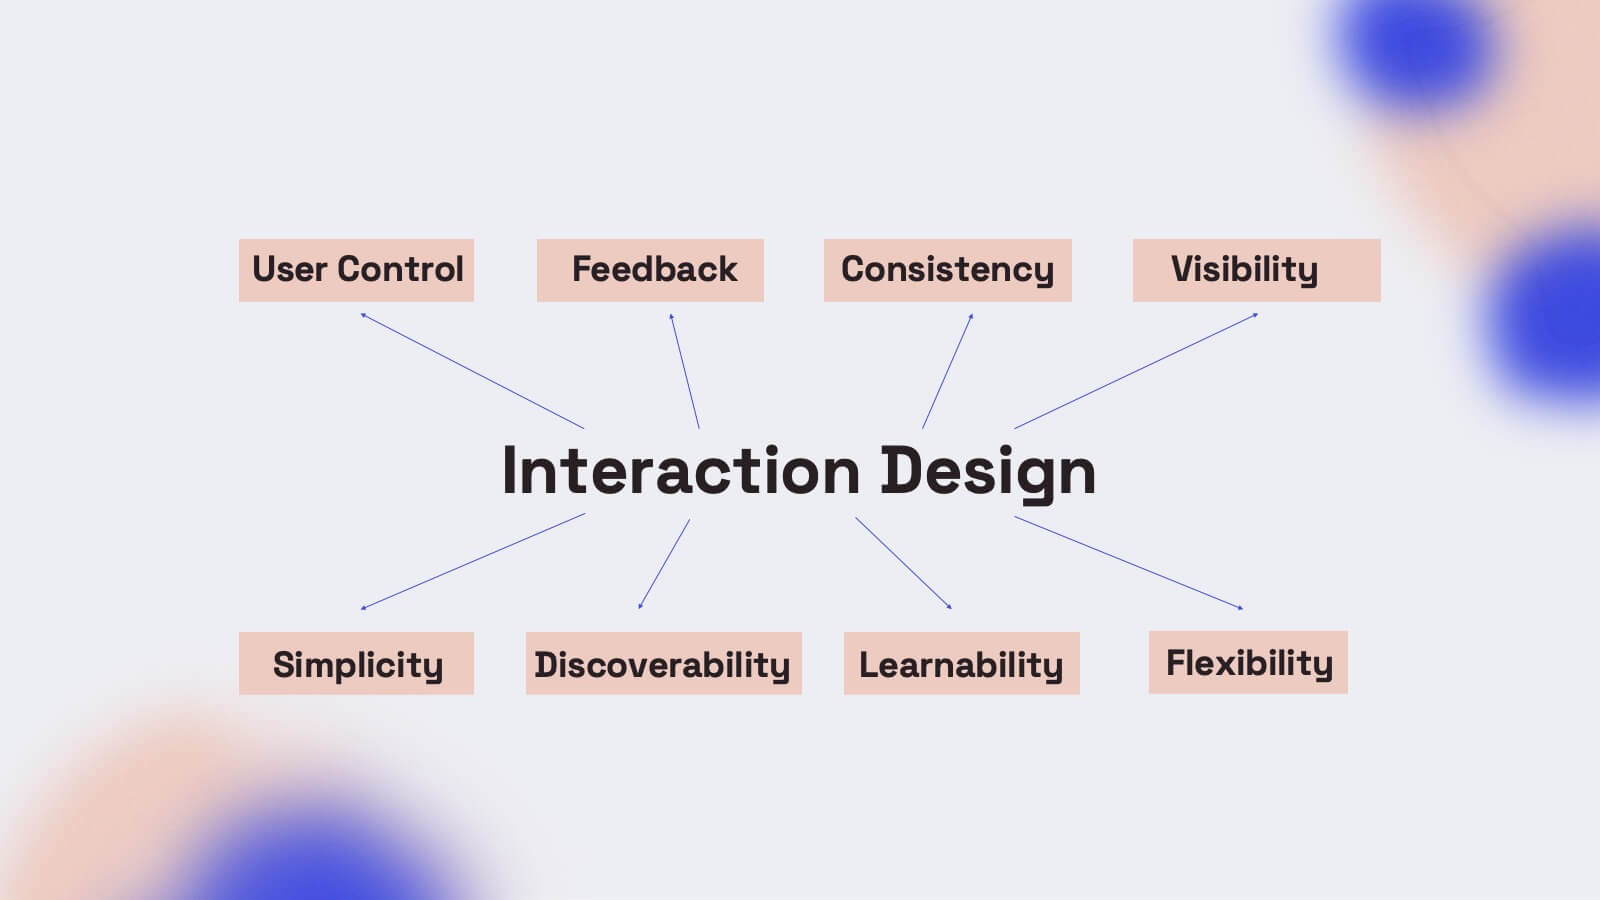
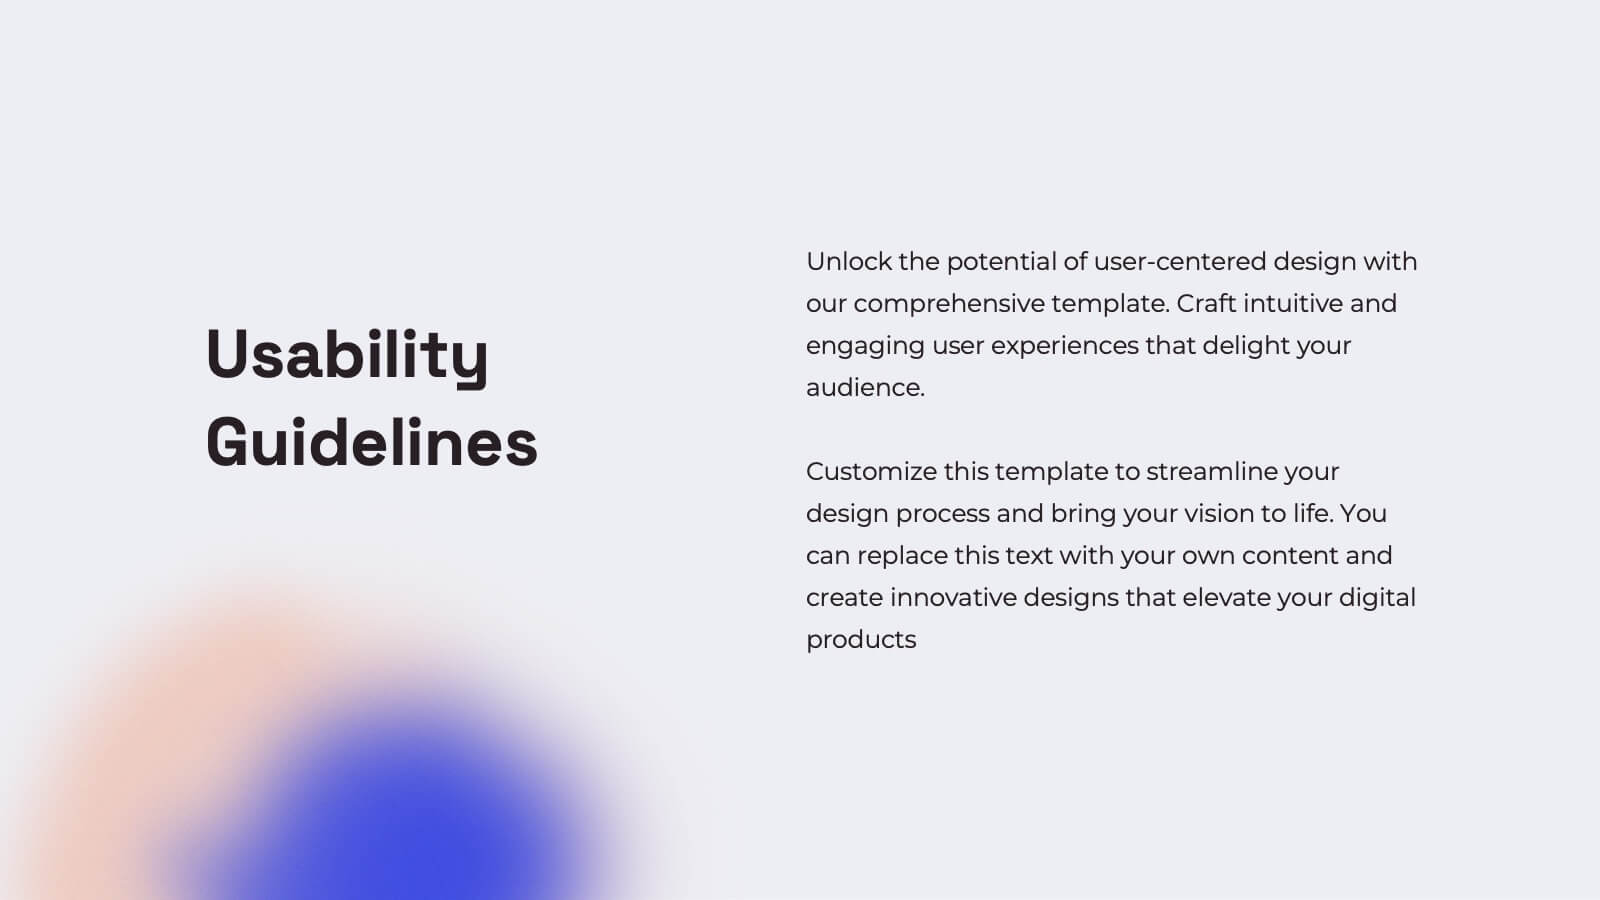
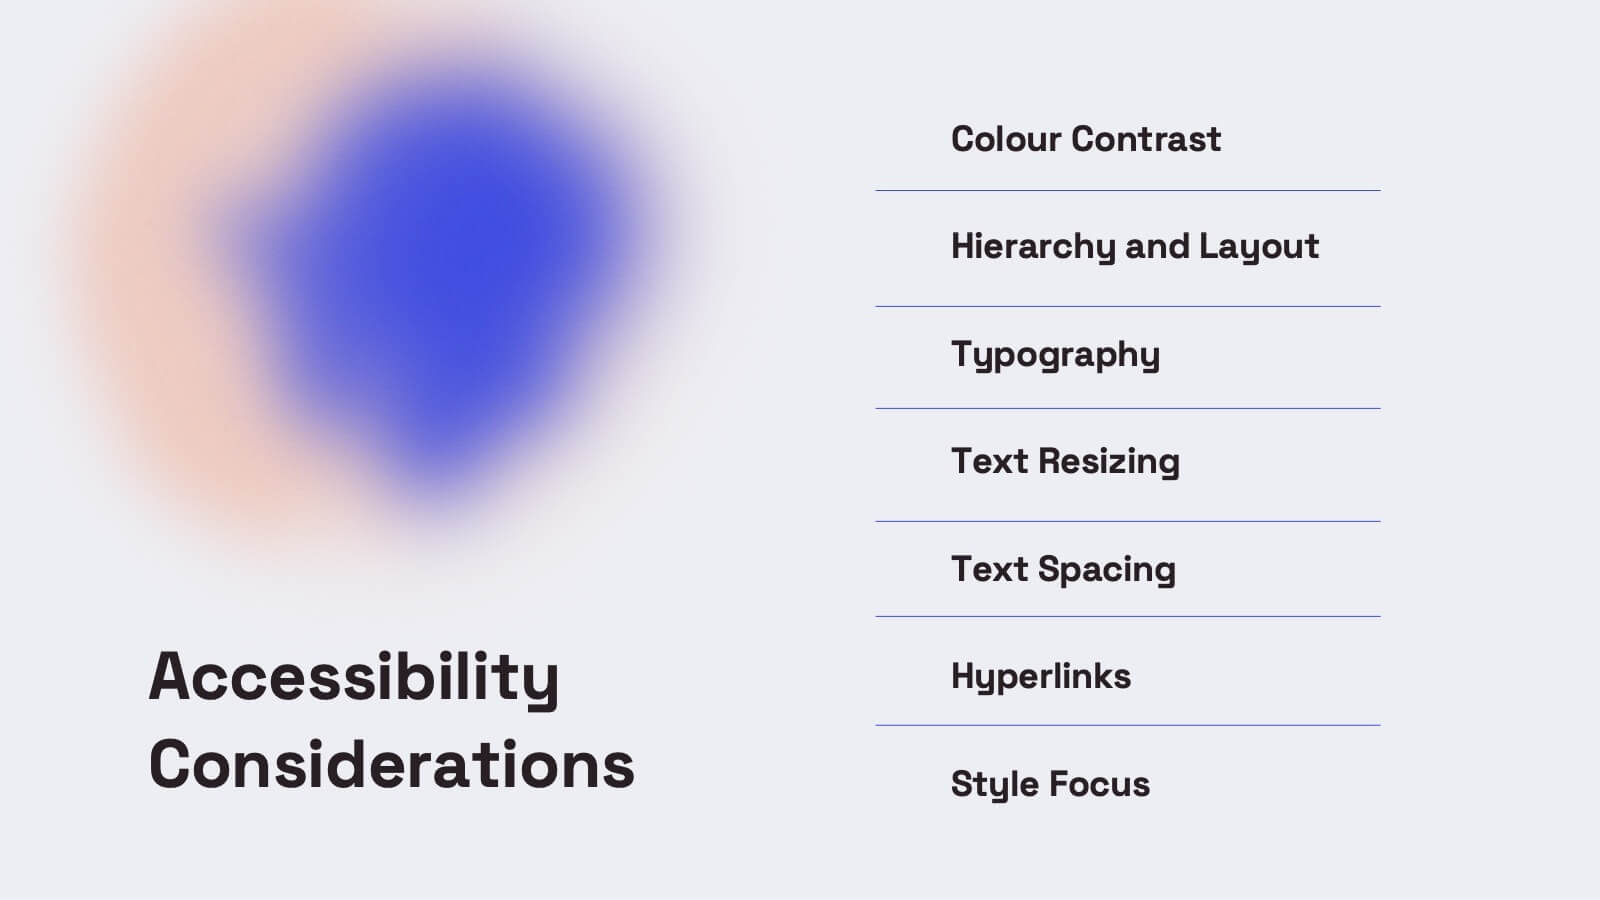
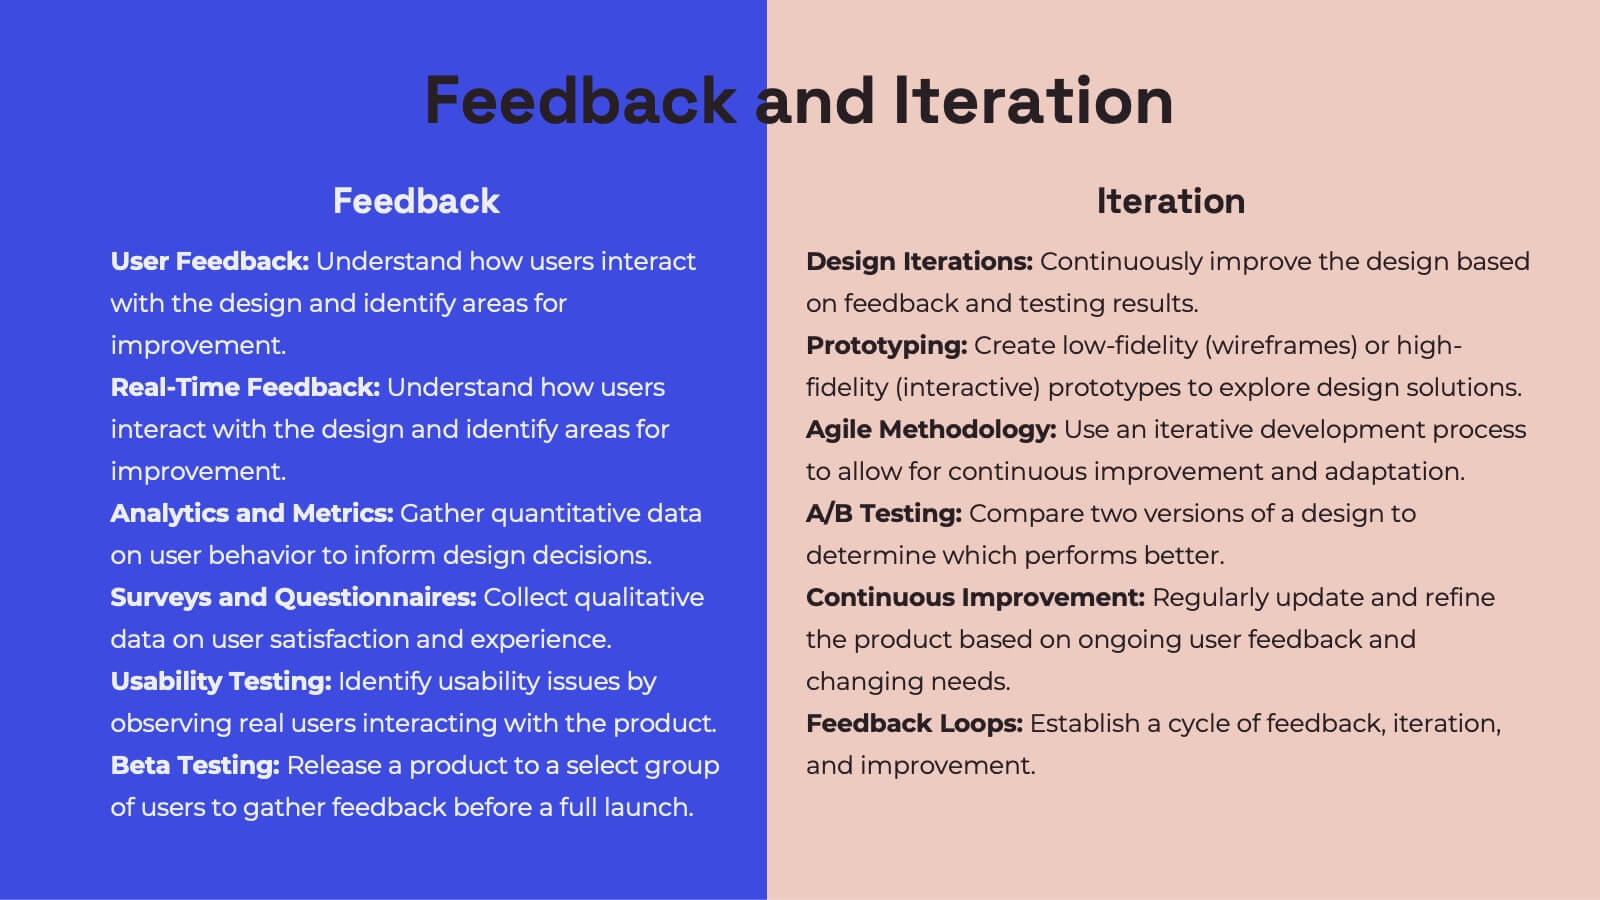
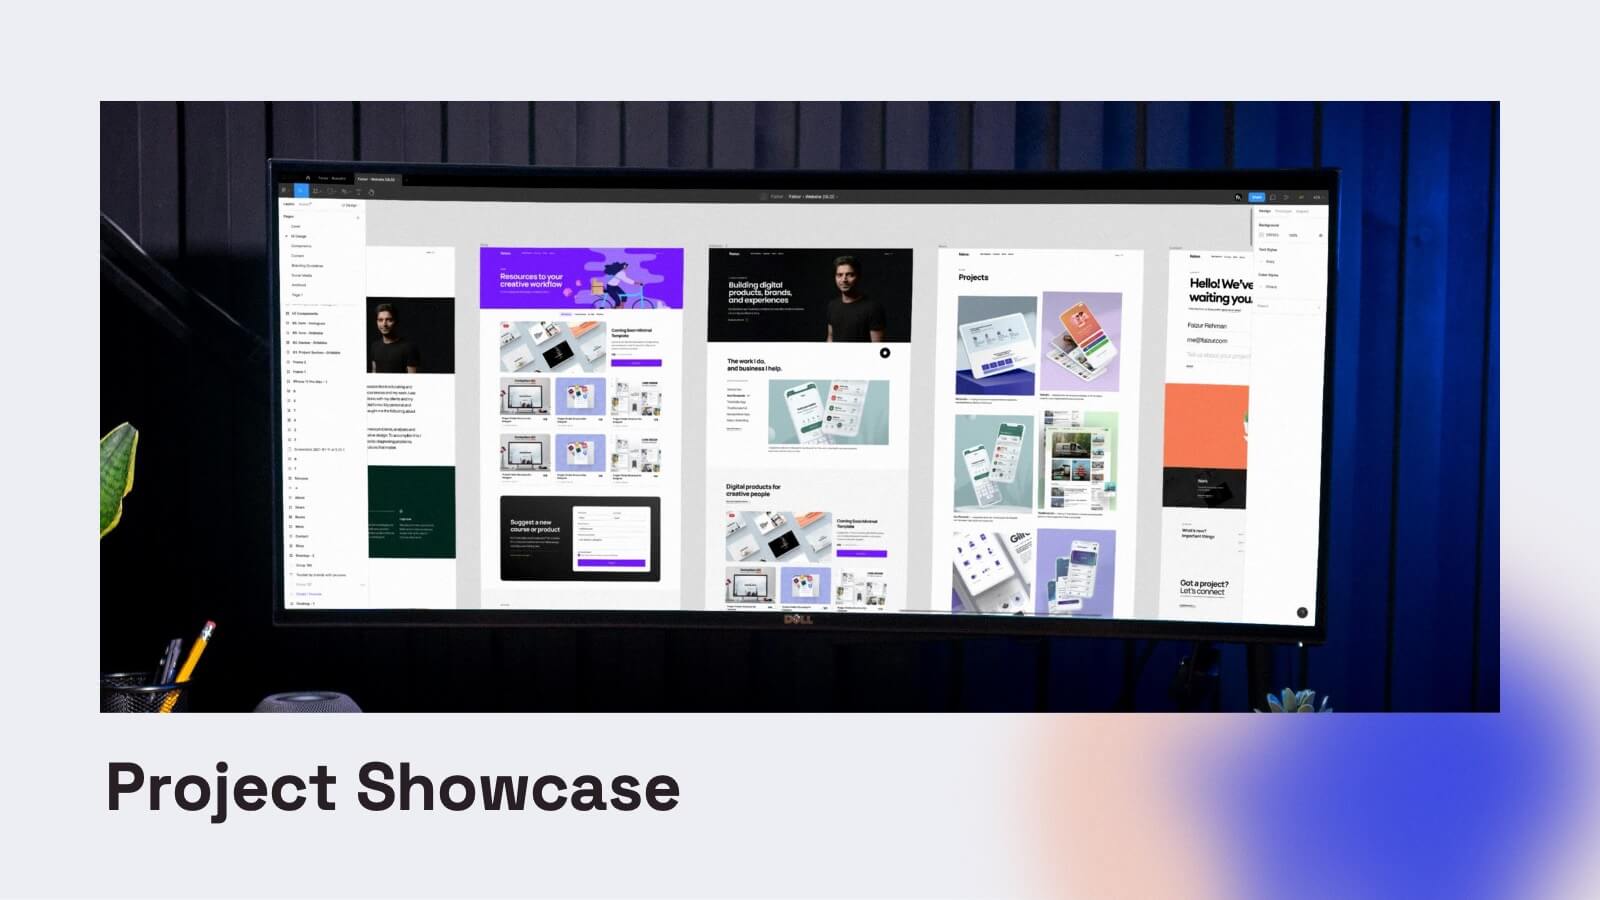
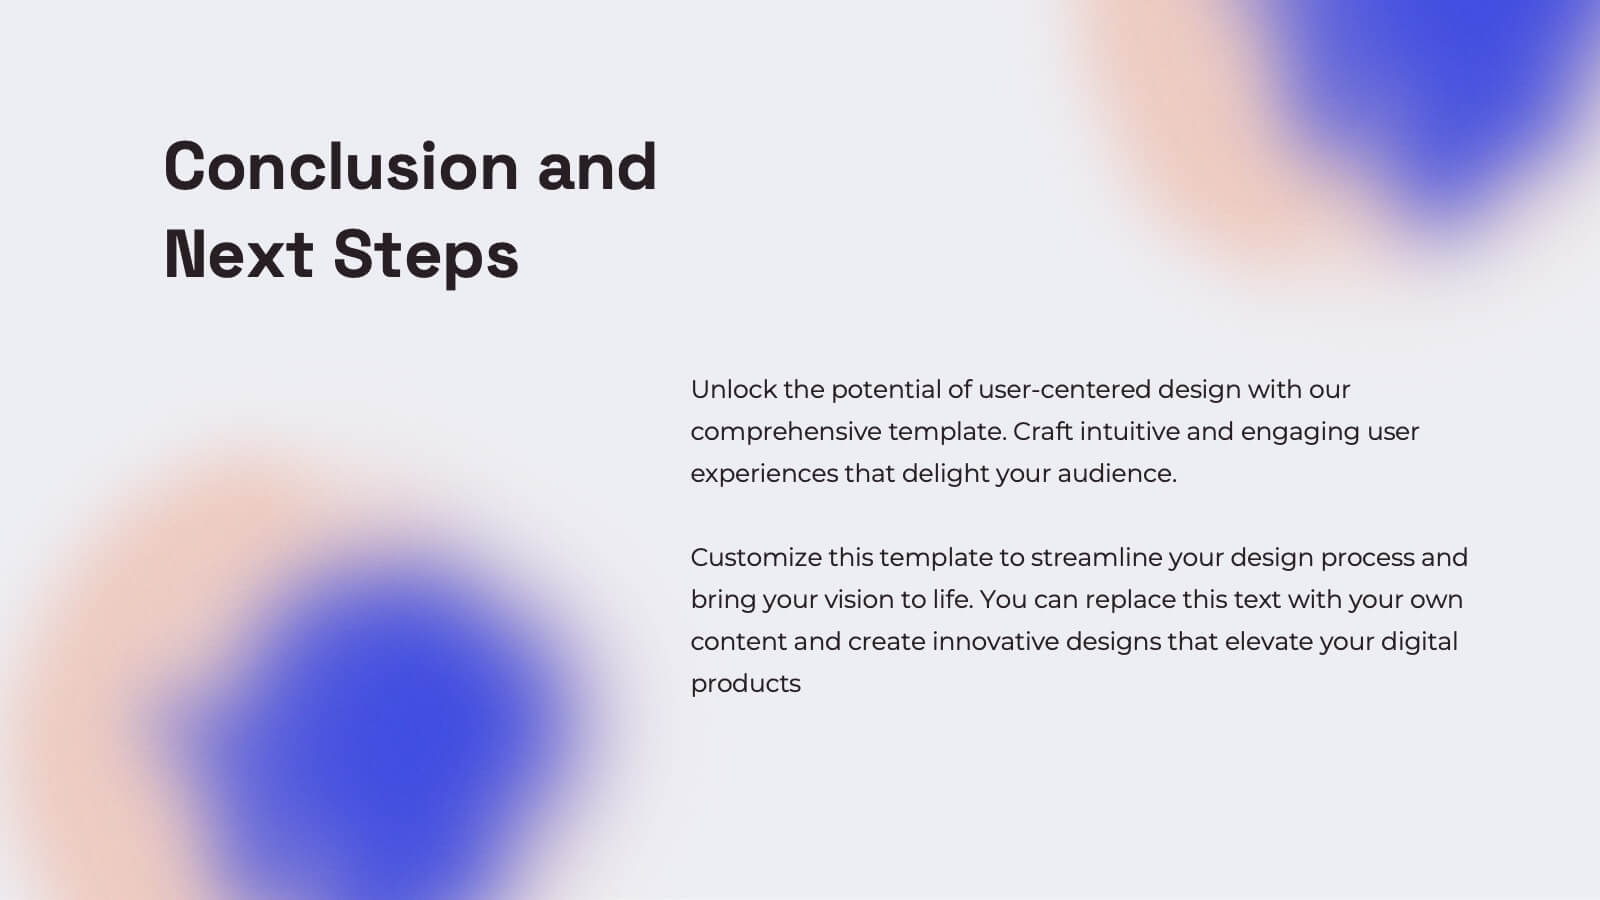
Gemini UX Design Presentation
Enhance your UX presentations with this vibrant and user-friendly template. Designed to cover every aspect of UX design, from user research and personas to wireframes and prototyping, this template ensures a comprehensive and engaging delivery. Its modern design and structured layout make your insights clear and impactful. Compatible with PowerPoint, Keynote, and Google Slides, it's perfect for any platform.


7 diapositivas
Mind Map Program Infographic Presentation
Mind Maps are appealing visuals that are easy to follow. Use our high quality template to create a mind map infographic that explains your concepts, or use it to highlight the benefits of your product in an educational way. Map out your ideas and create a visual that can be explored from many different directions. This template is suitable for both business and educational applications, so you can use it at work, school or as part of your portfolio. It’s easy to customize and compatible with PowerPoint, Keynote and Google Slides. Easily create a dynamic and engaging project in just minutes!


5 diapositivas
Financial Capital Allocation Model Presentation
Visualize how funds are distributed with this clean, piggy-bank-themed capital allocation slide. Featuring four customizable icons and text areas, it’s perfect for showcasing investment priorities or budgeting strategies. Ideal for finance teams, startups, and pitch decks. Fully editable in PowerPoint, Google Slides, and Keynote for a polished presentation.


4 diapositivas
Cybersecurity Risk Protection Plan Presentation
Secure your message with a fingerprint-inspired layout that stands out. This Cybersecurity Risk Protection Plan template breaks down risk mitigation strategies into four clear points—ideal for tech, IT, and compliance presentations. Showcase protocols and data protection methods effectively. Works seamlessly with PowerPoint, Keynote, and Google Slides.


6 diapositivas
Machine Learning Systems Overview
Get ready to light up your next tech talk with a bold, clean layout that simplifies even the most complex systems. This infographic presentation template is designed to break down how intelligent algorithms function, analyze data, and learn patterns—perfect for explaining how machine learning fits into real-world applications. Each slide uses smart visuals and icons to guide viewers through each system stage with clarity. Ideal for educators, developers, or startups pitching AI-powered solutions, it’s a creative and professional way to keep your audience engaged. Fully compatible with PowerPoint, Keynote, and Google Slides.


6 diapositivas
Search Engine Optimization Campaign Overview Presentation
Kick off your digital strategy with a clean, modern layout that makes every key insight feel connected and actionable. This presentation helps you explain campaign goals, highlight SEO priorities, and break down essential tasks in a structured, visual flow. Fully compatible with PowerPoint, Keynote, and Google Slides.