


Características


¿Tienes alguna pregunta?
Recomendar


7 diapositivas
North America Population Infographic Presentation
North America is a continent located in the northern hemisphere of the Earth, bordered by the Pacific Ocean to the west. It includes countries such as the United States, Canada, Mexico, and several others in the Caribbean and Central America. This template can be a powerful tool to communicate information about the continent in an informative and engaging way. This can help people understand and appreciate the diversity and complexity of North America, and can be used for a variety of purposes, from education to marketing. This template is compatible with Powerpoint, Keynote and Google Slides.


5 diapositivas
Progress and Performance Yearly Review Presentation
Highlight key milestones along your business journey with this winding roadmap-style slide. Designed for annual reviews, it features five flag markers for progress tracking, goals, or achievements. Ideal for reports or team updates. Fully customizable in PowerPoint, Keynote, and Google Slides for seamless adaptation to your yearly metrics.


4 diapositivas
Human Resources Strategy and Talent Plan Presentation
Enhance workforce planning and recruitment efforts with the Human Resources Strategy and Talent Plan template. Featuring a circular infographic layout, this design is ideal for showcasing hiring stages, talent development, and HR strategies. Fully customizable in Canva, PowerPoint, and Google Slides to align with organizational goals and brand identity.


5 diapositivas
Target Audience Analysis Slide Presentation
Discover who your audience truly is with this clear and visually balanced layout designed to simplify audience insights. Perfect for marketing plans, presentations, and strategy reports, it helps you visualize key demographics and behaviors effortlessly. Fully customizable and compatible with PowerPoint, Keynote, and Google Slides for easy editing.


6 diapositivas
Ideal Customer Profile Infographic
A customer profile, also known as a buyer persona, is a detailed and semi-fictional representation of your ideal customer. This infographic template can help businesses visualize and communicate their target audience characteristics and preferences. This template is a valuable tool for educating your team and clients about your ideal customer profile. This customer profile infographic can help your team align their efforts towards effectively targeting and engaging the right audience for your products or services. Compatible with Powerpoint, Keynote, and Google Slides. Incorporate your brand's logo and color scheme to maintain consistency.


5 diapositivas
Closing Slide with Key Takeaways Presentation
Conclude your presentation with impact using the Closing Slide with Key Takeaways Presentation. This streamlined design features a bold visual flow to emphasize up to five main points, ensuring your audience walks away with clear, memorable insights. Ideal for summarizing findings, next steps, or action items. Fully customizable and works seamlessly with PowerPoint, Keynote, and Google Slides.


15 diapositivas
Business Journal Infographic
A Business Journal Infographic is a visual representation of data, information, or concepts related to business topics that typically follow the style and format often found in business journals or publications. This infographic is designed to present complex information quickly and clearly. The purpose of this is to convey information in a visually engaging and easily digestible format, making it easier for readers to grasp complex business concepts or data. With this template transform your business narrative into a captivating visual story that not only informs but inspires readers to delve into the world of entrepreneurship.


6 diapositivas
Strategic Planning with Hexagon Diagram Presentation
Visualize key components of your strategy with the Strategic Planning with Hexagon Diagram Presentation. Featuring a layered 3D hexagon structure, this template helps communicate processes, goals, or stages with clarity and depth. Fully customizable in PowerPoint, Keynote, or Google Slides—perfect for corporate planning, project managers, and consultants.


21 diapositivas
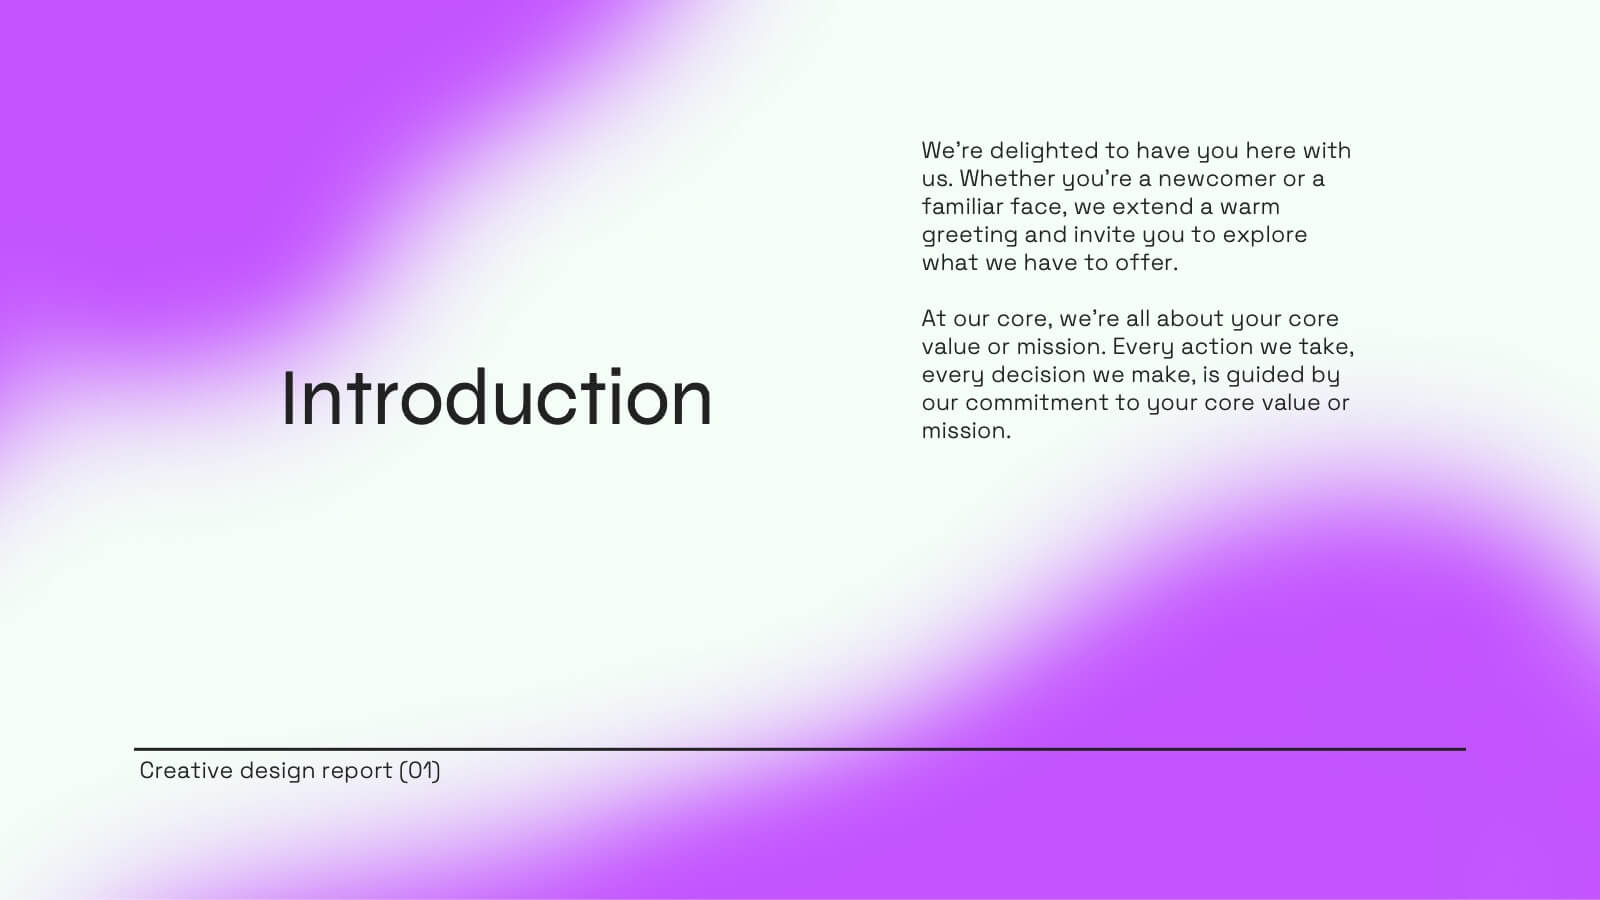
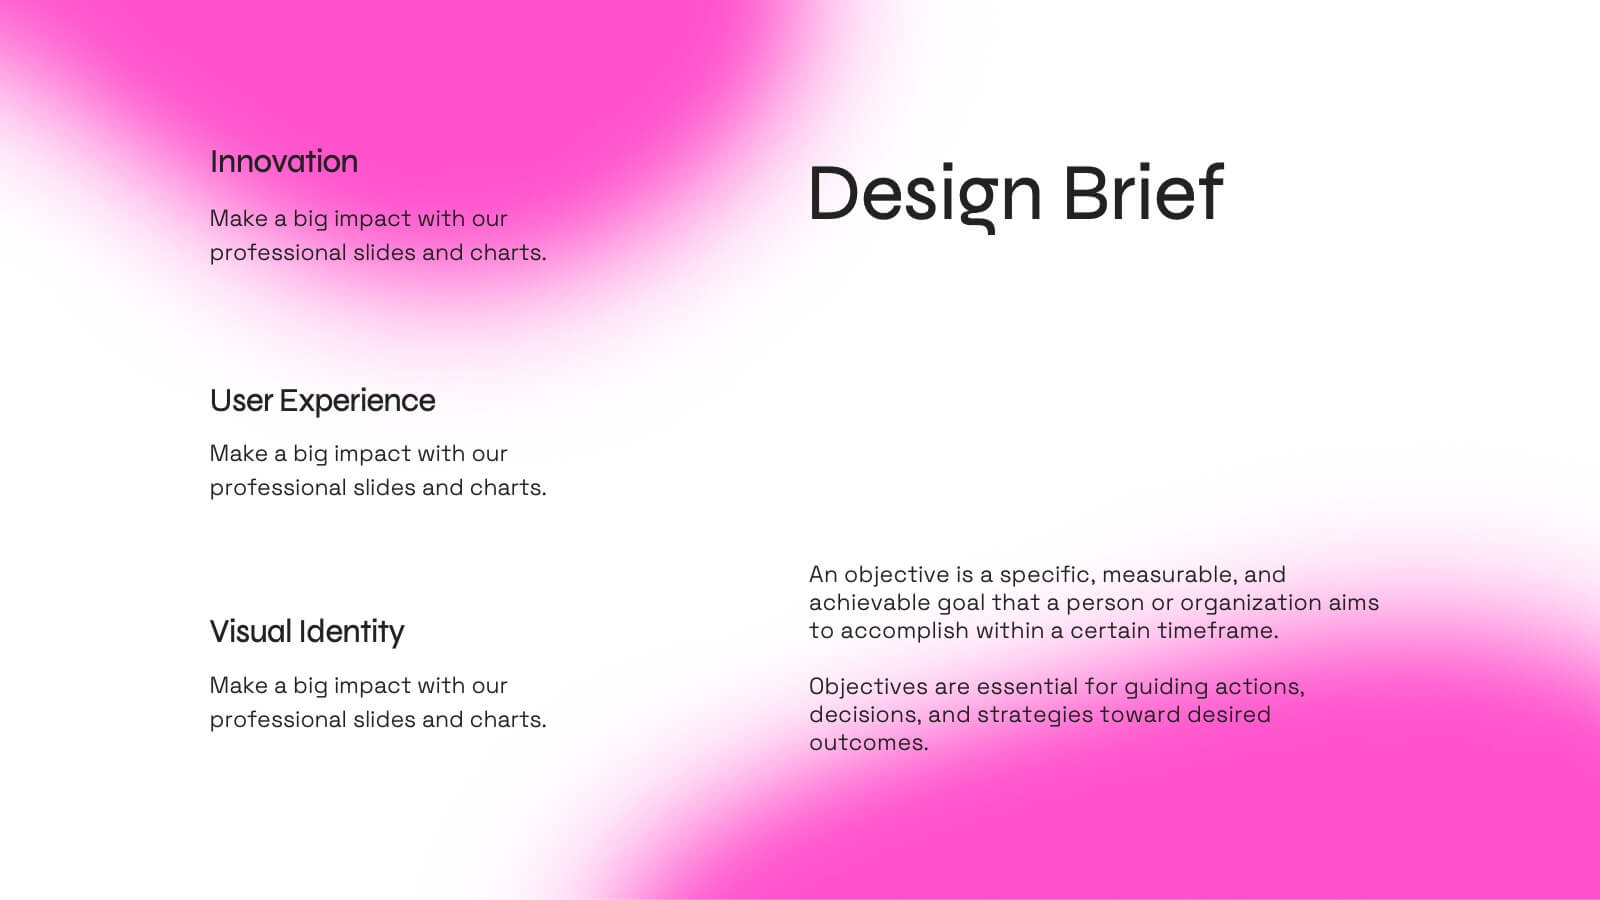
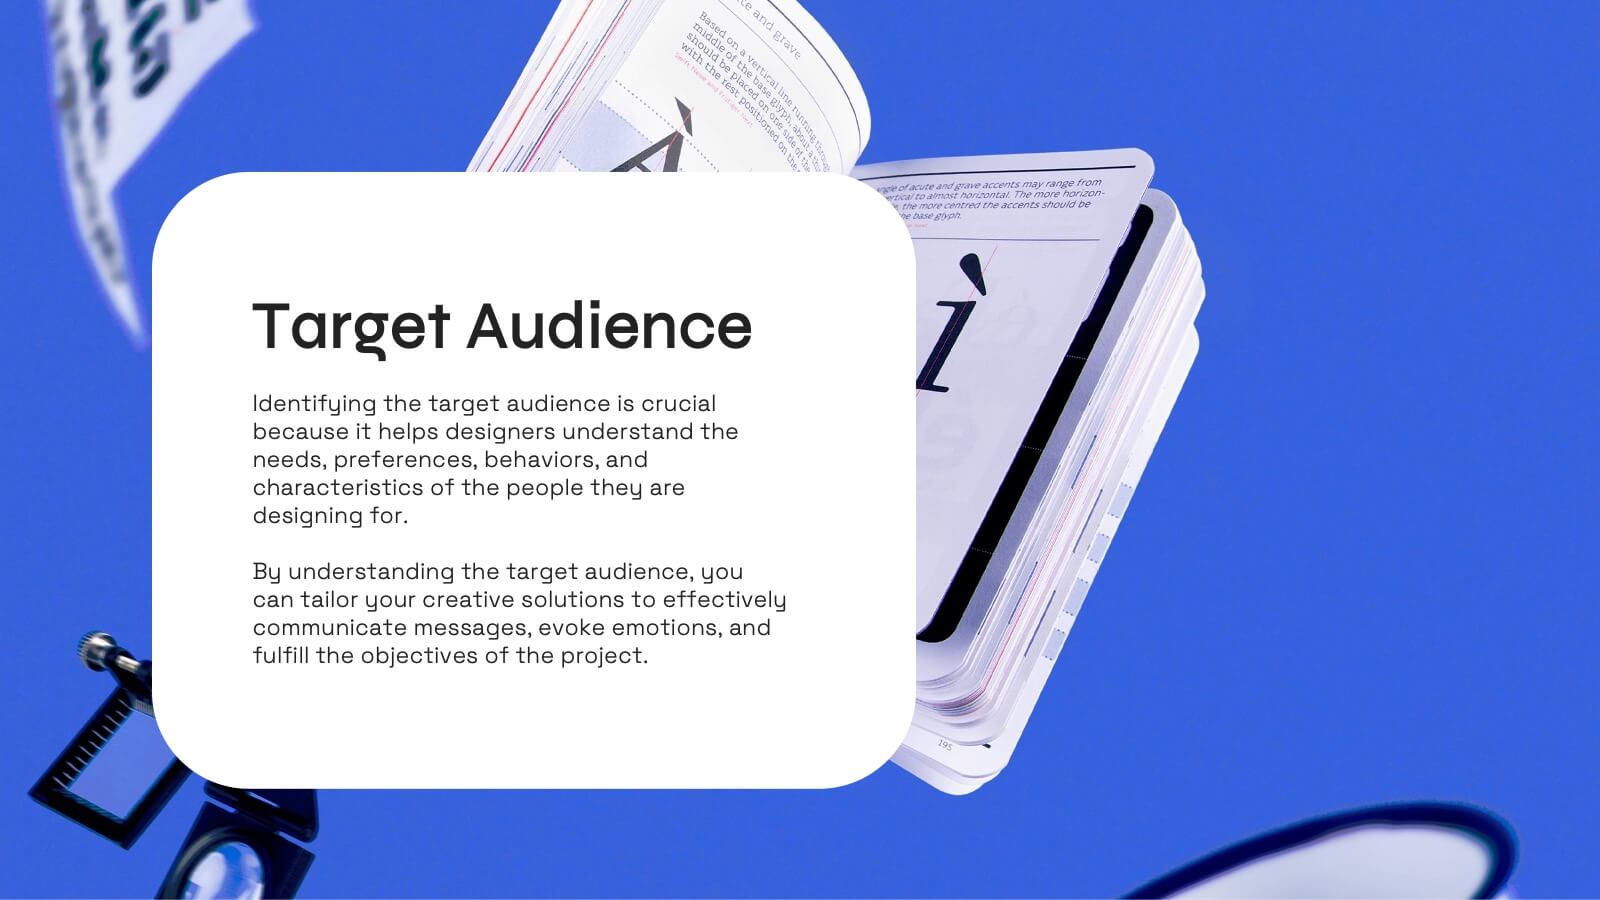
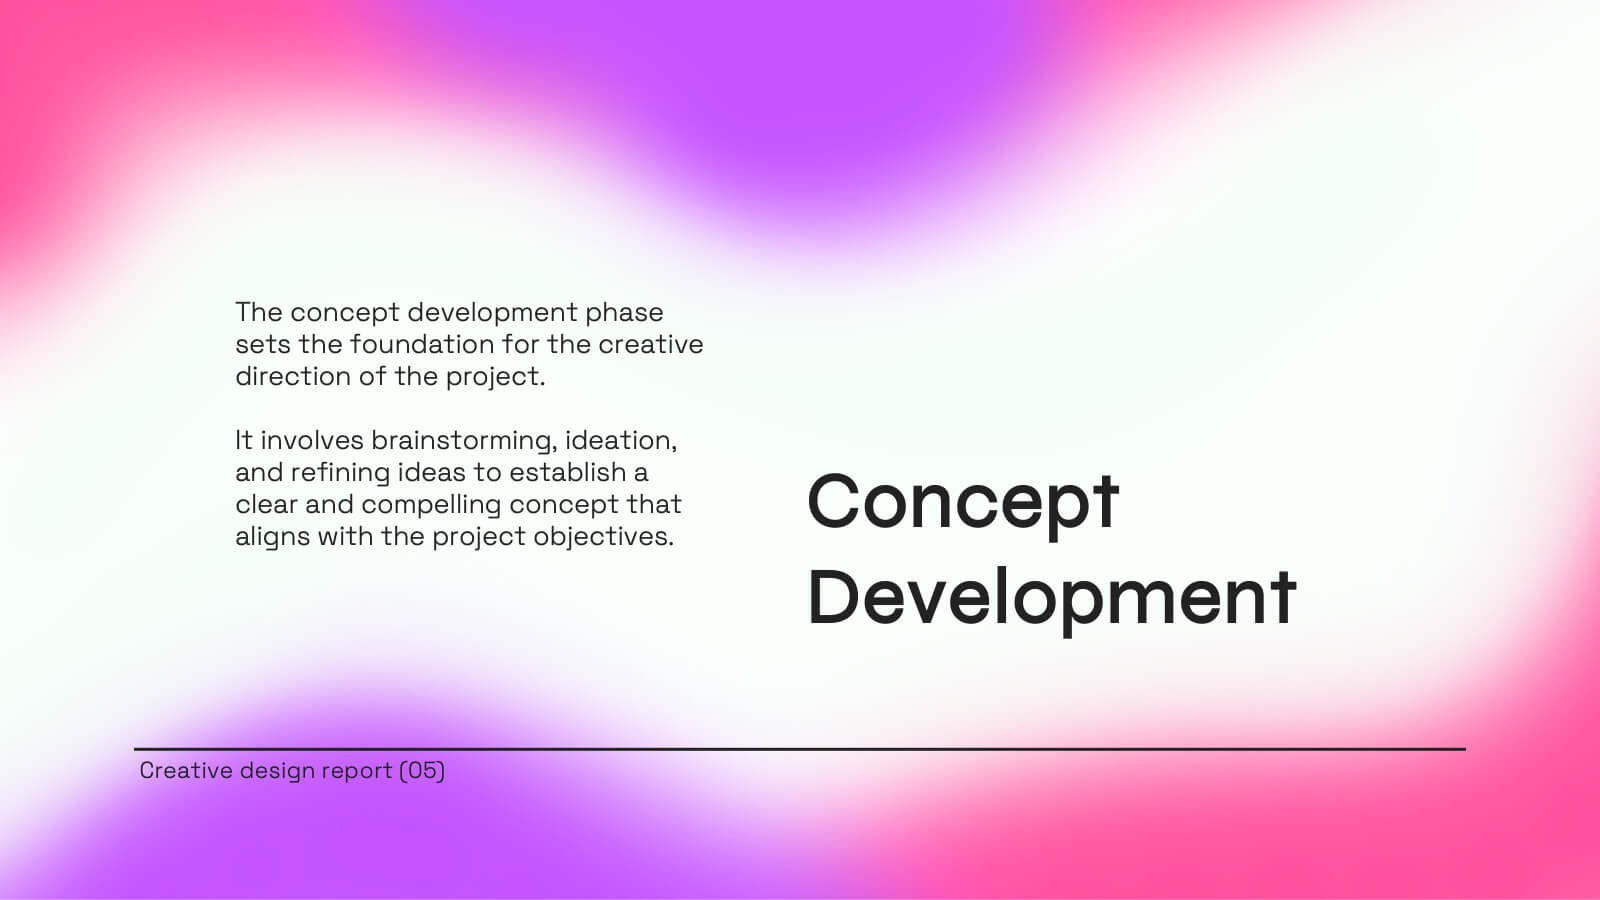
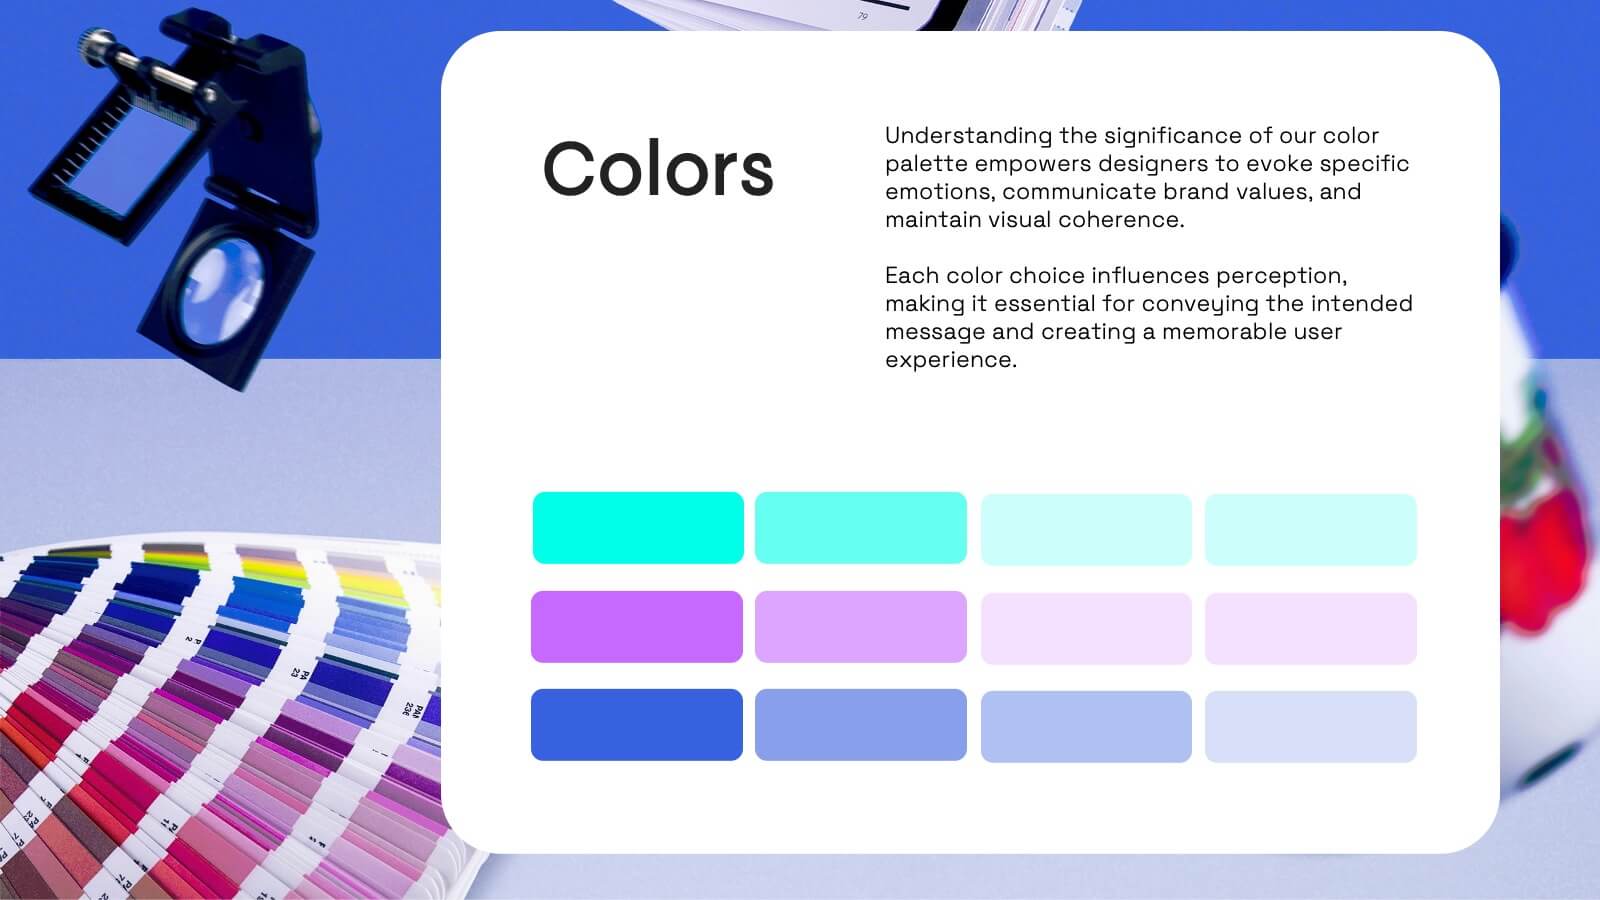
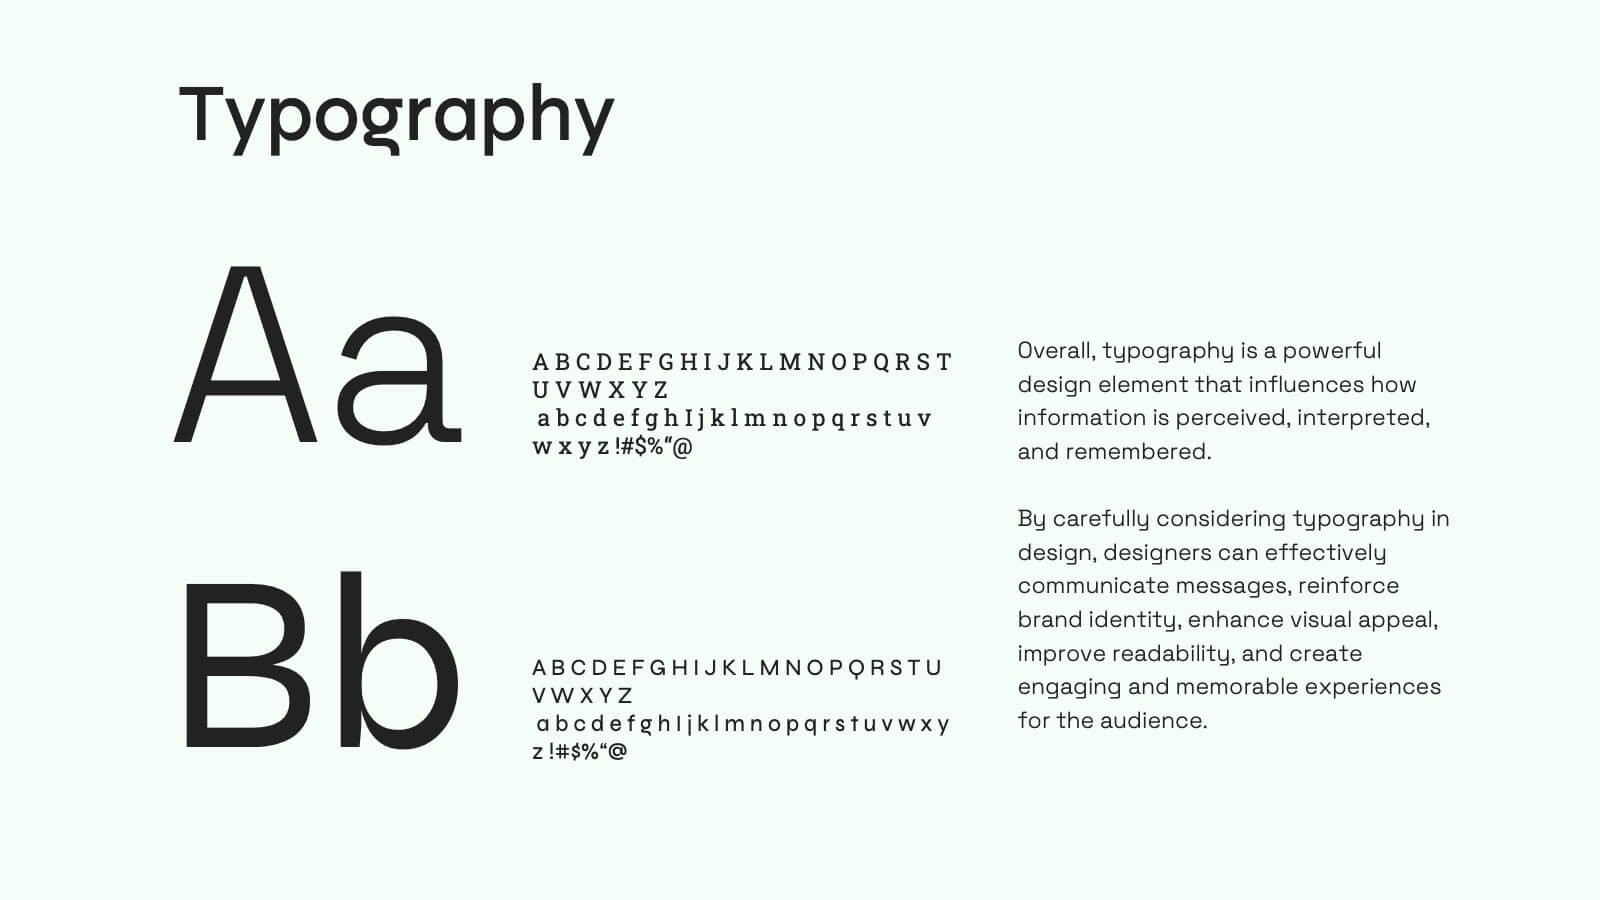
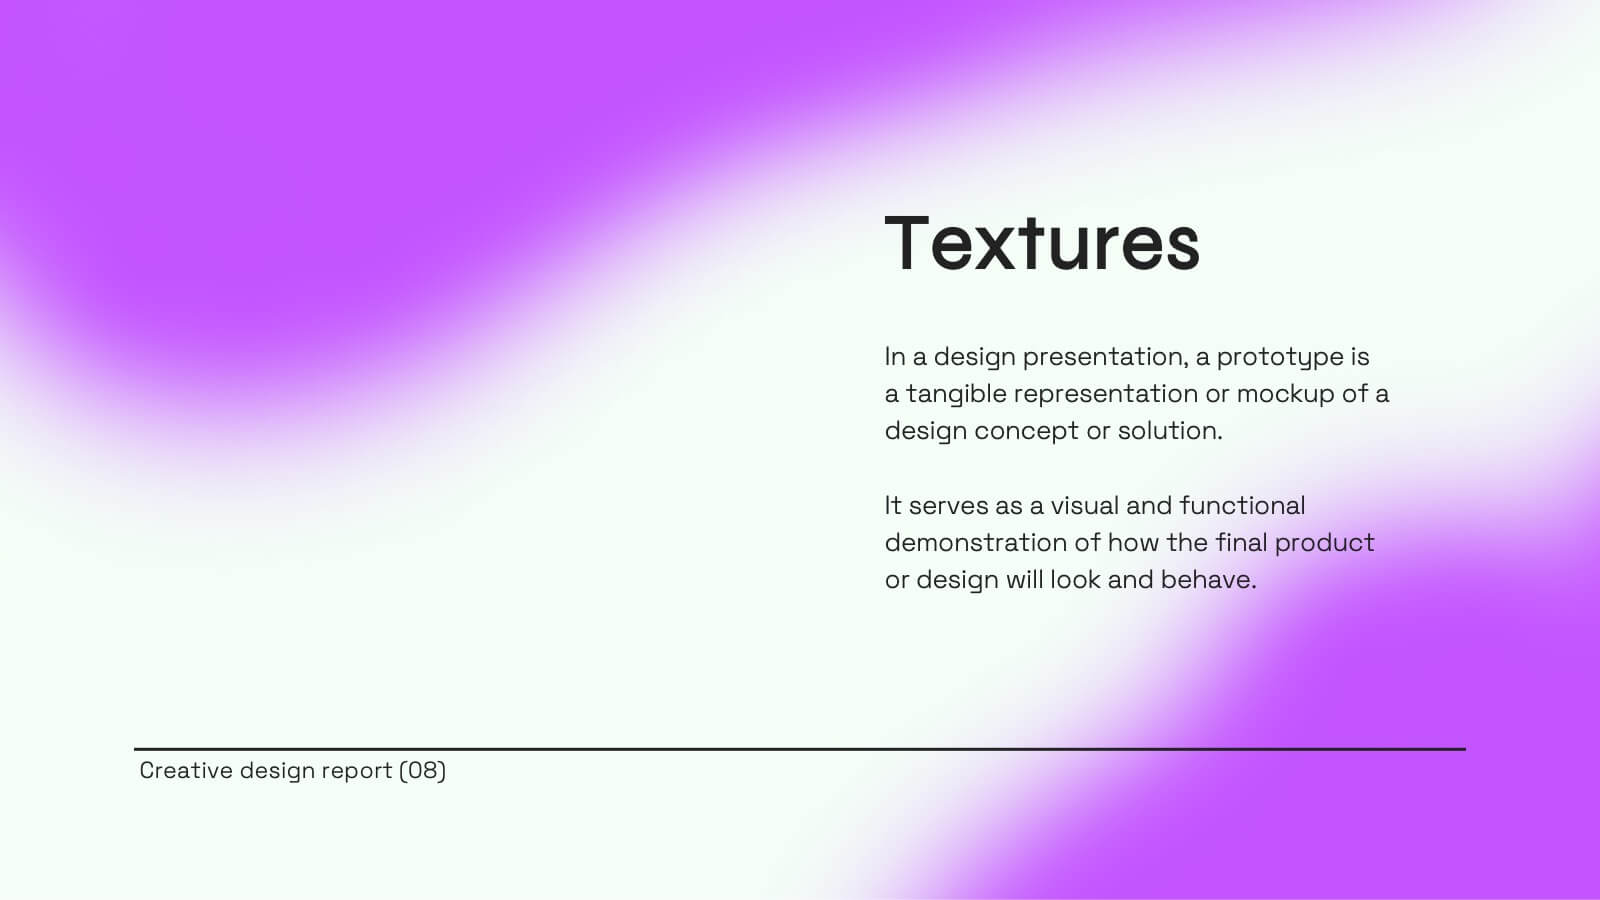
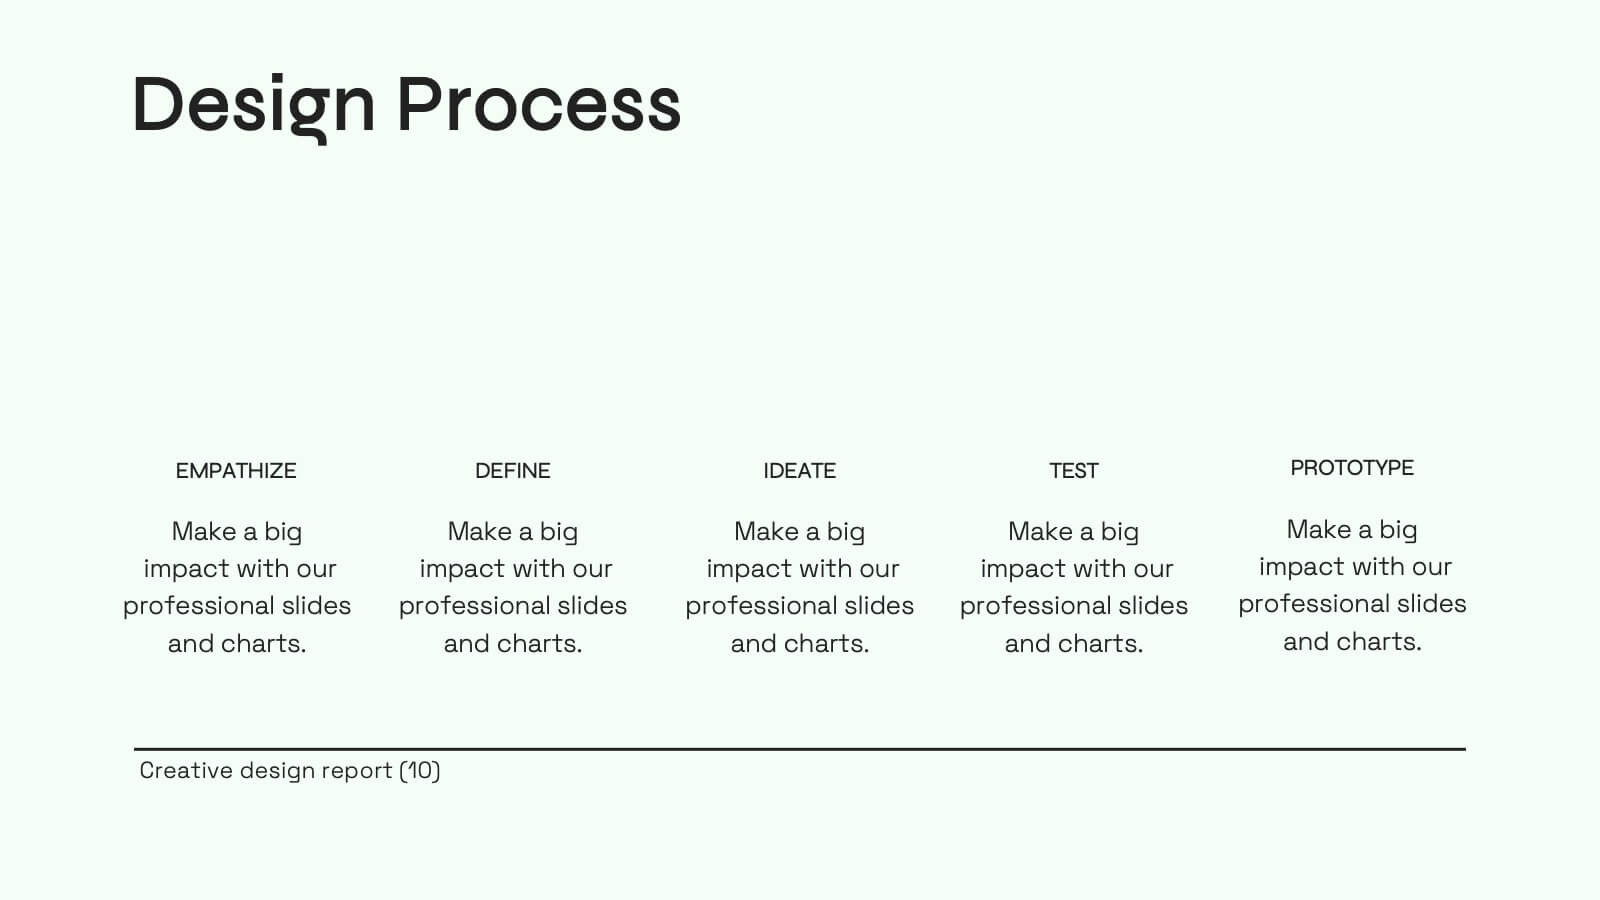
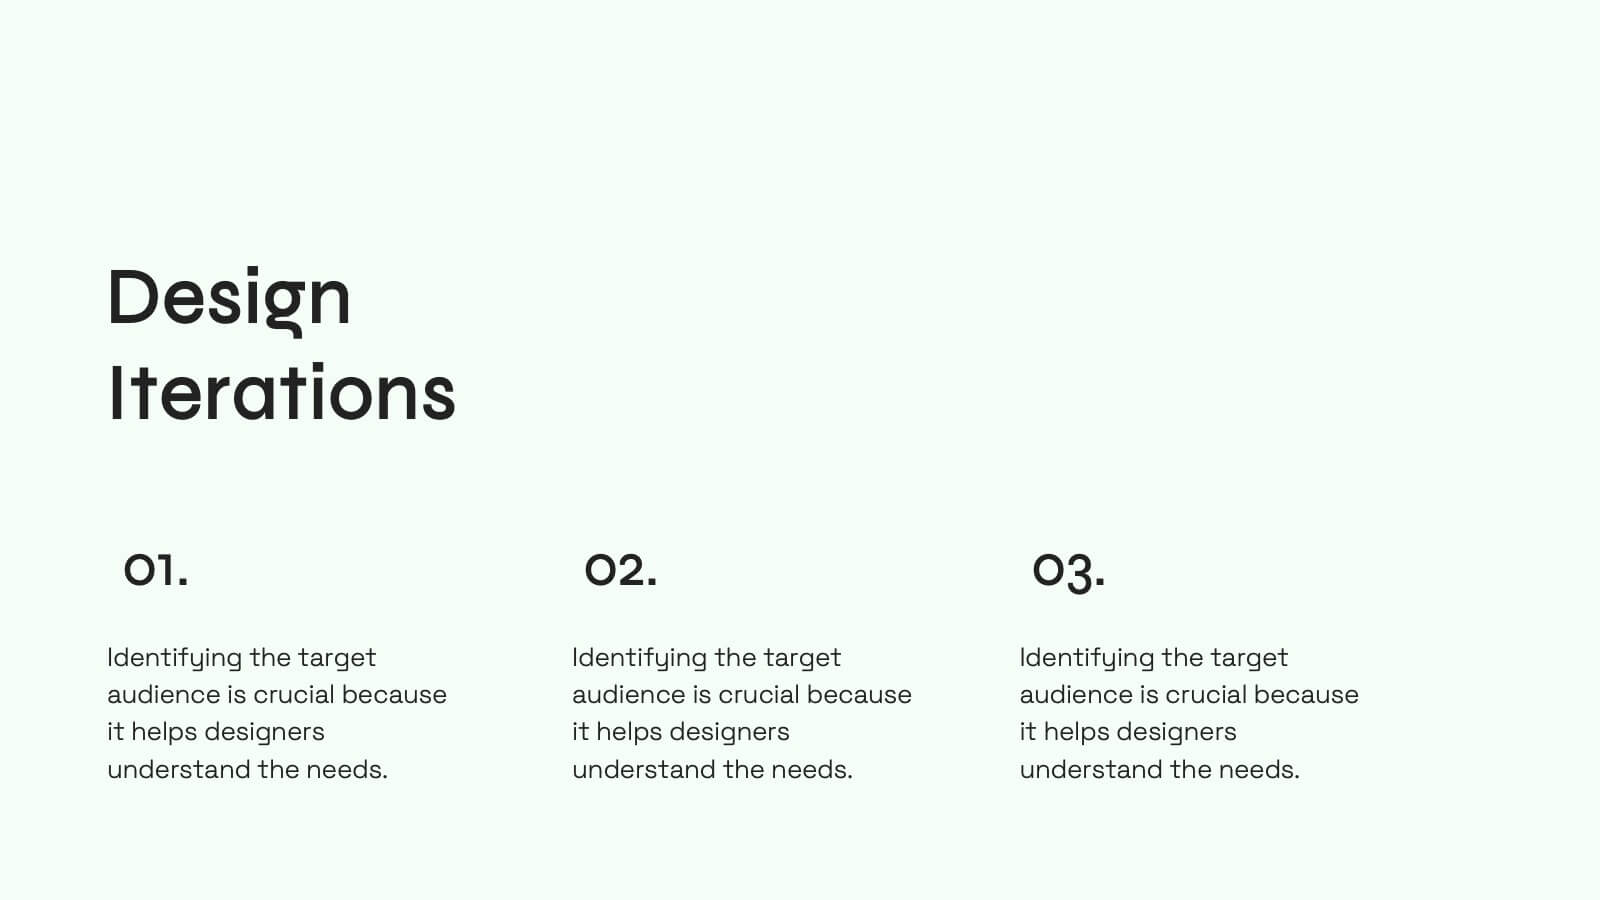
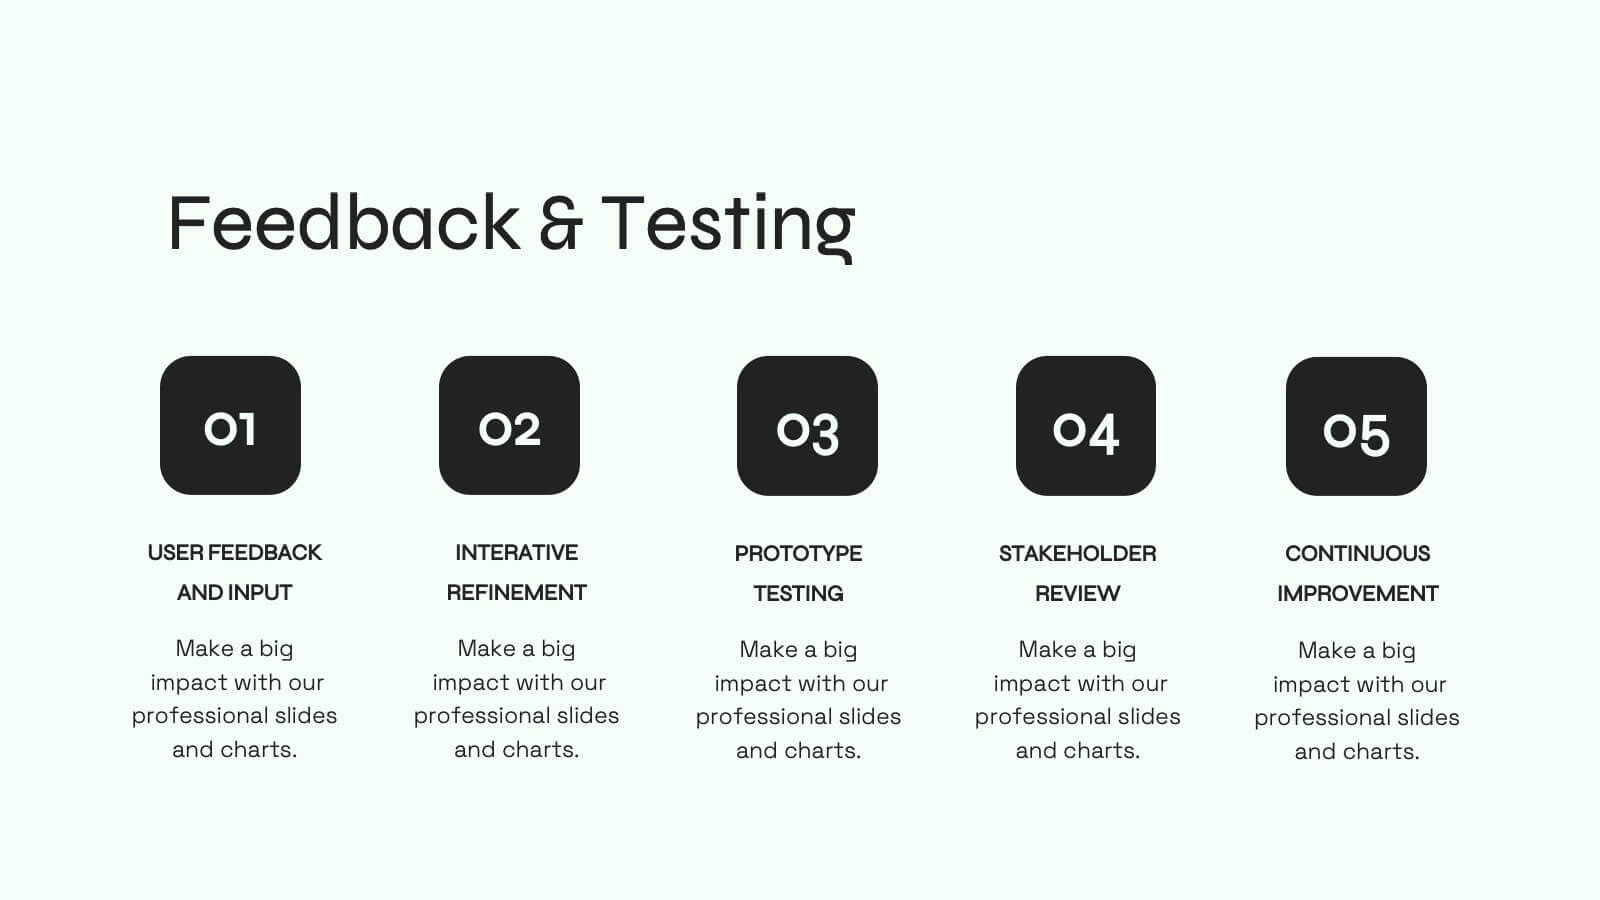
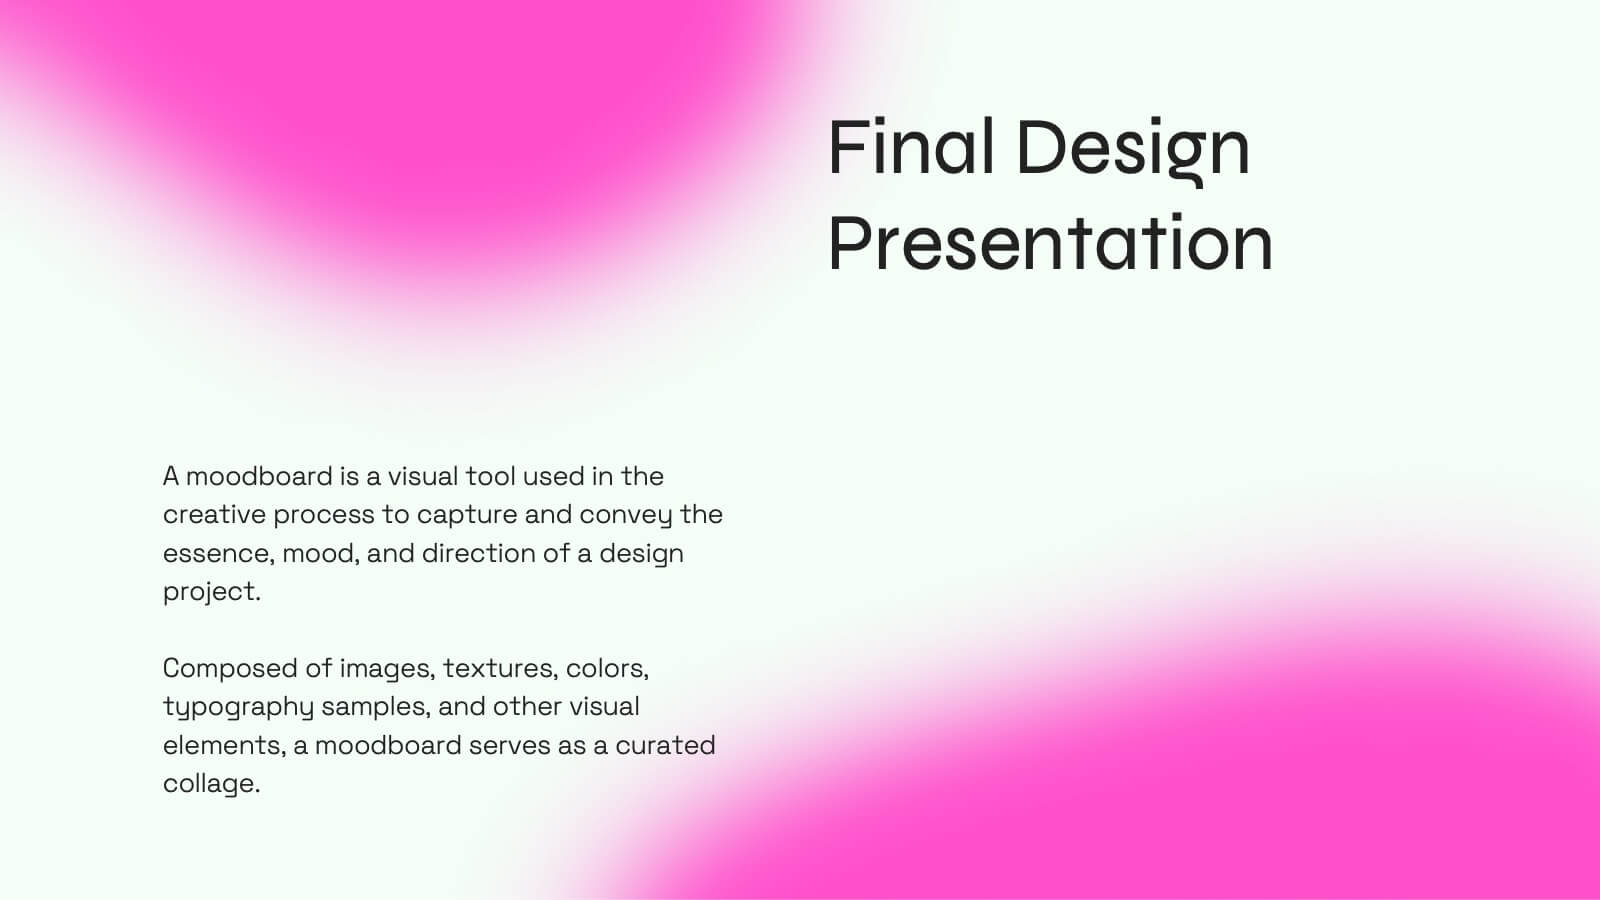
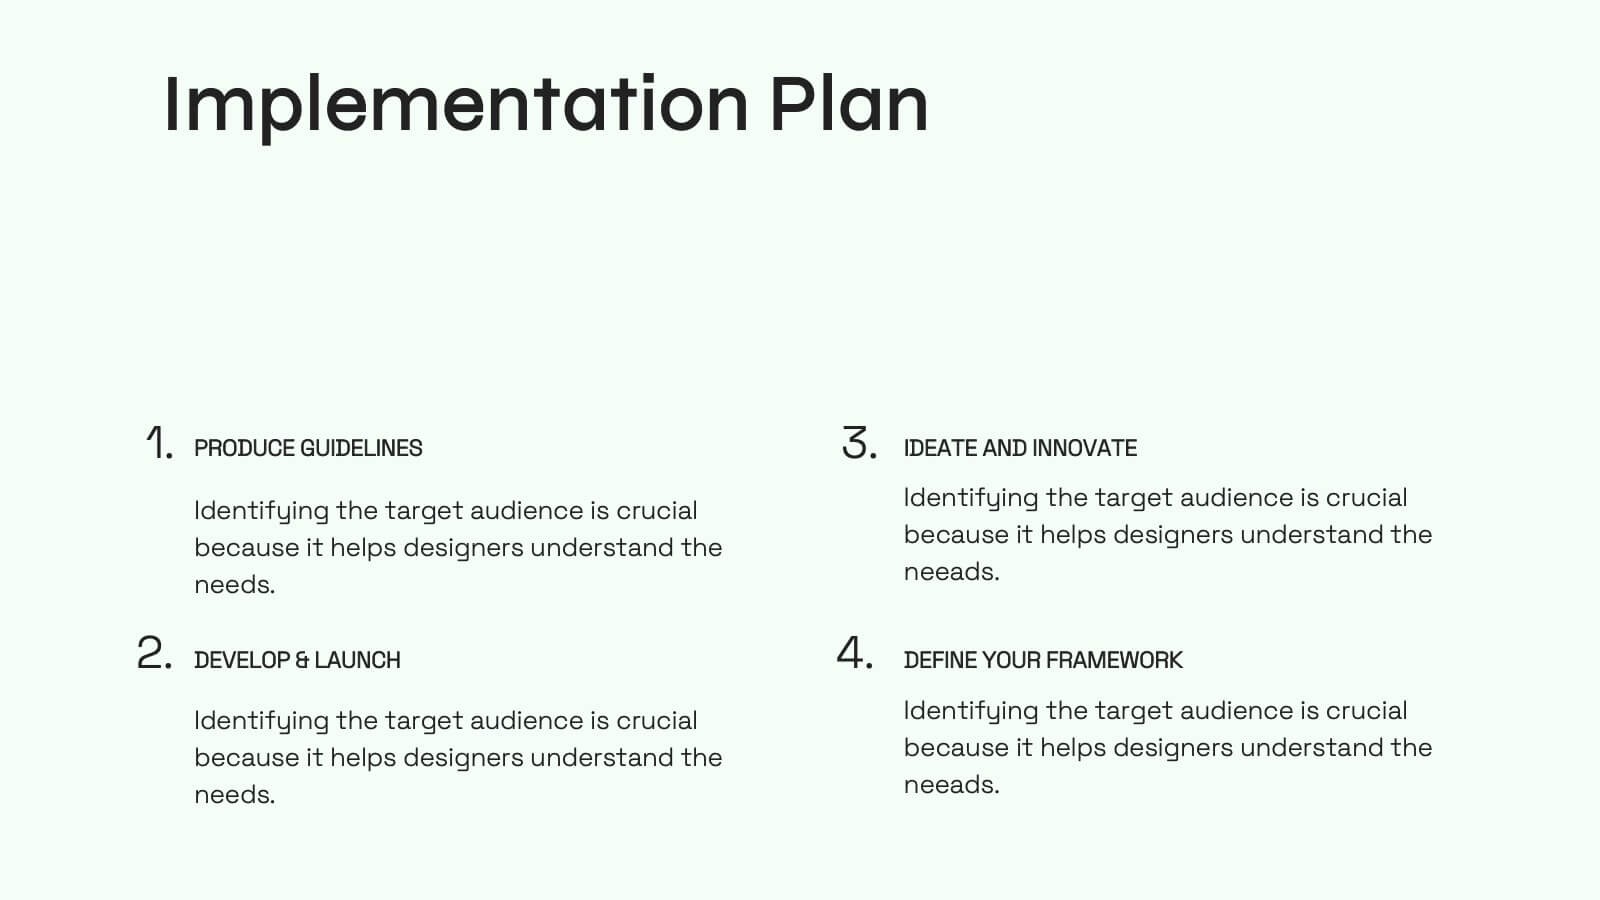
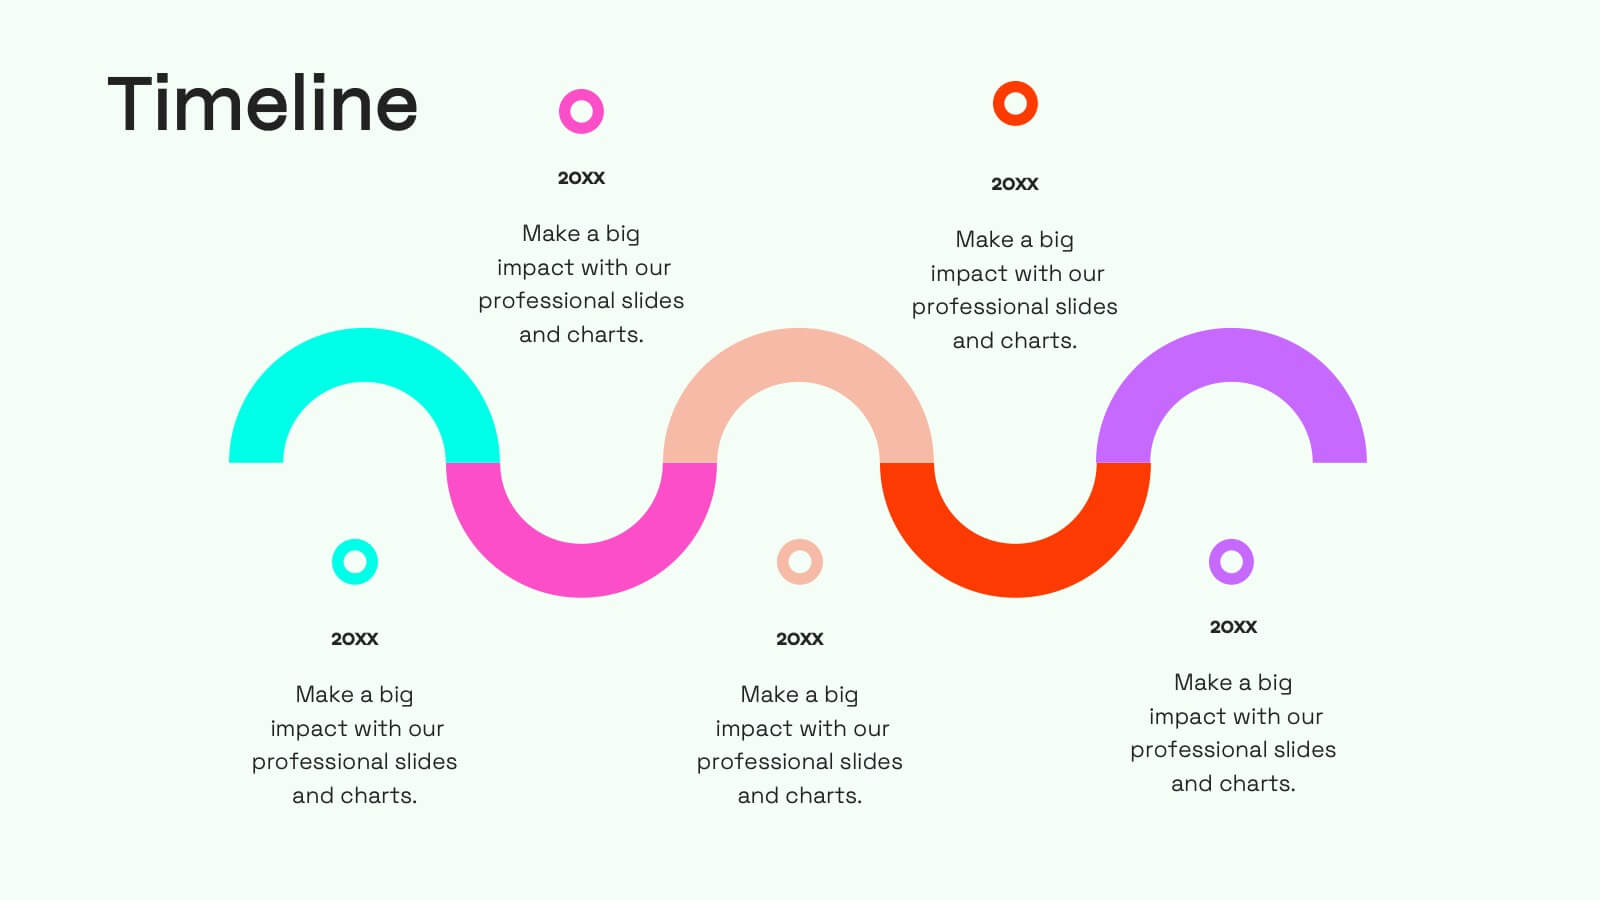
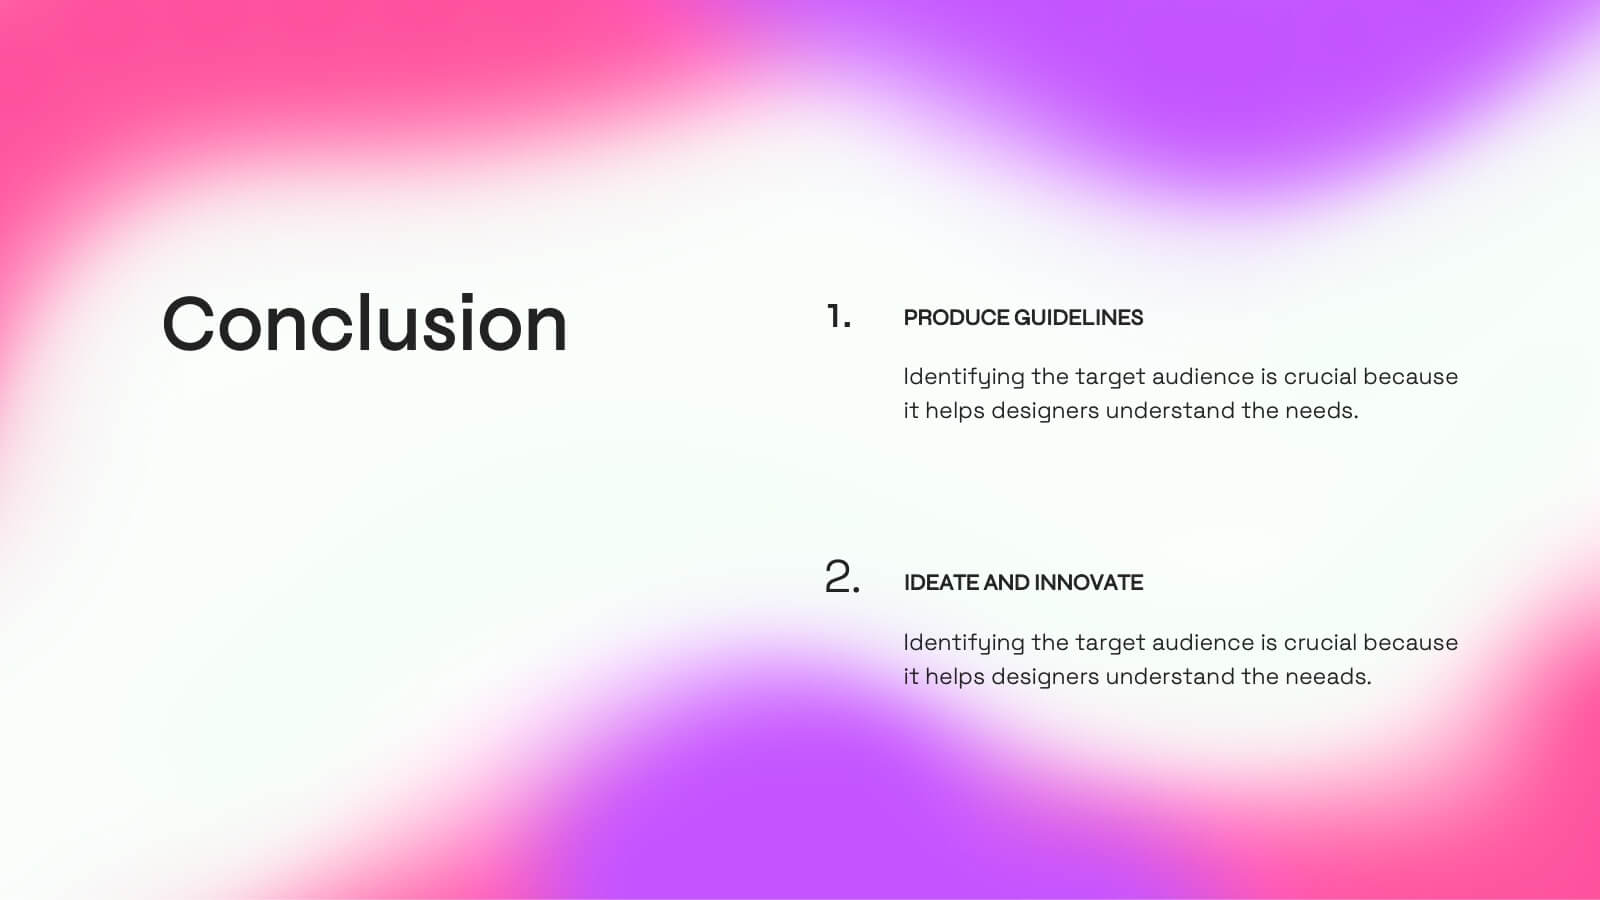
Jade Creative Design Report Presentation
Transform your design report into a captivating visual experience with this elegant jade-themed presentation template! Ideal for showcasing your creative projects, it effectively highlights key concepts, methodologies, and outcomes in a polished format. With its striking design, your work will impress clients and stakeholders alike. Compatible with PowerPoint, Keynote, and Google Slides.


7 diapositivas
RACI Matrix Project Infographic
A RACI Matrix, sometimes referred to as a Responsibility Assignment Matrix, is a project management tool used to clarify and communicate the roles and responsibilities of team members in completing tasks and activities within a project. This is a visually captivating and informative template designed to demystify the complexities of project accountability. Navigate through the world of roles and responsibilities in a project setting with this dynamic and easily digestible visual aid. With this infographic your audience will journey toward effective project management and accountability with the RACI Matrix.


7 diapositivas
Target Market Identification Strategy
Spot your ideal customers with precision using this lightbulb-centered layout designed to highlight key market segments and decision-making factors. Whether you're building buyer personas or refining your strategy, this slide presents your insights in a smart, structured way. Fully compatible with PowerPoint, Keynote, and Google Slides.


6 diapositivas
Event and Meeting Schedule Calendar Presentation
Simplify your weekly planning with this modern and visually intuitive event calendar template. Featuring a clean grid layout, this presentation allows you to organize key meetings, deadlines, or project highlights across six weeks. Each week is color-coded for quick reference, and each event box is fully editable to include titles and custom notes. Ideal for team leaders, educators, corporate planners, and event organizers. Compatible with PowerPoint, Keynote, and Google Slides for effortless use.


22 diapositivas
Gale Gust Financial Report Presentation
Unleash the power of your financial presentations with the Gale Gust Financial Report template! This sleek, modern design features a captivating black theme that radiates professionalism and confidence. The layout is meticulously structured to guide your audience through key highlights, performance metrics, sales performance, and financial summaries with ease. Each slide is designed to keep the focus on your data, with clean lines and a minimalist aesthetic that enhances readability and impact. Whether you're showcasing operational updates, market trends, or strategic initiatives, this template ensures that your content shines. Ideal for corporate meetings, investor updates, and financial reviews, this template is fully compatible with PowerPoint, Keynote, and Google Slides. The Gale Gust template is your perfect companion for delivering financial reports that command attention and leave a lasting impression. Get ready to make your numbers speak volumes!


4 diapositivas
Soft Watercolor Background Slides Presentation
Add a soft, elegant touch to your presentation with this Soft Watercolor Background Slides Presentation. Designed with gentle gray brushstroke textures and clean, modern layout, it's perfect for conveying ideas clearly while maintaining visual appeal. Ideal for creative, wellness, or professional topics. Fully editable in PowerPoint, Google Slides, and Canva.


4 diapositivas
Country-Specific Data World Map Presentation
Visually highlight regional data insights with this sleek Country-Specific Data World Map slide. Designed for clarity and impact, this layout lets you present four key statistics or findings alongside a pinpointed global map. Each percentage and title is customizable—ideal for business growth, research, or market penetration analysis. Clean design ensures your message stands out. Fully editable and compatible with PowerPoint, Keynote, and Google Slides.


5 diapositivas
Professional Relationship Network Presentation
Map out key business connections using this Professional Relationship Network template. Ideal for showcasing client relationships, internal team dynamics, or communication hierarchies. This clean, modern design helps clarify roles and links across stakeholders. Fully editable and compatible with PowerPoint, Keynote, and Google Slides for flexible use in any setting.


7 diapositivas
Cyber Security Consultant Infographic
Dive into the realm of cyber safety with our cyber security consultant infographic. With a color palette that reflects the technological and serious nature of the domain – blue for trust and black for professionalism – this infographic is a representation of the role and responsibilities of a cyber security consultant. The design employs sleek icons that symbolize various cyber security elements. Ideal for IT professionals, and institutions providing training on cyber security. Compatible with PowerPoint, Keynote, and Google Slides, it promises versatility and ease of use. This ensures that the complex world of cyber security is made accessible.