


Características


¿Tienes alguna pregunta?
Recomendar


5 diapositivas
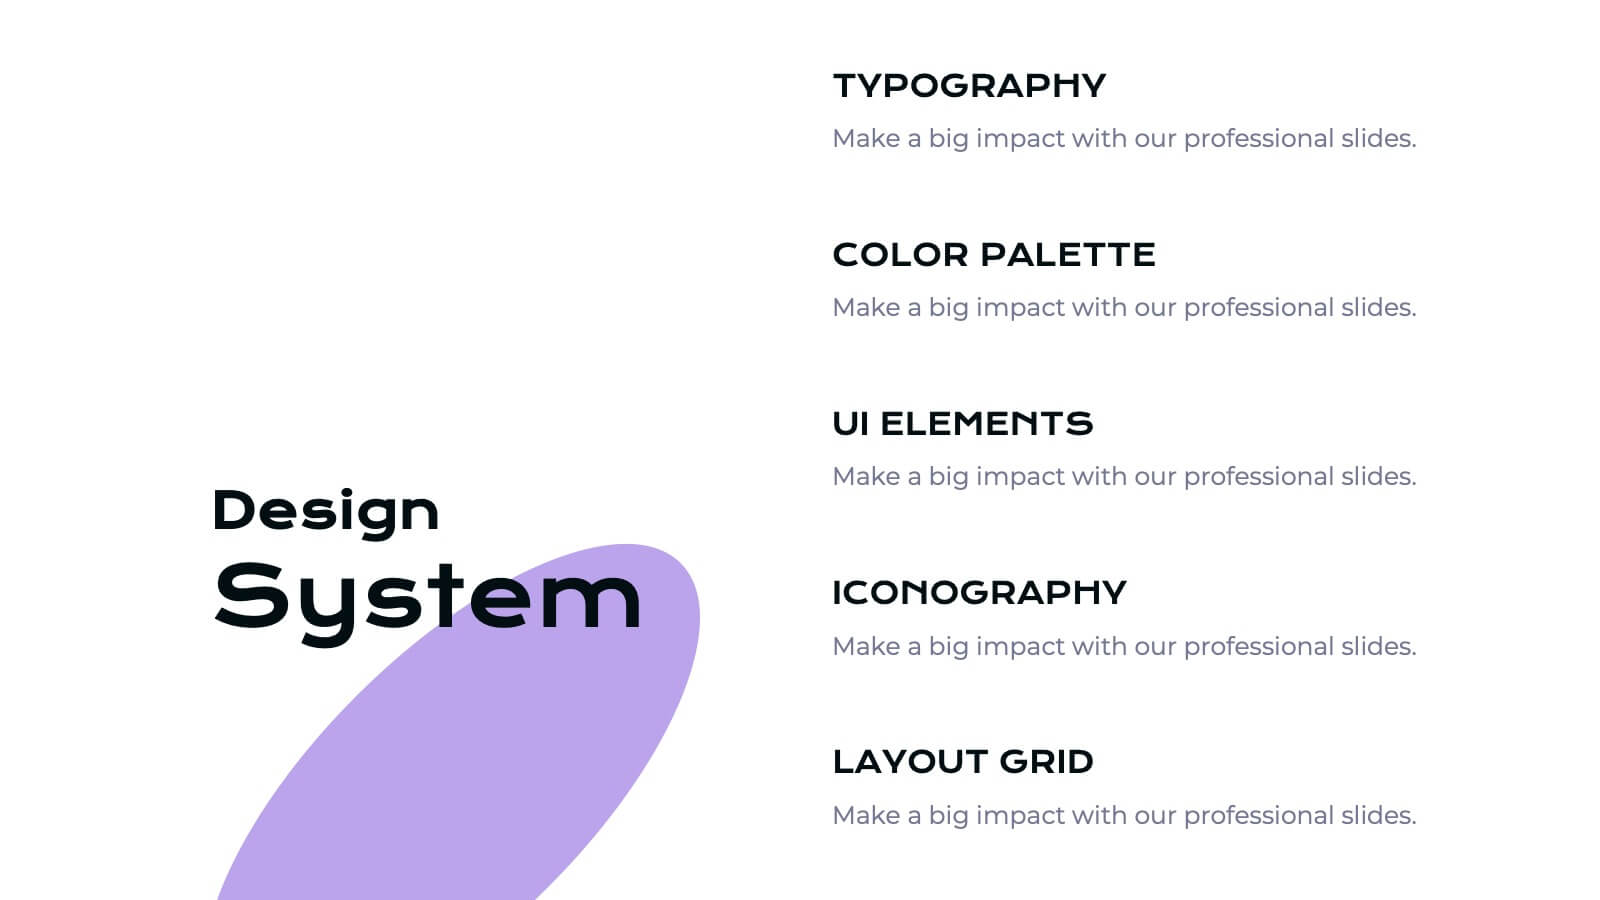
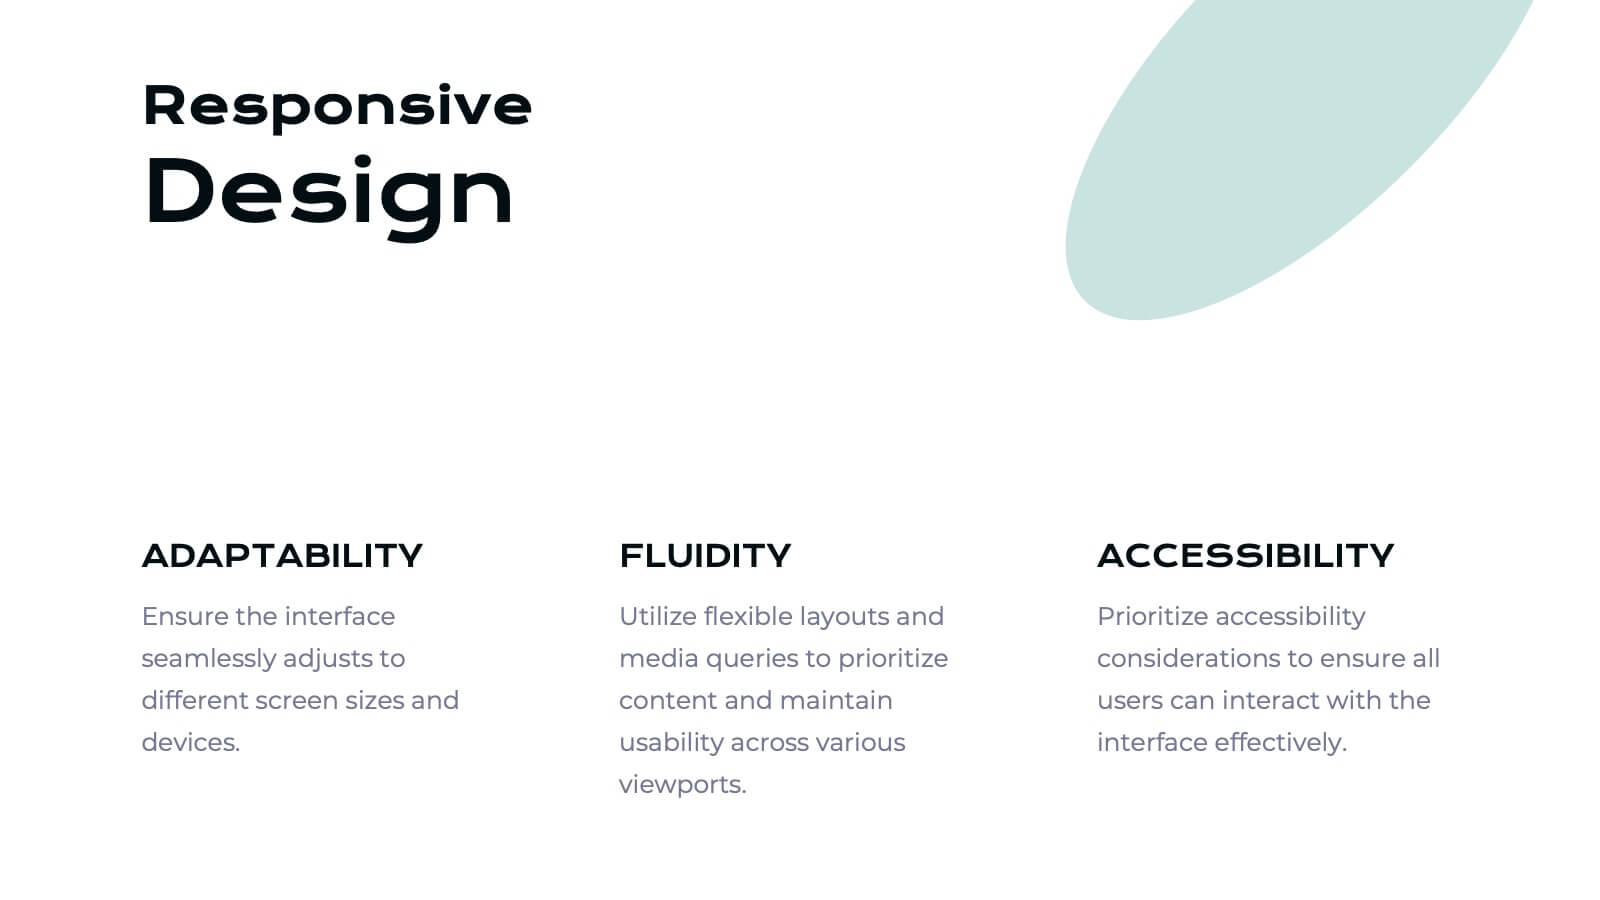
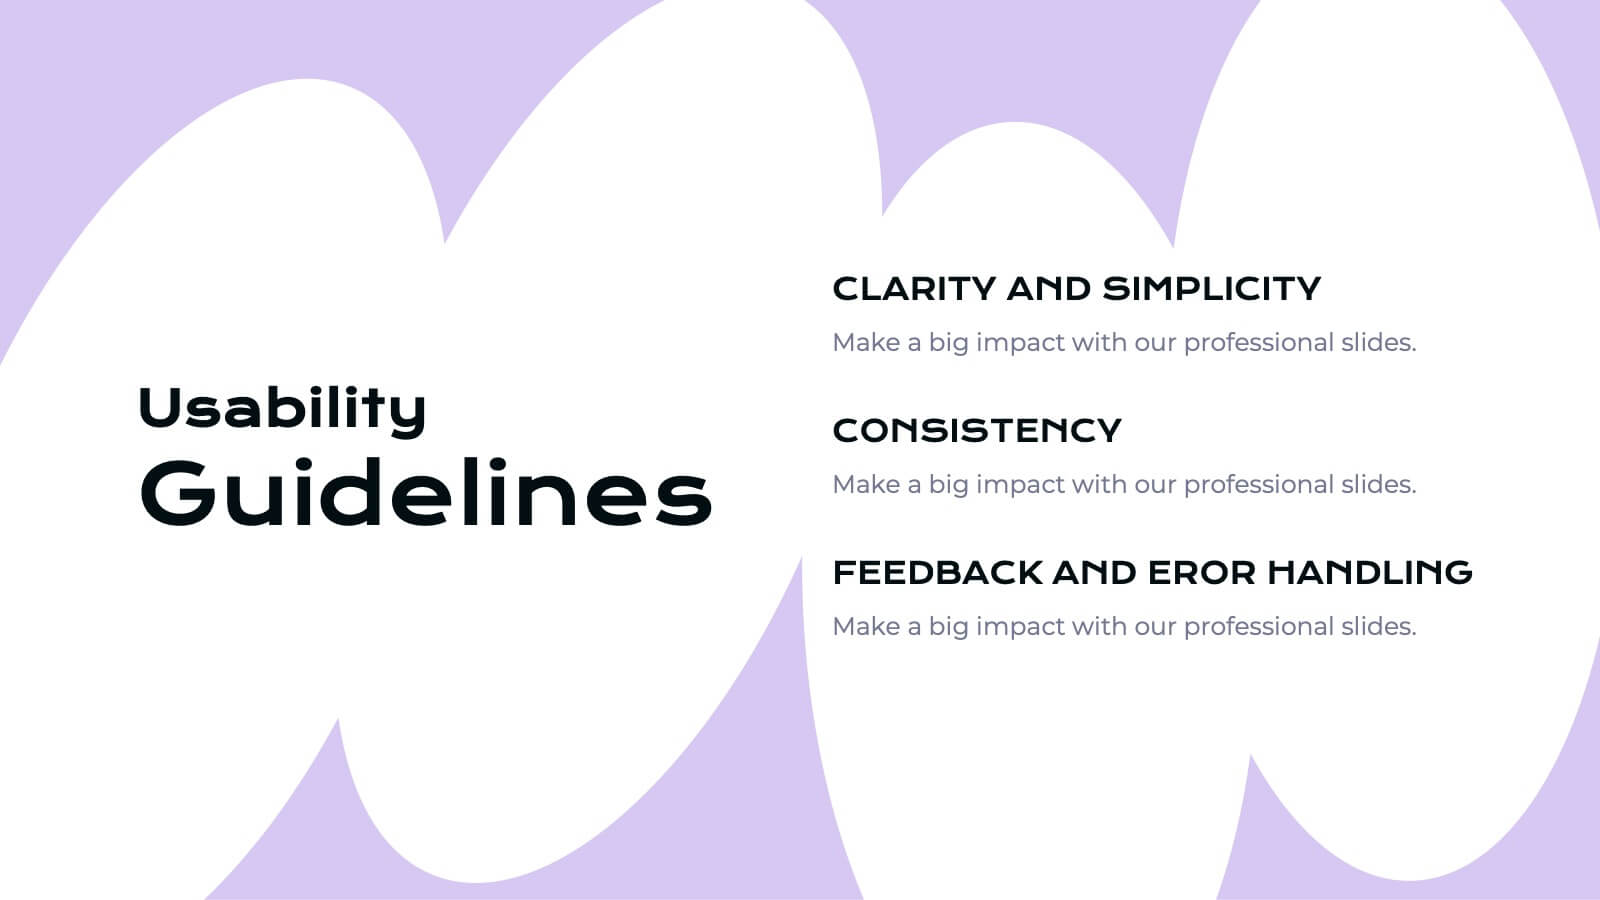
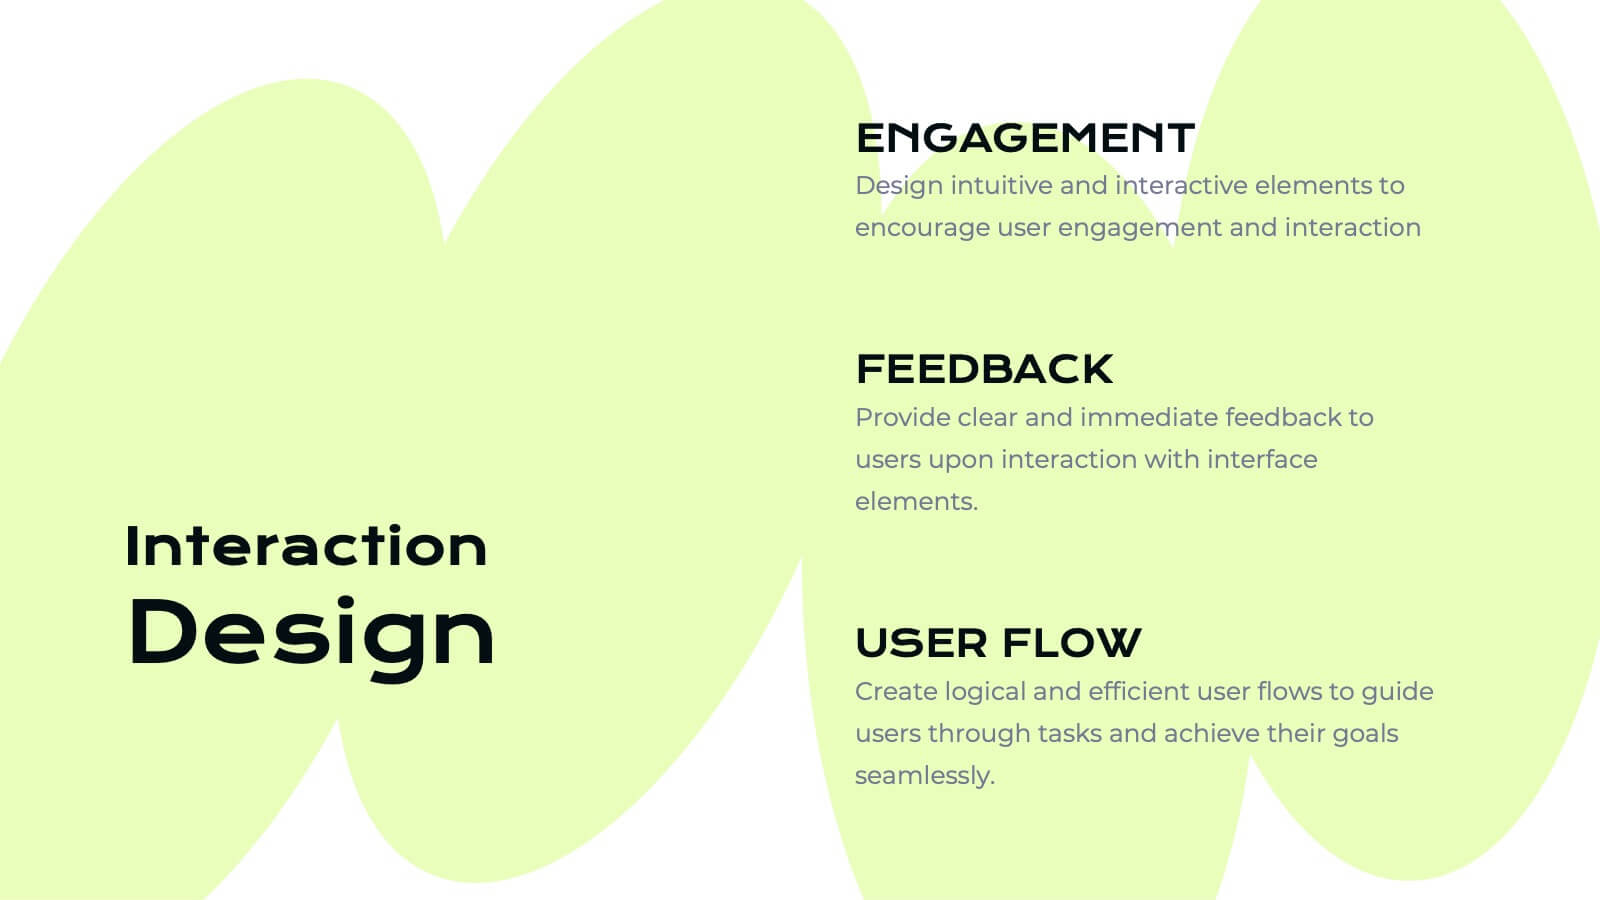
Diverse List Infographics
Diverse list refers to a compilation or collection of items that include a wide range of diverse elements. These infographic templates showcases a diverse range of categories and topics in a concise format. The infographic is designed to present information in a visually stimulating way, allowing viewers to easily navigate and understand the diverse list being presented. The infographics organizes the lists into categories or sections, so the viewers can identify and locate specific items of interest. The categories are represented by visually distinct sections and color-coded tabs or icons that provide a cue for each category.


7 diapositivas
Enterprise Governance Infographics
A Governance Infographic provides information about the principles and practices of governance, particularly in the context of organizations or institutions. This governance template can be used to cover a wide range of topics related to governance, including organizational structures, decision-making processes, risk management, compliance, and ethical standards. You can use this to include information on the roles and responsibilities of different stakeholders, such as board members, executives, and employees, as well as the policies and procedures that govern their interactions.


6 diapositivas
Market Challenges and Resilience Strategy Presentation
Tackle volatility with clarity using the Market Challenges and Resilience Strategy presentation. This slide features a modern smartphone graphic surrounded by six key strategy zones, each with its own icon and text area—ideal for outlining market pressures, competitive moves, or adaptive responses. Use it to communicate resilience frameworks, digital transformation steps, or scenario planning. Fully customizable in PowerPoint, Keynote, and Google Slides.


5 diapositivas
Visual Data Representation Bubble Map
Display complex data in a clean, engaging format with this Visual Data Representation Bubble Map. Ideal for highlighting key points, data clusters, or relationships, each bubble can be customized to match your topic. Perfect for presentations in business, research, or strategy—fully editable in PowerPoint, Keynote, and Google Slides.


14 diapositivas
Business Innovation and Idea Development Presentation
Drive Business Innovation and Idea Development with this dynamic and structured template, perfect for illustrating creative processes, strategic growth, and idea execution. Designed with a lightbulb-themed layout, this presentation helps break down complex concepts into clear, engaging sections. Fully customizable and compatible with PowerPoint, Keynote, and Google Slides, making it an essential tool for entrepreneurs, teams, and business leaders looking to present ideas with impact.


4 diapositivas
Preventative Healthcare Strategies Presentation
Present medical insights with clarity using this syringe-themed slide layout designed for preventative healthcare strategies. Ideal for showcasing public health plans, vaccination drives, or early intervention tactics. Fully editable in PowerPoint, Keynote, and Google Slides, this modern visual aids healthcare professionals in delivering data-driven, concise messages with professional impact.


10 diapositivas
Real Estate Market Trends Presentation
Stay ahead of Real Estate Market Trends with this data-driven presentation template. Designed for agents, investors, and analysts, this template visually highlights housing trends, market insights, and investment opportunities with engaging layouts. Fully customizable and available for PowerPoint, Keynote, and Google Slides, ensuring a professional and compelling presentation.


7 diapositivas
Stores Pricing Tables Infographic Presentation
A Pricing Table Infographic is a visual representation of the prices and features of different products or services offered by a company. This template is designed so you can compare and contrast the different options available to potential customers, and to make an informed decision based on their needs and budget. This template includes a table that lists the different products and services, along with their prices, features, and any other relevant information you chose to include. It also include charts or graphs to help visualize the differences between the different options available.


7 diapositivas
AIDA Interest Model Infographic
The AIDA Interest Model is a cornerstone in marketing and sales, guiding professionals through the stages of Attention, Interest, Desire, and Action. Our infographic, bathed in hues of purple, green, blue, and yellow, brings this classical model to life in a refreshing and engaging manner. With a fun, yet informative style, it elucidates each phase, making it a go-to resource for marketers, salespersons, and educators alike. Whether you're training a team, educating students, or crafting a persuasive pitch, this infographic will elevate your presentation. It's fully compatible with PowerPoint, Keynote, and Google Slides.


26 diapositivas
Raoul Presentation Template
Are you looking for business presentation template with a powerful framework that allows you to present and promote your latest ideas? Raoul is a sleek and clean, bold business presentation template. It's perfect for sharing your ideas, brand identity and how you want to be perceived with the world, in an appealing way. Raoul is great presentation for big or small businesses, company owners, reporters or managers. This template is all about simplicity and style. You will gain authority and convince others with this masterfully crafted professional presentation design.


5 diapositivas
IT Support and Systems Presentation
Streamline your tech communication with a clean, structured layout that highlights your IT services, support processes, and system workflows. Perfect for teams presenting solutions, infrastructure overviews, or technical strategies, this presentation brings clarity to complex topics. Fully compatible with PowerPoint, Keynote, and Google Slides for effortless editing and delivery.


8 diapositivas
Employee Performance Review Presentation
Assess and visualize team performance effectively with these "Employee Performance Review" presentation templates. Crafted to simplify performance analysis, these slides allow you to pinpoint strengths and areas for improvement through clear, sequential visual layouts. They are perfect for managers looking to foster growth and productivity, and are fully compatible with PowerPoint, Keynote, and Google Slides.


22 diapositivas
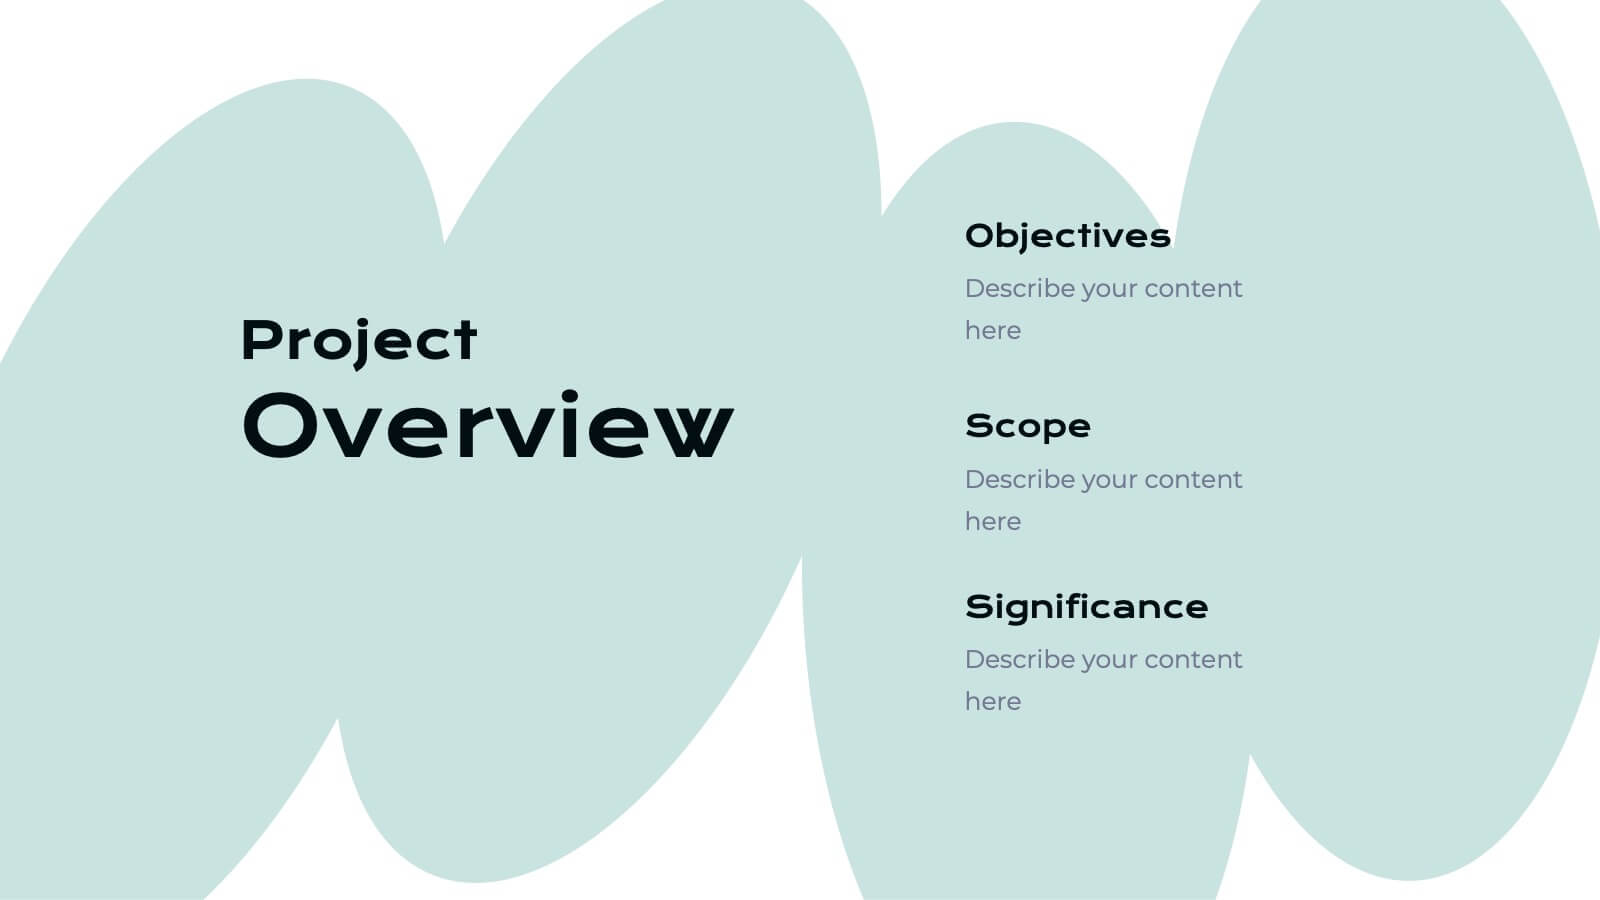
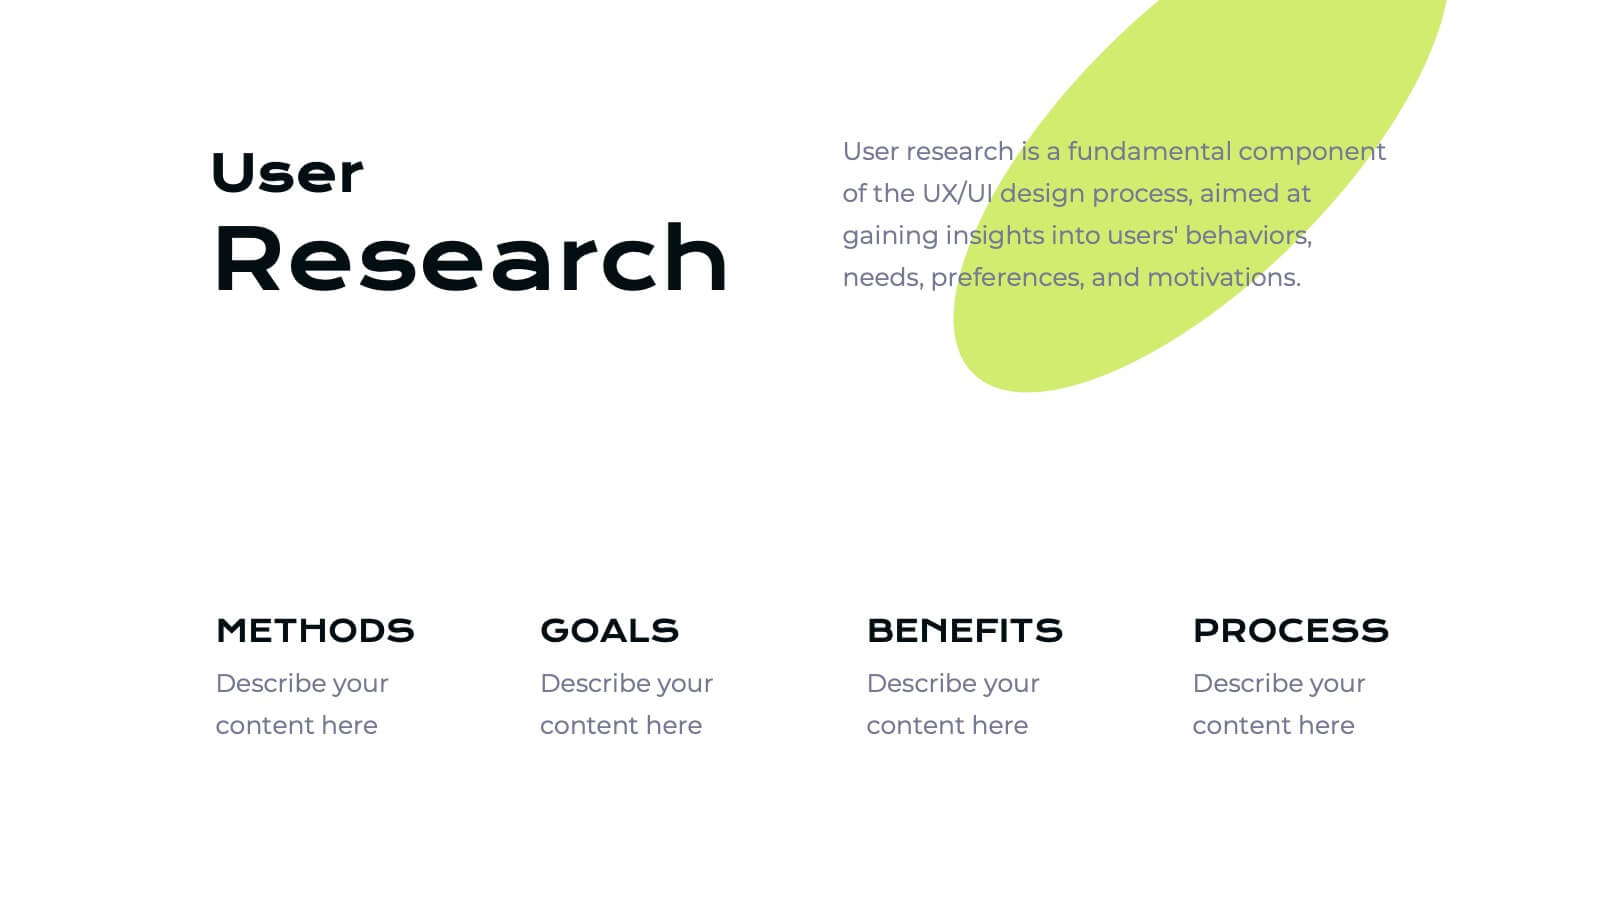
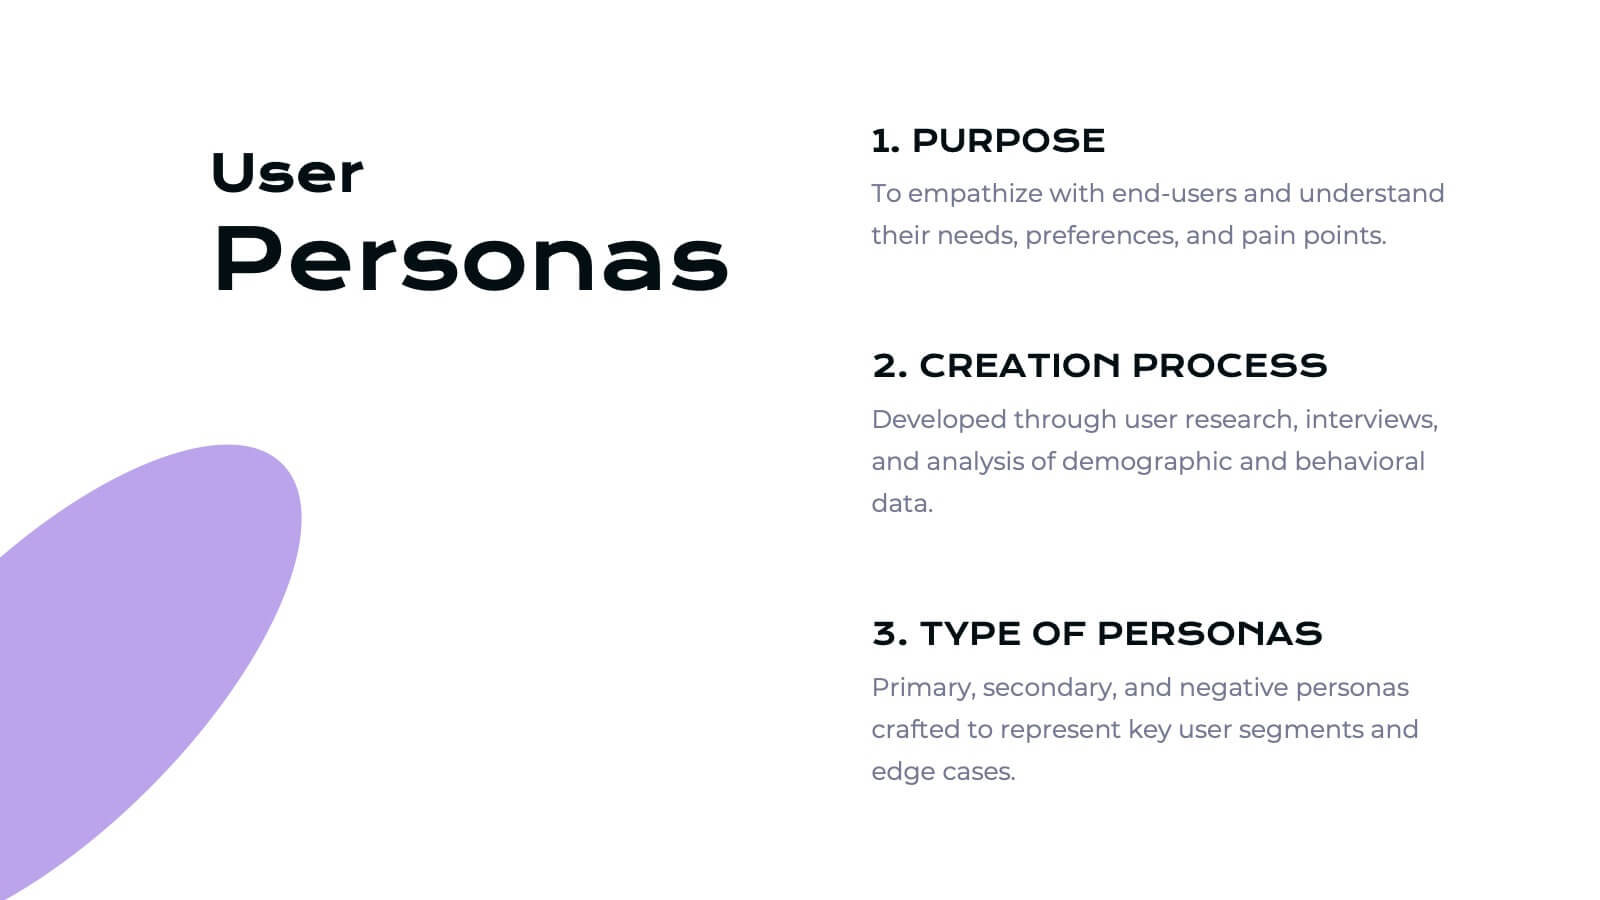
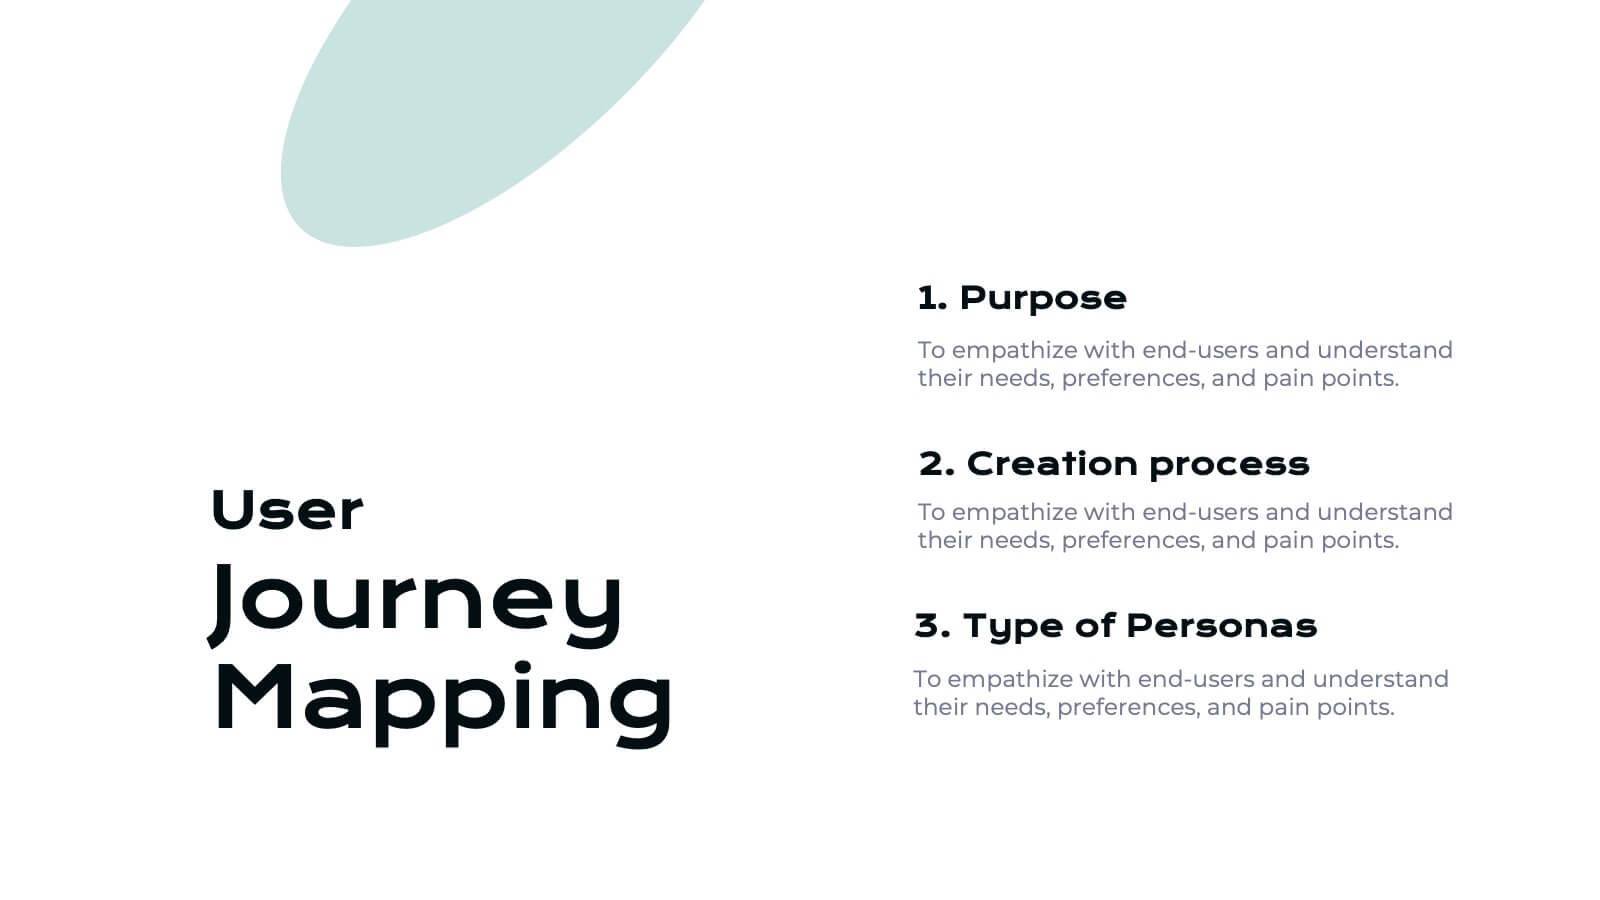
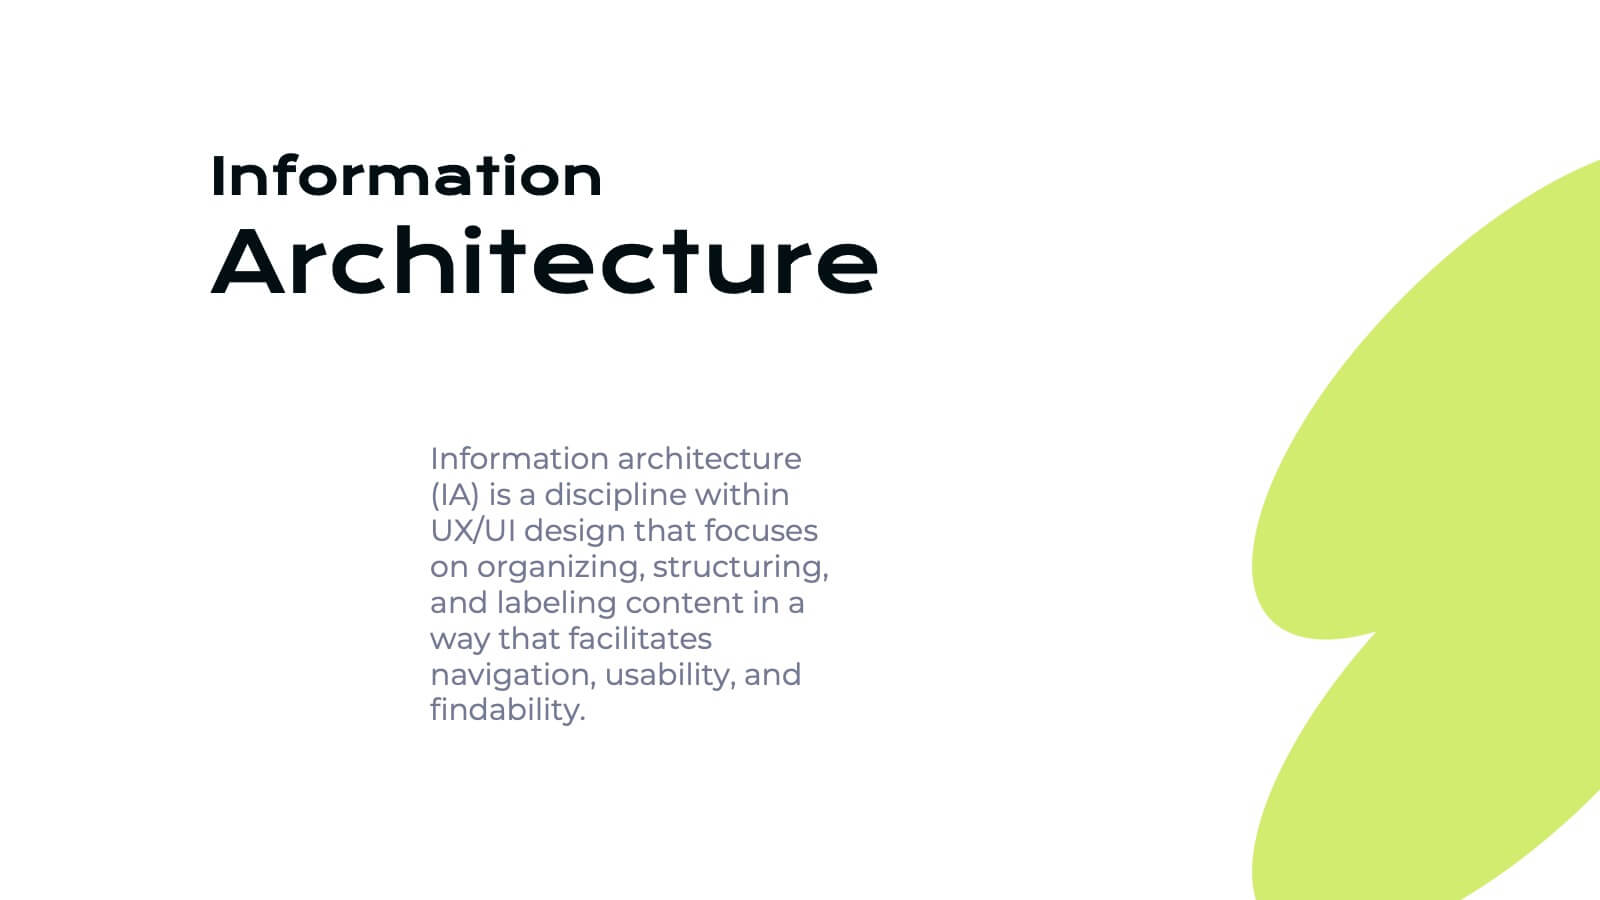
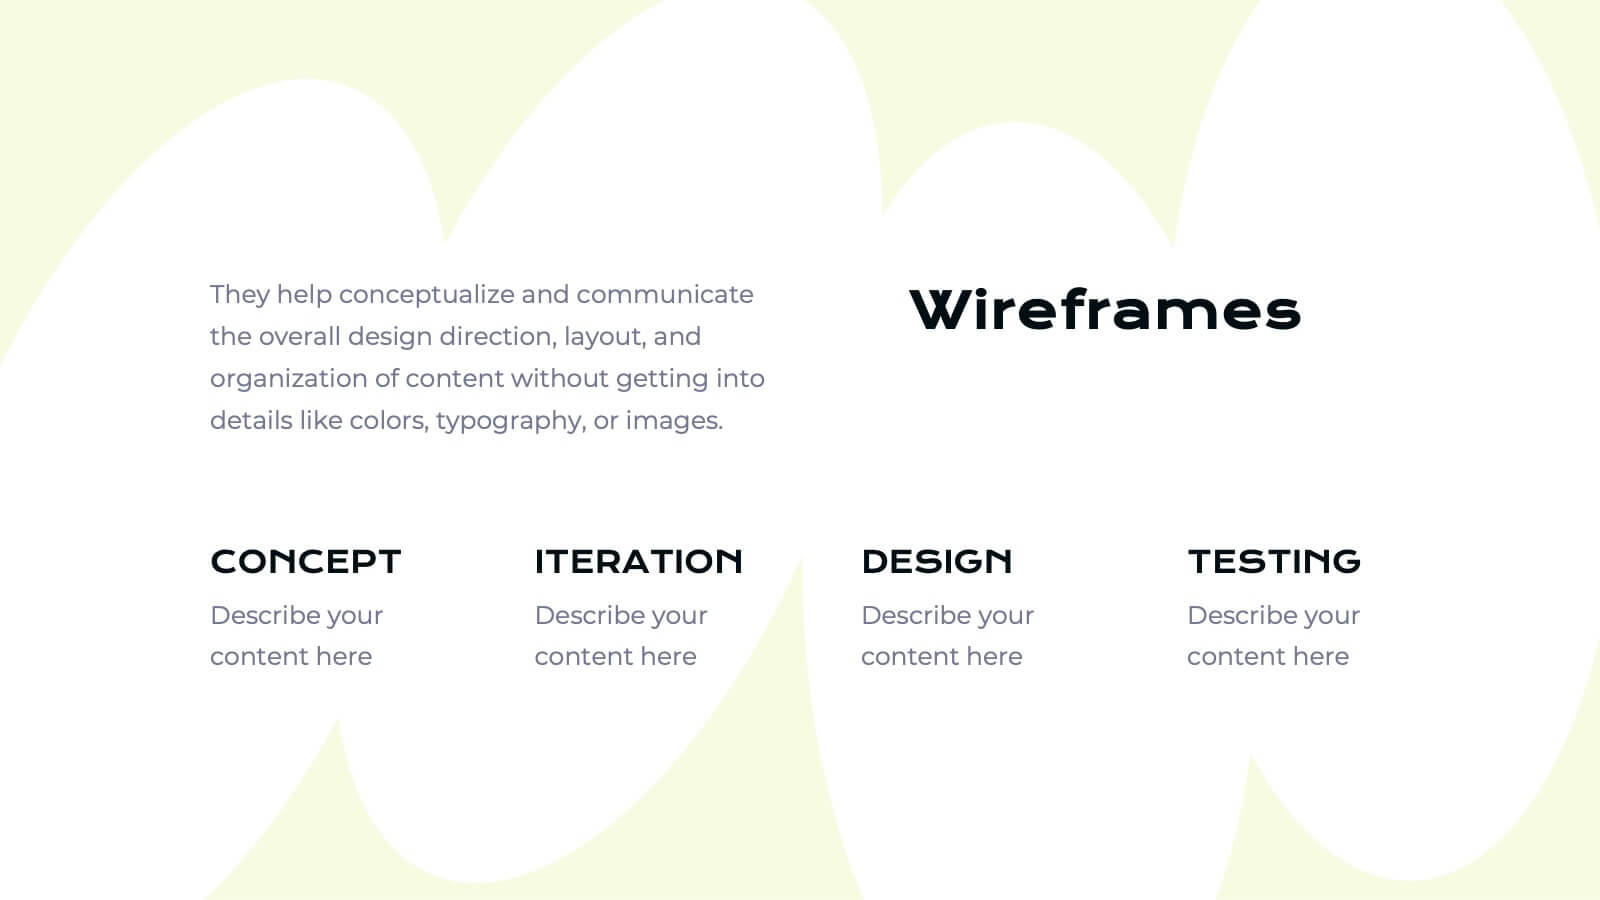
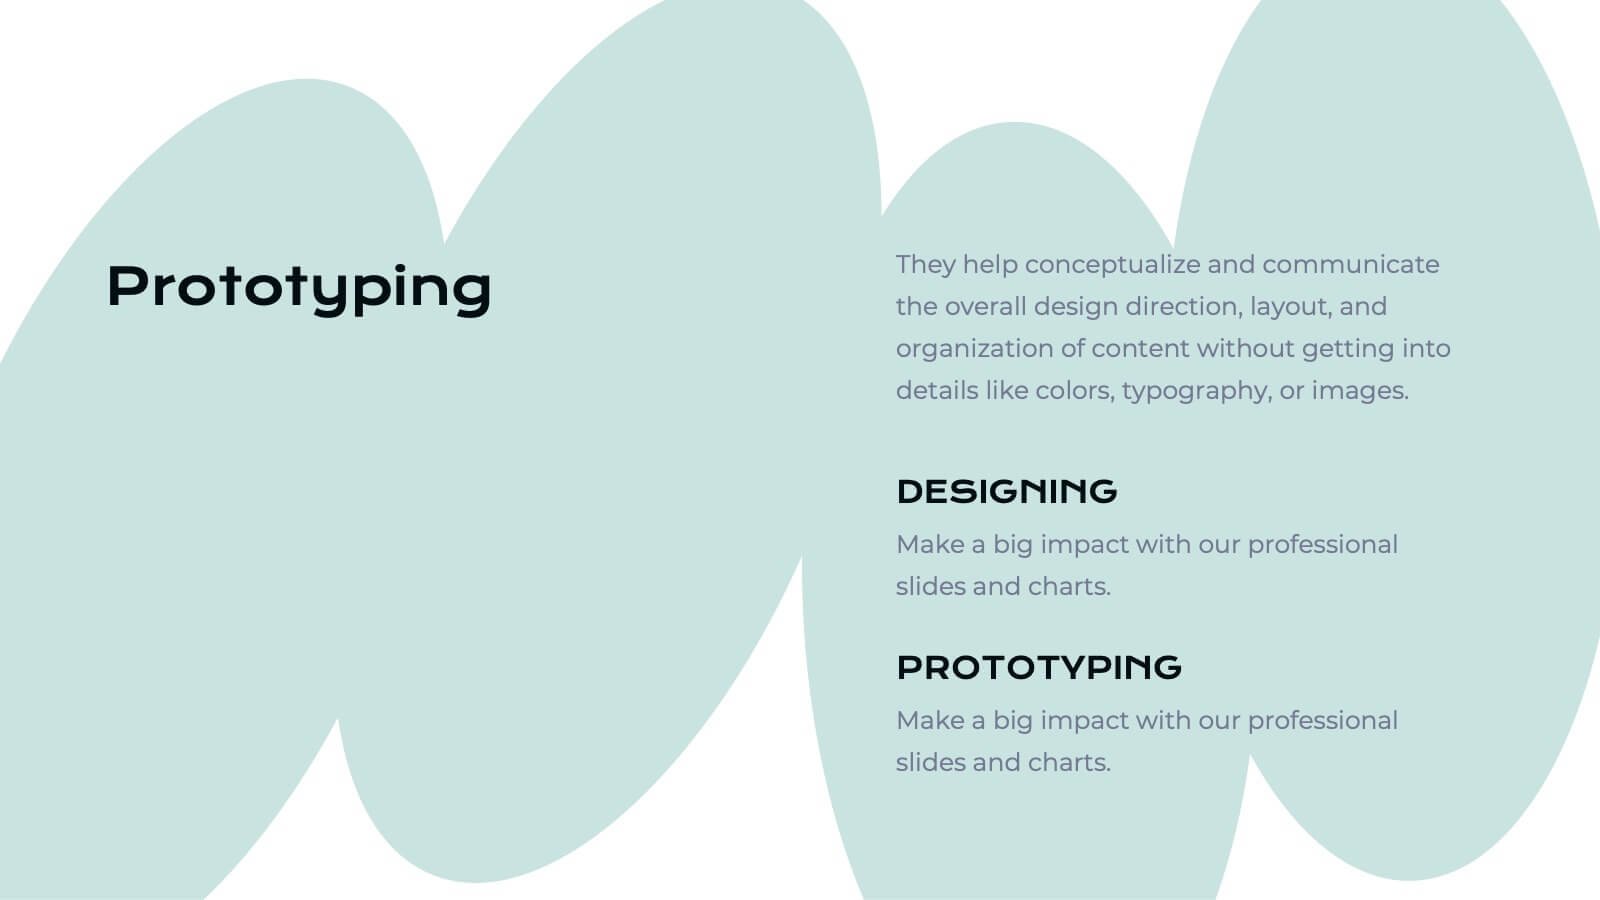
Ifrit User Experience Proposal Presentation
Unleash the power of great design with this fiery Ifrit-inspired presentation, perfect for delivering your user experience proposal! This template lets you showcase your UX strategies, research, and design process in a visually striking and well-organized format. Impress stakeholders with every slide. Compatible with PowerPoint, Keynote, and Google Slides.


4 diapositivas
E-Learning Course Design Overview Presentation
Spark curiosity from the very first slide with a clean, modern layout that explains how effective online learning experiences are planned and delivered. This presentation walks through key elements of course structure, content flow, and learner engagement in a simple, visual way. Fully compatible with PowerPoint, Keynote, and Google Slides.


6 diapositivas
RACI Matrix Chart Infographic
The RACI matrix is a project management tool used to define roles and responsibilities for tasks and activities within a project. This infographic template is designed to clarify the roles and responsibilities of team members in a project or process. RACI stands for Responsible, Accountable, Consulted, and Informed, and the matrix helps define each team member's involvement in different tasks or activities. This includes a step-by-step guide on how to create a RACI matrix, including identifying tasks, defining roles, and assigning responsibilities. This will simplify your audience's understanding of the RACI matrix chart.


7 diapositivas
Company Profile Infographic
This collection of company profile templates is designed to meet the diverse needs of various businesses, providing an efficient and polished method for presenting a company's identity, accomplishments, and offerings. Each template is meticulously crafted to cater to different professional contexts, making them suitable for annual reports, investment summaries, or internal briefings. Structured for clarity, these templates enable businesses to effectively communicate essential details such as company history, objectives, and the breadth of services or products offered. They are also equipped to showcase crucial statistics like employee numbers, significant achievements, and organizational hierarchy, enhancing the overall presentation. The design blends modern aesthetics with functionality, incorporating a professional color palette and clean layout that holds viewer interest and enhances readability. Customization is straightforward, allowing for easy adjustments in colors, fonts, and design elements to align with specific brand identities. Ideal for corporations looking to convey their market stance and engage potential clients, investors, or prospective employees, these templates serve as a vital tool in creating impactful and informative company profiles.


5 diapositivas
Contracts and Law Obligations Infographics
Contracts and Law Obligations are crucial aspects of legal systems and business transactions. These infographic templates are designed to help you communicate complex legal concepts in an easy-to-understand format, making it suitable for legal professionals, businesses, or anyone seeking to educate others about contract law. These infographics features a unique, vintage law design with customizable layouts, visually appealing icons, and color schemes that can be tailored to match your presentation needs. It is compatible with PowerPoint, Keynote, and Google Slides, providing flexibility in editing.