


Características


¿Tienes alguna pregunta?
Recomendar


7 diapositivas
Environmental Specialist Infographic
An Environmental Specialist, is a professional who focuses on environmental issues and challenges, aiming to develop solutions and strategies to address them. This engaging infographic template is designed to shed light on the critical role of environmental specialists, presenting data, facts, and strategies to inspire and educate on the path towards a sustainable and eco-friendly world. Fully customizable and compatible with Powerpoint, Keynote, and Google Slides. This infographic is your guide to understanding and appreciating the invaluable work of environmental specialists.


5 diapositivas
Asia Geographic and Business Analysis Map Presentation
Gain a strategic edge with the Asia Geographic and Business Analysis Map template, designed to visualize market trends and demographic data across the region. Ideal for businesses, investors, and academics, it supports PowerPoint, Keynote and Google Slides. This adaptable template is perfect for presenting geographic data analyses and exploring regional business potentials.


23 diapositivas
Orbit Marketing Strategy Plan Presentation
Elevate your marketing strategy presentations with this vibrant and dynamic template! Perfect for analyzing market trends, identifying target audiences, and outlining strategic objectives. Ideal for marketing professionals aiming to captivate their audience and drive results. Compatible with PowerPoint, Keynote, and Google Slides, this template ensures your strategy is clear, compelling, and effective.
7 diapositivas
Project Status Tracking Infographic
For any project manager or team leader, tracking the progress and status of projects is paramount. This project status tracking infographic simplifies this task, offering a visually appealing representation of every project phase. With a predominant palette of white and blue, this design captures attention and imparts clarity. Tailored for project managers, stakeholders, and team members, this infographic acts as a dynamic snapshot of ongoing tasks, completed milestones, and impending deadlines. Designed for seamless use with PowerPoint, Keynote, and Google Slides, it's your ultimate tool for effective project communication.


6 diapositivas
Territorial Presence Across the Globe Presentation
Visualize your worldwide footprint with this territorial presence map. Highlight key regions using color-coded markers linked to strategic points, teams, or operations. Ideal for corporate overviews, investor updates, and expansion plans. Fully editable and easy to customize in PowerPoint, Keynote, or Google Slides for impactful global presentations.


6 diapositivas
Economic Pyramid Infographic
Showcase economic structures with our Economic Pyramid Infographic, compatible with Powerpoint, Google Slides, and Keynote. This template is designed for economists, educators, and business professionals, providing a visual hierarchy of economic indicators or demographics. Each level of the pyramid represents a different segment, such as income brackets, consumer classes, or resource distribution. It's an ideal tool for presentations that require a clear depiction of economic stratification or market segmentation. Customizable and easy to understand, this infographic helps simplify complex economic data into digestible visual tiers for any audience.


7 diapositivas
Company Profile Structure Infographic
This series of templates is meticulously crafted to represent a company’s structure in a detailed and organized manner. Each template varies in design and layout, ensuring that there is a style to suit different business needs and preferences. From straightforward, clean layouts to more dynamic, visually engaging designs, these templates provide an excellent basis for companies to present their organizational structure, core team members, departmental divisions, and key business areas effectively. Key information such as company values, mission statements, and strategic objectives can be clearly highlighted, allowing companies to communicate their business essence and operational ethos to stakeholders. Each template also accommodates data visualization through charts, graphs, and infographics, which are instrumental in depicting growth trajectories, performance metrics, or demographic breakdowns. With customization options, these templates can be tailored to reflect a company's unique brand identity, including color schemes, typography, and corporate logos, making each presentation not only informative but also reflective of the company's image. This collection is ideal for corporate introductions, stakeholder meetings, and internal presentations aimed at fostering a clear understanding of the company’s operational framework and strategic direction.


5 diapositivas
Breast Cancer Awareness Day
Raise awareness and educate with this visually impactful Breast Cancer Awareness Day template. Featuring circular infographic elements styled in a breast tissue-inspired layout, this slide design is ideal for campaigns, health education, corporate wellness events, and social initiatives. Each section can be customized with key data, statistics, or actionable messages. Fully editable in PowerPoint, Keynote, and Google Slides.


5 diapositivas
Business Objectives and Strategic Goals Presentation
Clarify your roadmap to success with this visually structured Business Objectives and Strategic Goals slide. Featuring five segmented goal icons arranged in a semi-circle layout, this template is perfect for strategic planning, quarterly reports, and team briefings. Each section allows space to detail your specific objectives with matching visuals for easy comprehension. Fully editable in PowerPoint, Keynote, and Google Slides.
6 diapositivas
Team Objective Tracker and Milestone Plan Presentation
Stay on top of team goals with the Team Objective Tracker and Milestone Plan Presentation. Designed for performance reviews, progress reports, or planning meetings, this template visualizes KPIs with clarity. Each slide is fully customizable in PowerPoint, Keynote, or Google Slides—ideal for project leads and department managers.


7 diapositivas
Milestones Infographic Presentation Template
Our milestones infographic template includes a professional background and imagery to create a high-quality presentation that’s sure to grab your audience’s attention. This template is full of visual and engaging elements that will draw your audience in. It's a great starting point to make your own presentation, or to use as a template for future presentations. All slides are fully editable in PowerPoint so you can add and change text and images as desired, It's very easy to edit and customize the shapes and colors. Use this high-resolution template to present your topic in a professional way!


6 diapositivas
Academic Science Infographic Presentation
Bring your scientific insights to life with a clean, engaging slide that turns complex concepts into an easy-to-follow visual story. This presentation highlights key academic data through connected icons and structured text, helping you explain research findings clearly and confidently. Fully compatible with PowerPoint, Keynote, and Google Slides.


4 diapositivas
Market Research Survey Insights Presentation
Showcase key data from your latest research with this bold, megaphone-themed survey slide. Ideal for presenting percentages and key findings side-by-side, this layout draws attention to market trends, consumer feedback, or audience segmentation. Fully editable in PowerPoint, Keynote, and Google Slides.


7 diapositivas
Executive Summary Infographic Presentation Template
An Executive Summary is a document that provides an overview of the main points of a larger report. It is often written to share with individuals who may not have time to review the entire report. The executive summary provides a summary that sets out what's in the report, who it is written for, what it covers and why it's important. Use this template to create a powerful summary, which makes it easier to communicate your engagement results and outline your most important points. This template was designed to suggest a number of ways to enhance your executive summary and make it more persuasive.
20 diapositivas
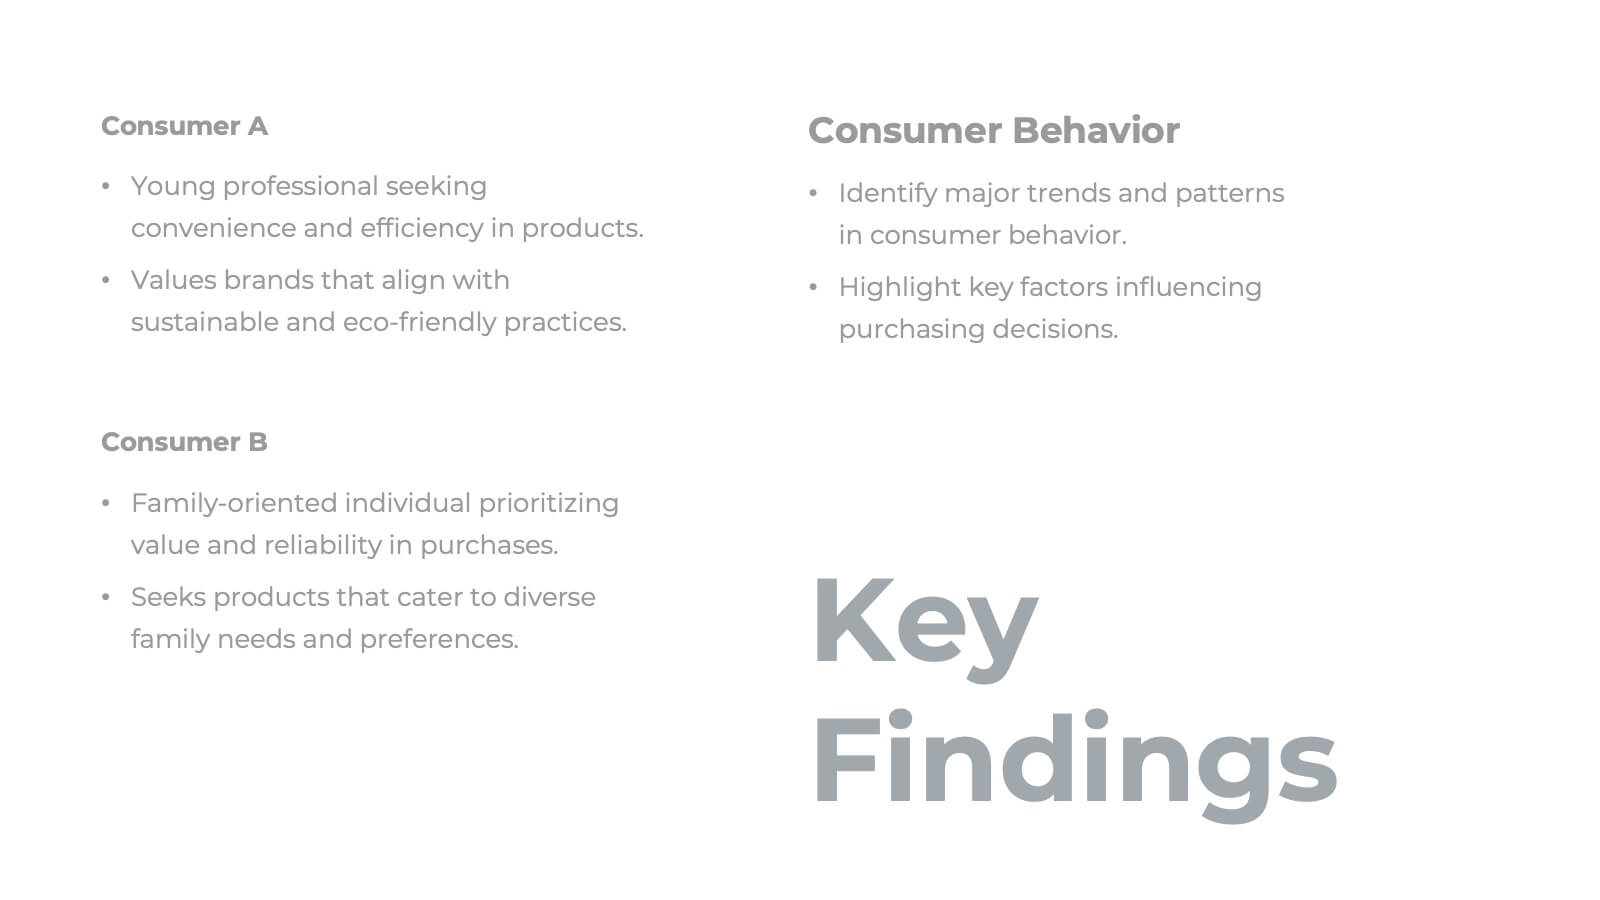
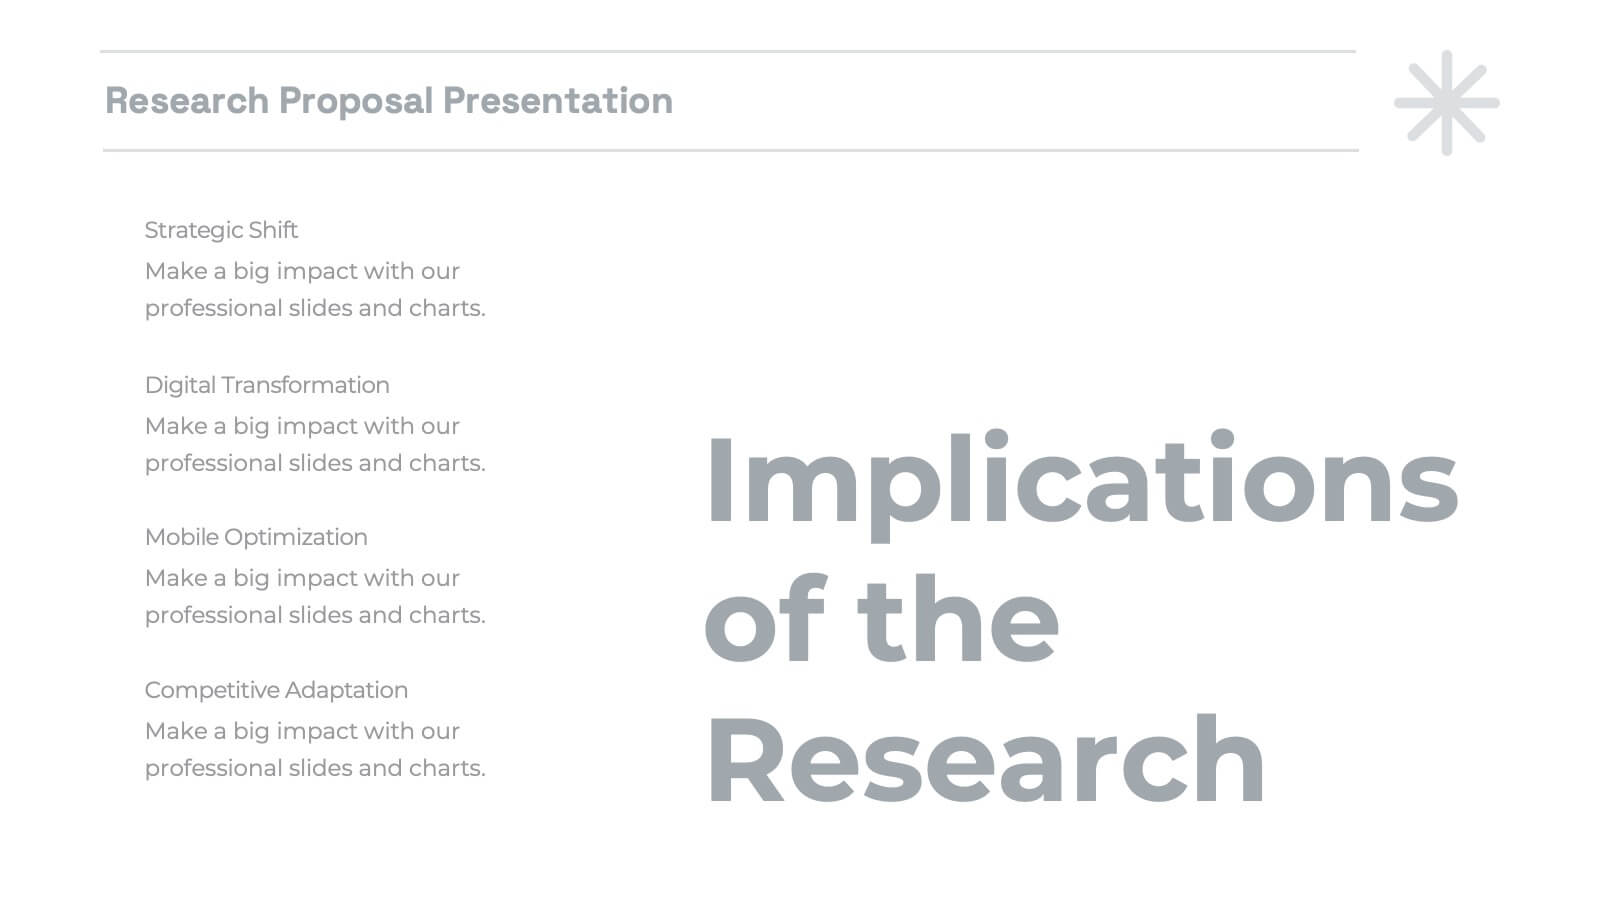
Malachite Research Proposal Presentation
Present your research findings with clarity and professionalism using this structured research presentation template! Covering all essential elements, from research objectives and methodology to key findings and implications, this template ensures your work is communicated effectively. It's perfect for academic, corporate, or scientific presentations. Compatible with PowerPoint, Keynote, and Google Slides, it's versatile and ready for your next project.


21 diapositivas
Blaze Blitz Graphic Design Project Plan Presentation
Introducing the Blaze Black Design Project Plan template—where sophistication meets functionality! This visually striking template is designed to captivate your audience with its bold black and white theme, exuding professionalism and creativity. Perfect for designers and creative agencies, this template is meticulously structured to guide your project from concept to completion. Each slide is designed to highlight key aspects like the Design Brief, Concept Development, Target Audience, and Design Process, ensuring your message is conveyed with clarity and impact. The sleek typography, combined with high-contrast visual elements, enhances readability while adding a modern edge to your presentation. Whether you're pitching a new design project, showcasing your design process, or planning your next creative endeavor, this template is your go-to tool for delivering presentations that leave a lasting impression. Compatible with PowerPoint, Keynote, and Google Slides, it's fully customizable to fit your brand and style. Get ready to wow your audience with this powerful design template!


21 diapositivas
Astral Startup Business Plan Presentation
This sleek and professional Startup Business Plan template is designed to help you convey your startup’s potential to investors and stakeholders effectively. With a minimalist design and a structured flow, it covers all essential aspects of your business plan, from mission and vision to financial overview and growth plan. Each slide is crafted to present critical information in a clear and concise manner, making it easier for your audience to grasp the key points. This template is fully compatible with PowerPoint, Keynote, and Google Slides, allowing you to customize it to suit your branding and presentation style. Use this template to create a compelling and impactful presentation that will leave a lasting impression on your audience.