


Características


¿Tienes alguna pregunta?
Recomendar


6 diapositivas
Customer Needs and Segmentation Profile Presentation
Pinpoint what truly drives your audience with the Customer Needs and Segmentation Profile Presentation. This template helps you clearly map customer motivations, preferences, and pain points through segmented icons and visuals. Ideal for marketers and business analysts. Fully editable in Canva, PowerPoint, or Google Slides for easy customization.


7 diapositivas
Business Funnel Infographic Presentation
A Funnel Infographic is used to help communicate the stages of a sales funnel in a transparent and visually appealing way. This is a marketing model that is used to track the journey from project to profit. This template includes a series of funnel-shaped graphics that represent the different stages of the sales funnel. You can customize this template with your own content, colors, and fonts to suit your specific needs. Add your own text to each stage of the funnel, and use the additional icons to represent each stage in more detail. Convey your marketing message with this Infographic!


5 diapositivas
4-Level Hierarchy Tree Presentation
Bring your ideas to life with a smooth, layered flow that feels modern and engaging from the very first glance. This presentation helps you break down complex structures into four clear levels, making information easy to follow and visually compelling. Perfect for explaining processes, roles, or systems with clarity. Fully compatible with PowerPoint, Keynote, and Google Slides.


6 diapositivas
Market Challenges and Resilience Strategy Presentation
Tackle volatility with clarity using the Market Challenges and Resilience Strategy presentation. This slide features a modern smartphone graphic surrounded by six key strategy zones, each with its own icon and text area—ideal for outlining market pressures, competitive moves, or adaptive responses. Use it to communicate resilience frameworks, digital transformation steps, or scenario planning. Fully customizable in PowerPoint, Keynote, and Google Slides.


6 diapositivas
Business Flow Chart Design Presentation
Bring clarity and momentum to your process with a clean, visual layout that turns complex steps into an easy-to-follow flow. This presentation helps teams map stages, responsibilities, and progress with confidence, making it perfect for planning, strategy, and operations. Fully compatible with PowerPoint, Keynote, and Google Slides.


26 diapositivas
Tempo Brand Identity Presentation
Introduce and elevate your brand with this versatile presentation template designed to reflect your company's vision and values. Perfect for businesses looking to showcase their brand strategy, components, and touchpoints with clarity and professionalism. This presentation features thoughtfully designed slides covering brand identity components, visual guidelines, target audience insights, and future development plans. Use dedicated sections to outline your unique selling proposition, positioning, and strategy. With its clean layout and attention to detail, it's ideal for presenting a cohesive and impactful brand narrative. Compatible with PowerPoint, Google Slides, and Keynote, this template is fully customizable. Edit colors, text, and images to align with your brand aesthetics and messaging. Deliver your presentation with confidence, ensuring your audience is inspired by a polished and professional brand identity.


21 diapositivas
Ecliptica Design Strategy Proposal Presentation
Elevate your design strategy proposals with this clean and professional presentation template. Featuring a structured layout, it covers essential sections like design briefs, target audience analysis, concept development, and final presentation deliverables. Visuals such as wireframes, design process breakdowns, and project timelines help convey your creative ideas effectively. With placeholders for typography, color schemes, and visual direction, this template is tailored for creative professionals, agencies, and designers. Easily adaptable to suit your branding needs, it's compatible with PowerPoint, Google Slides, and Keynote for seamless customization and presentation. Perfect for pitching new strategies or showcasing your design process.


4 diapositivas
Side-by-Side Comparison Butterfly Chart Presentation
Compare data clearly and effectively with the Side-by-Side Comparison Butterfly Chart Presentation. This layout is perfect for showcasing performance metrics, survey results, or A/B comparisons in a symmetrical, easy-to-read format. Editable in Canva, PowerPoint, Google Slides, and Keynote to match your brand and presentation style effortlessly.


6 diapositivas
5-Step Implementation for Business Growth Presentation
Present your strategic plan with clarity using the 5-Step Implementation for Business Growth Presentation. This horizontal arrow layout guides your audience through five key phases of execution—from planning to final results. Each step is clearly numbered and color-highlighted for visual flow. Fully editable in PowerPoint, Keynote, Google Slides, and Canva.


5 diapositivas
USA Economy Infographics
The U.S. economy has a significant impact on the global economy and serves as a benchmark for economic performance. These vertical infographics are the perfect tool to present your key facts, statistics, and trends to help the audience understand the economic landscape of the country. The visually appealing design included, coupled with concise and relevant information, helps to effectively communicate the complexities of the economy. Whether used for educational purposes or as a reference tool, these templates provides a comprehensive overview of the USA economy and its key components. Fully compatible with Powerpoint, Keynote, and Google Slides.
22 diapositivas
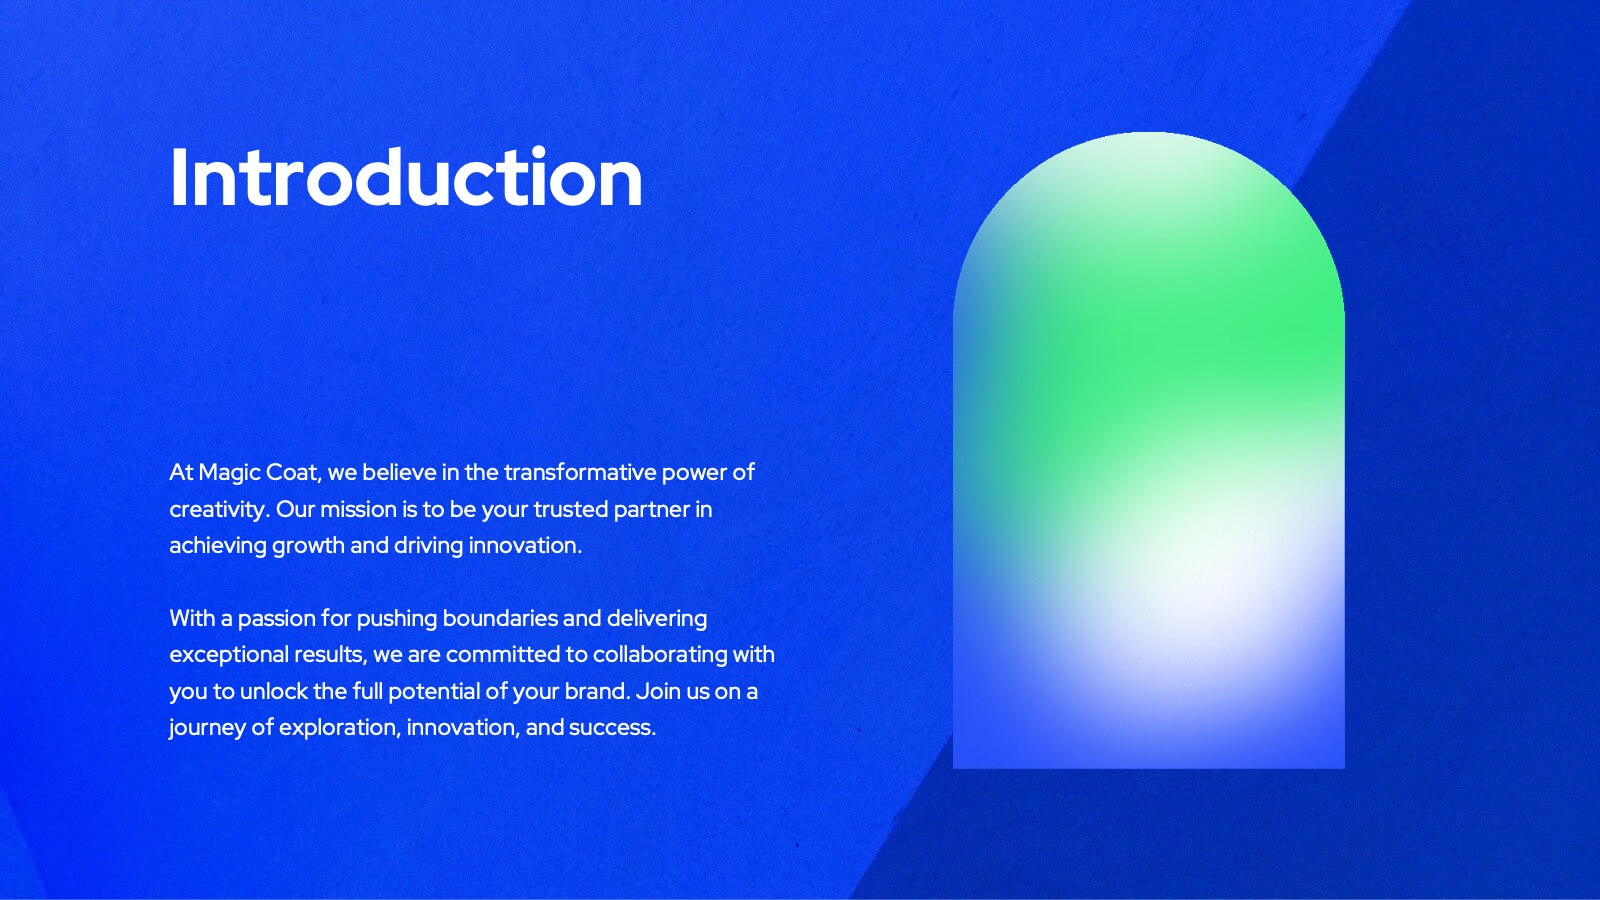
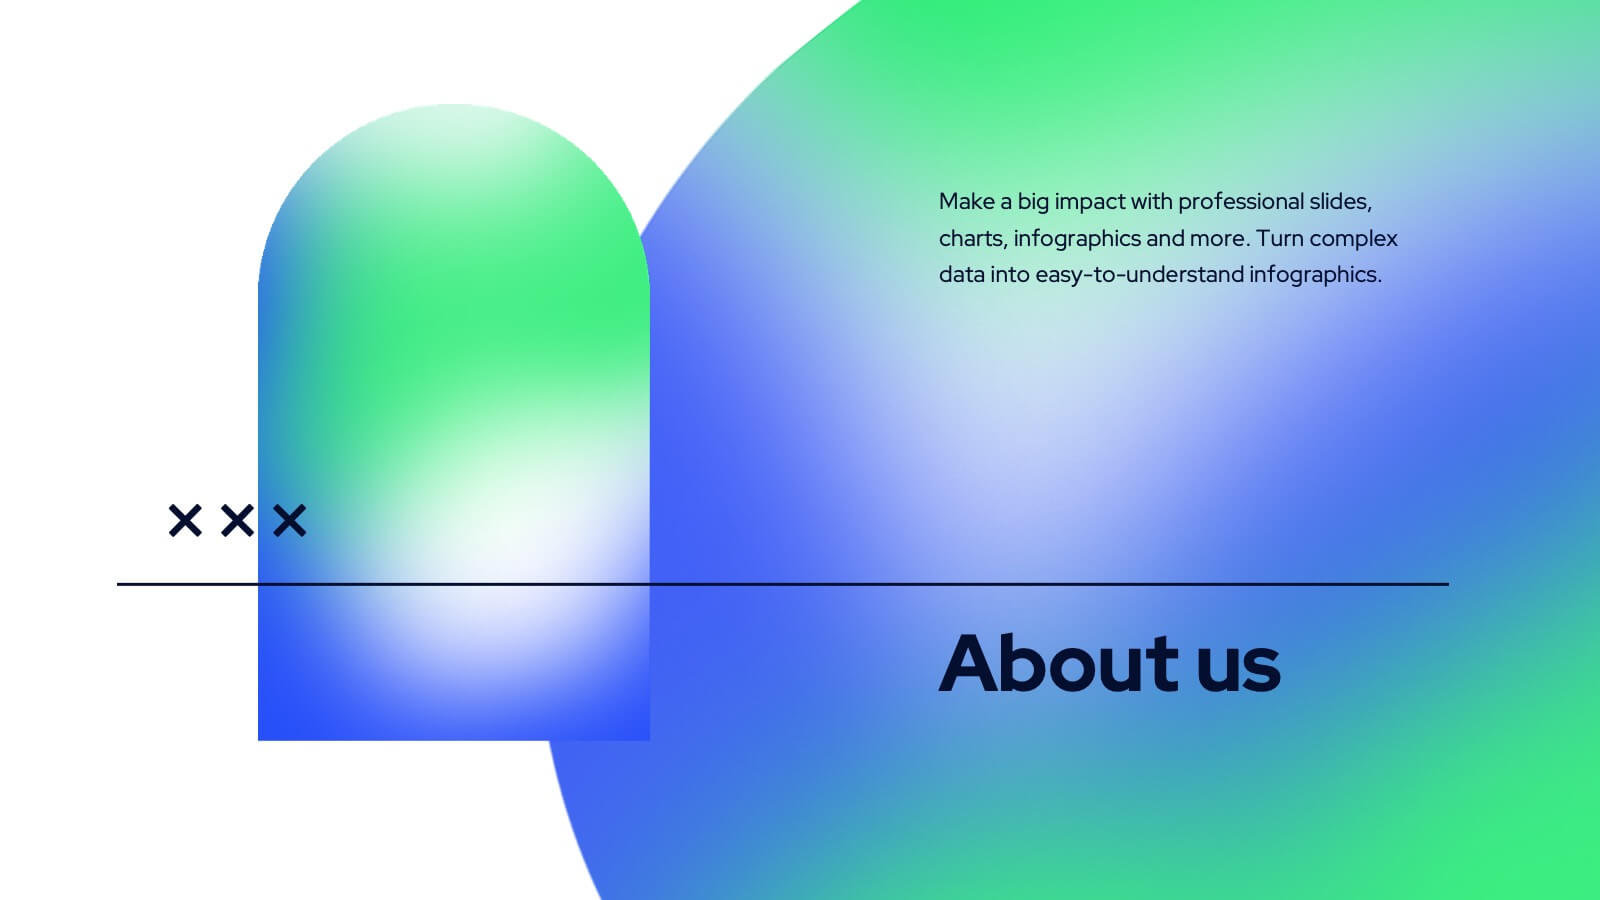
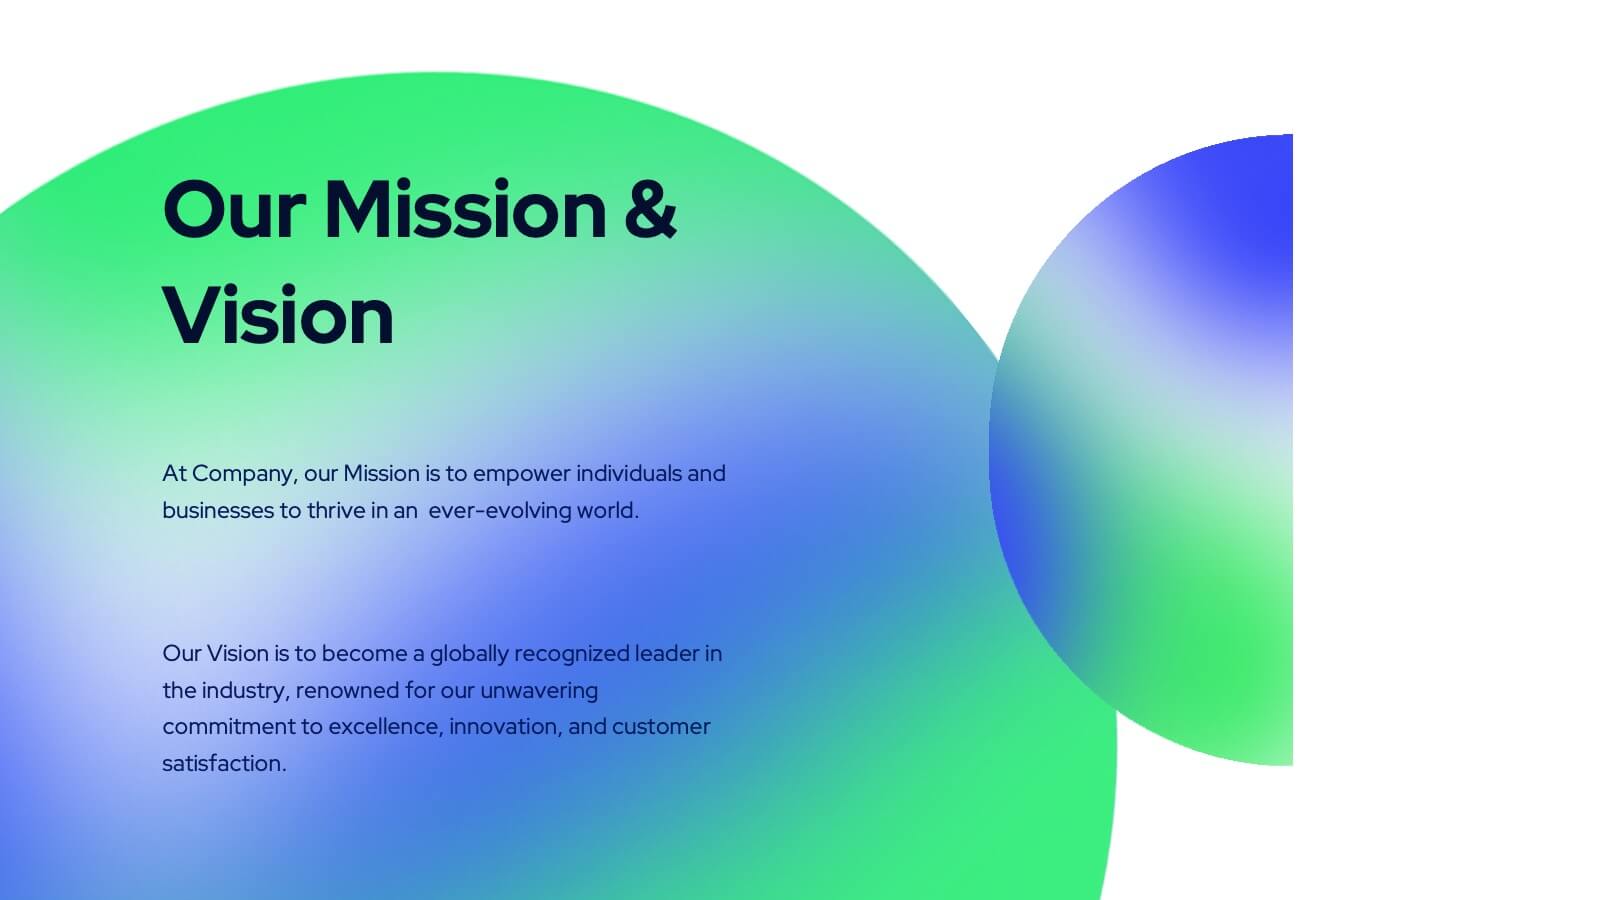
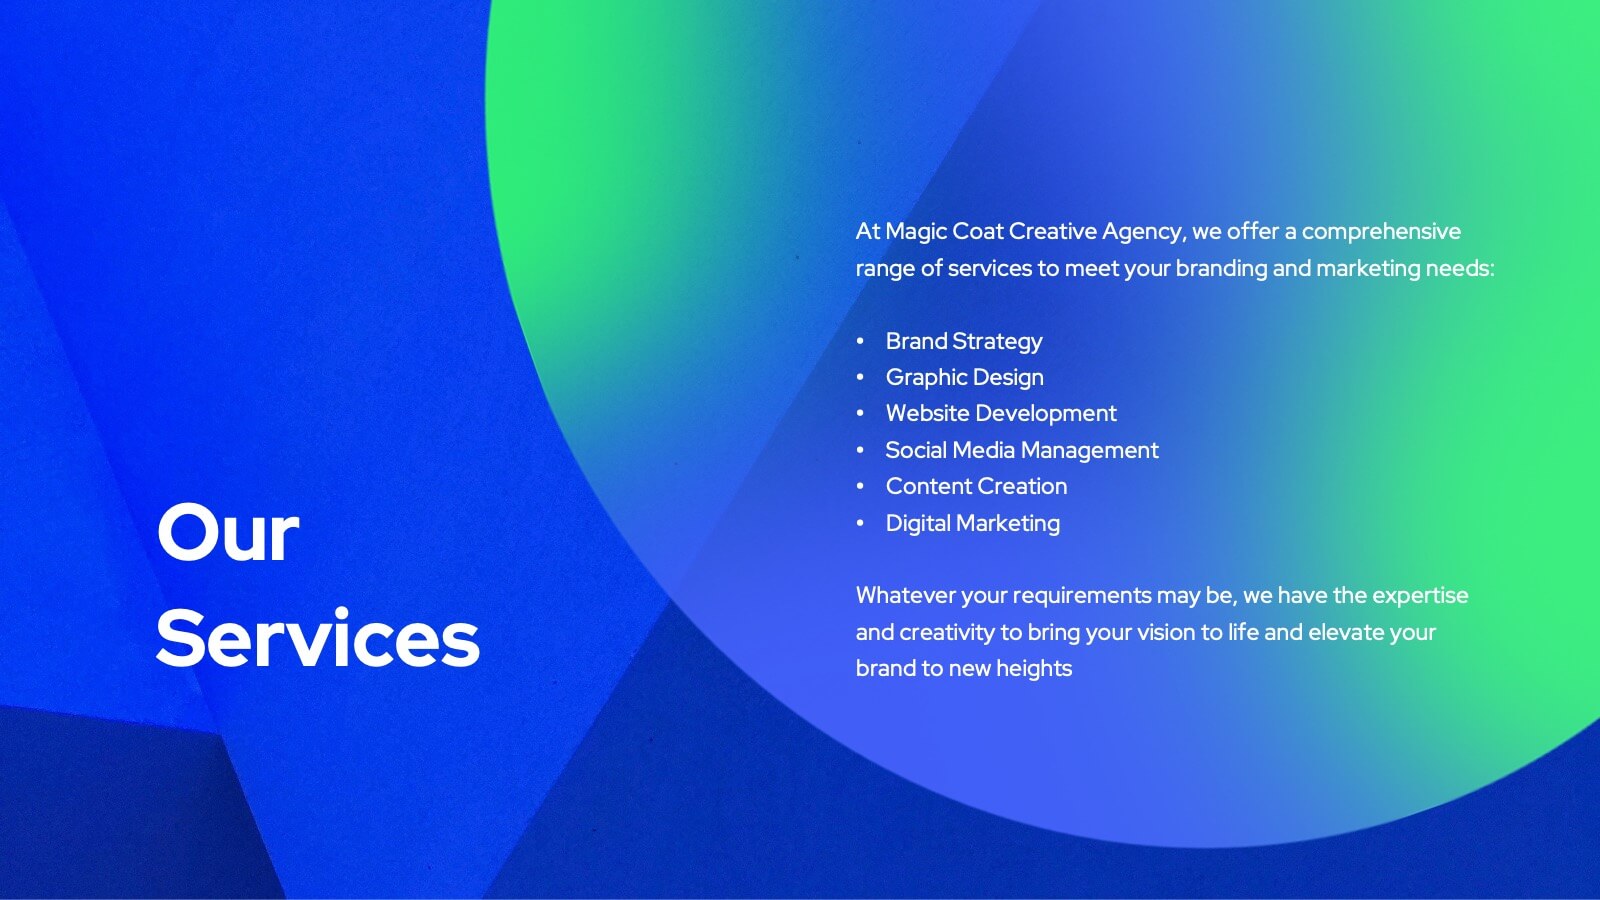
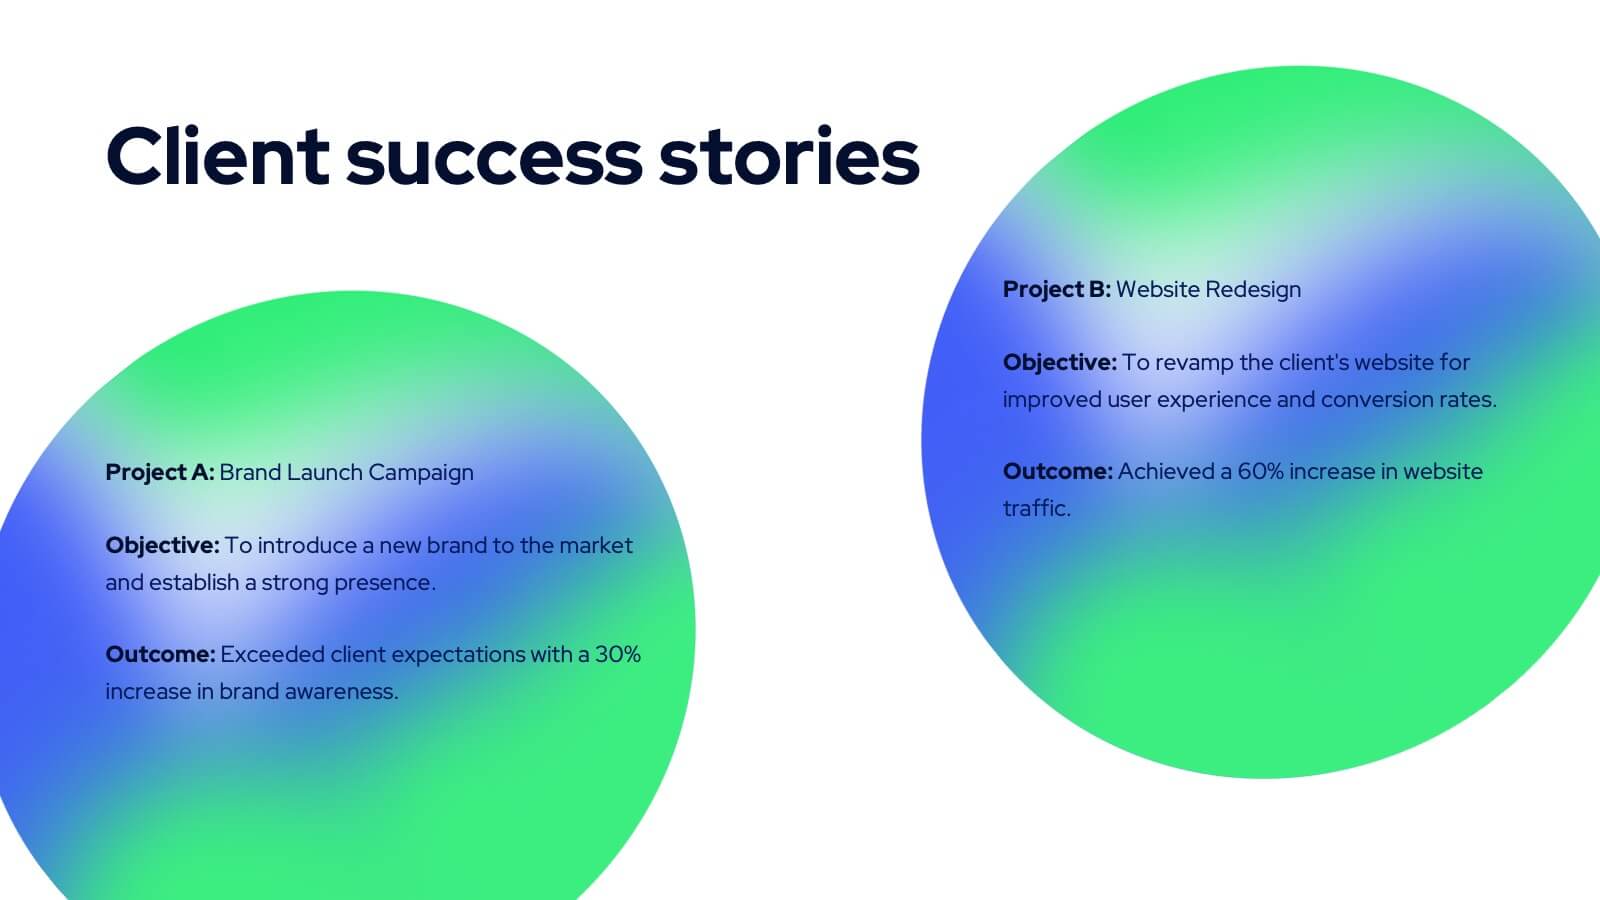
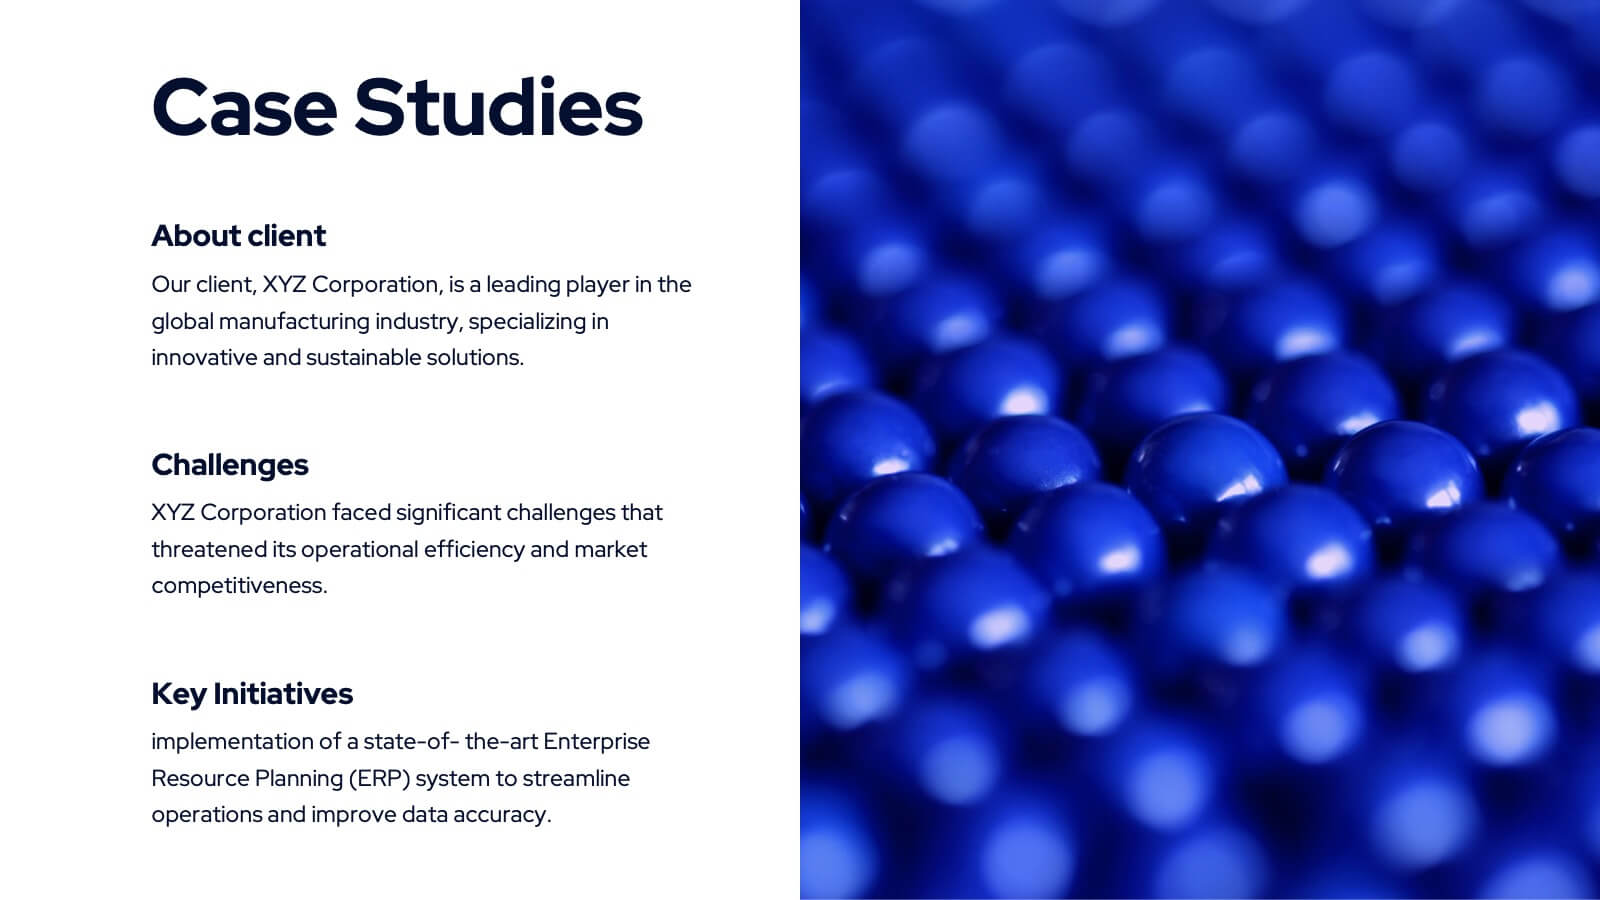
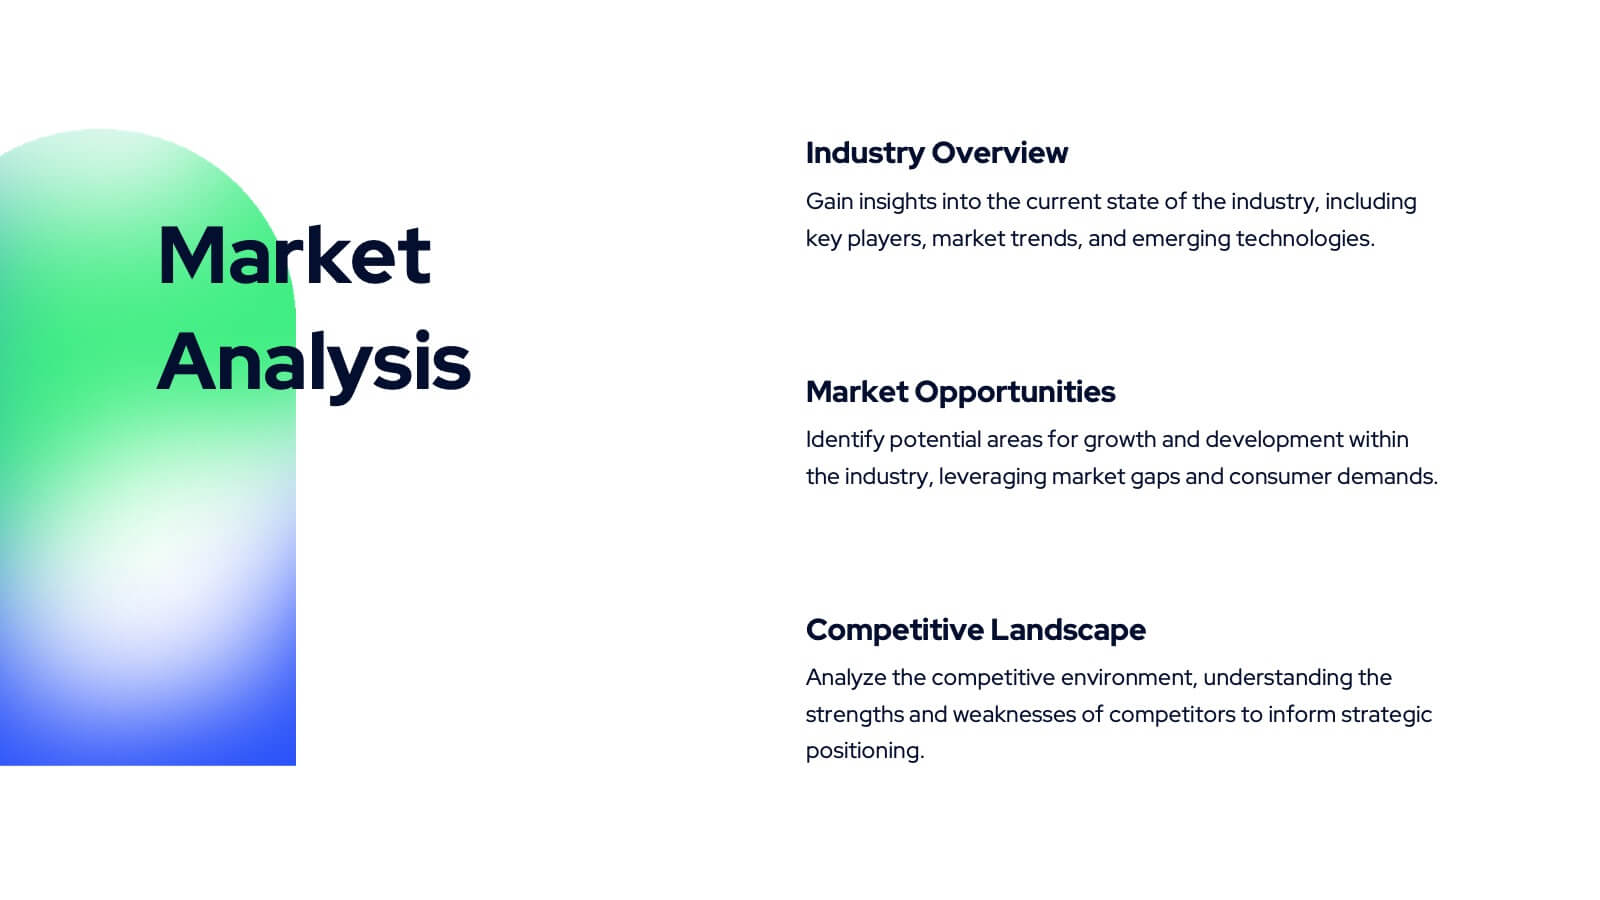
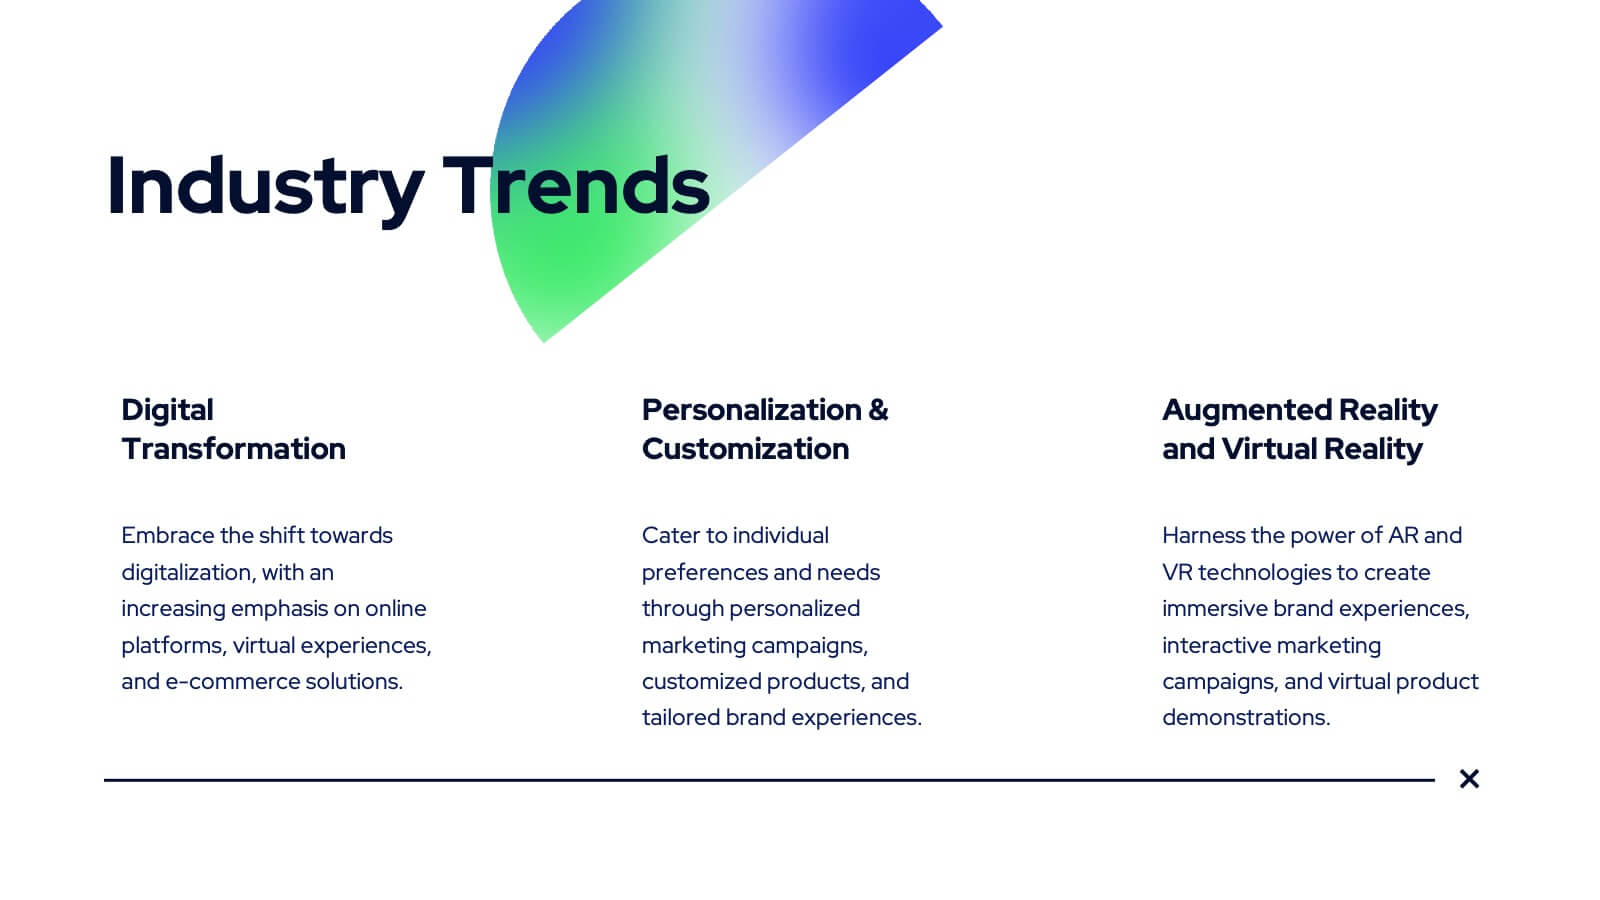
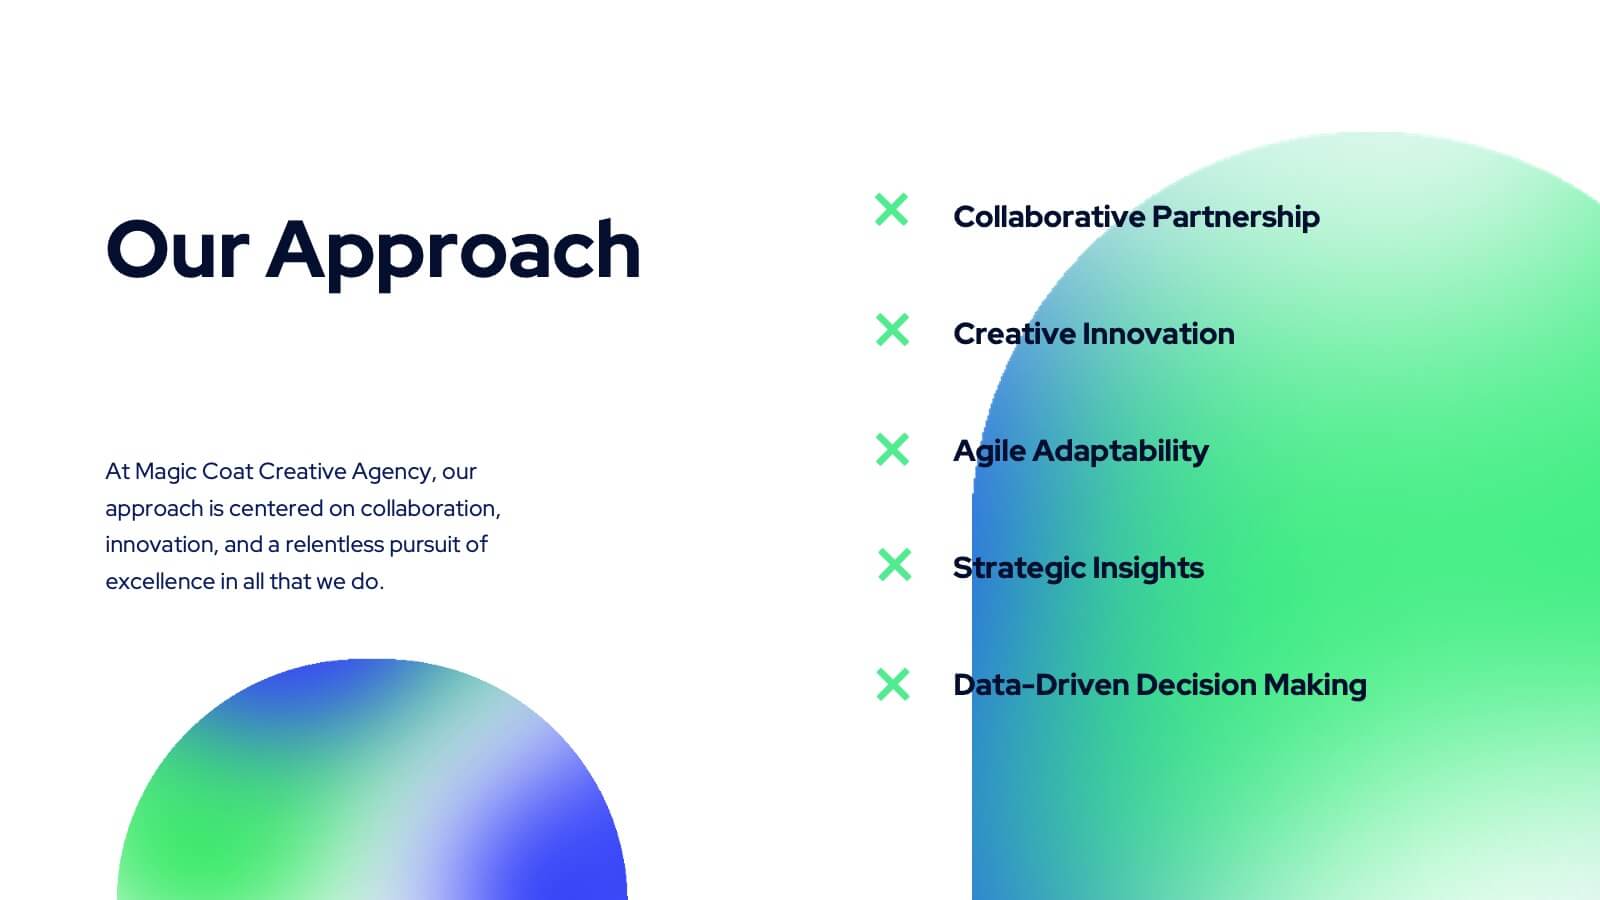
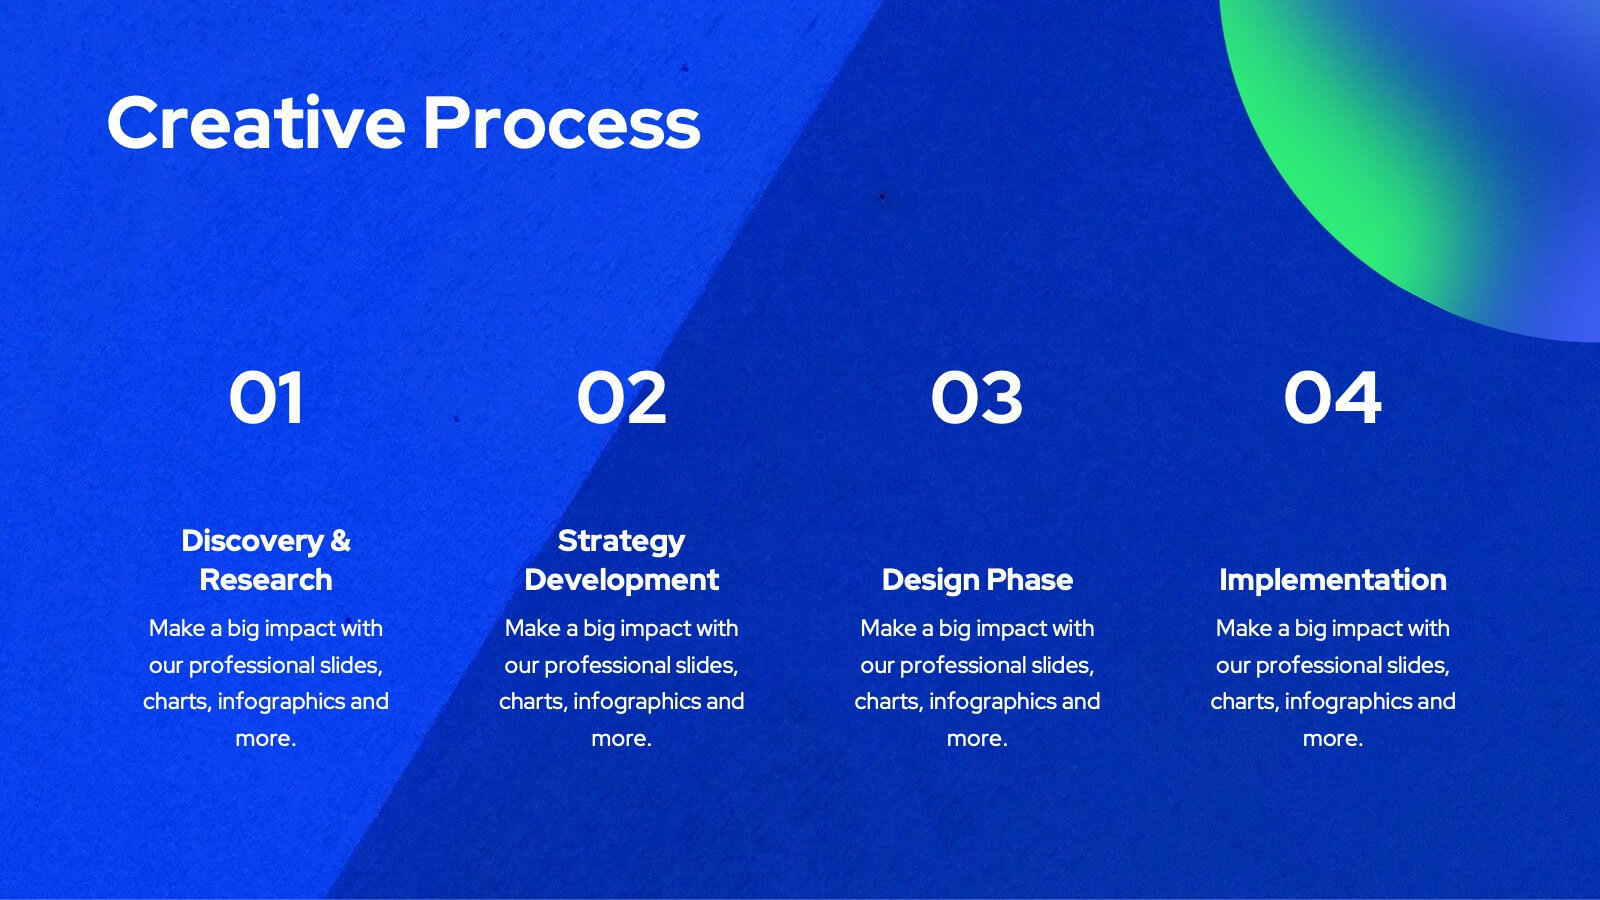
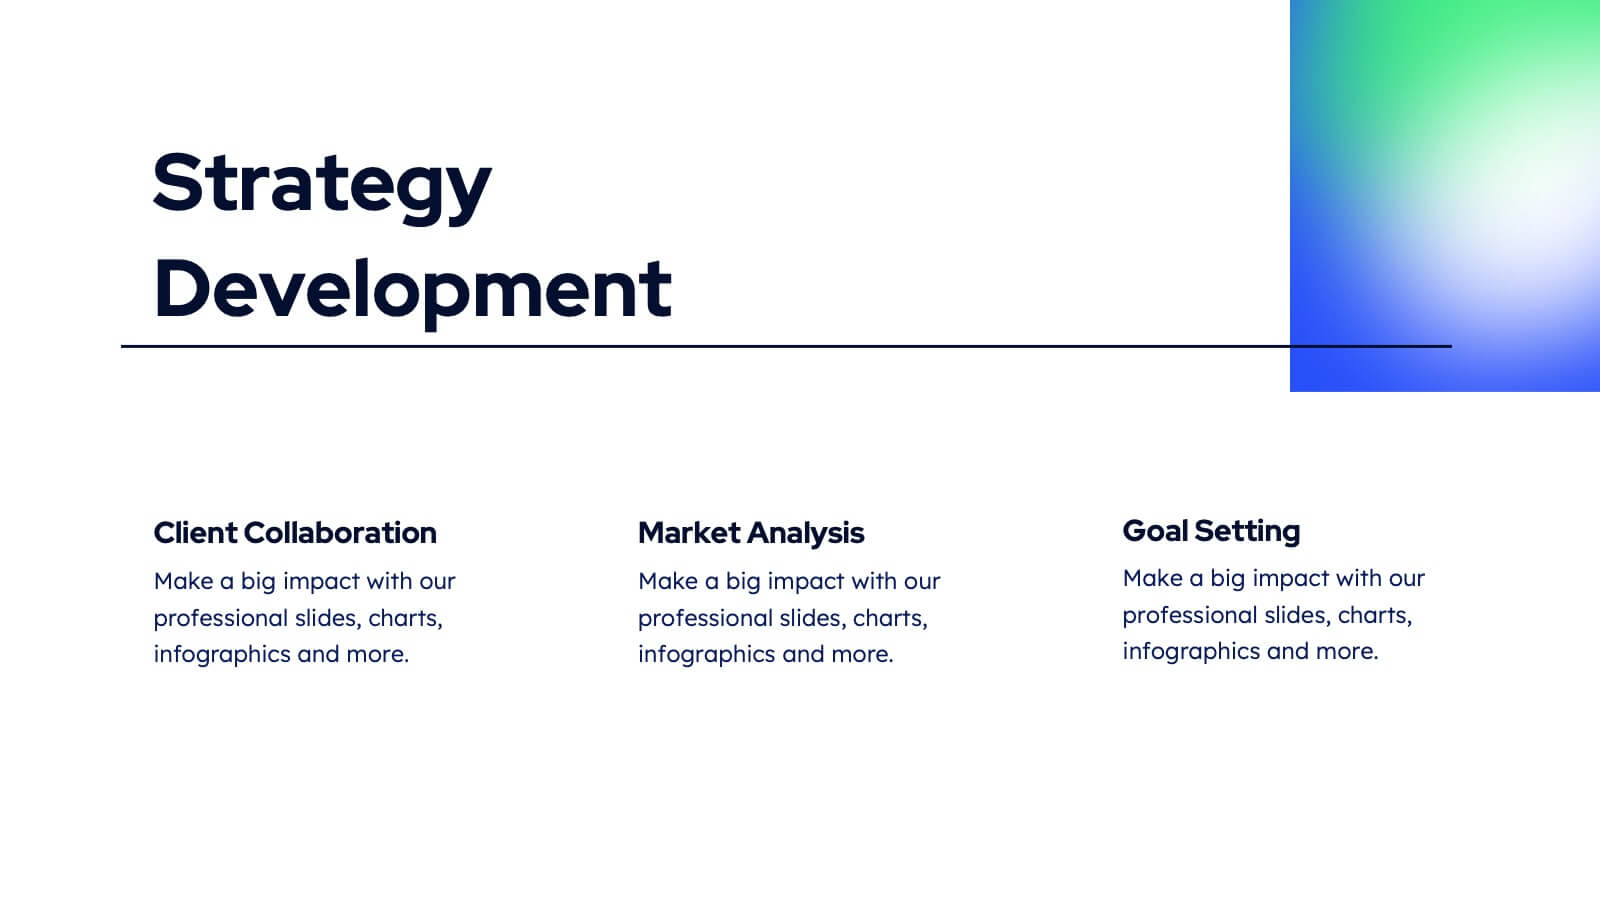
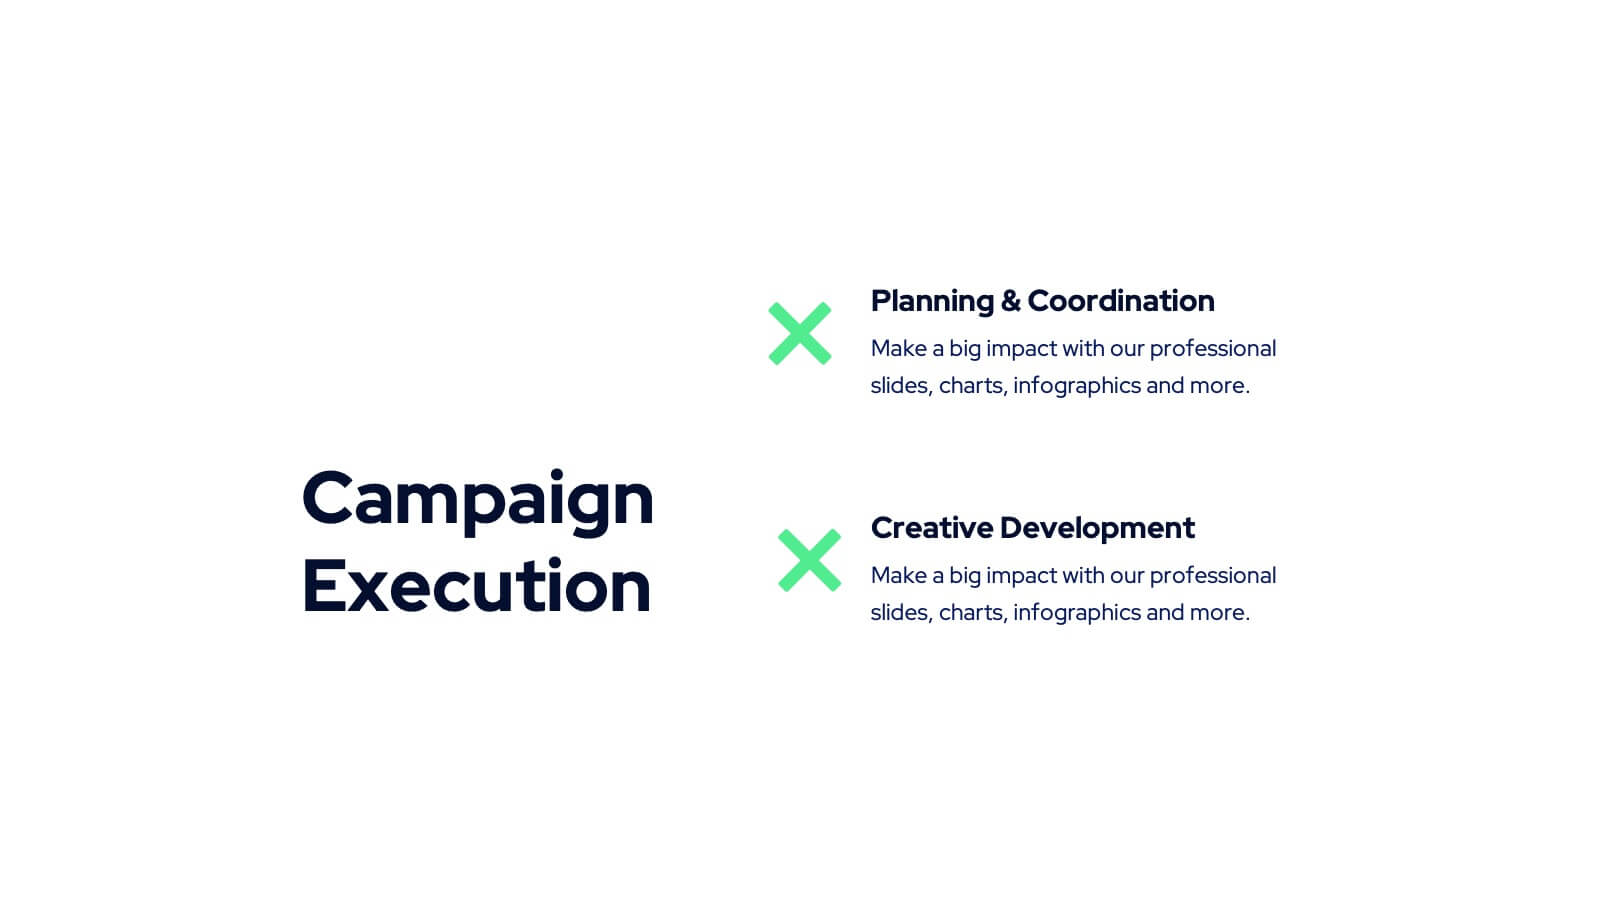
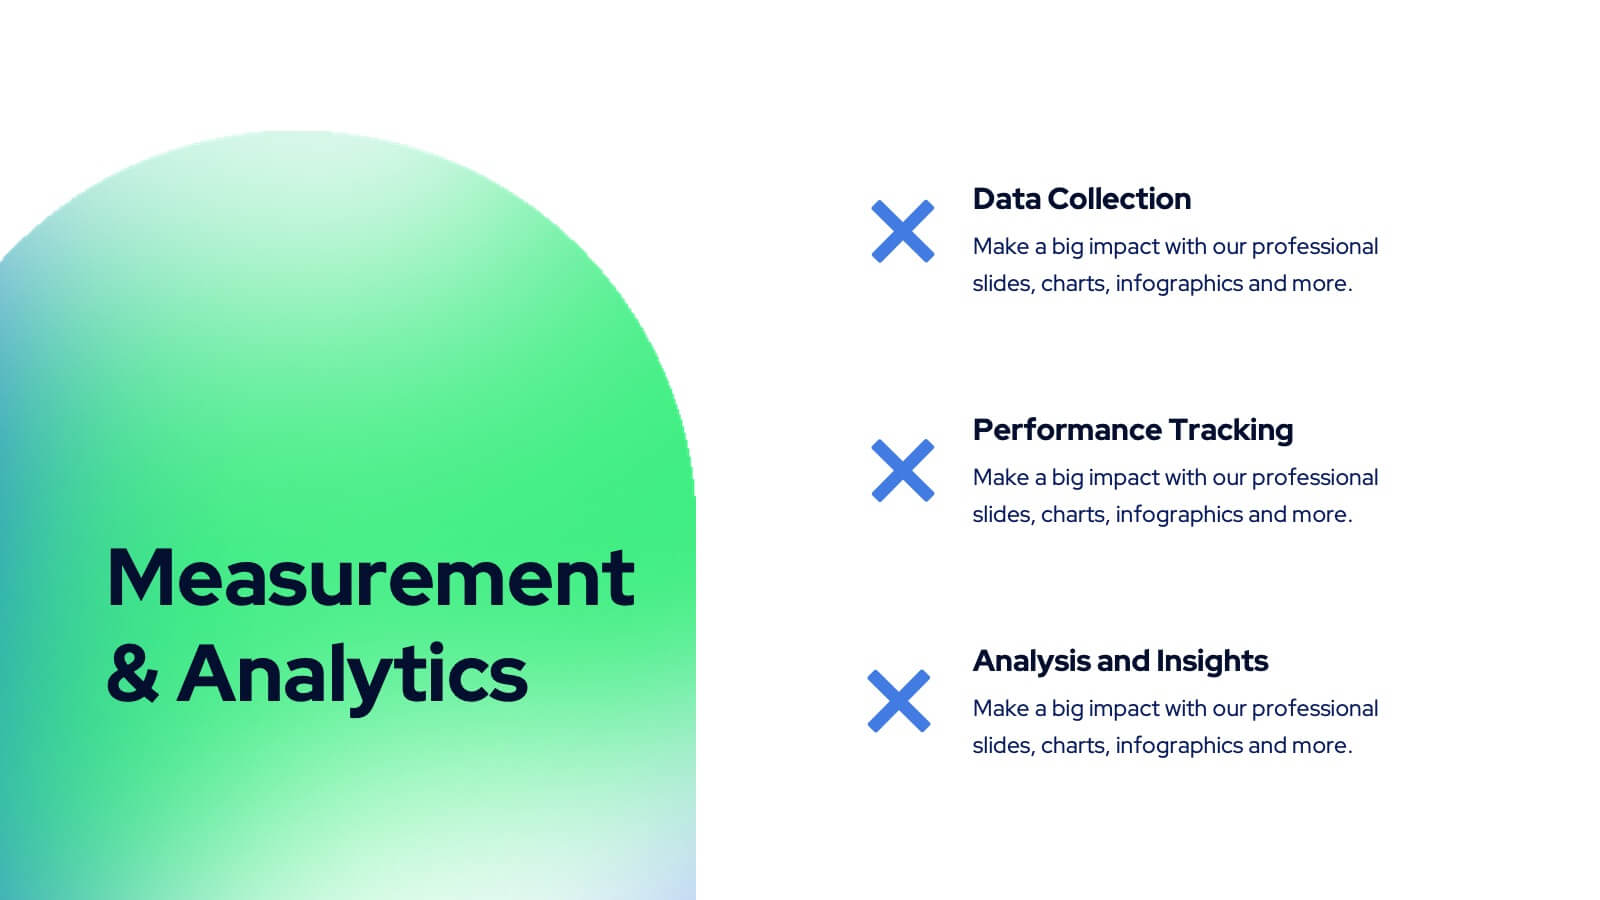
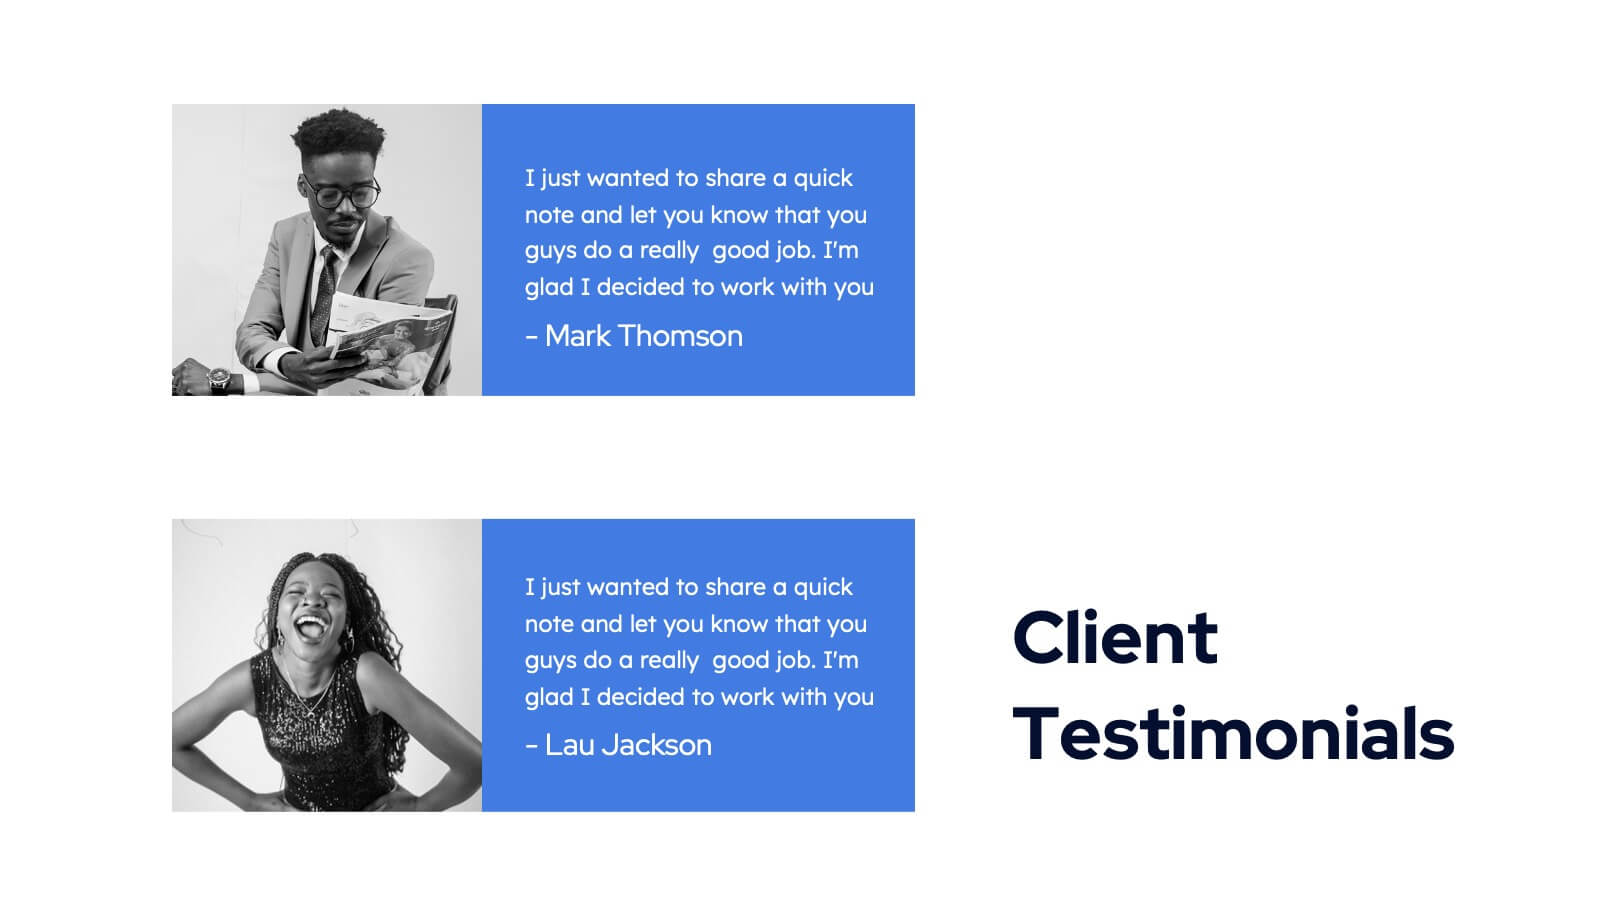
Tanzanite Full-Service Agency Project Plan Presentation
Showcase your agency's strengths with this bold and modern portfolio presentation template! From client success stories and case studies to market analysis and strategy development, this template highlights your expertise and approach. Perfect for agencies looking to present their services, creative processes, and partnerships. Compatible with PowerPoint, Keynote, and Google Slides, making it easy to impress any audience.


6 diapositivas
Iceberg Business Infographic
Delve beneath the surface with our Iceberg Business Infographic, perfect for Powerpoint, Google Slides, and Keynote. This infographic is designed to illustrate the underlying factors that impact an organization's success. The iceberg metaphor visually represents the concept that only a small part of a company's situation is visible above the surface, while much more is hidden below. The customizable segments can be used to detail various aspects of business operations, risks, and opportunities that are not immediately apparent. By employing this Iceberg Business infographic, you can effectively communicate the complexities of business strategies.


21 diapositivas
Dreamwood Sales Pitch Deck Presentation
Deliver powerful sales presentations with this vibrant and engaging sales pitch deck template! It provides all essential sections, including sales objectives, customer testimonials, pricing strategy, and performance metrics, to help you leave a lasting impact. Perfect for business teams and client pitches, it’s compatible with PowerPoint, Keynote, and Google Slides for seamless customization.


7 diapositivas
Growth Challenges Infographic
Navigating the path to success often involves understanding both growth and challenges. The growth challenge infographic, adorned in refreshing shades of green, white, and blue, provides an intuitive representation of these dual trajectories. Whether you're a startup striving for market traction or an established entity mapping out expansion strategies, this template crystallizes your journey. Business analysts, strategy consultants, and team leads will find this tool invaluable for driving insights and fostering discussions. Enhanced for compatibility with PowerPoint, Keynote, and Google Slides, this infographic is your visual ally in narrating business tales.


8 diapositivas
Business Competitive Analysis
Break down your market strategy into clear, actionable steps with this streamlined analysis slide. Featuring an 8-step horizontal layout with bold icons and color-coded segments, it helps visualize competitive research and planning at a glance. Easily customizable in PowerPoint, Keynote, and Google Slides.


26 diapositivas
Maev Presentation Template
Maev is a perfect modern template with a clean and professional feel. Maev was designed by professionals to help businesses connect with their audience. This template has a modern, chic aesthetic and very detailed look which is extremely appealing. The colors are fresh which help keep the look clean and easy to read. The theme comes packed with features to target your audience and help you get your message across. Charts, timelines and easy to edit text, this template is perfect for businesses seeking to make an impression on their audience. by demonstrating they are transparent and reliable.


4 diapositivas
RACI Responsibility Assignment Matrix
Streamline your project roles with this clear and customizable RACI Matrix template. Easily define who's Responsible, Accountable, Consulted, and Informed across tasks or phases. Perfect for project managers, team leads, and business strategists. Fully editable in PowerPoint, Keynote, and Google Slides.