


Características


¿Tienes alguna pregunta?
Recomendar


7 diapositivas
Housing Investment Strategy Presentation
Visualize housing strategies with this clean, key-focused layout. Featuring a central house-and-key icon flanked by six sections, this slide is perfect for outlining investment stages, market insights, or project milestones. Fully editable in Canva, PowerPoint, and Google Slides—ideal for real estate professionals, developers, or analysts presenting actionable housing strategies.


24 diapositivas
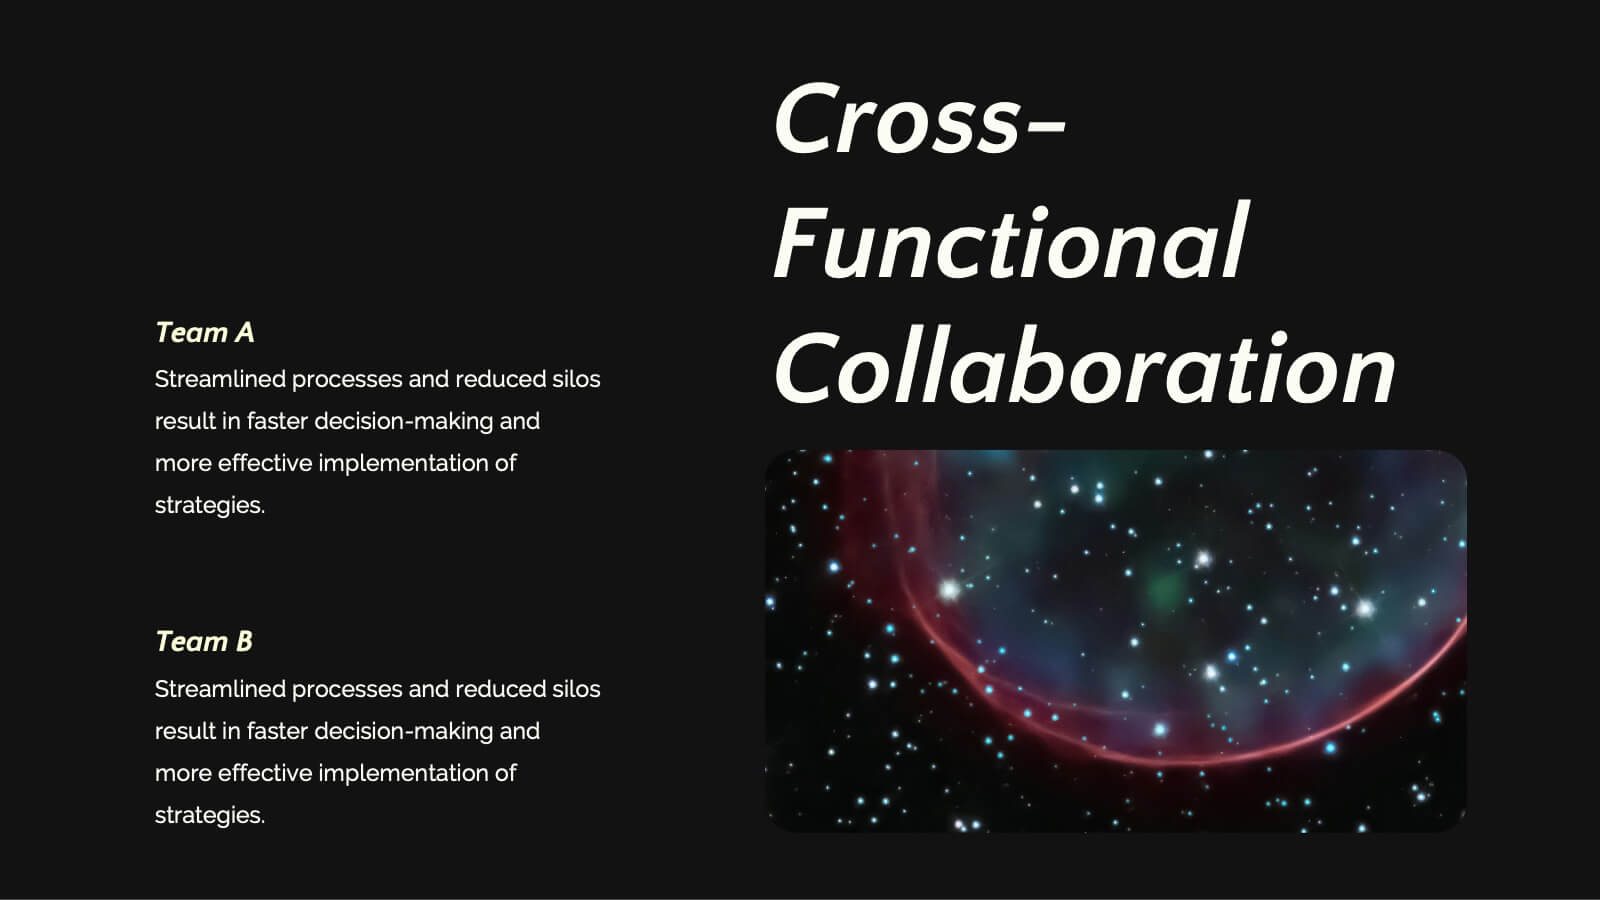
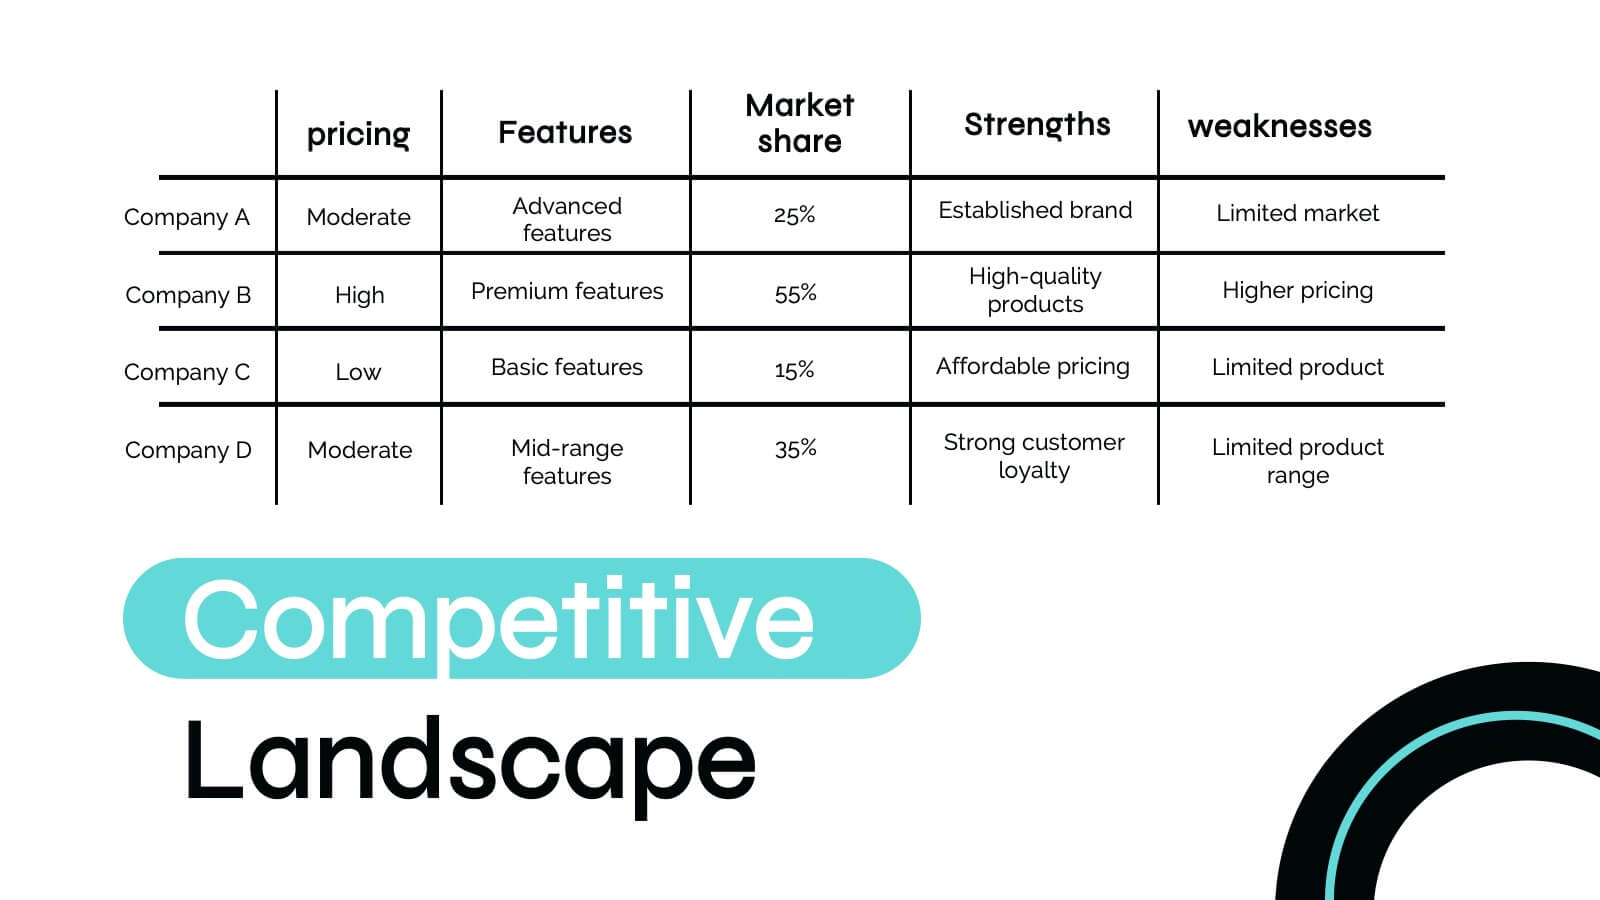
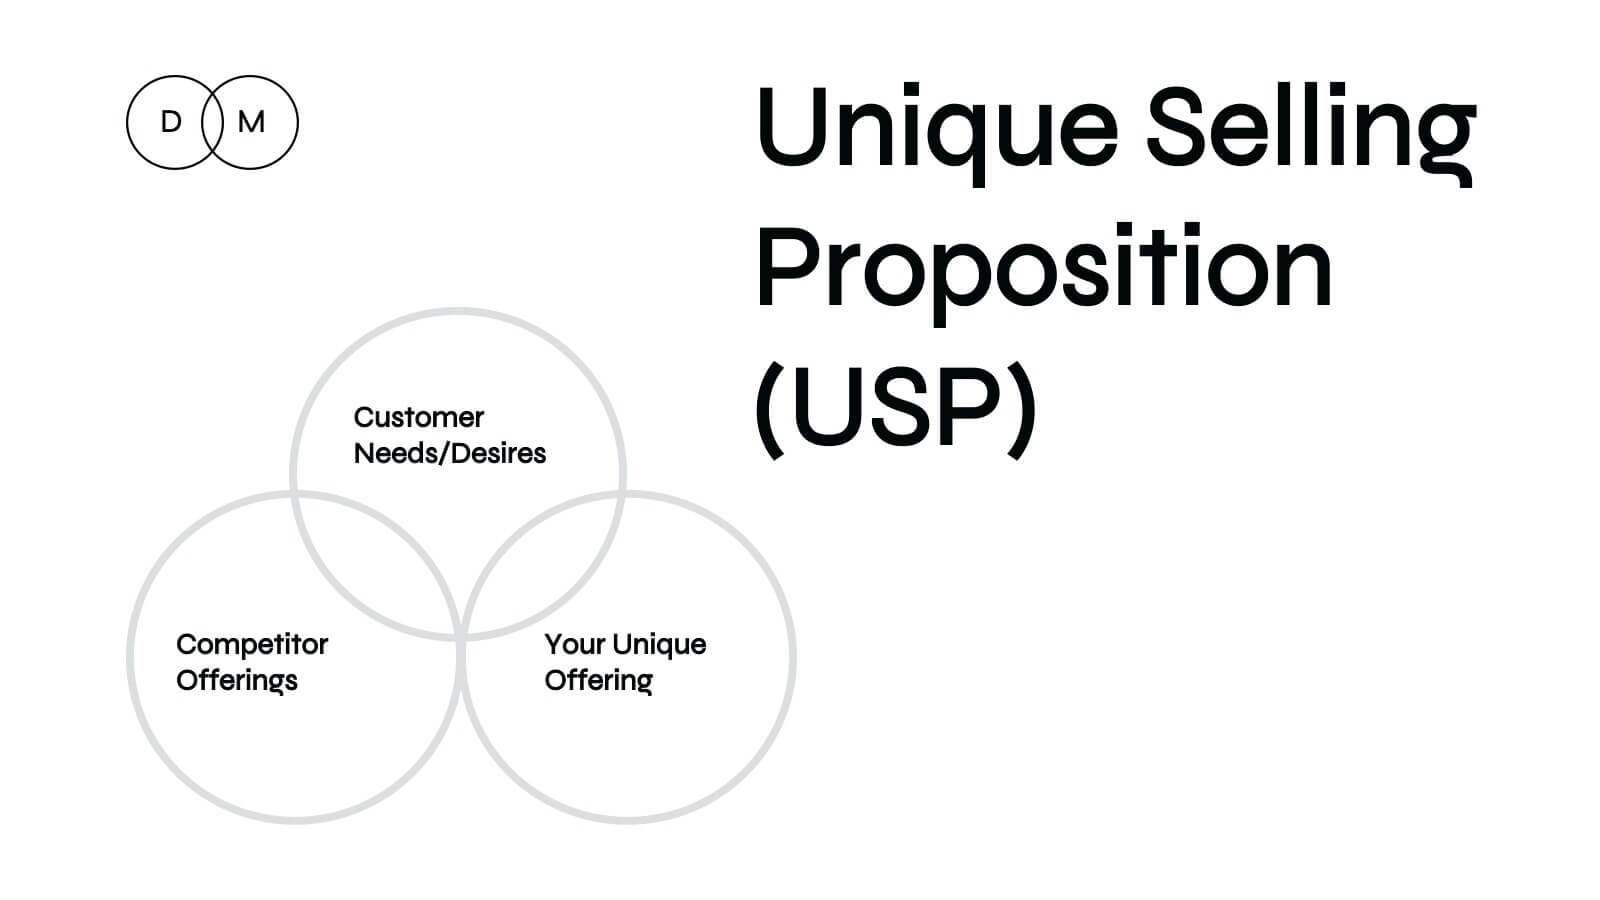
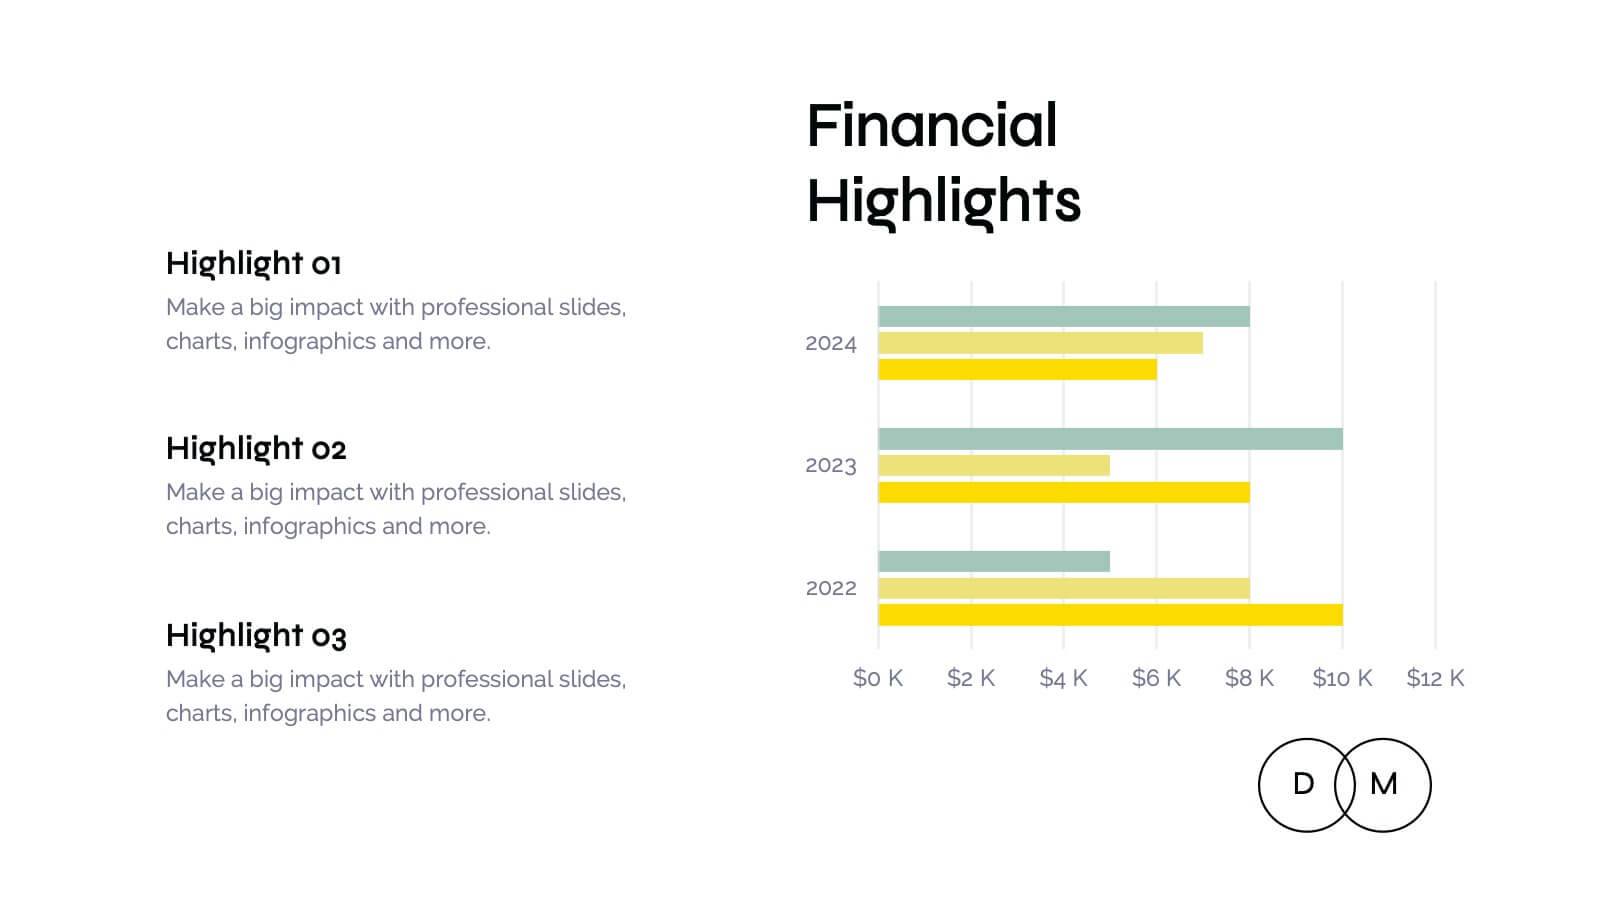
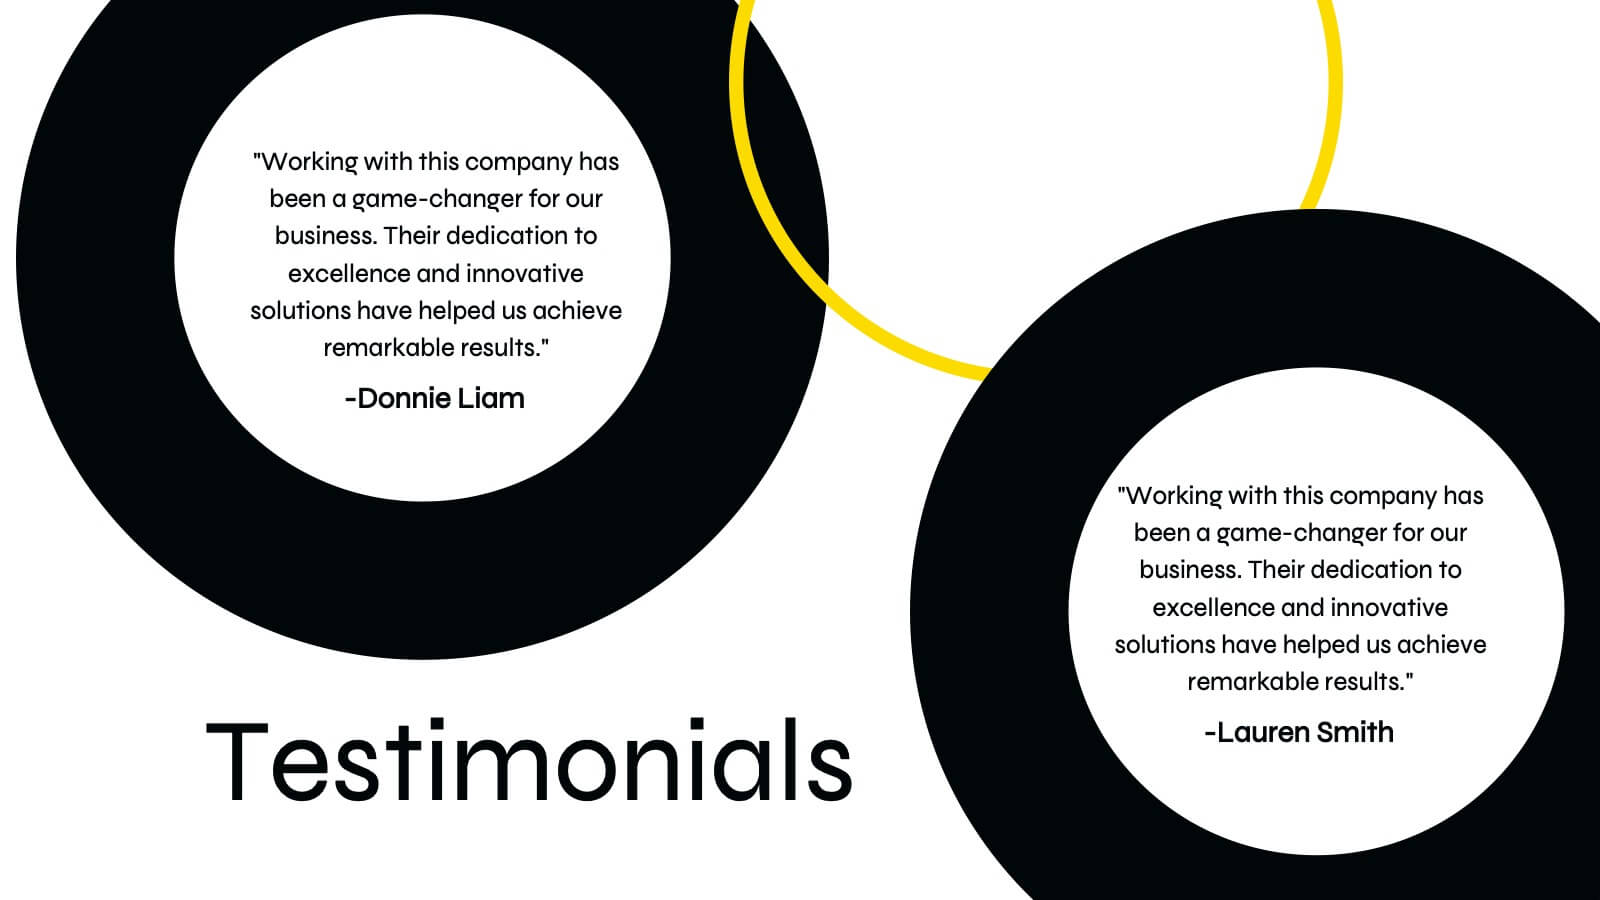
Zenith Investor Pitch Presentation
Impress your investors with this sleek, modern pitch deck presentation template. Perfect for detailing problem statements, solutions, business models, and revenue projections, it features a professional design with a cohesive color scheme. Highlight key elements like market opportunities, competitive landscapes, and financials to captivate your audience. Compatible with PowerPoint, Keynote, and Google Slides, it ensures seamless presentations on any platform.


5 diapositivas
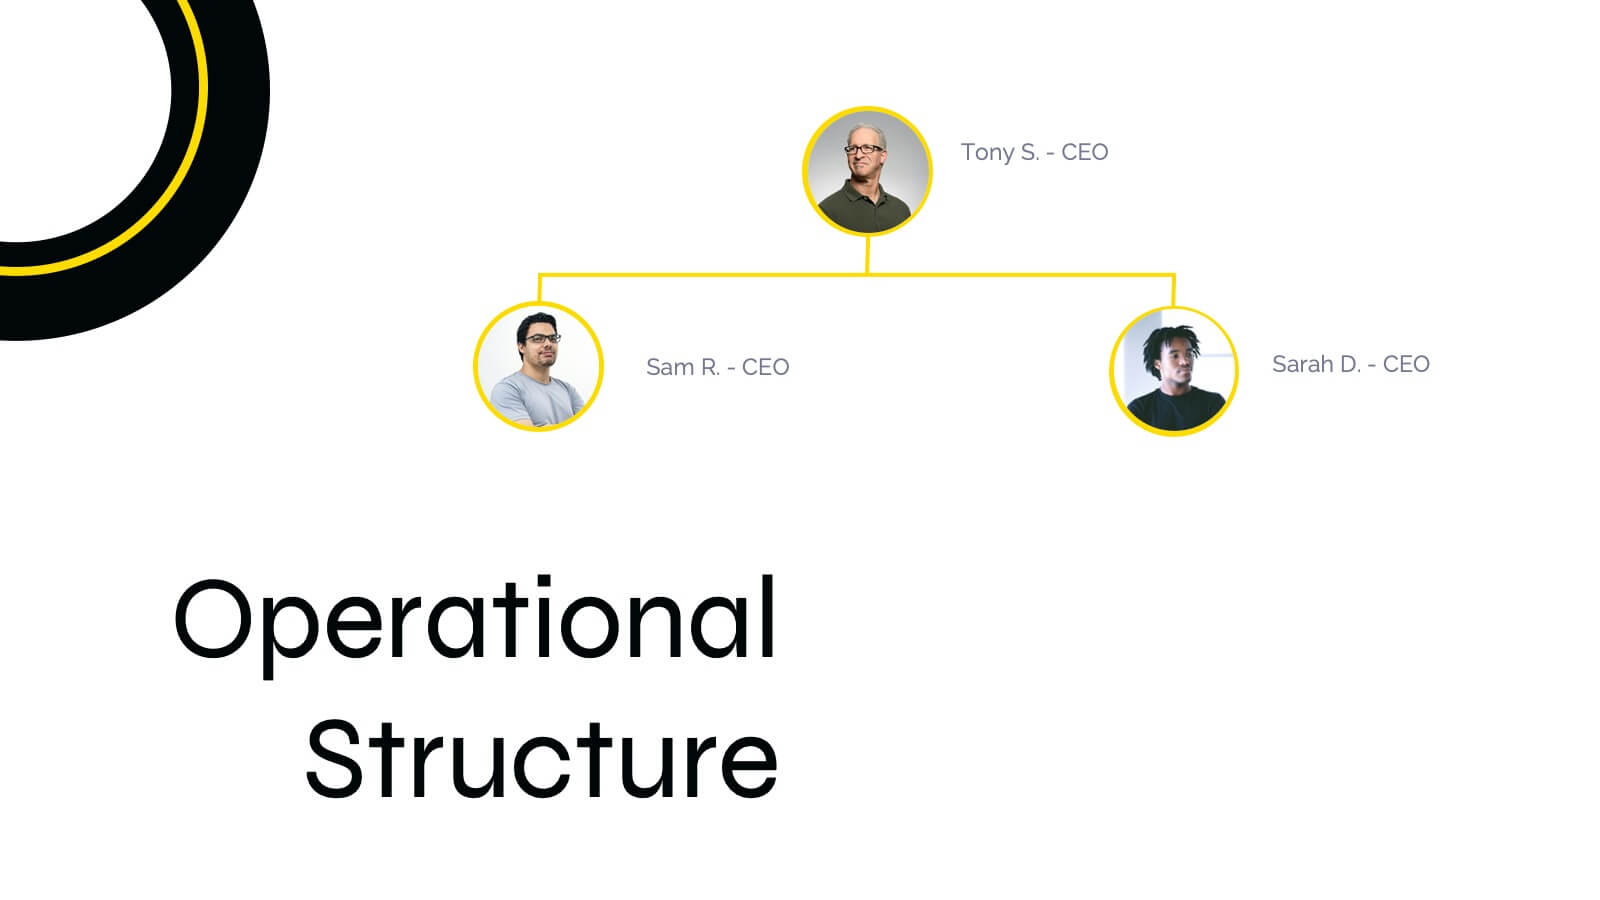
4-Level Hierarchy Tree Presentation
Bring your ideas to life with a smooth, layered flow that feels modern and engaging from the very first glance. This presentation helps you break down complex structures into four clear levels, making information easy to follow and visually compelling. Perfect for explaining processes, roles, or systems with clarity. Fully compatible with PowerPoint, Keynote, and Google Slides.


4 diapositivas
Business Innovation Strategy
Drive transformation and clarity with this Business Innovation Strategy presentation. Featuring a sleek diamond-sequence layout (A–D), it guides your audience through key phases like ideation, development, execution, and scaling. Ideal for product planning, growth initiatives, and organizational innovation. Fully customizable in PowerPoint, Keynote, and Google Slides.


4 diapositivas
Human Cognitive Bias Framework Presentation
Enhance your presentations on decision-making and psychology with the Human Cognitive Bias Framework Presentation. This editable slide helps you visualize how cognitive biases influence perception, thought, and behavior. Ideal for workshops, training sessions, or behavioral research discussions. Compatible with Canva, PowerPoint, Google Slides, and Keynote.


3 diapositivas
Comprehensive Business Roadmap Strategy Presentation
Plan ahead with confidence using the Comprehensive Business Roadmap Strategy Presentation. This timeline-based slide is perfect for mapping out multi-quarter goals, initiatives, or project phases. Use the horizontal arrows to show overlapping tasks and strategic priorities by quarter. Ideal for project managers, team leads, and business strategists. Fully editable in PowerPoint, Keynote, Google Slides, and Canva.


8 diapositivas
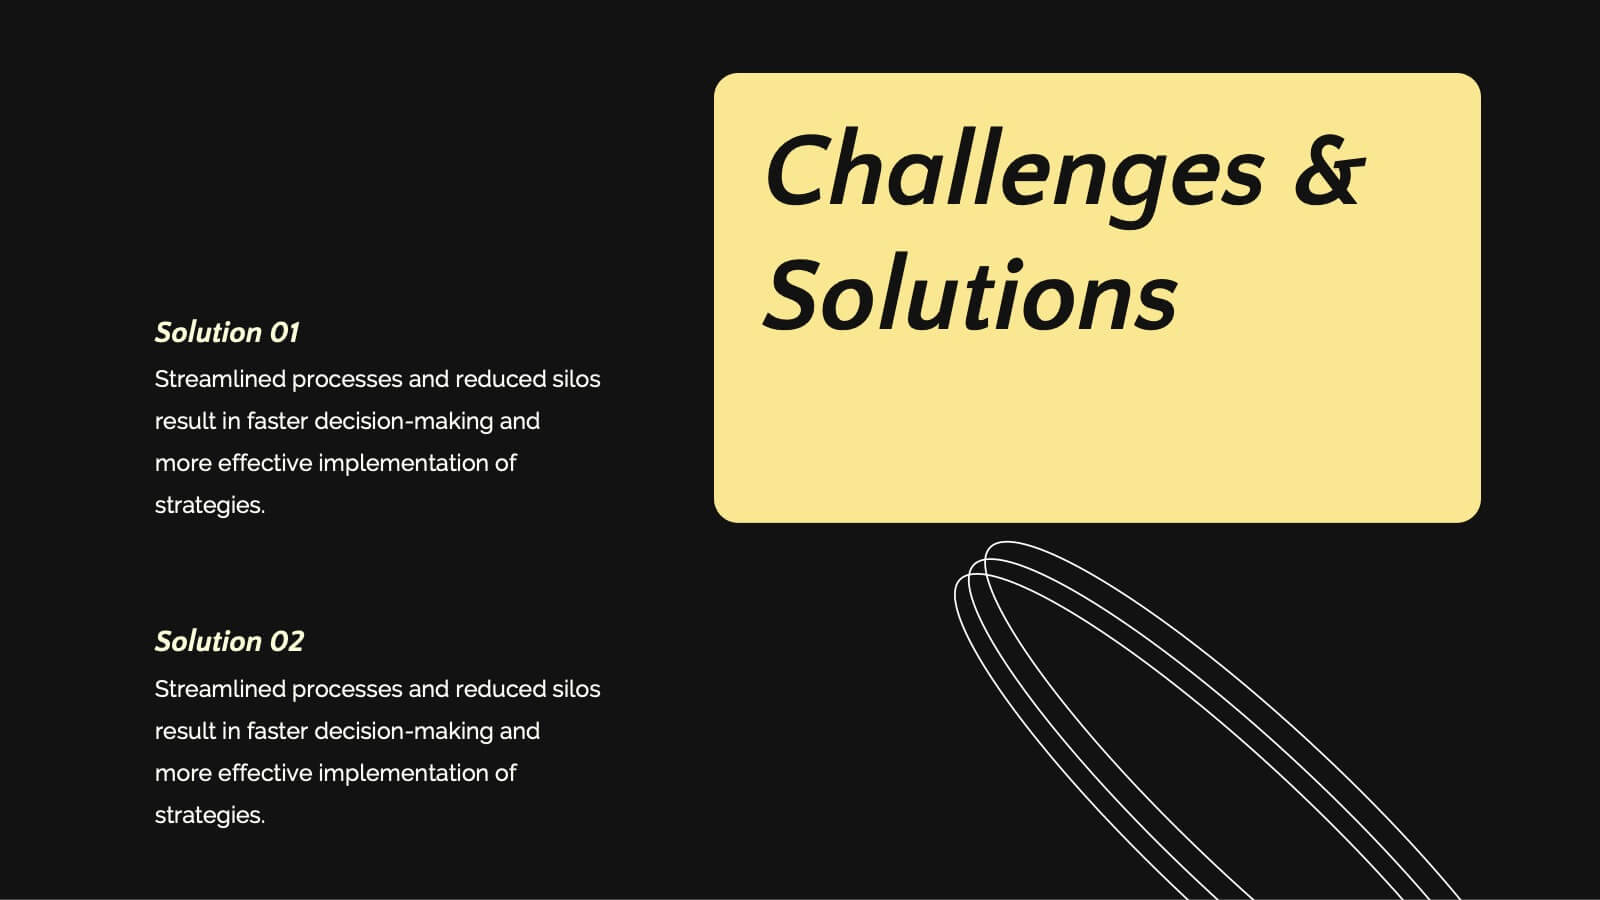
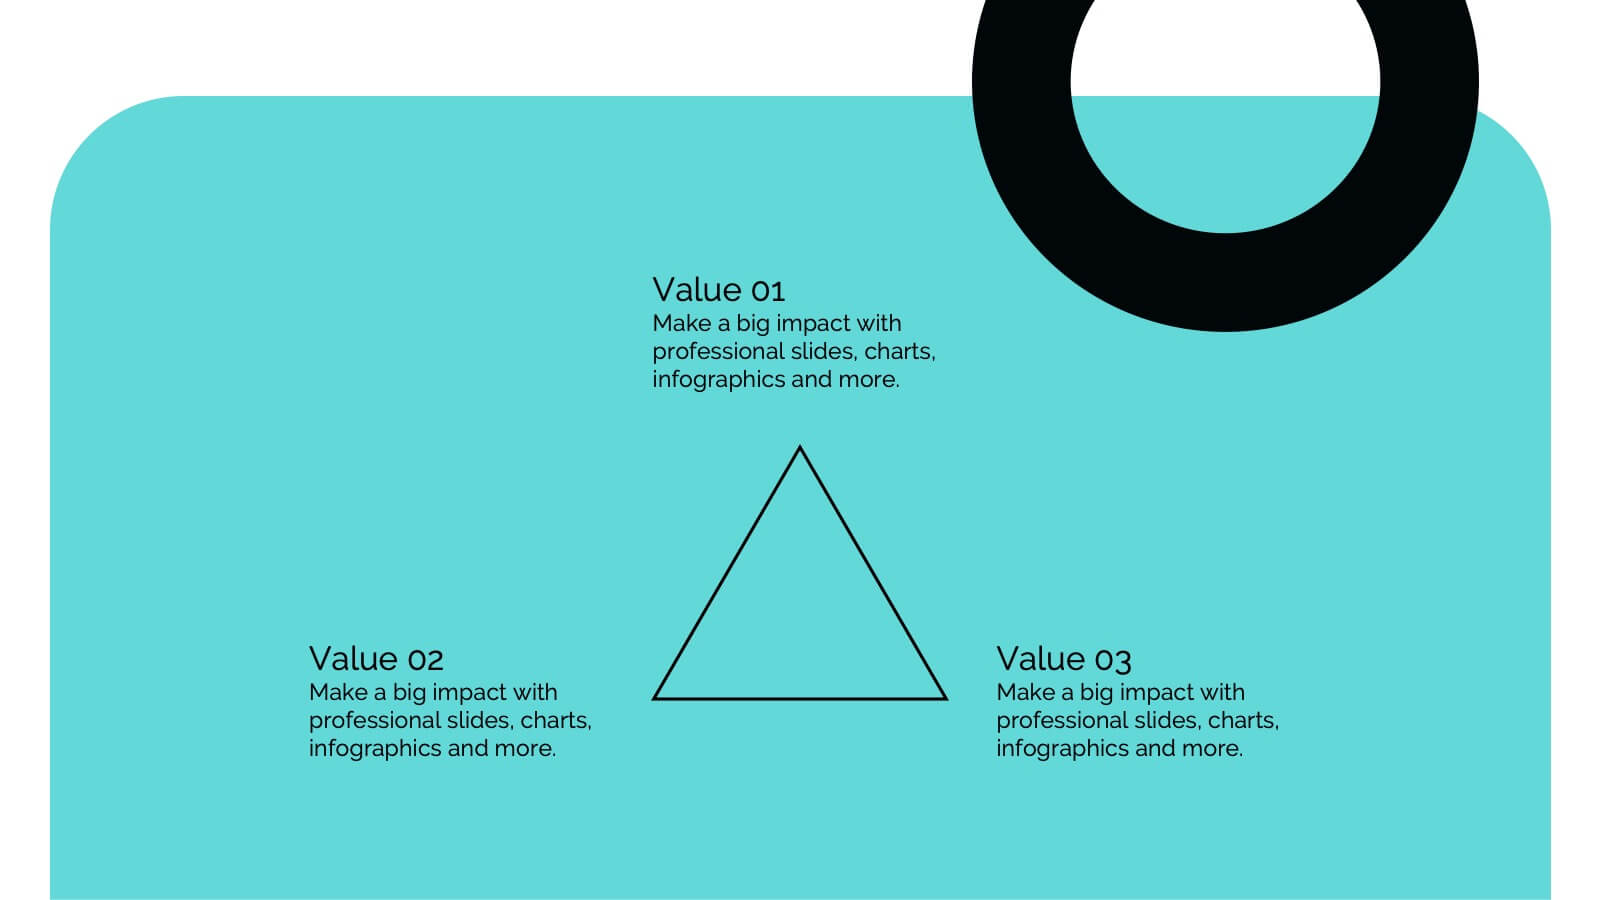
Governance and Compliance Framework
Streamline your compliance reporting with this triangle-based governance framework slide. Featuring three core pillars—Risk, Strategy, and Leadership—this layout visually connects your organizational roles, responsibilities, and regulatory measures. Each corner is paired with numbered titles and editable icons, perfect for illustrating audits, policies, or internal controls. Fully editable in PowerPoint, Keynote, and Google Slides.

18 diapositivas
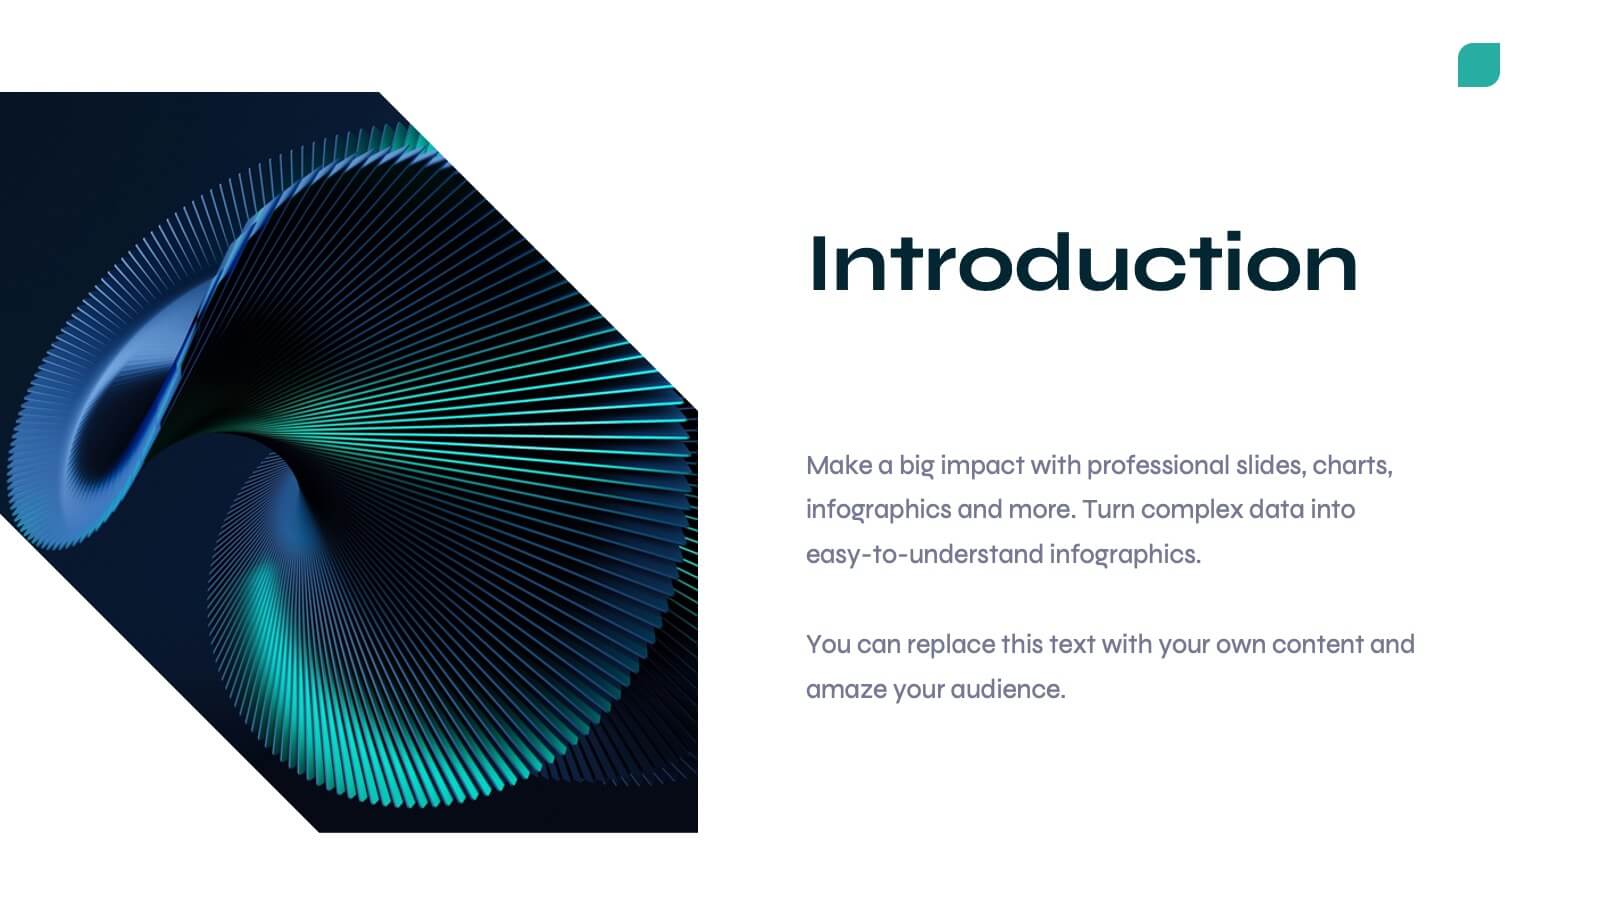
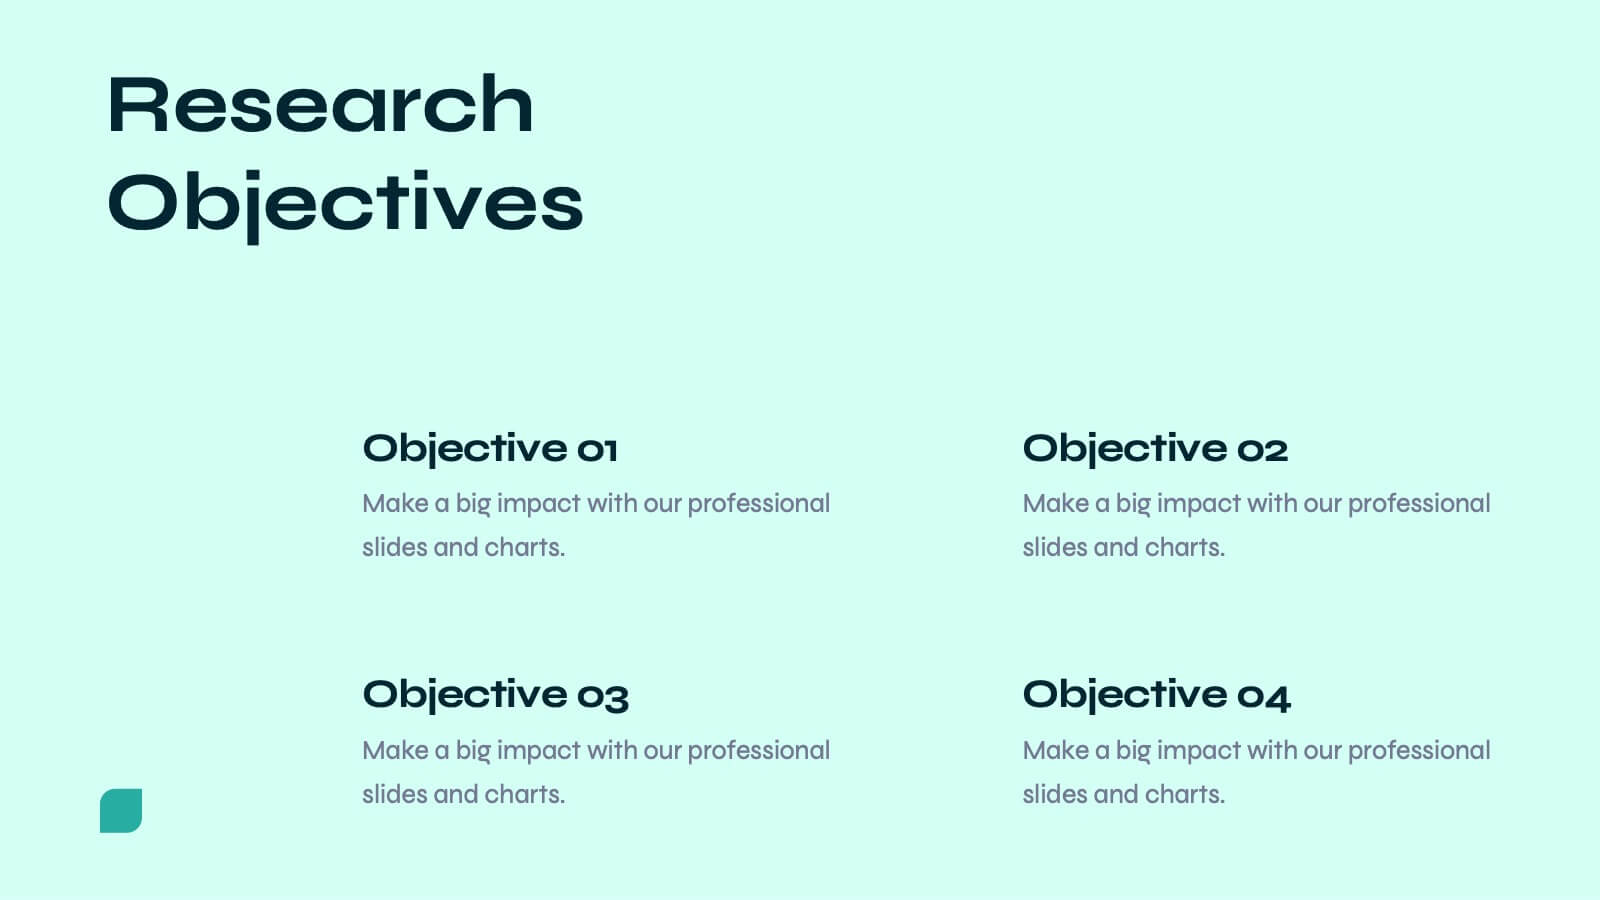
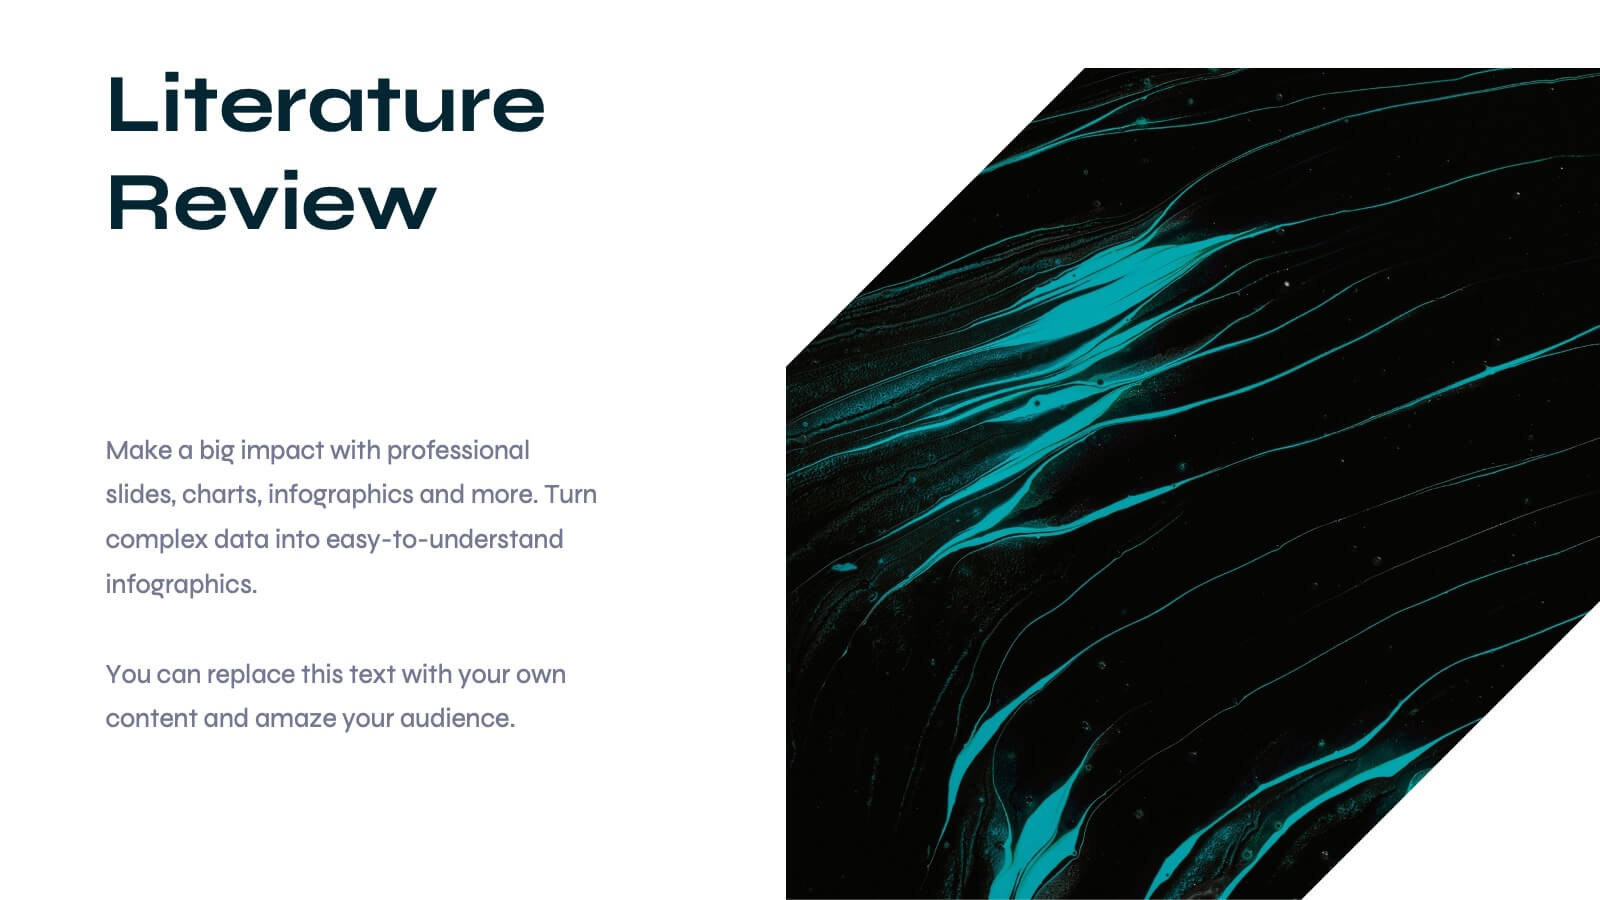
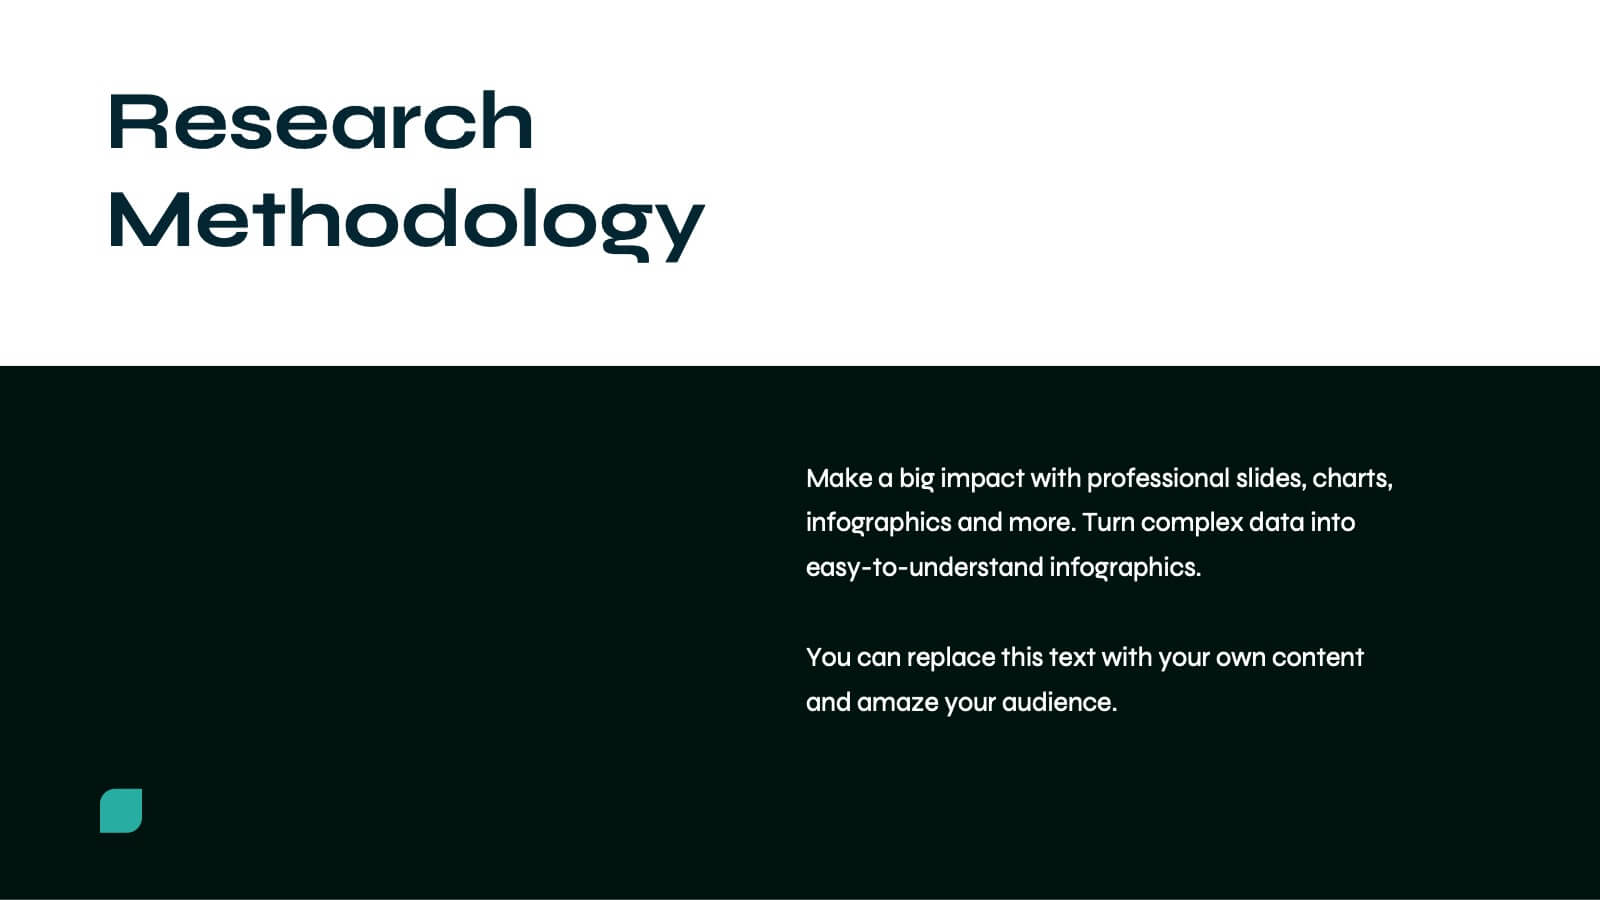
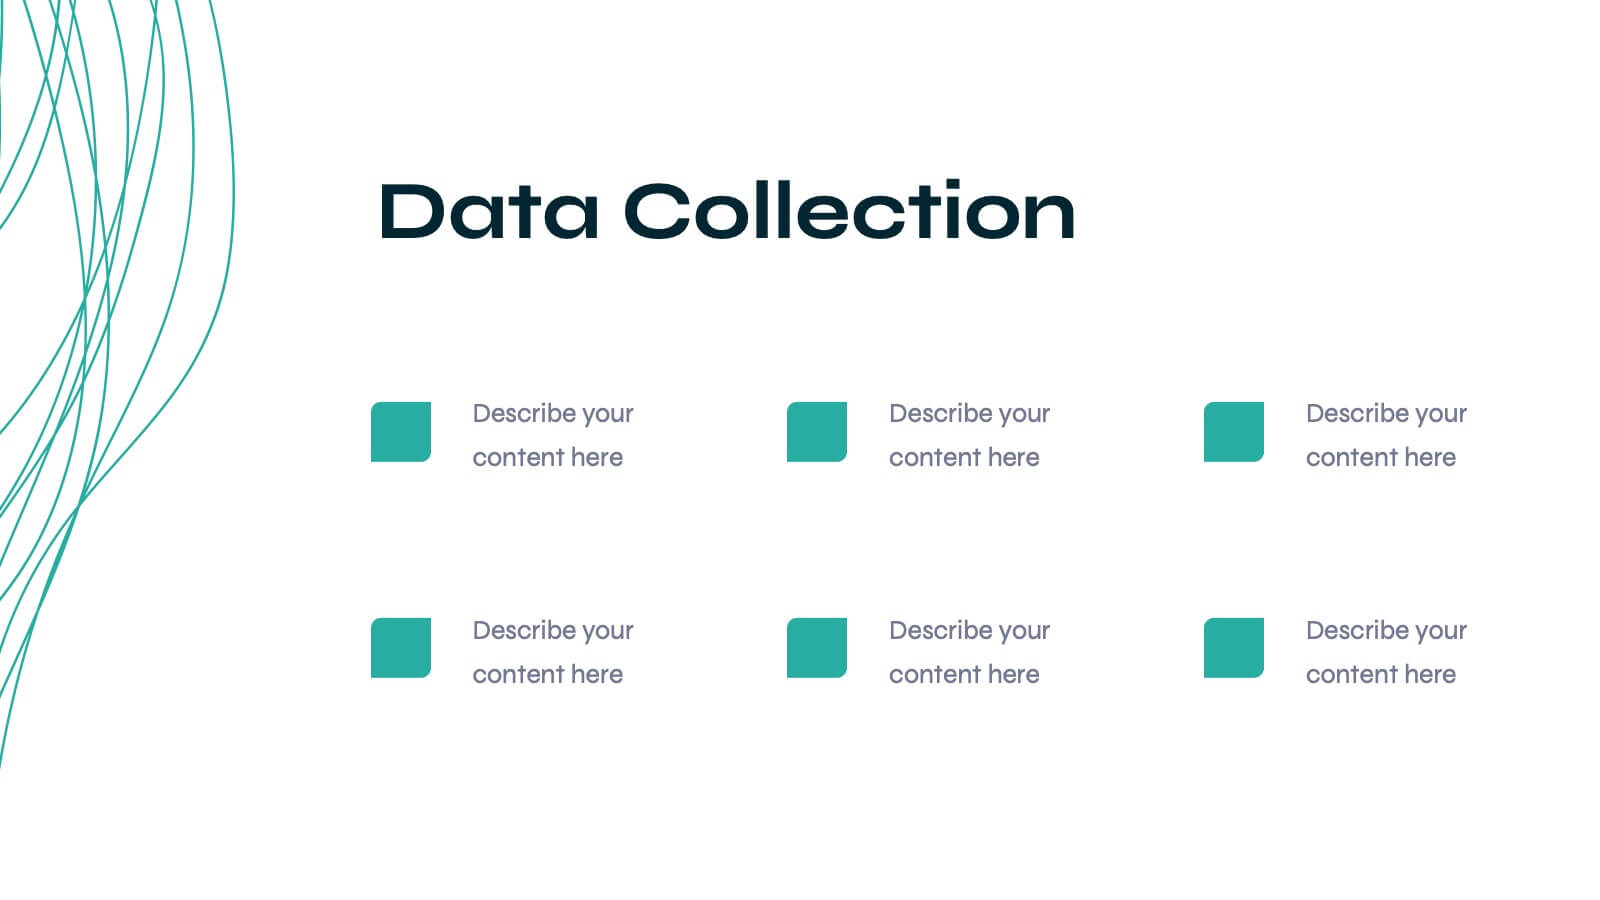
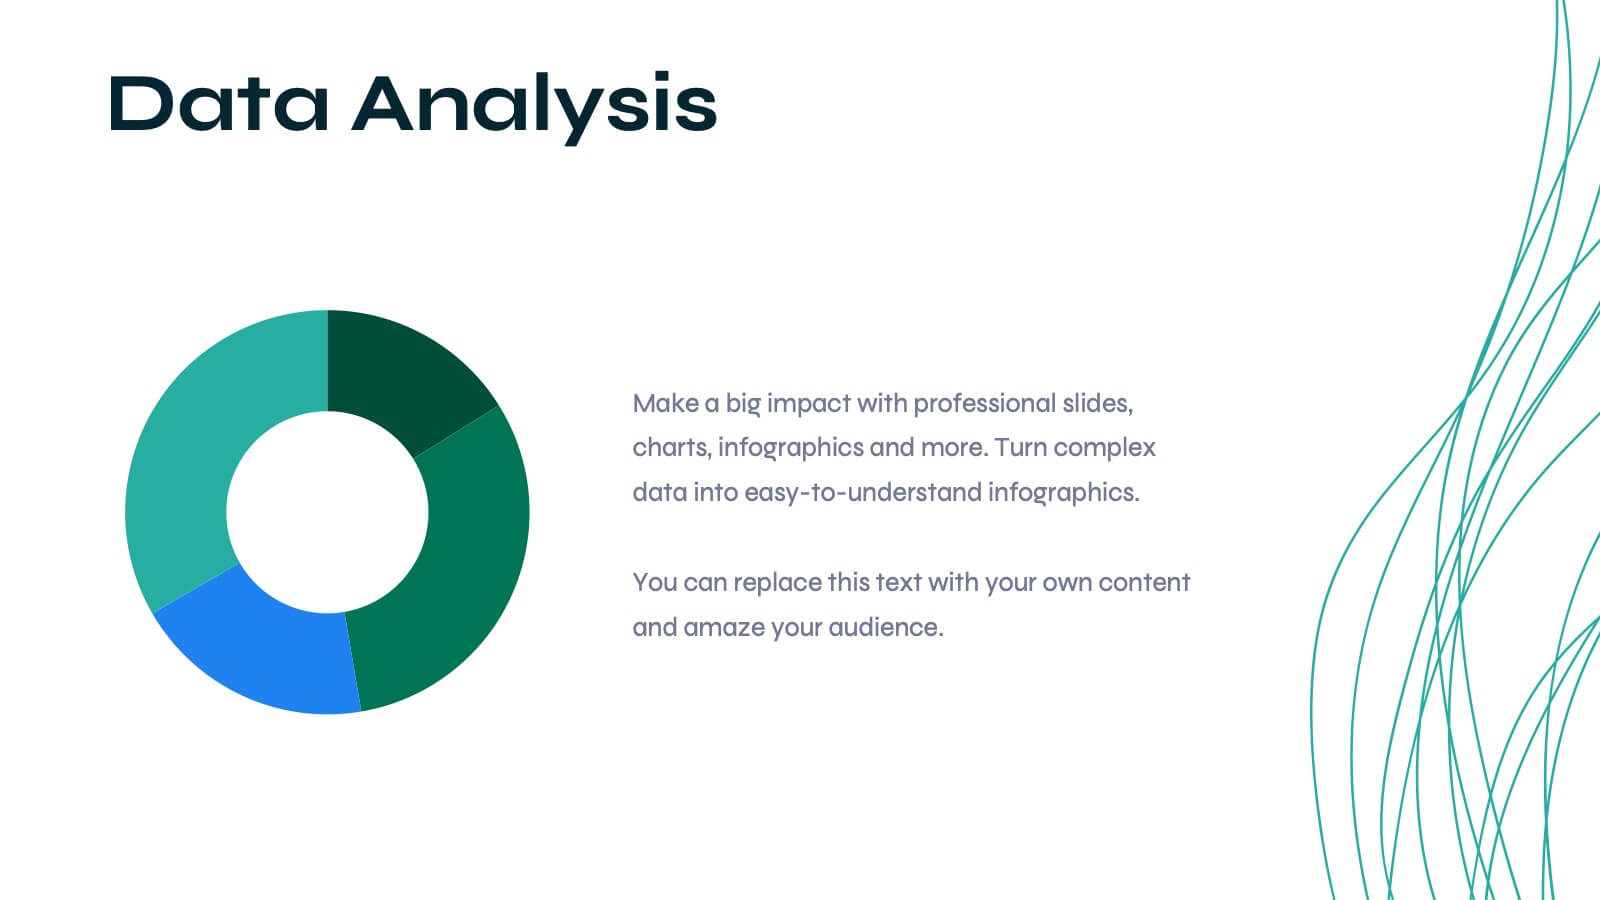
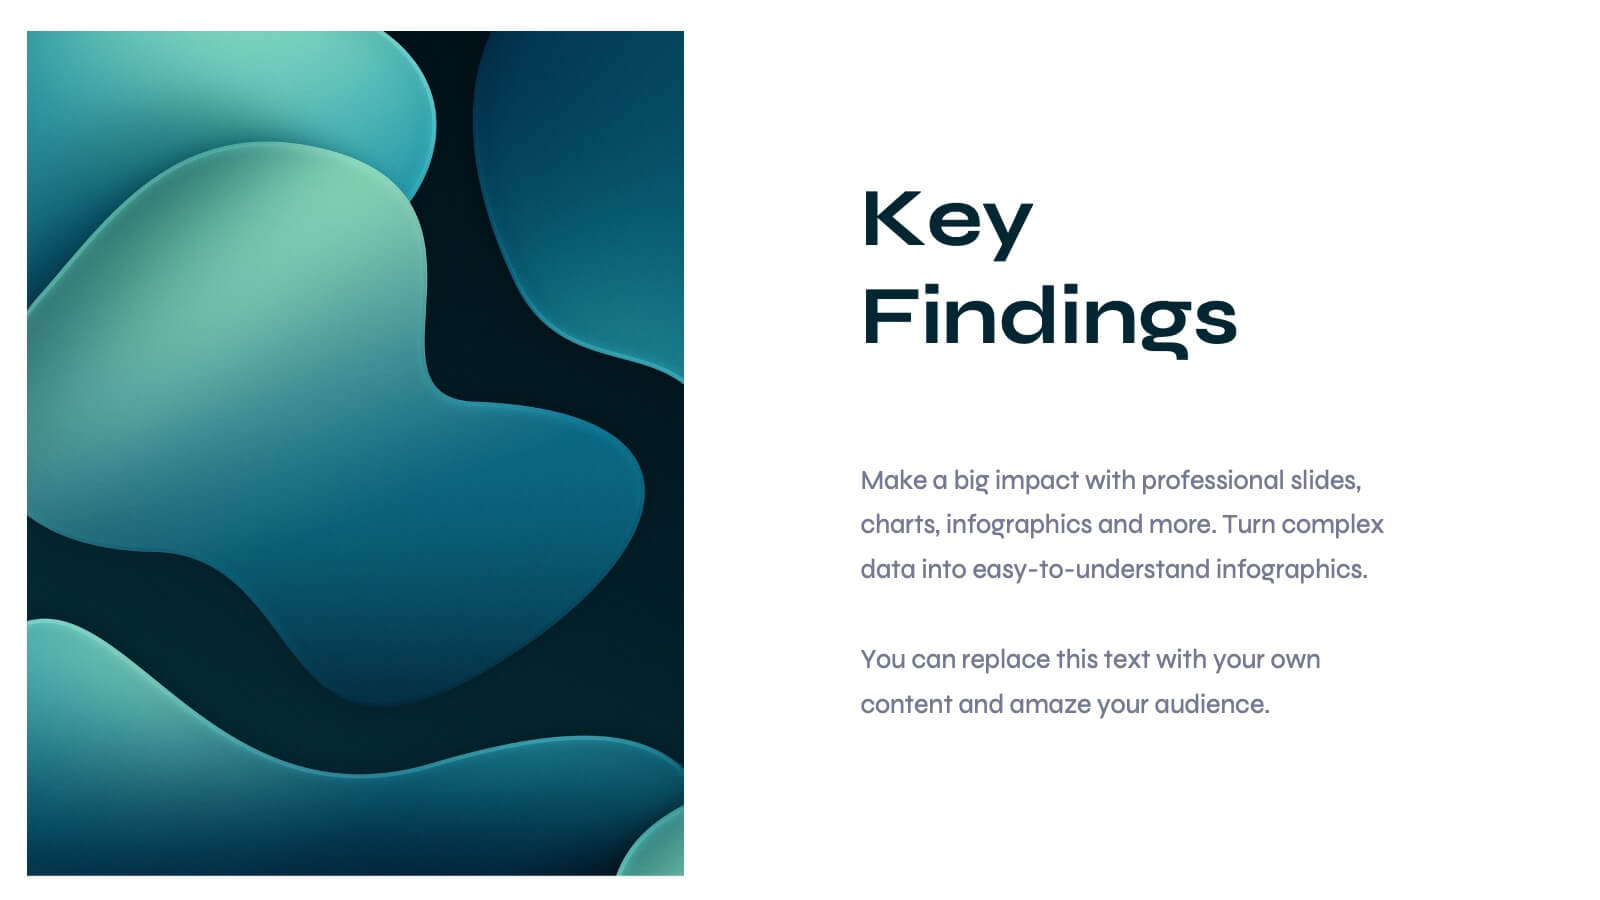
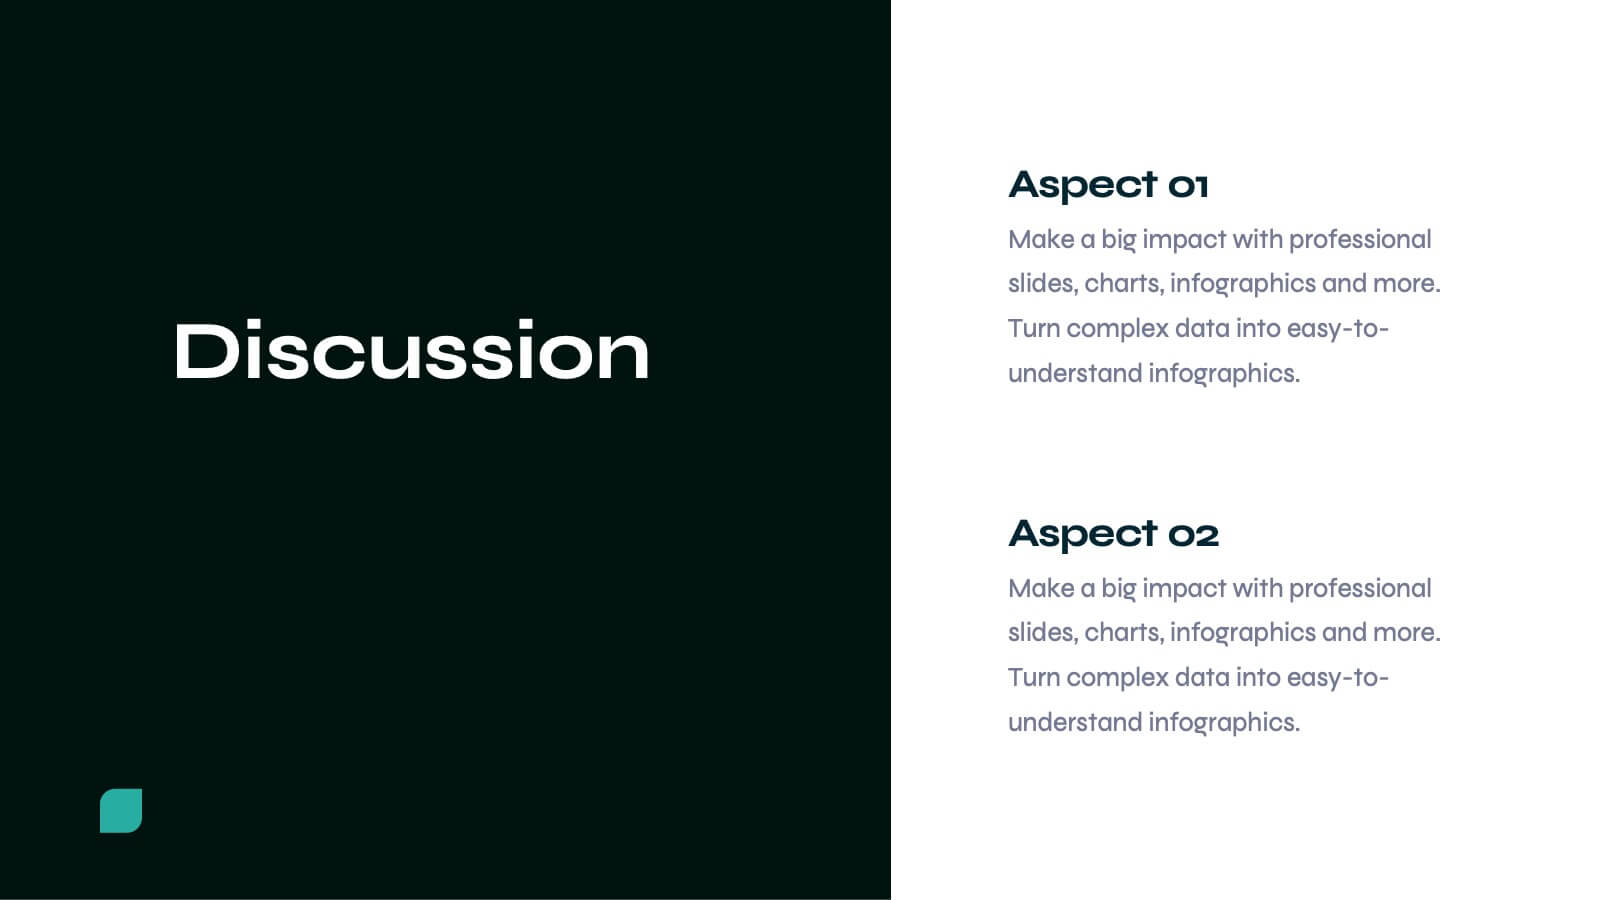
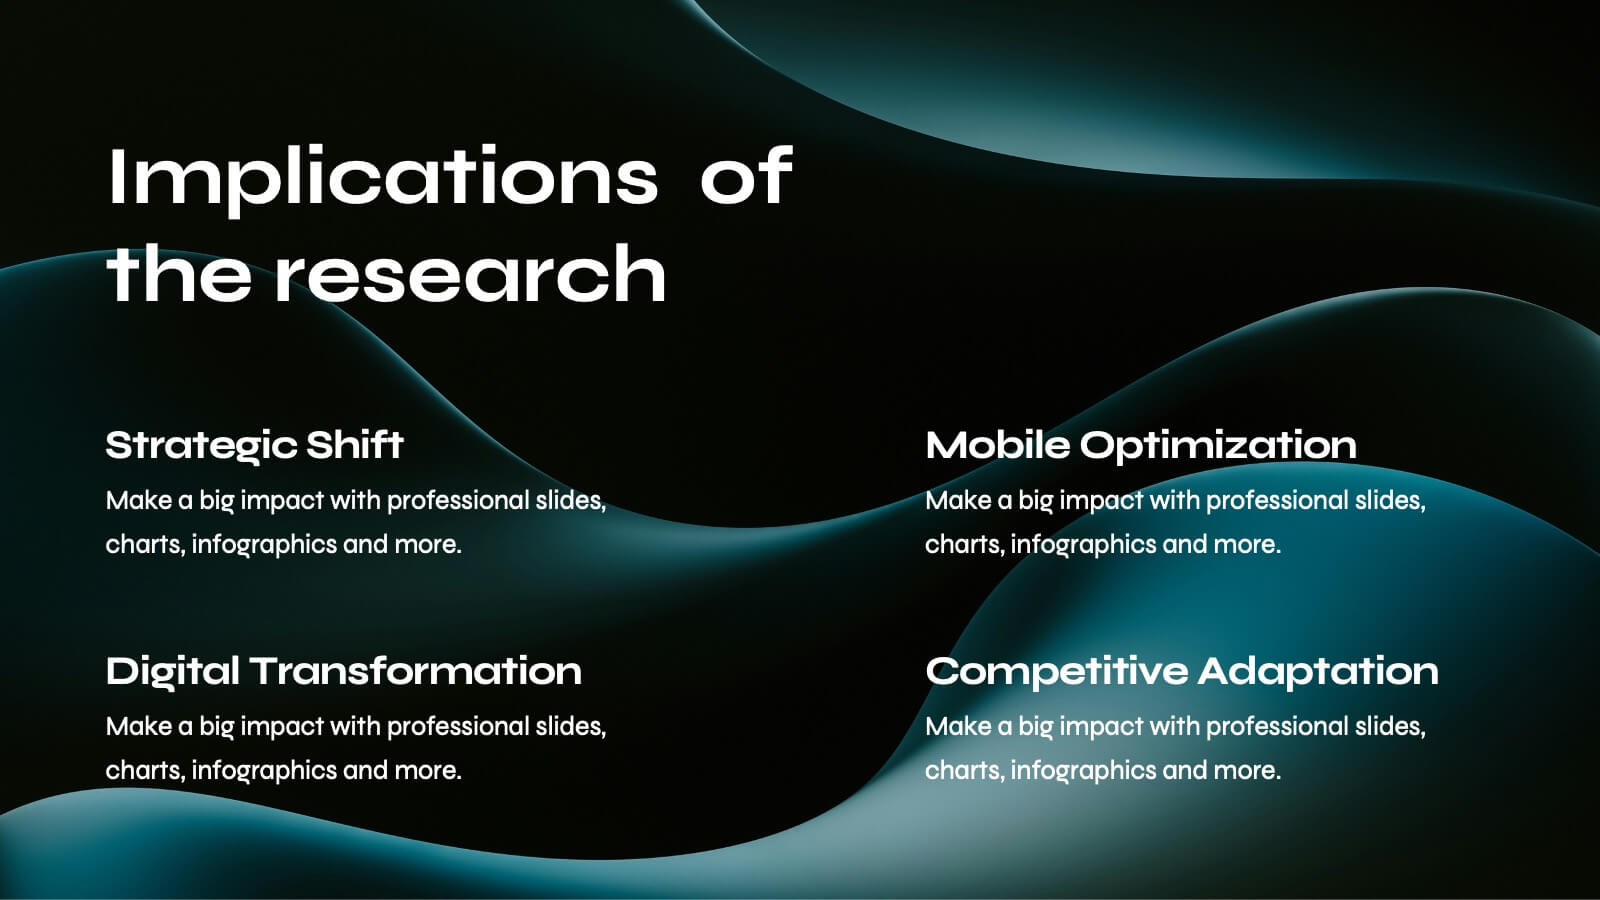
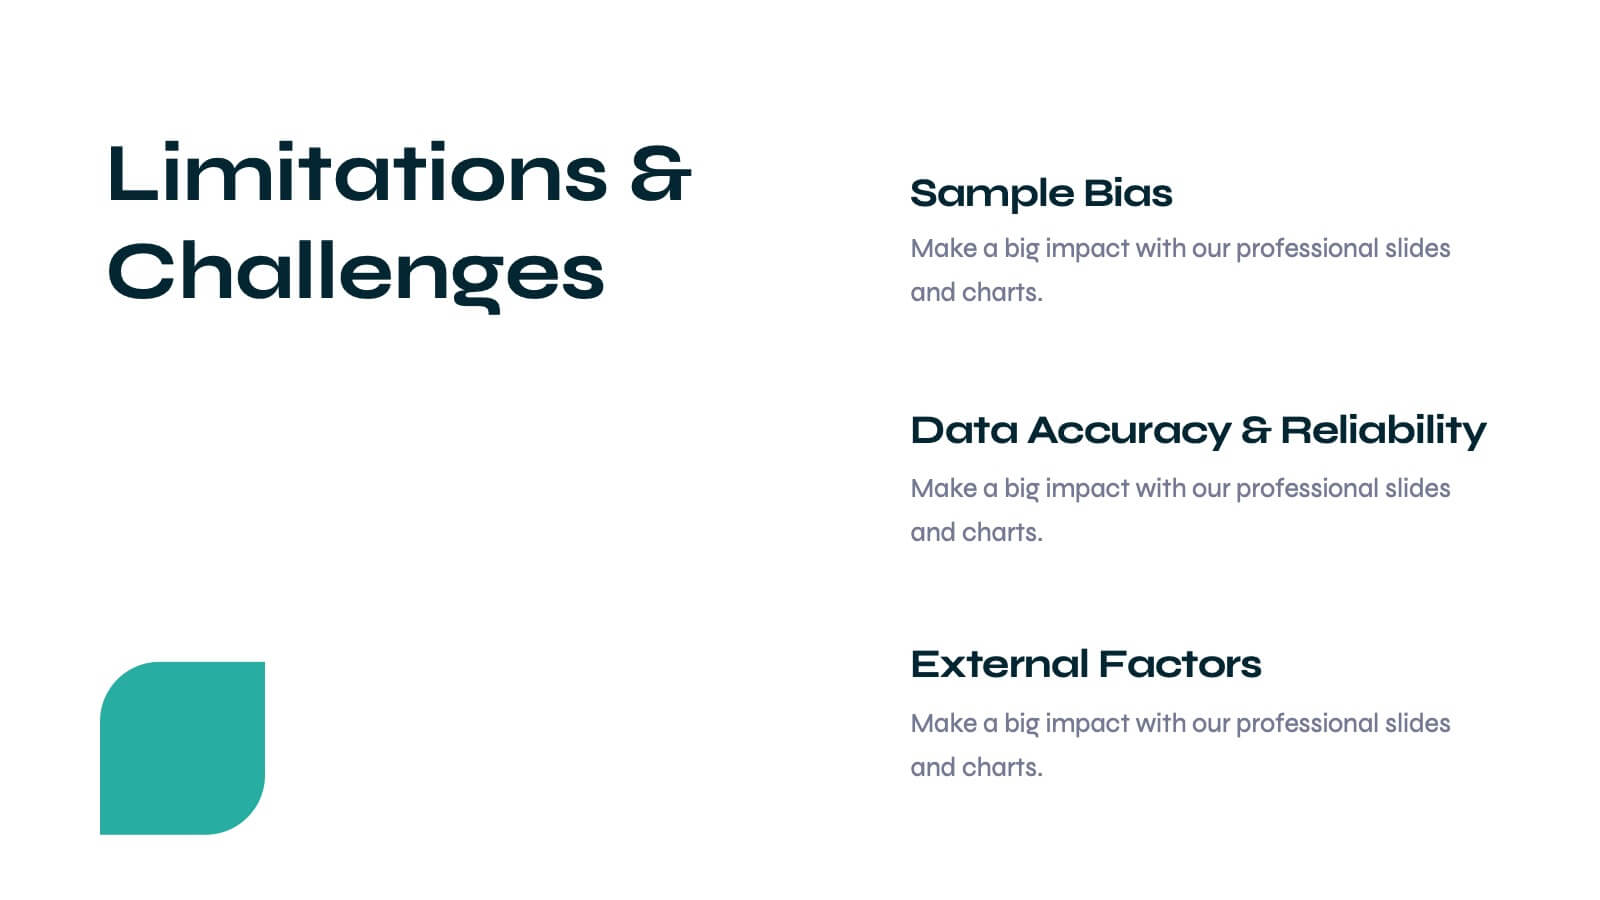
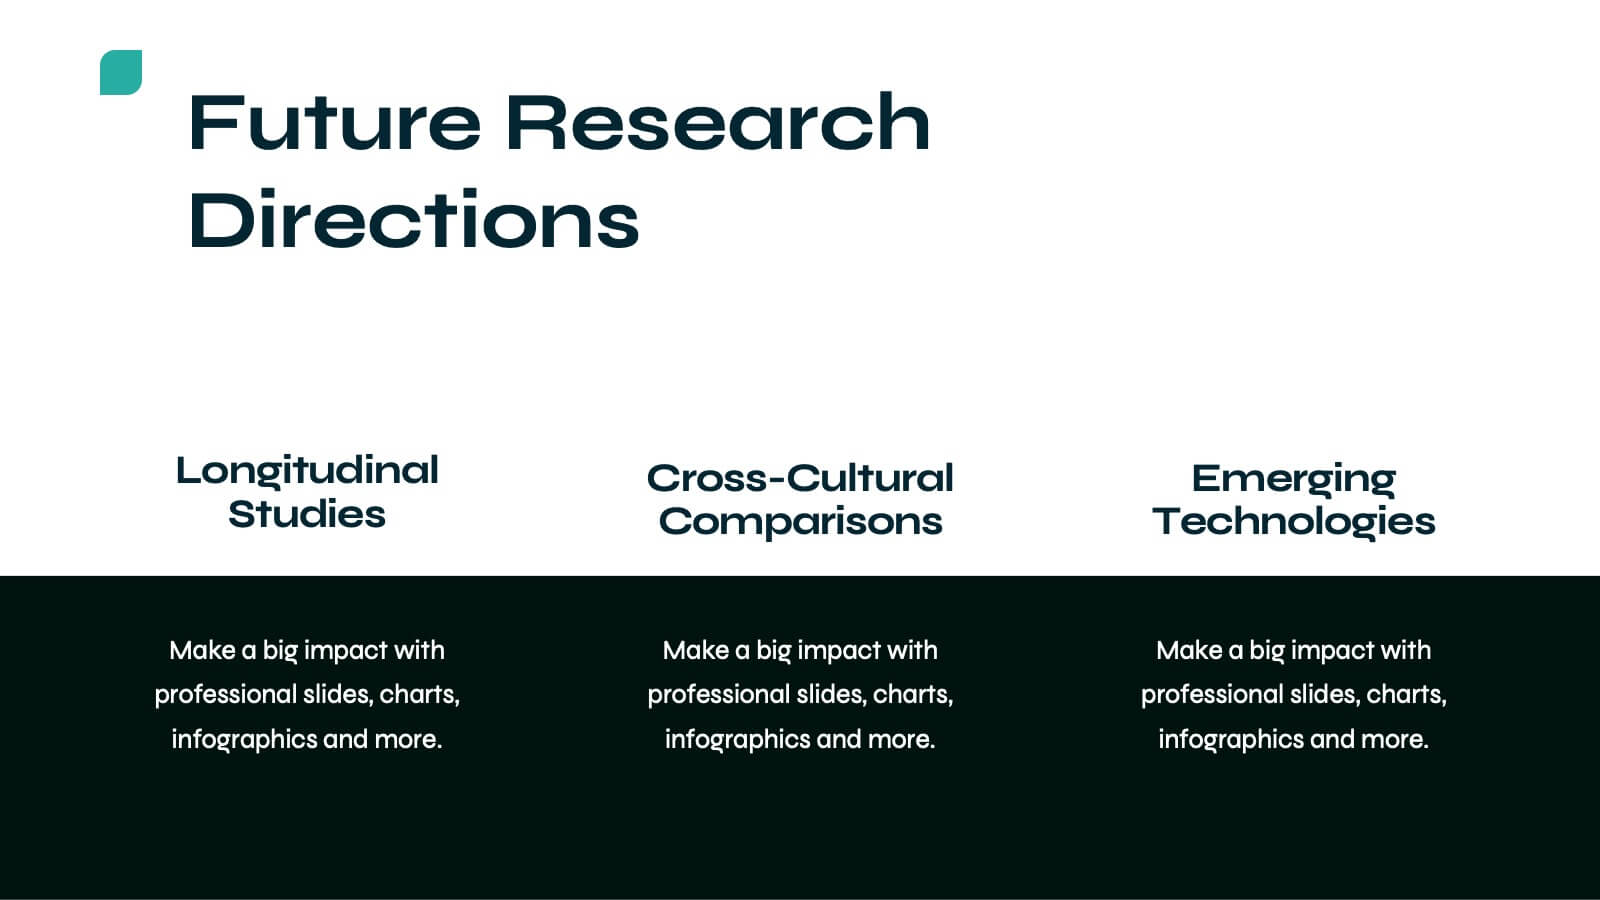
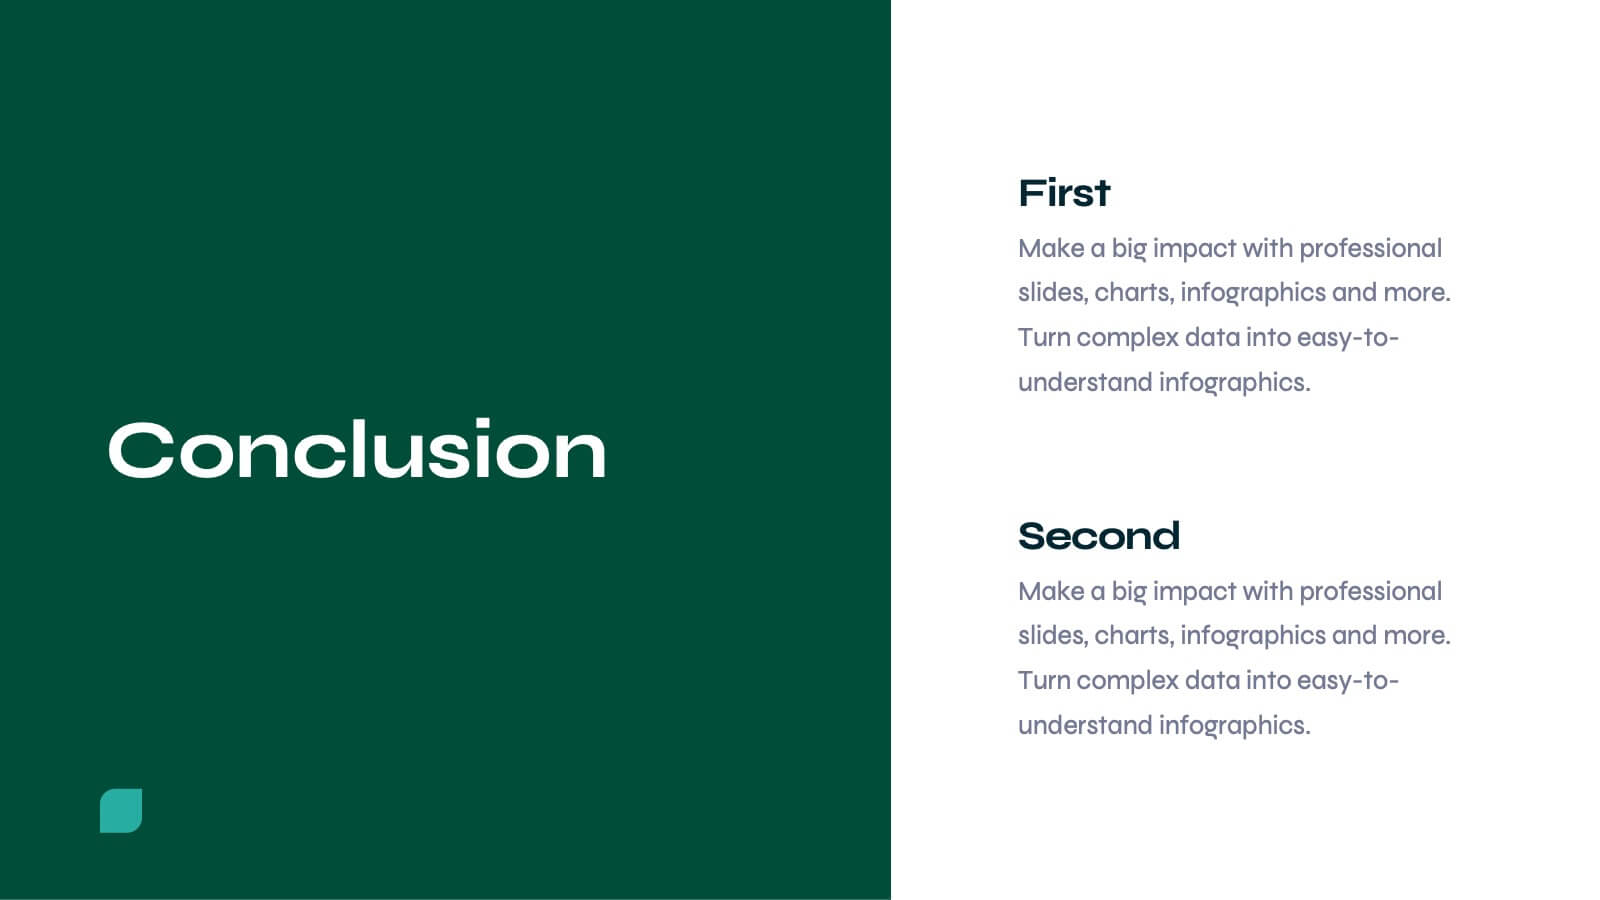
Pinnacle Academic Research Report Presentation
Present your academic research with style and precision using this comprehensive template. It covers everything from research objectives to key findings and recommendations. Perfect for making your data clear and engaging. Compatible with PowerPoint, Keynote, and Google Slides, it ensures your research is presented professionally and effectively.


26 diapositivas
Haeleigh Presentation Template
The Haeleigh Powerpoint Template is a 26 modern slide template that is perfect for any presentation. With a clean classy aesthetic and easy to read text, this template is ideal for reading content and looking professional. The use of nude colors helps keep the look clean and easy to read. The theme comes packed with features to target your audience and help you get your message across. The charts, graphics, timelines included are easy to edit. This template is also perfect for businesses seeking to make an impression on their audience. Haeleigh is mobile friendly and easy to navigate.


12 diapositivas
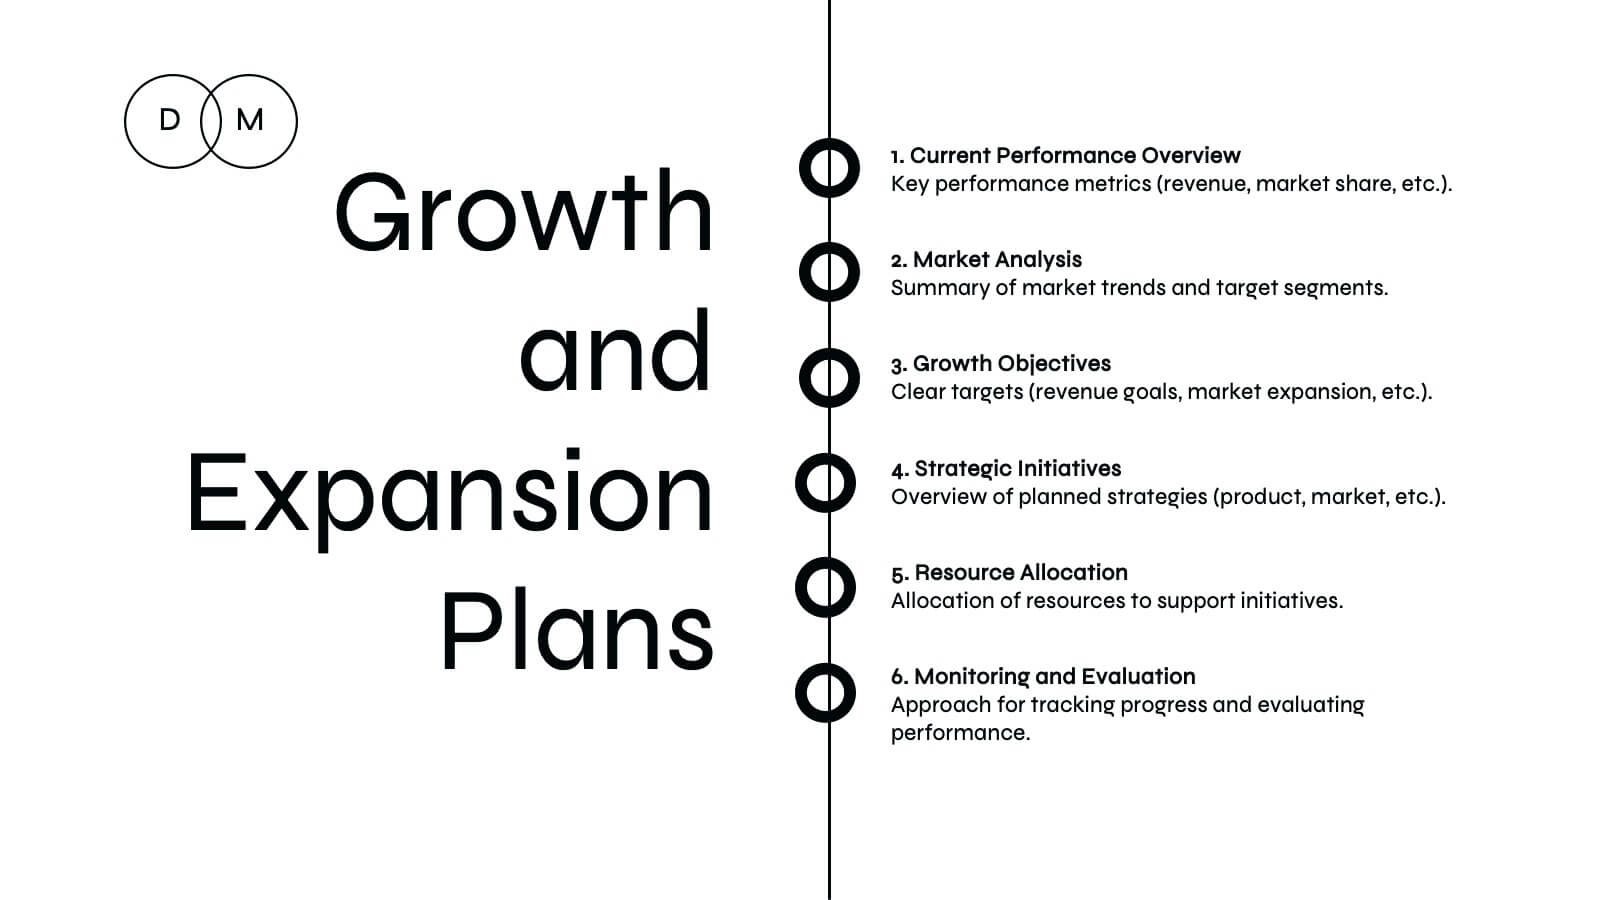
Business Growth and Expansion Presentation
Showcase your Business Growth and Expansion strategy with this dynamic presentation template. Featuring bold arrow visuals, it effectively illustrates progression, milestones, and key business insights. Ideal for startups, corporate planning, and market analysis. Compatible with PowerPoint, Keynote, and Google Slides.


4 diapositivas
Creative Title Layout Presentation
Give your presentation a fresh, artistic flair with a bold and playful cover design that instantly grabs attention. Ideal for creative portfolios, branding pitches, or modern business decks, this layout blends minimalism with fluid shapes for a dynamic look. Fully customizable in PowerPoint, Keynote, and Google Slides.


5 diapositivas
User Experience Survey Findings Presentation
Present key insights from your user research in a clean and impactful way with this survey findings slide. Designed to highlight percentages and categories clearly, it helps your audience quickly understand what users value most. Ideal for UX reports and product feedback reviews. Fully compatible with PowerPoint, Keynote, and Google Slides.


22 diapositivas
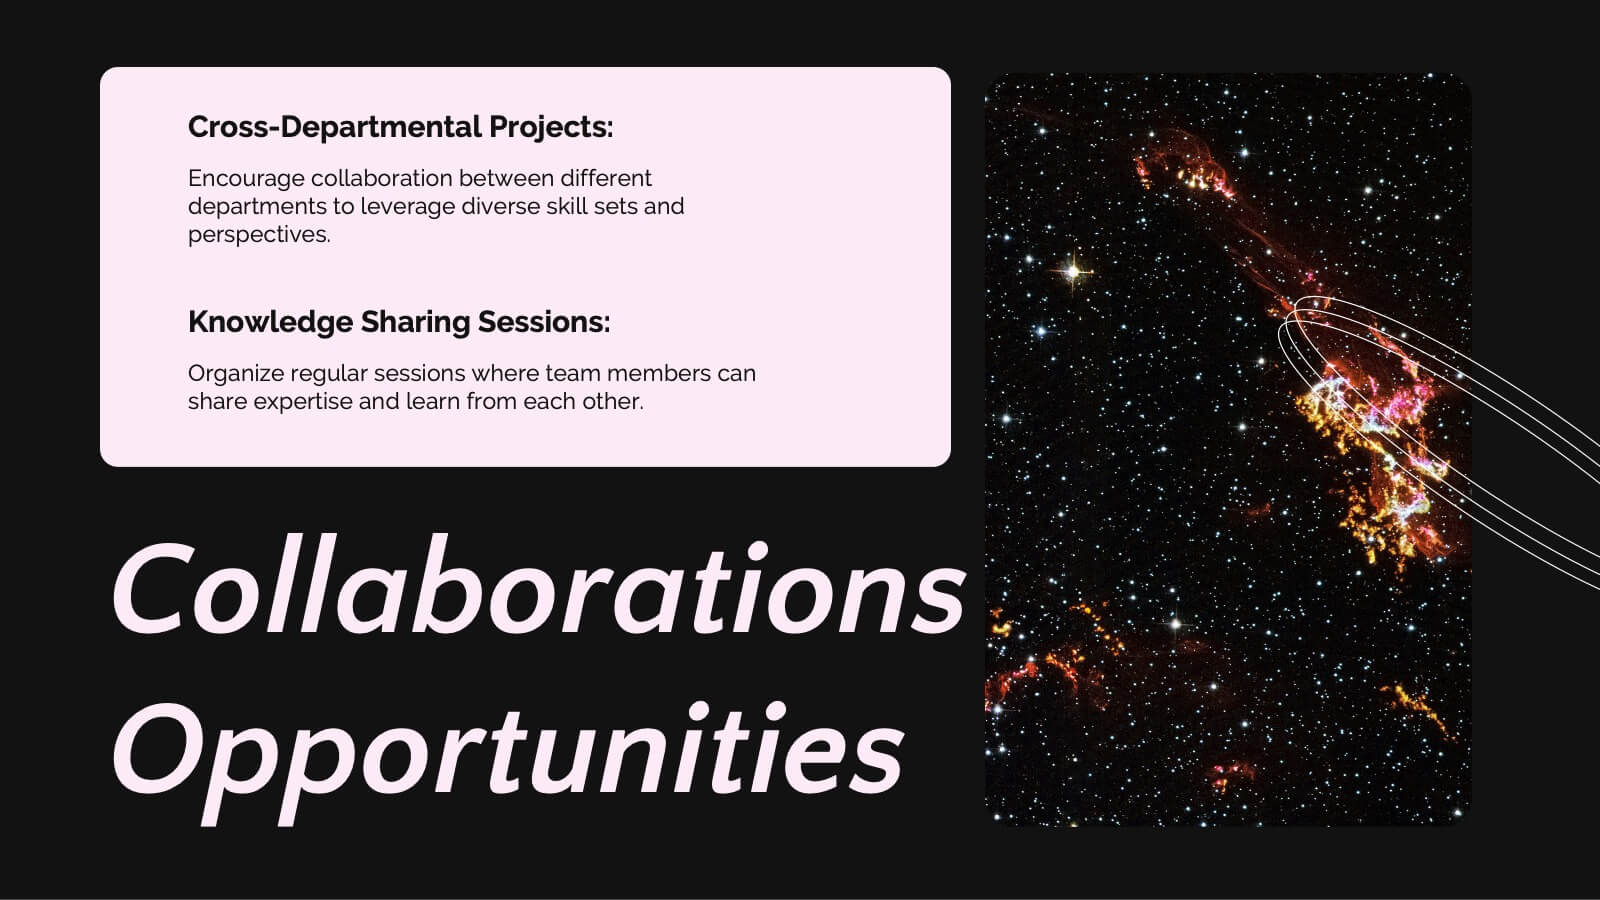
Shield Digital Agency Strategy Plan Presentation
Embark on a journey to elevate your digital agency with this comprehensive and sleek presentation template! Perfect for showcasing your agency’s strengths, strategies, and successes, this template covers everything from market analysis to client testimonials. It’s designed to make your agency’s strategy plan stand out. Compatible with PowerPoint, Keynote, and Google Slides for seamless use.


20 diapositivas
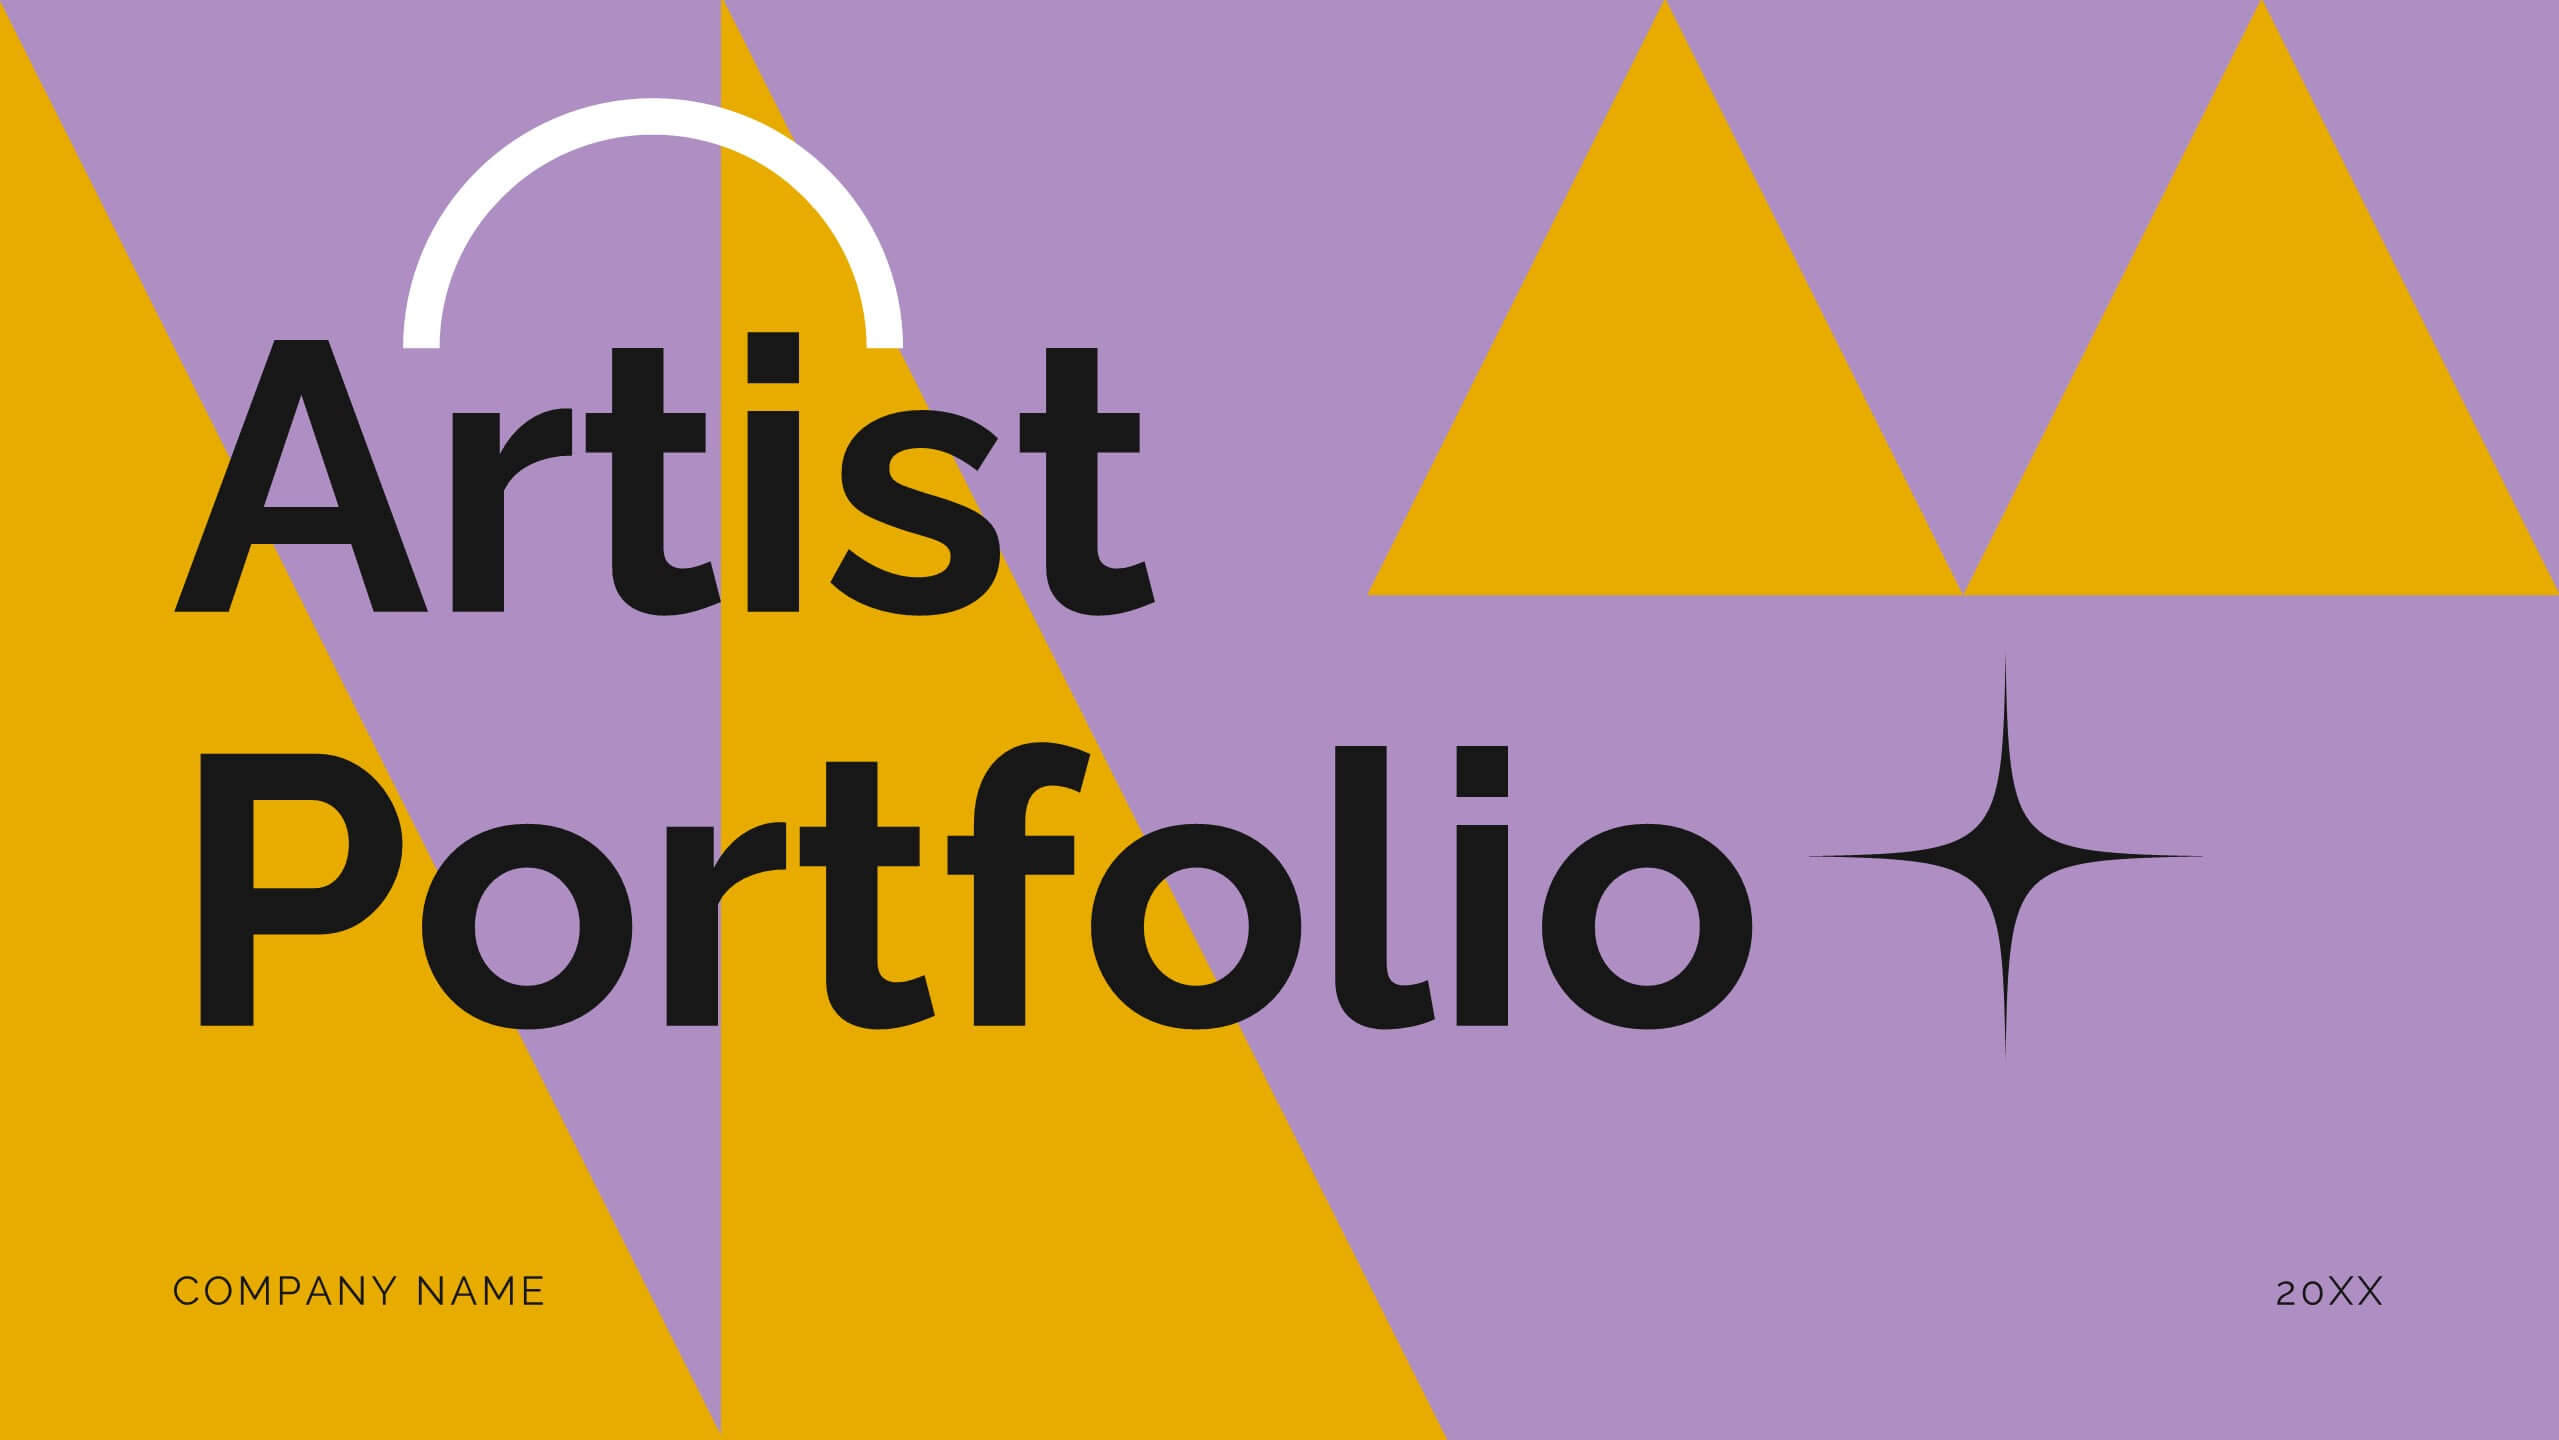
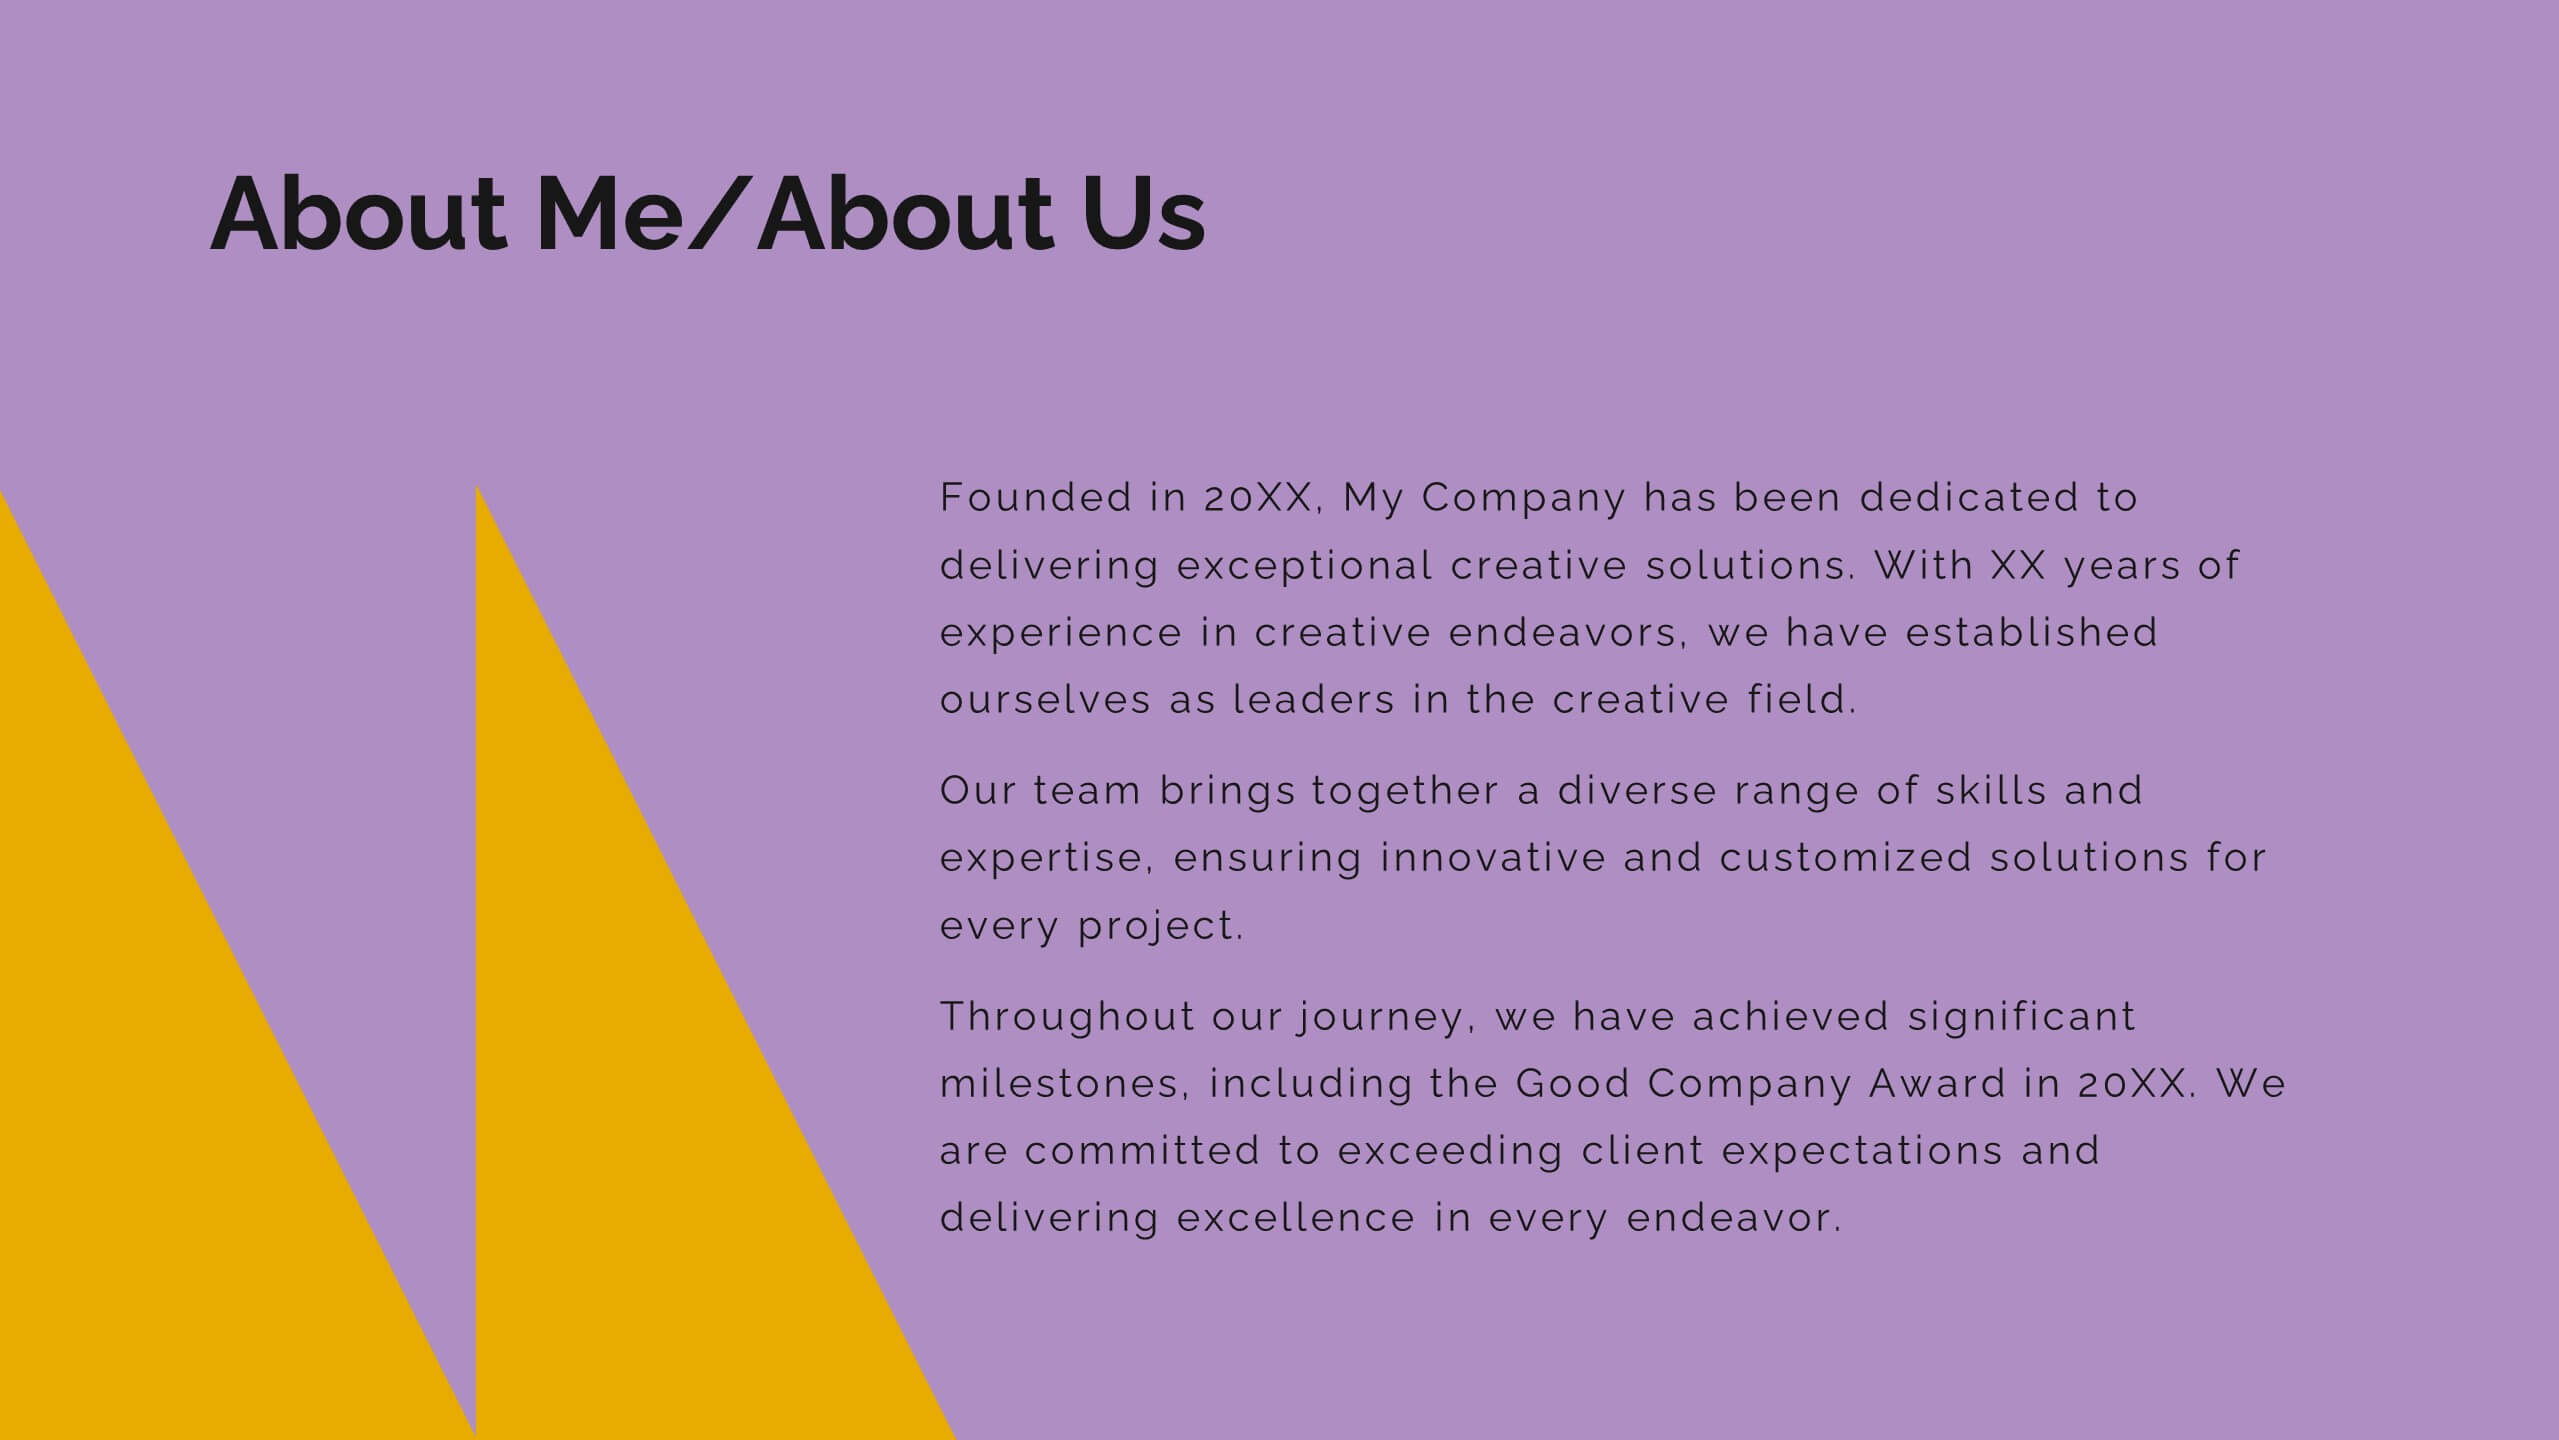
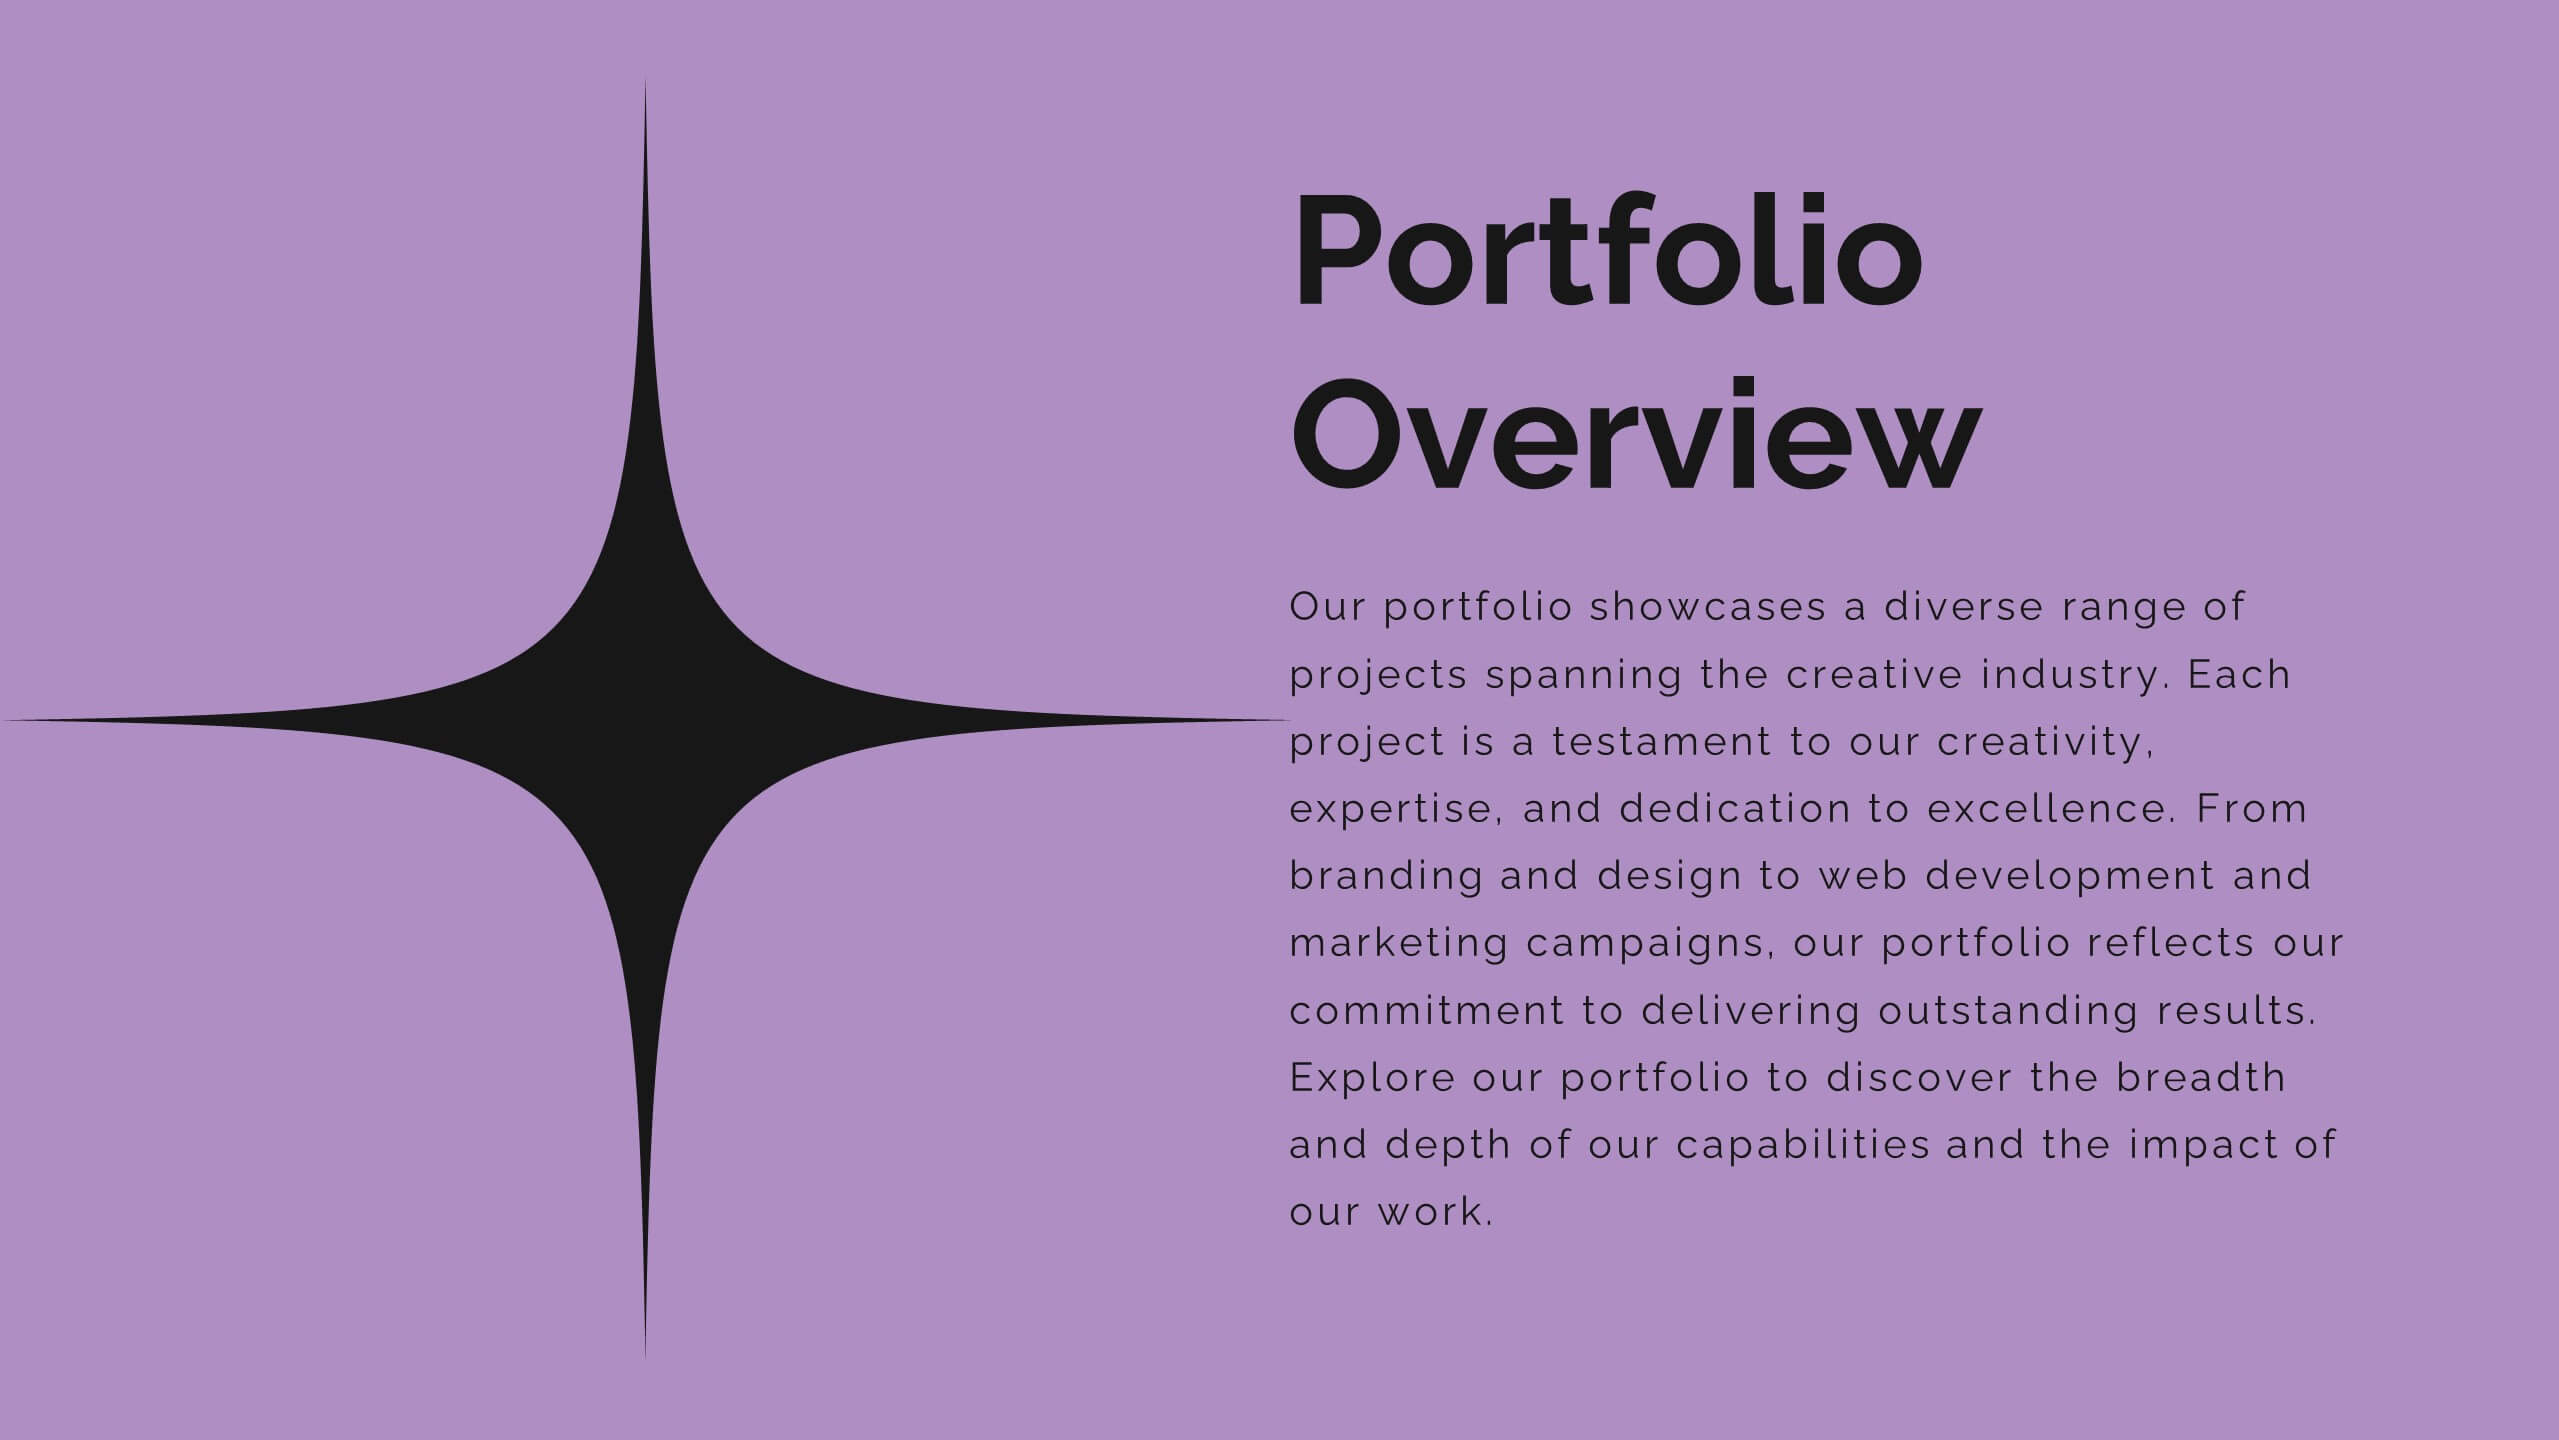
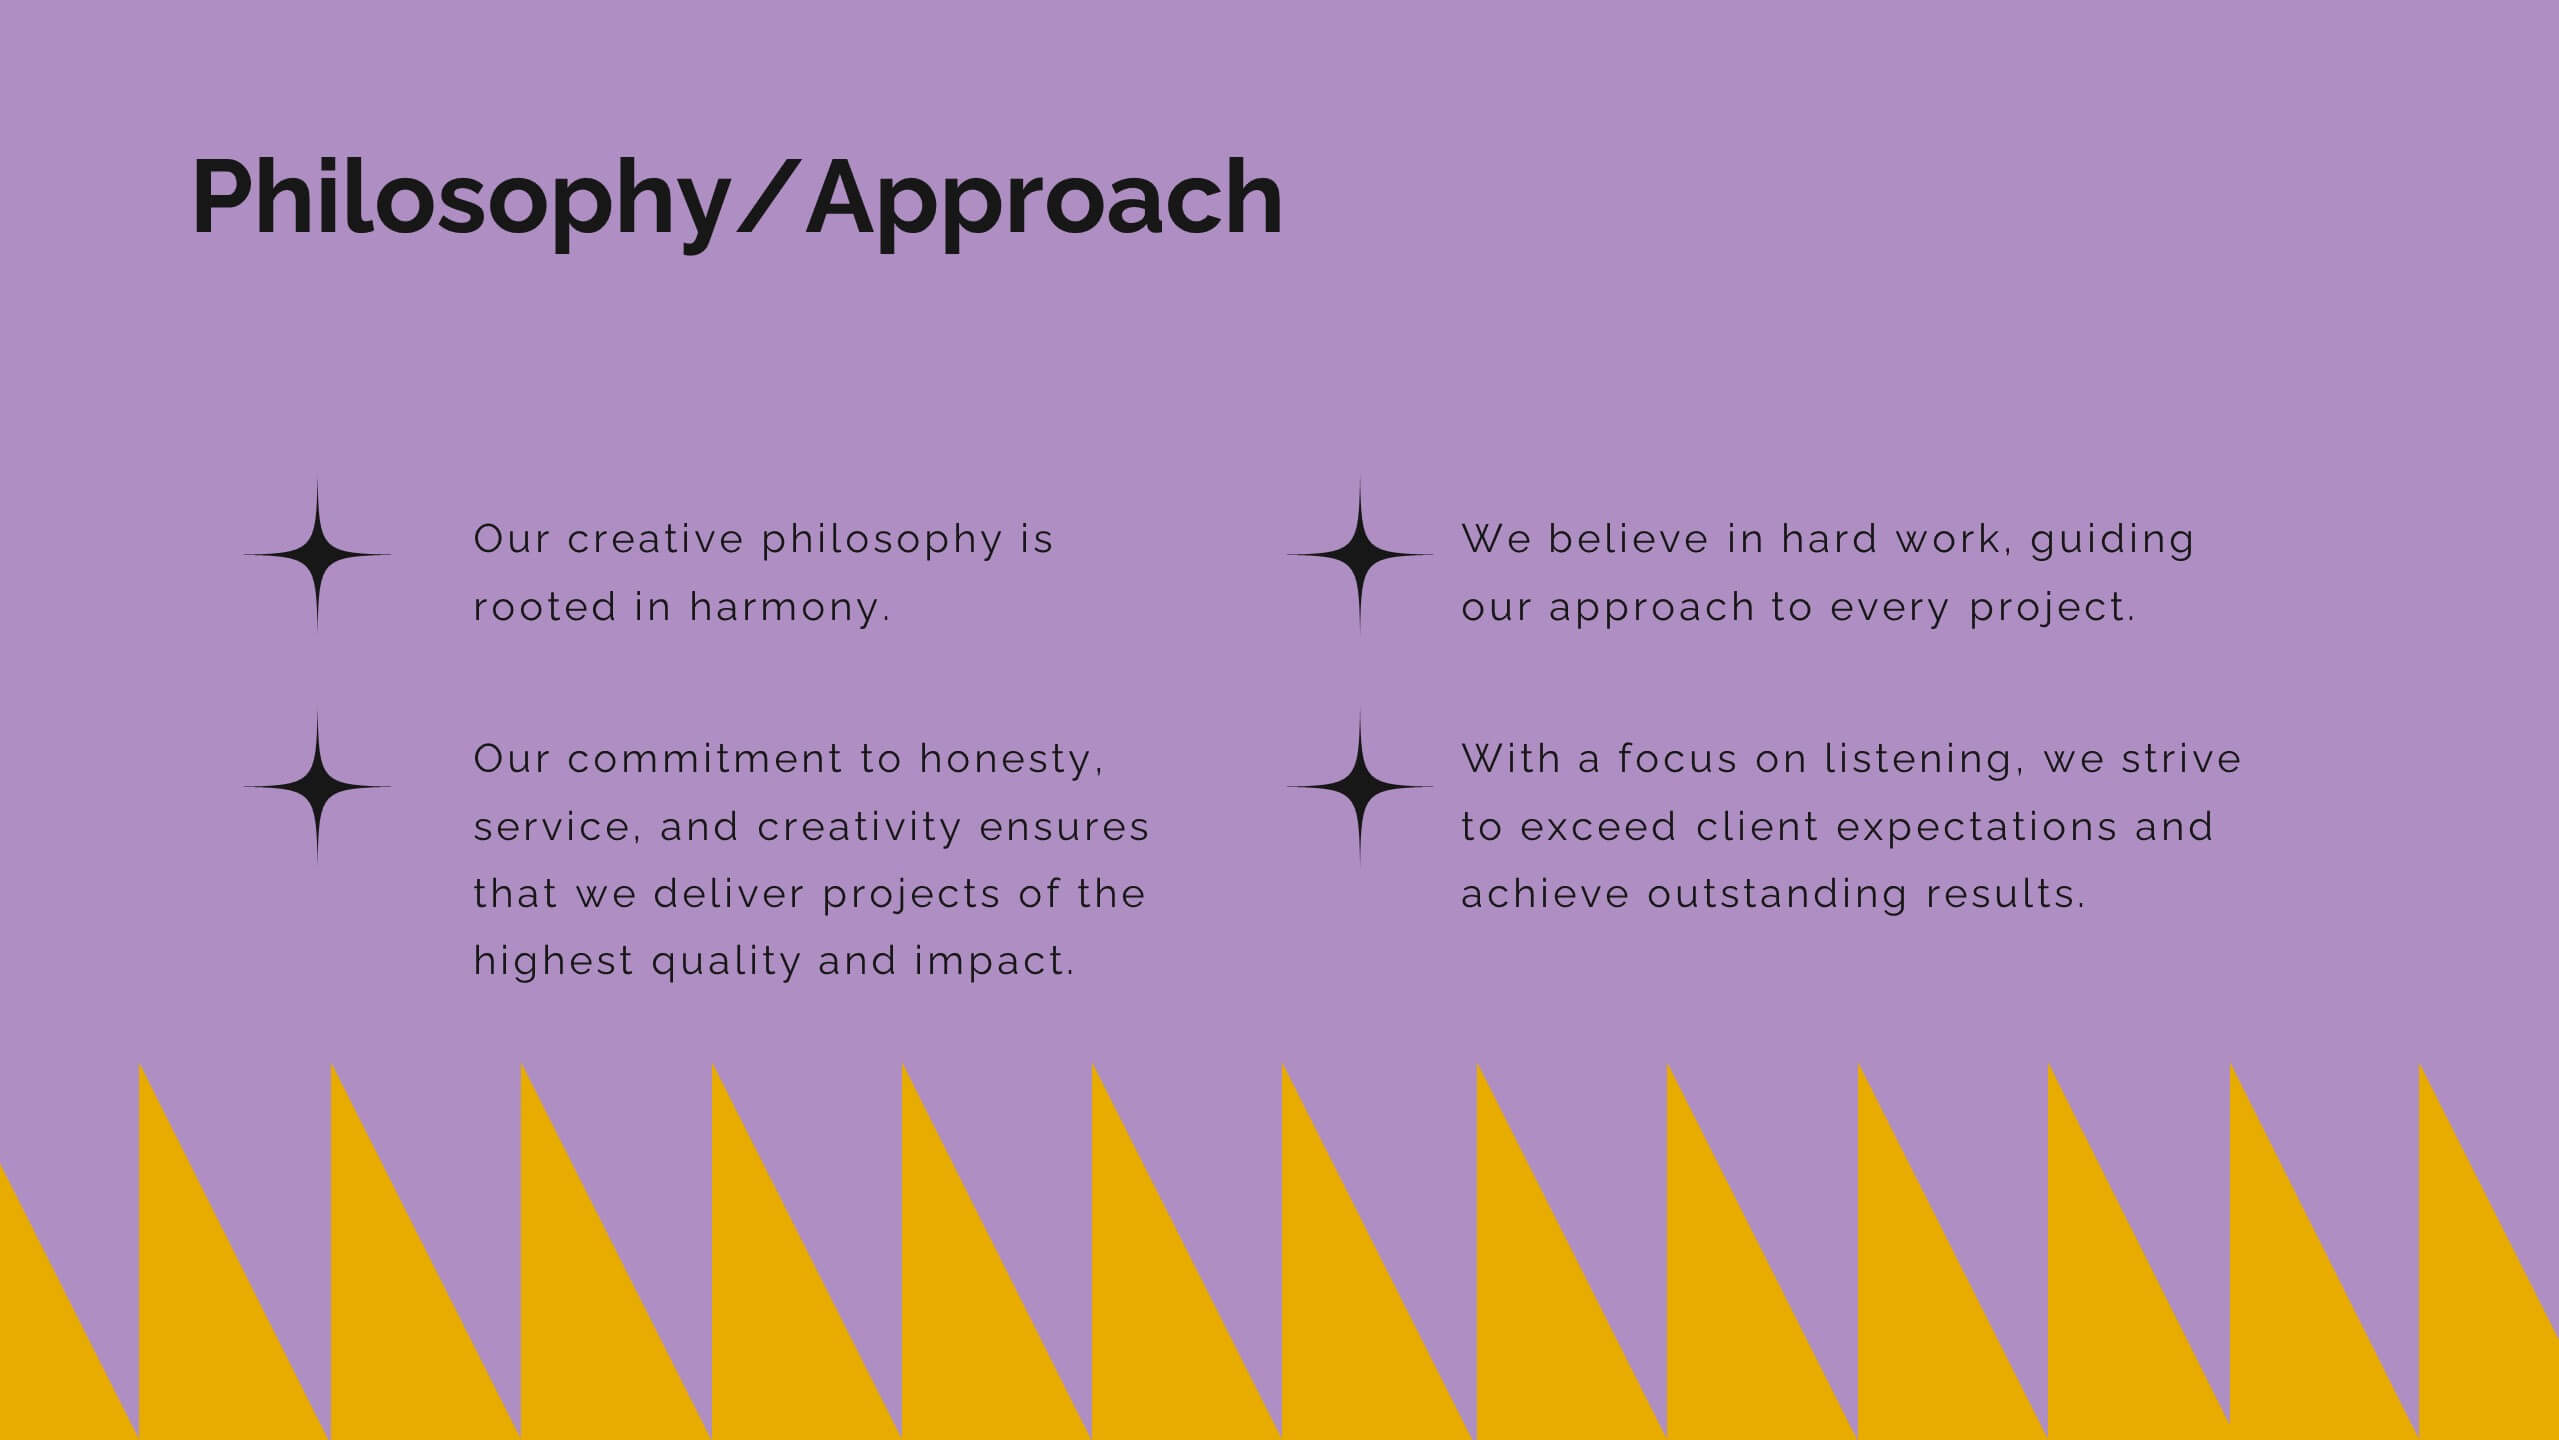
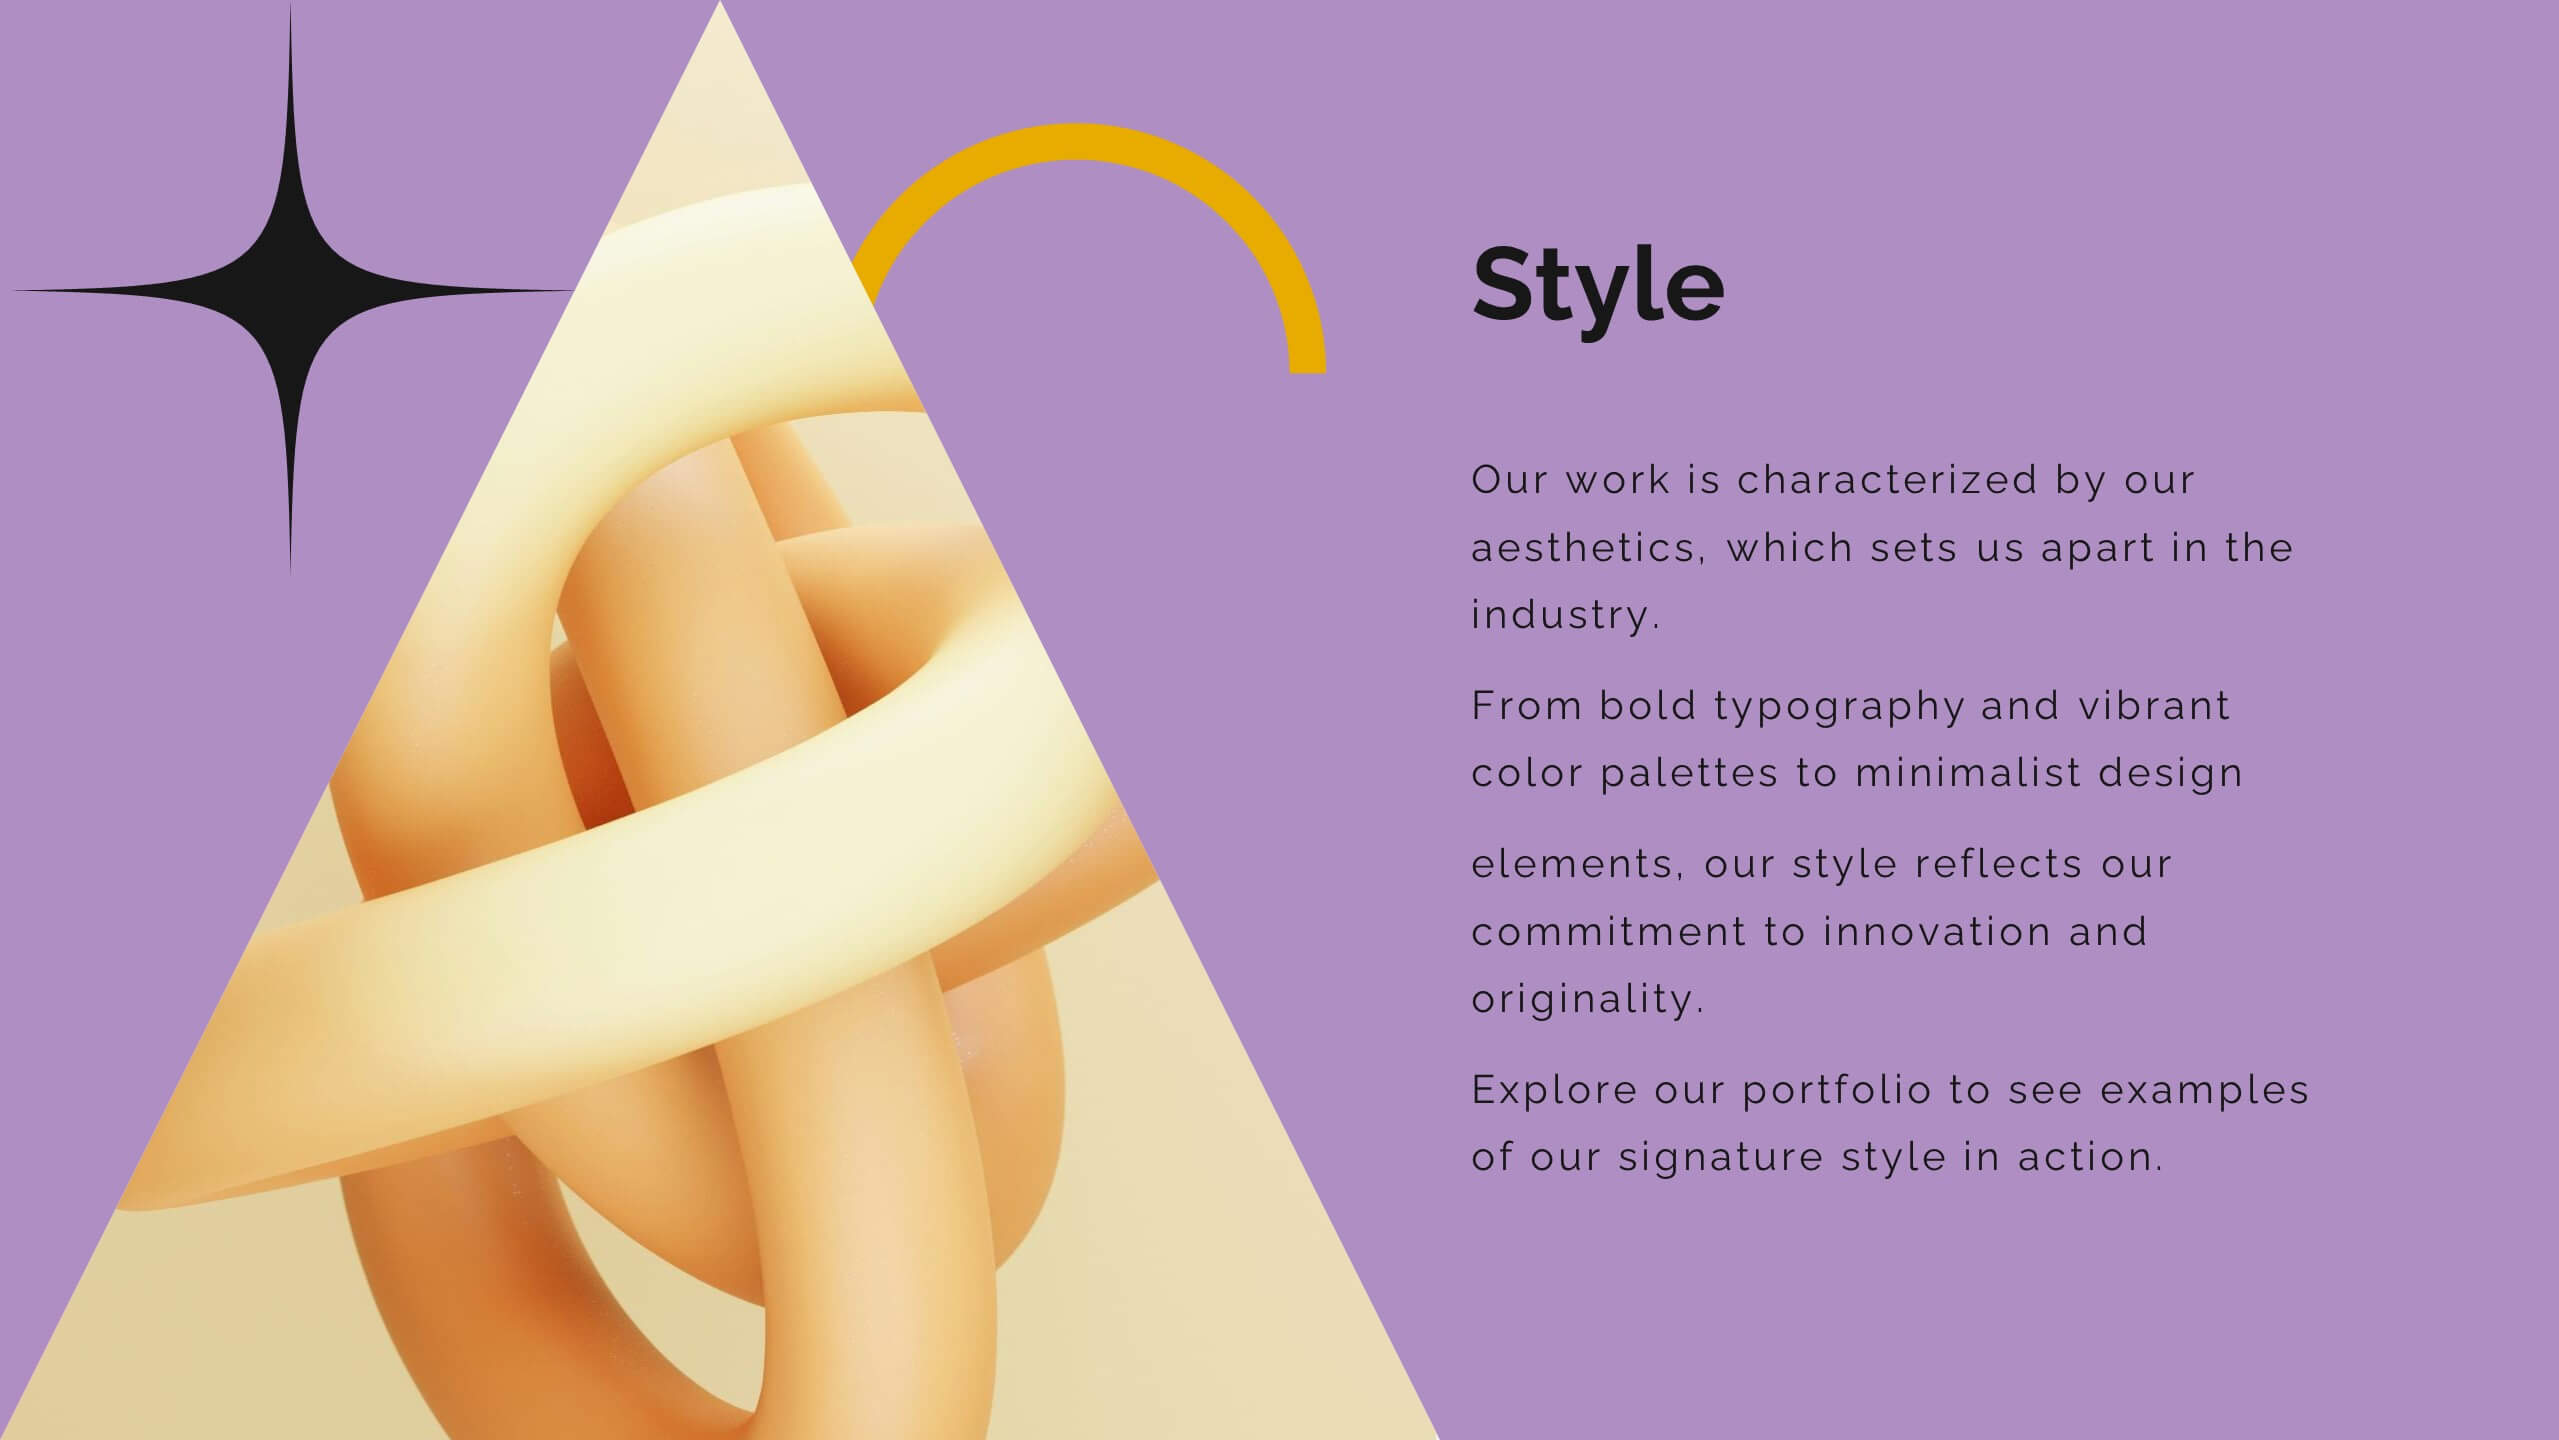
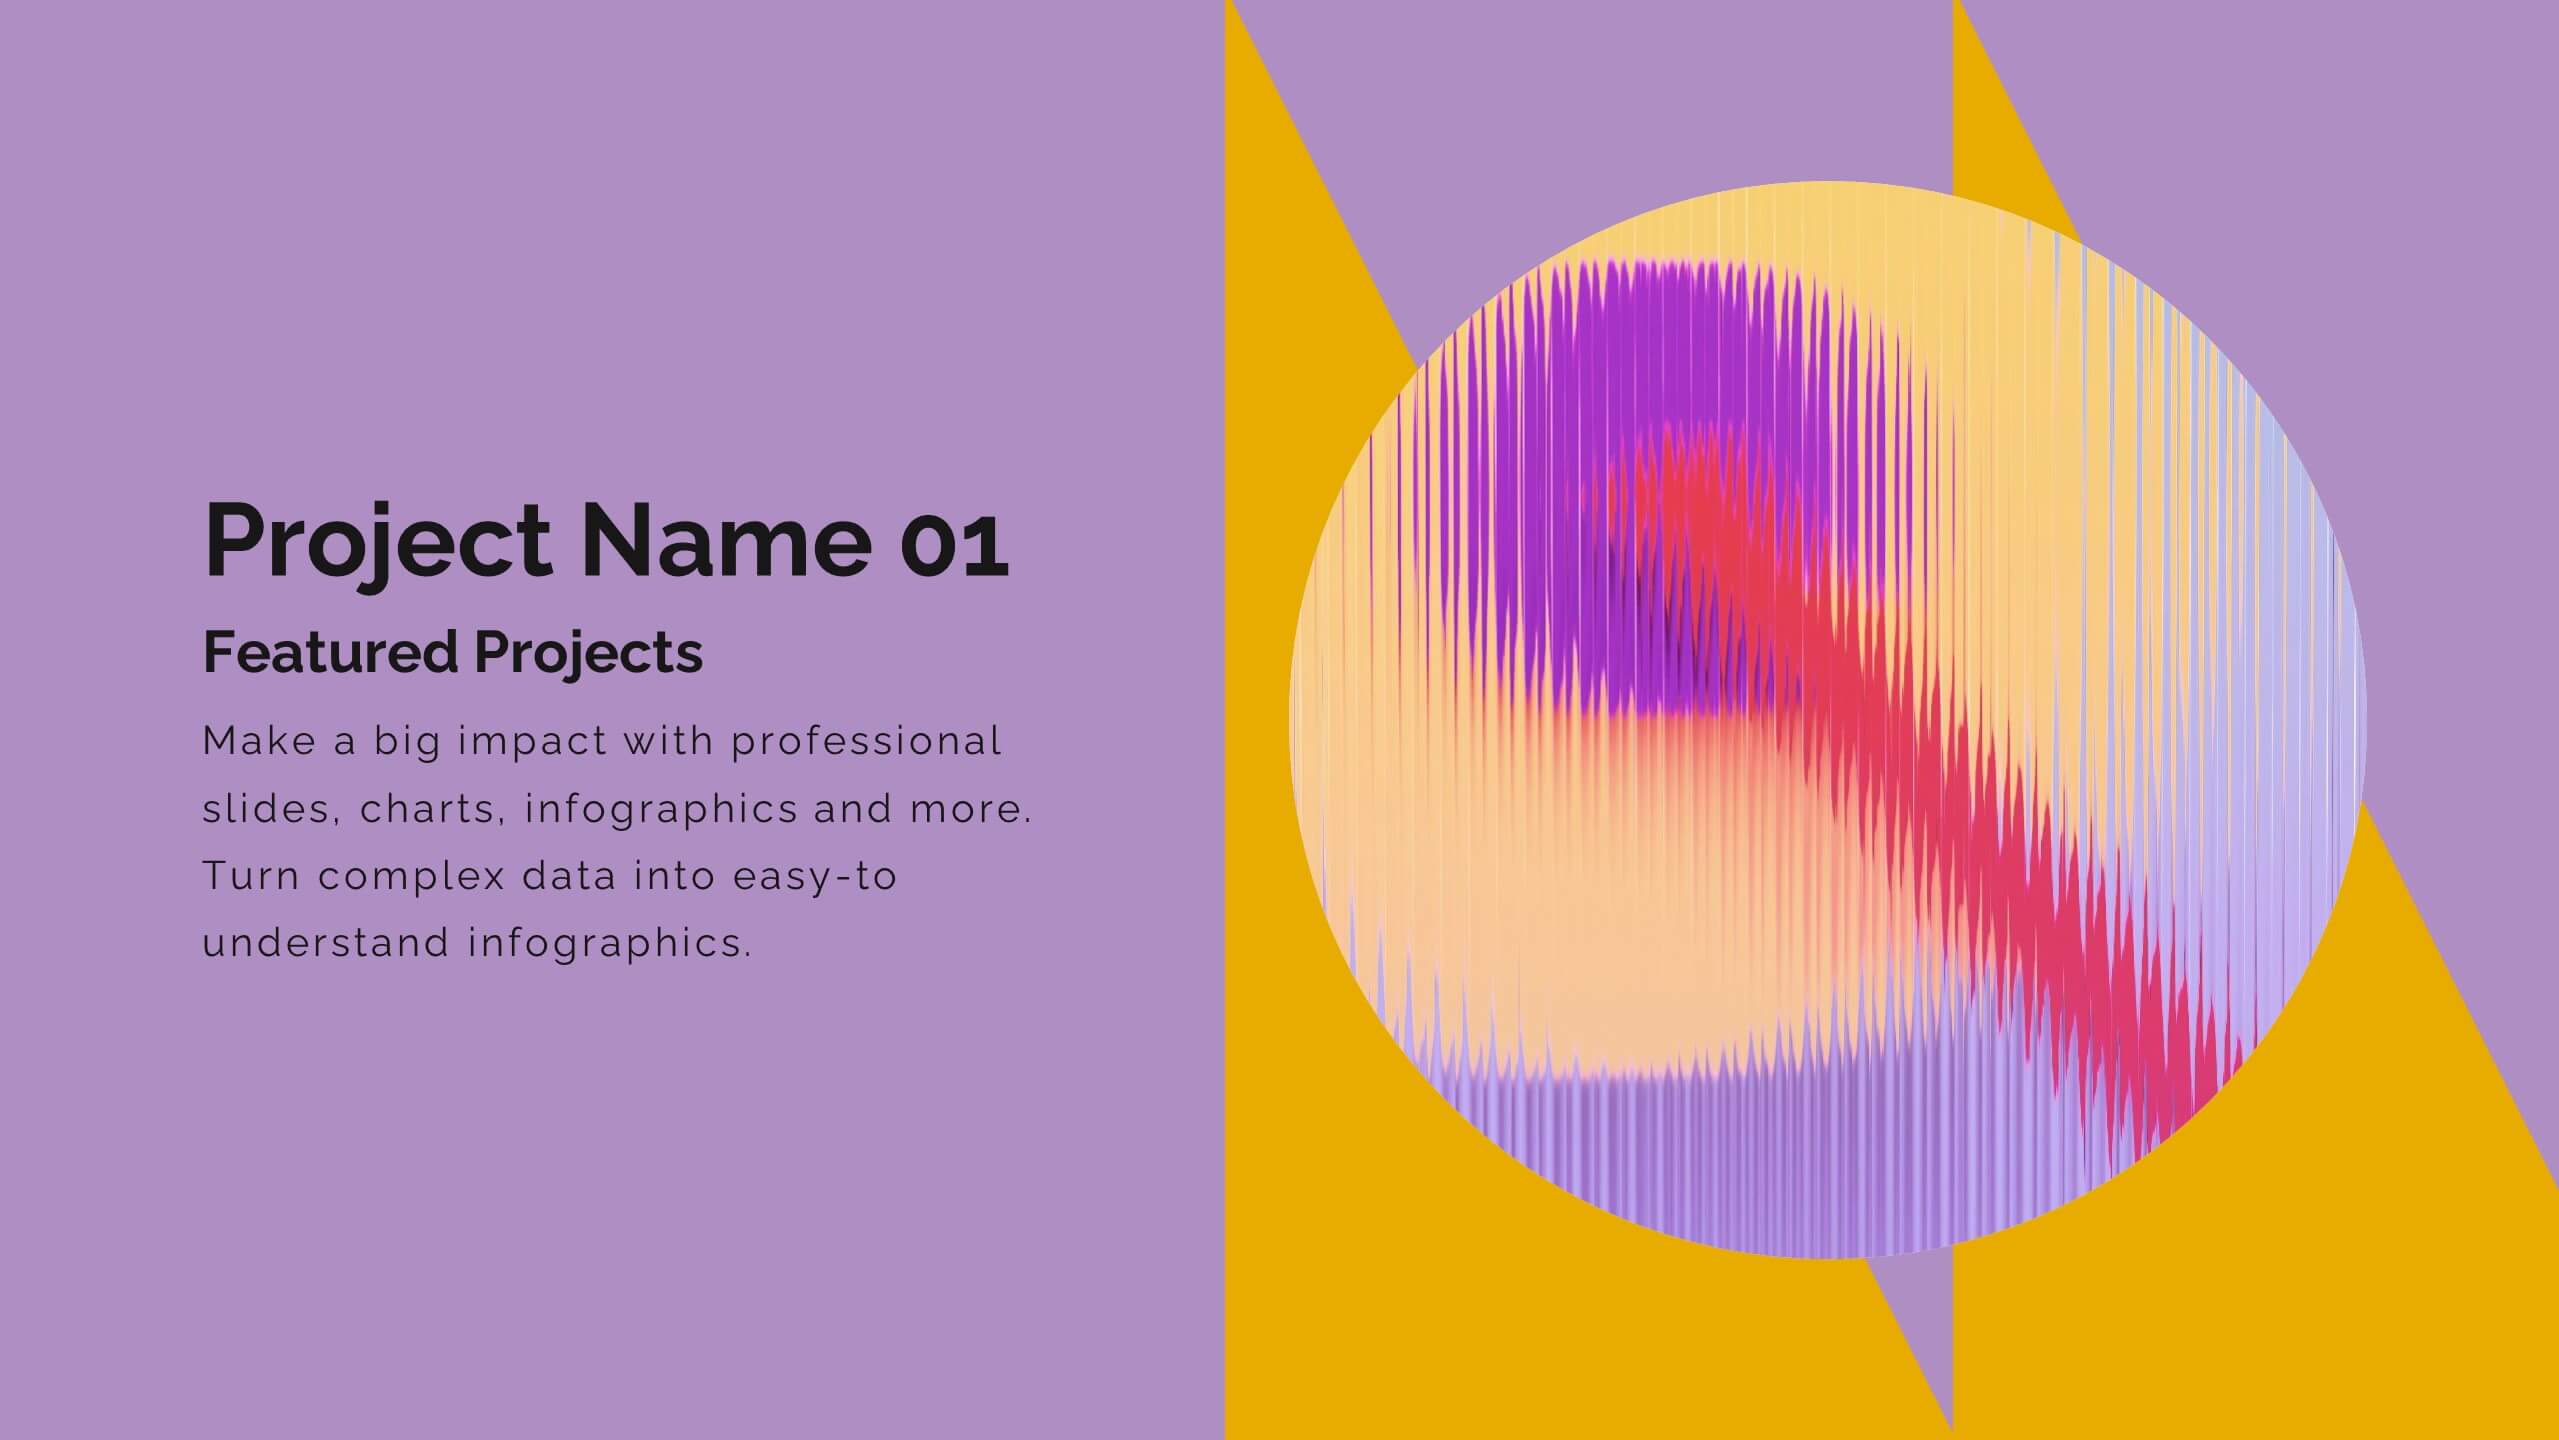
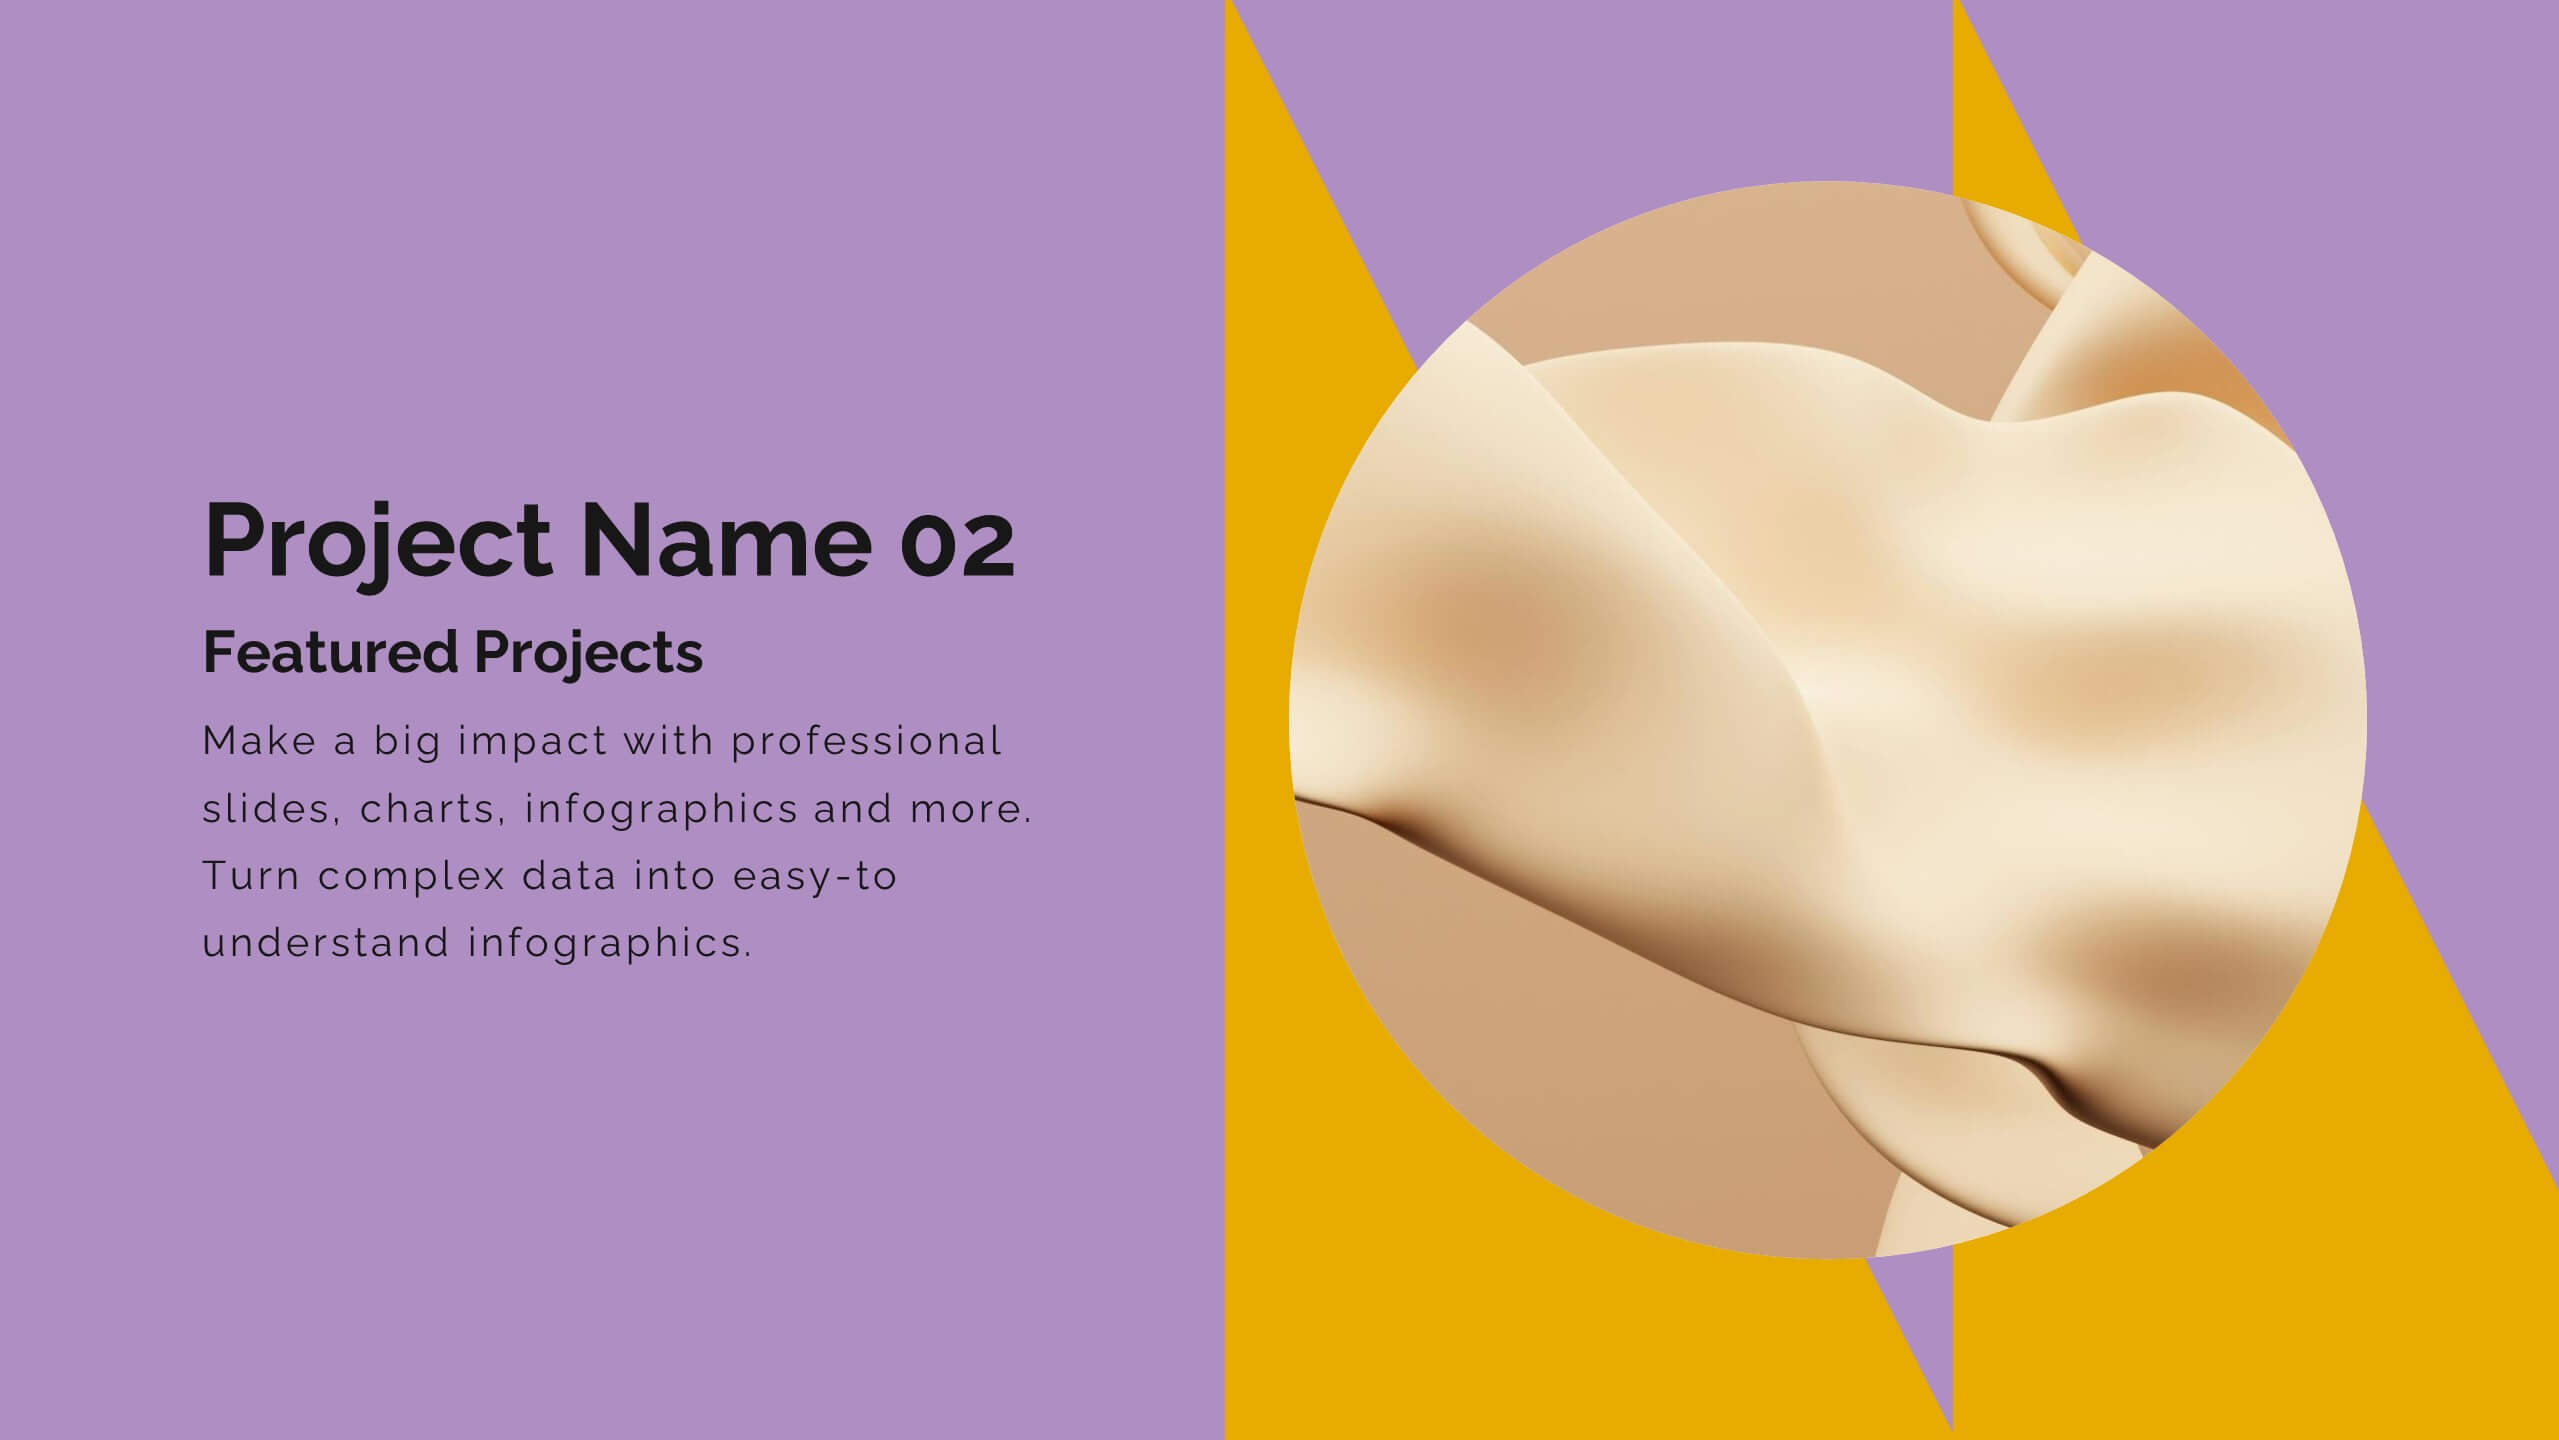
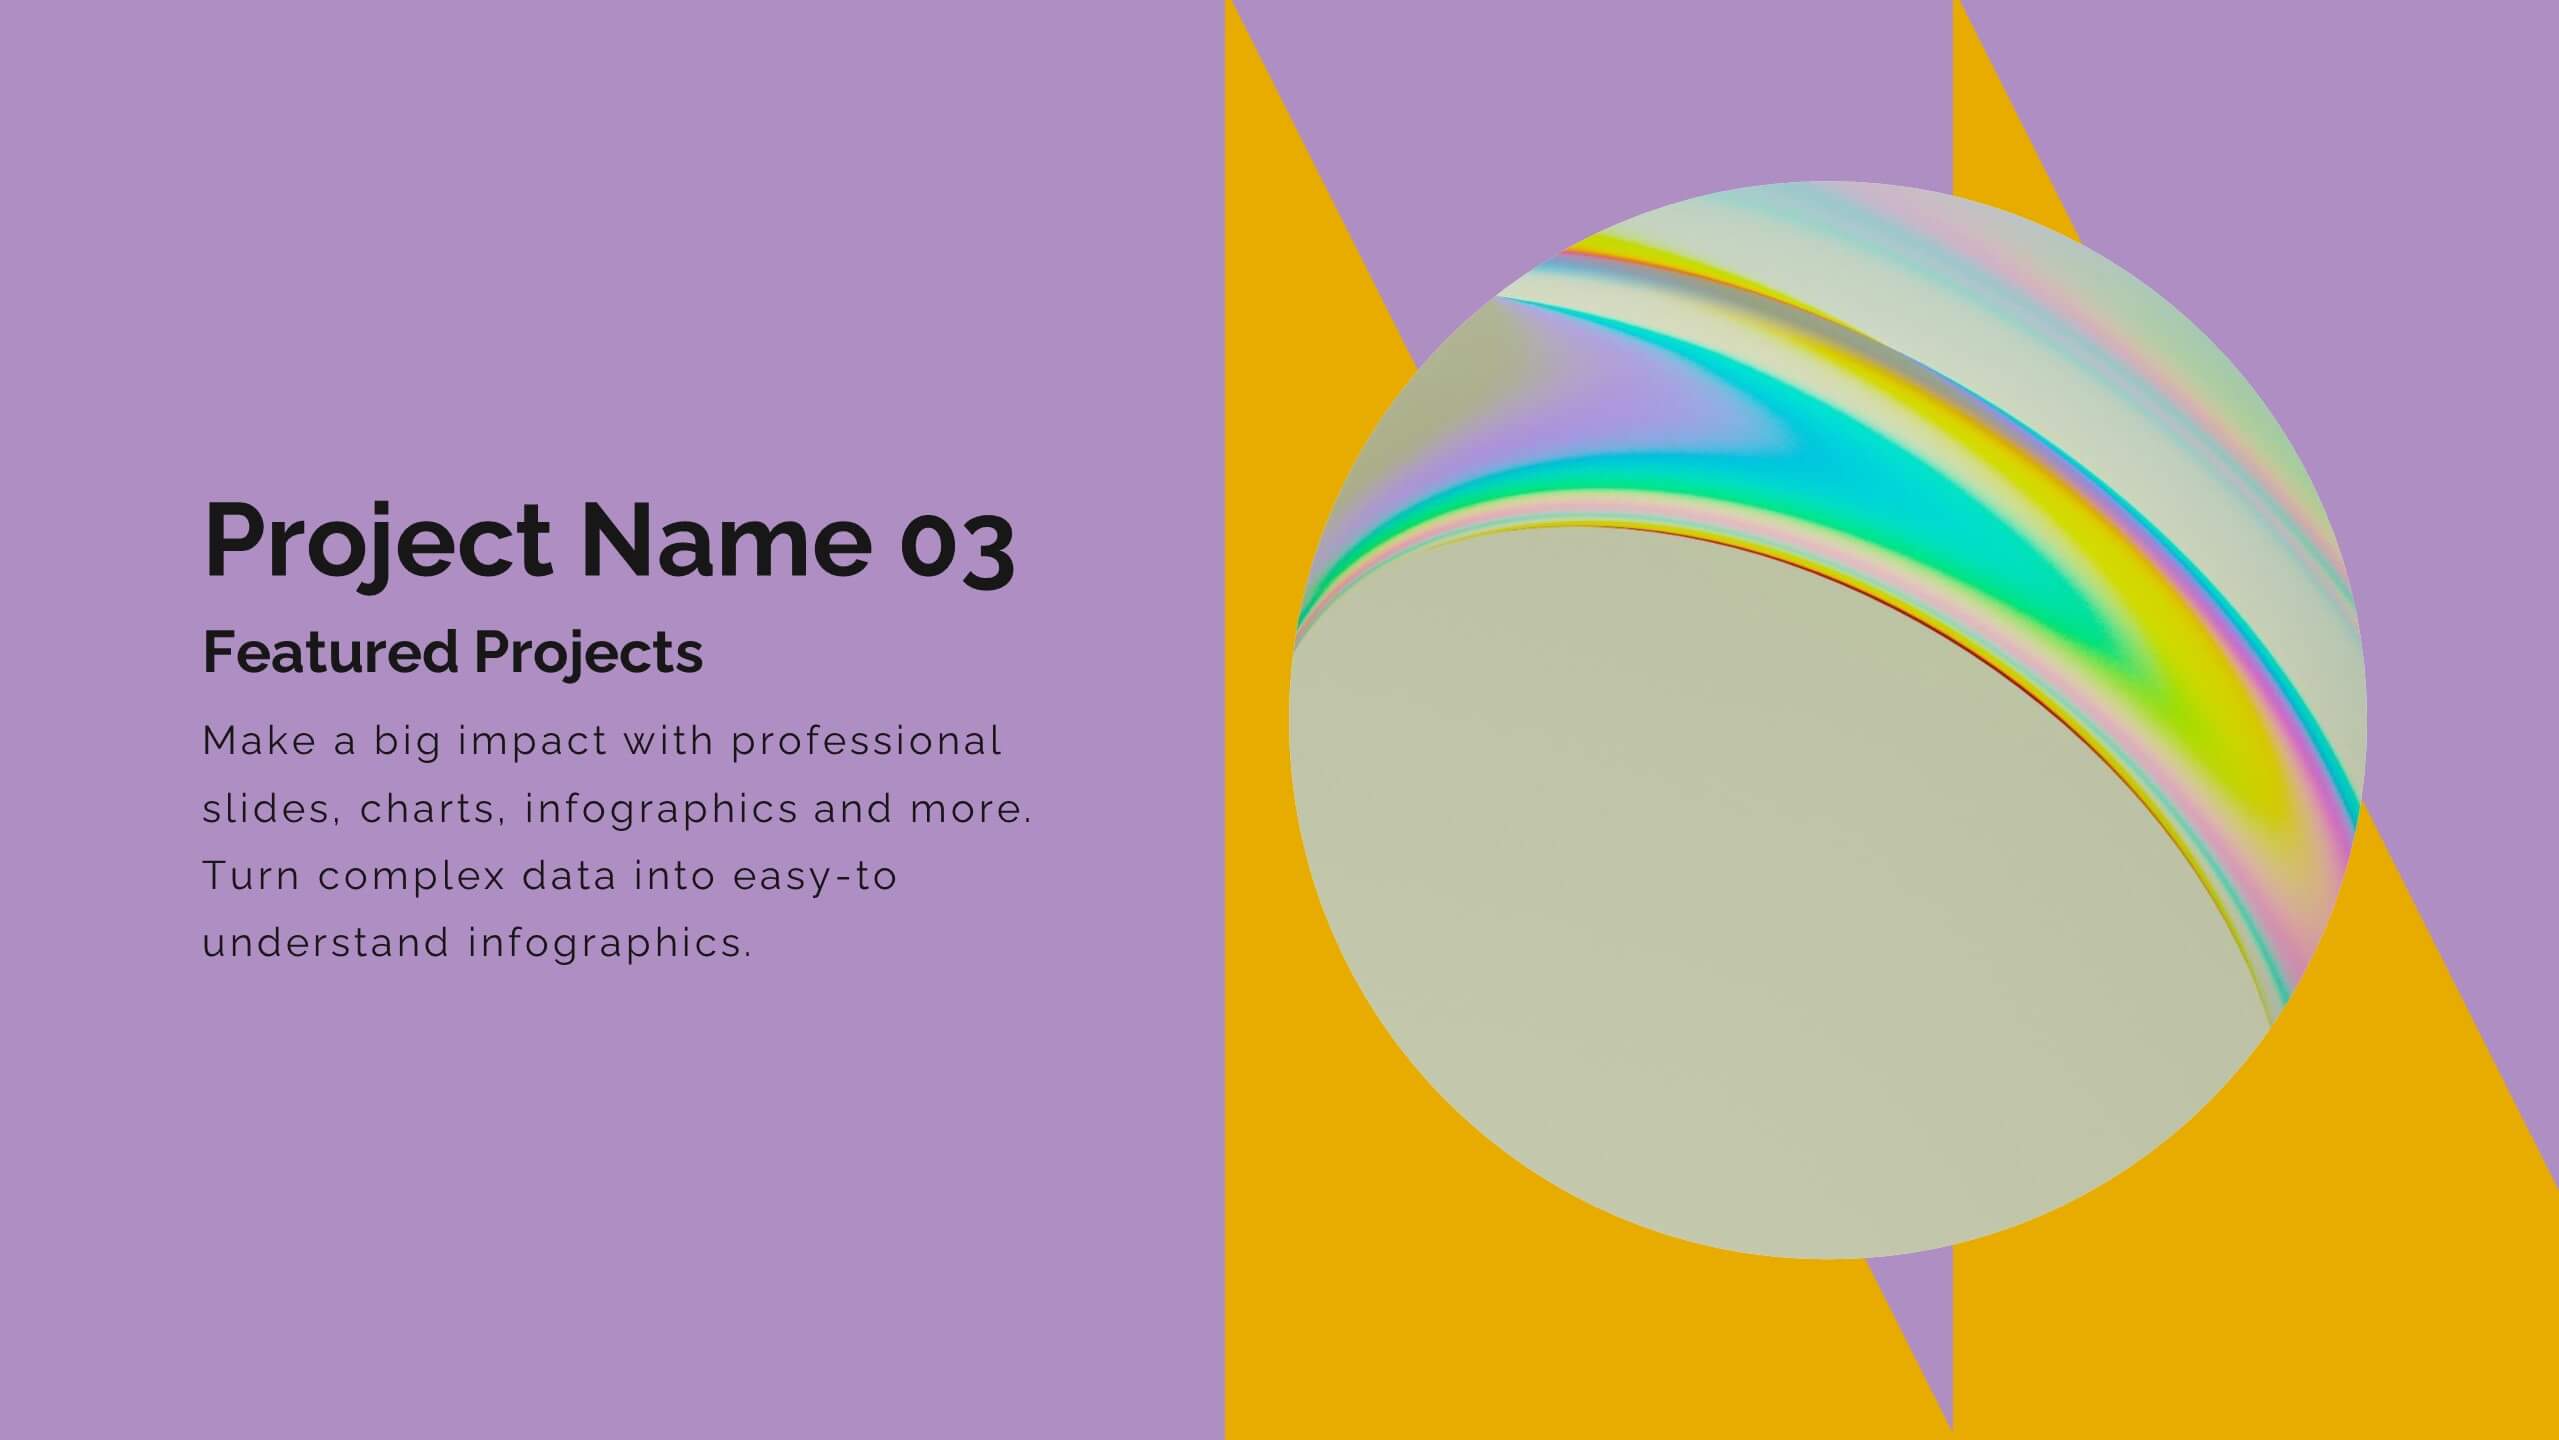
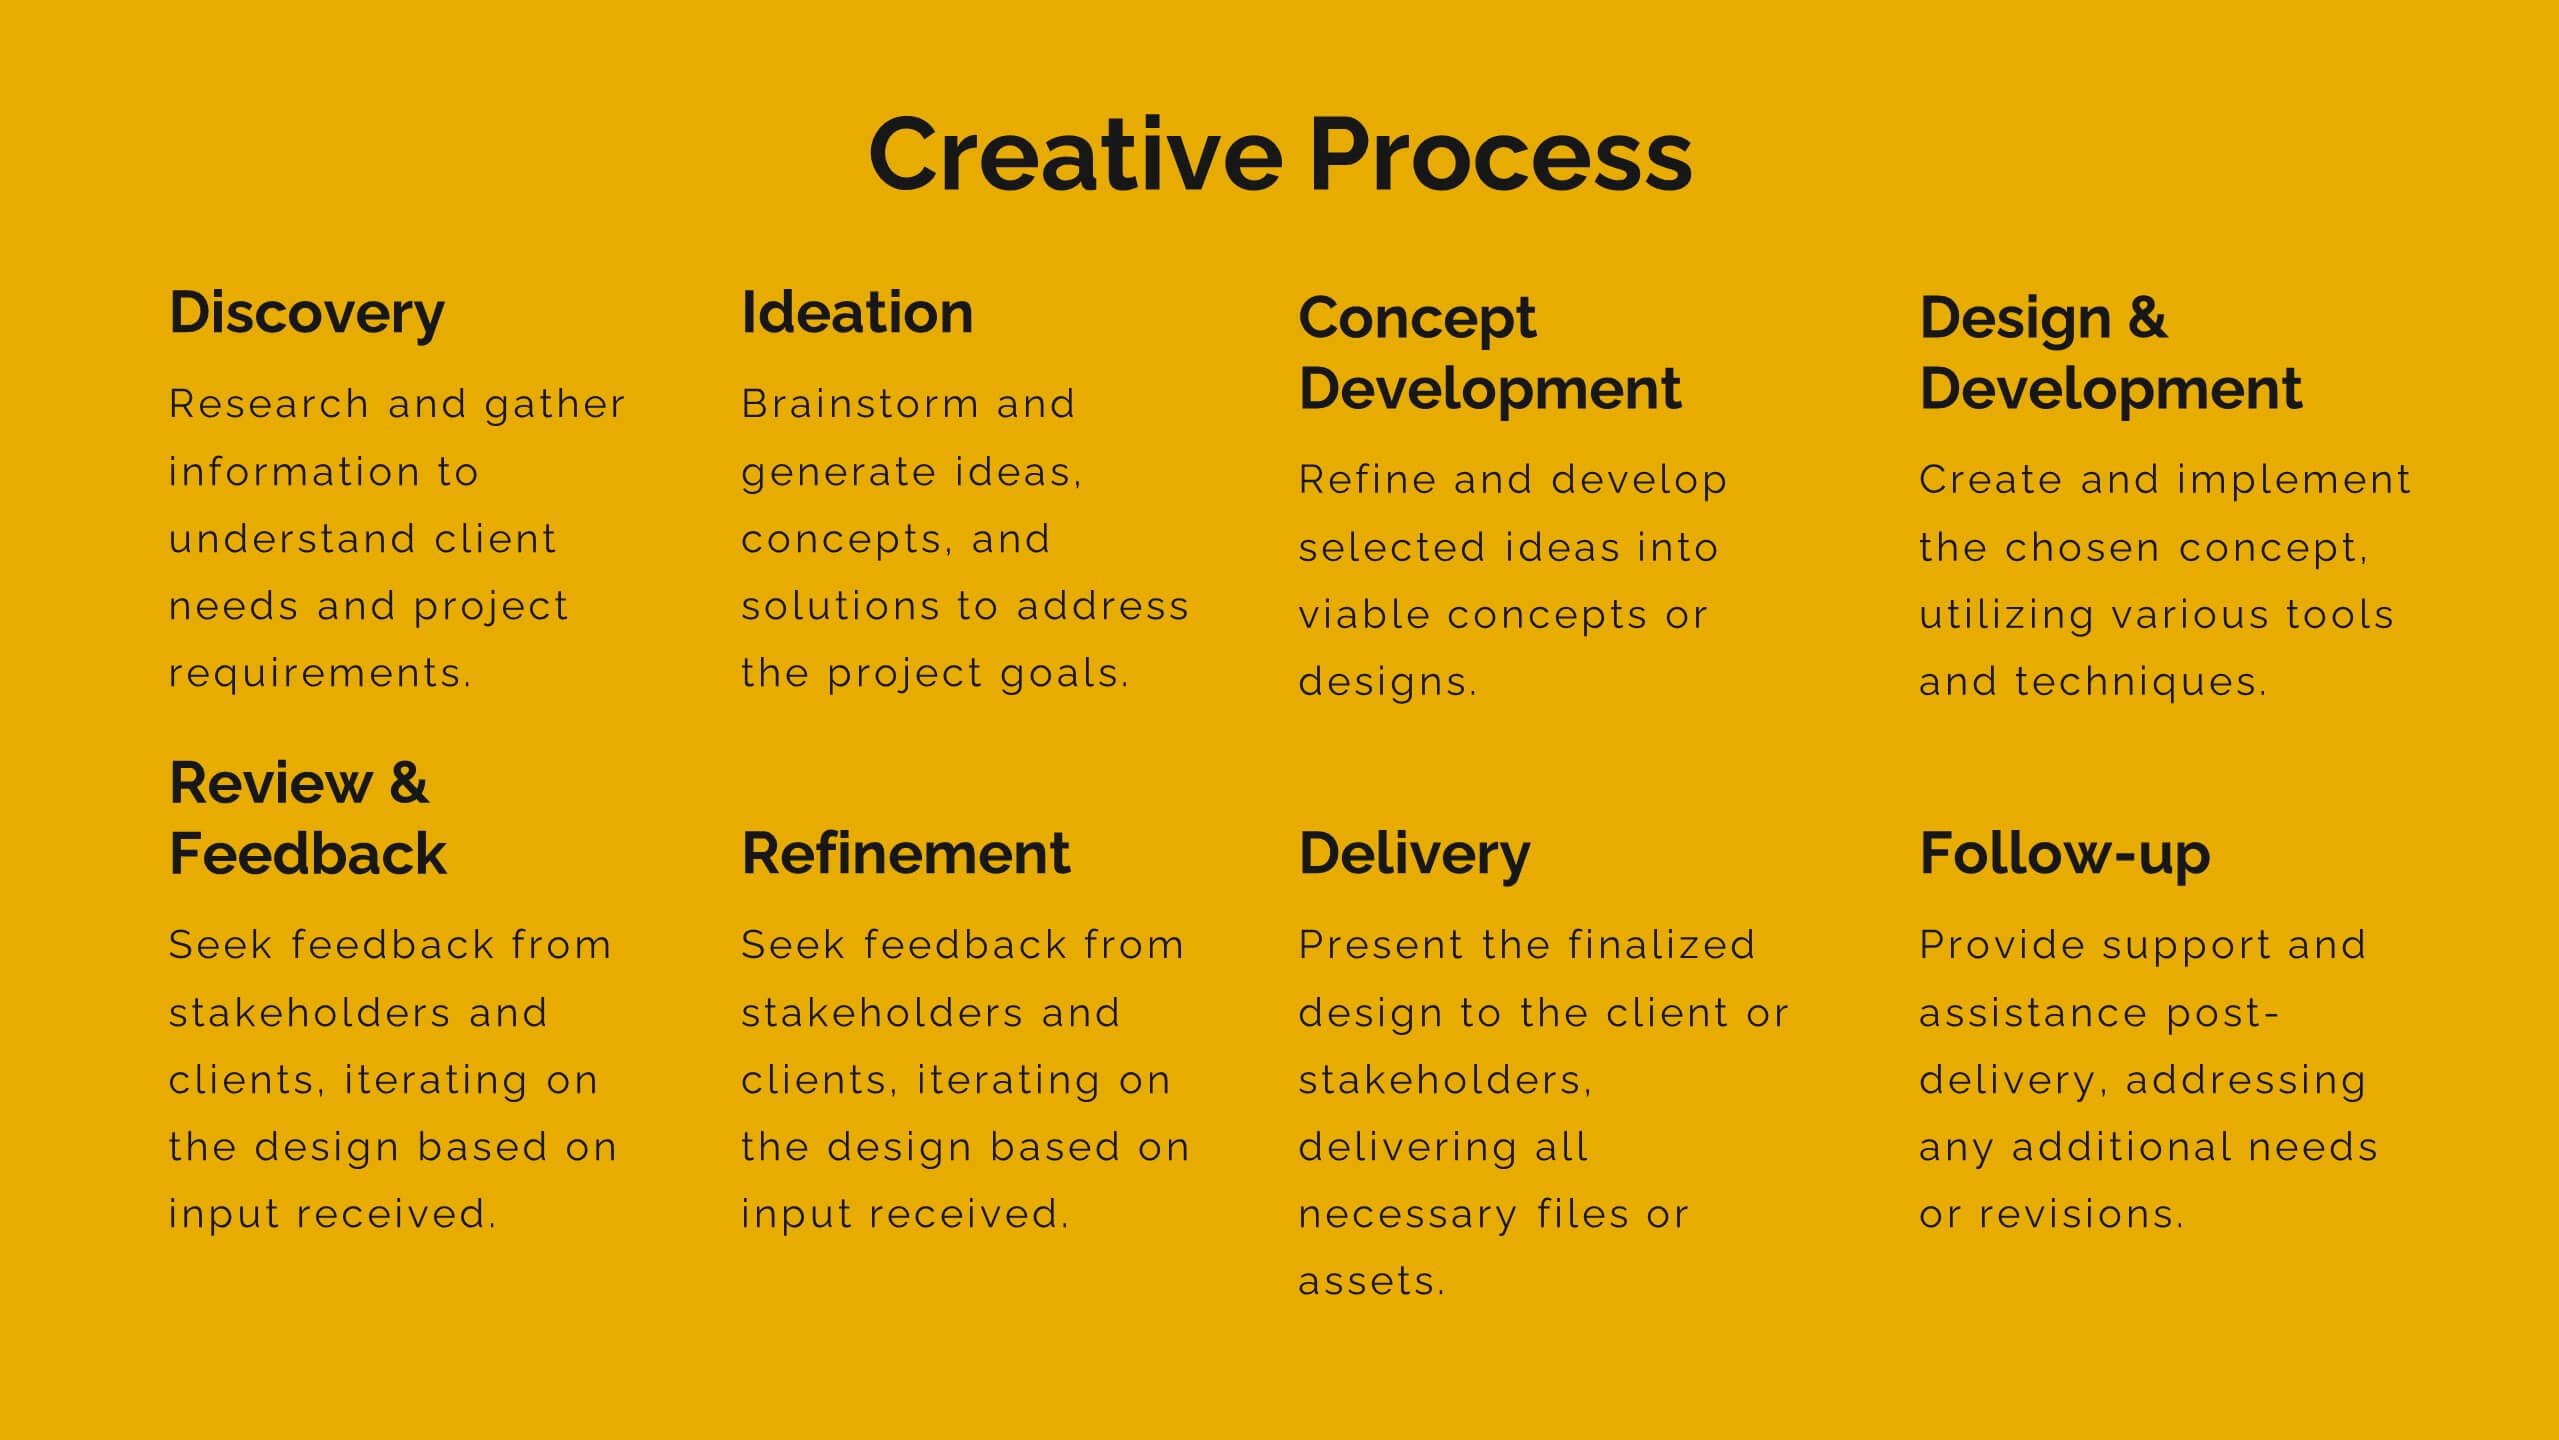
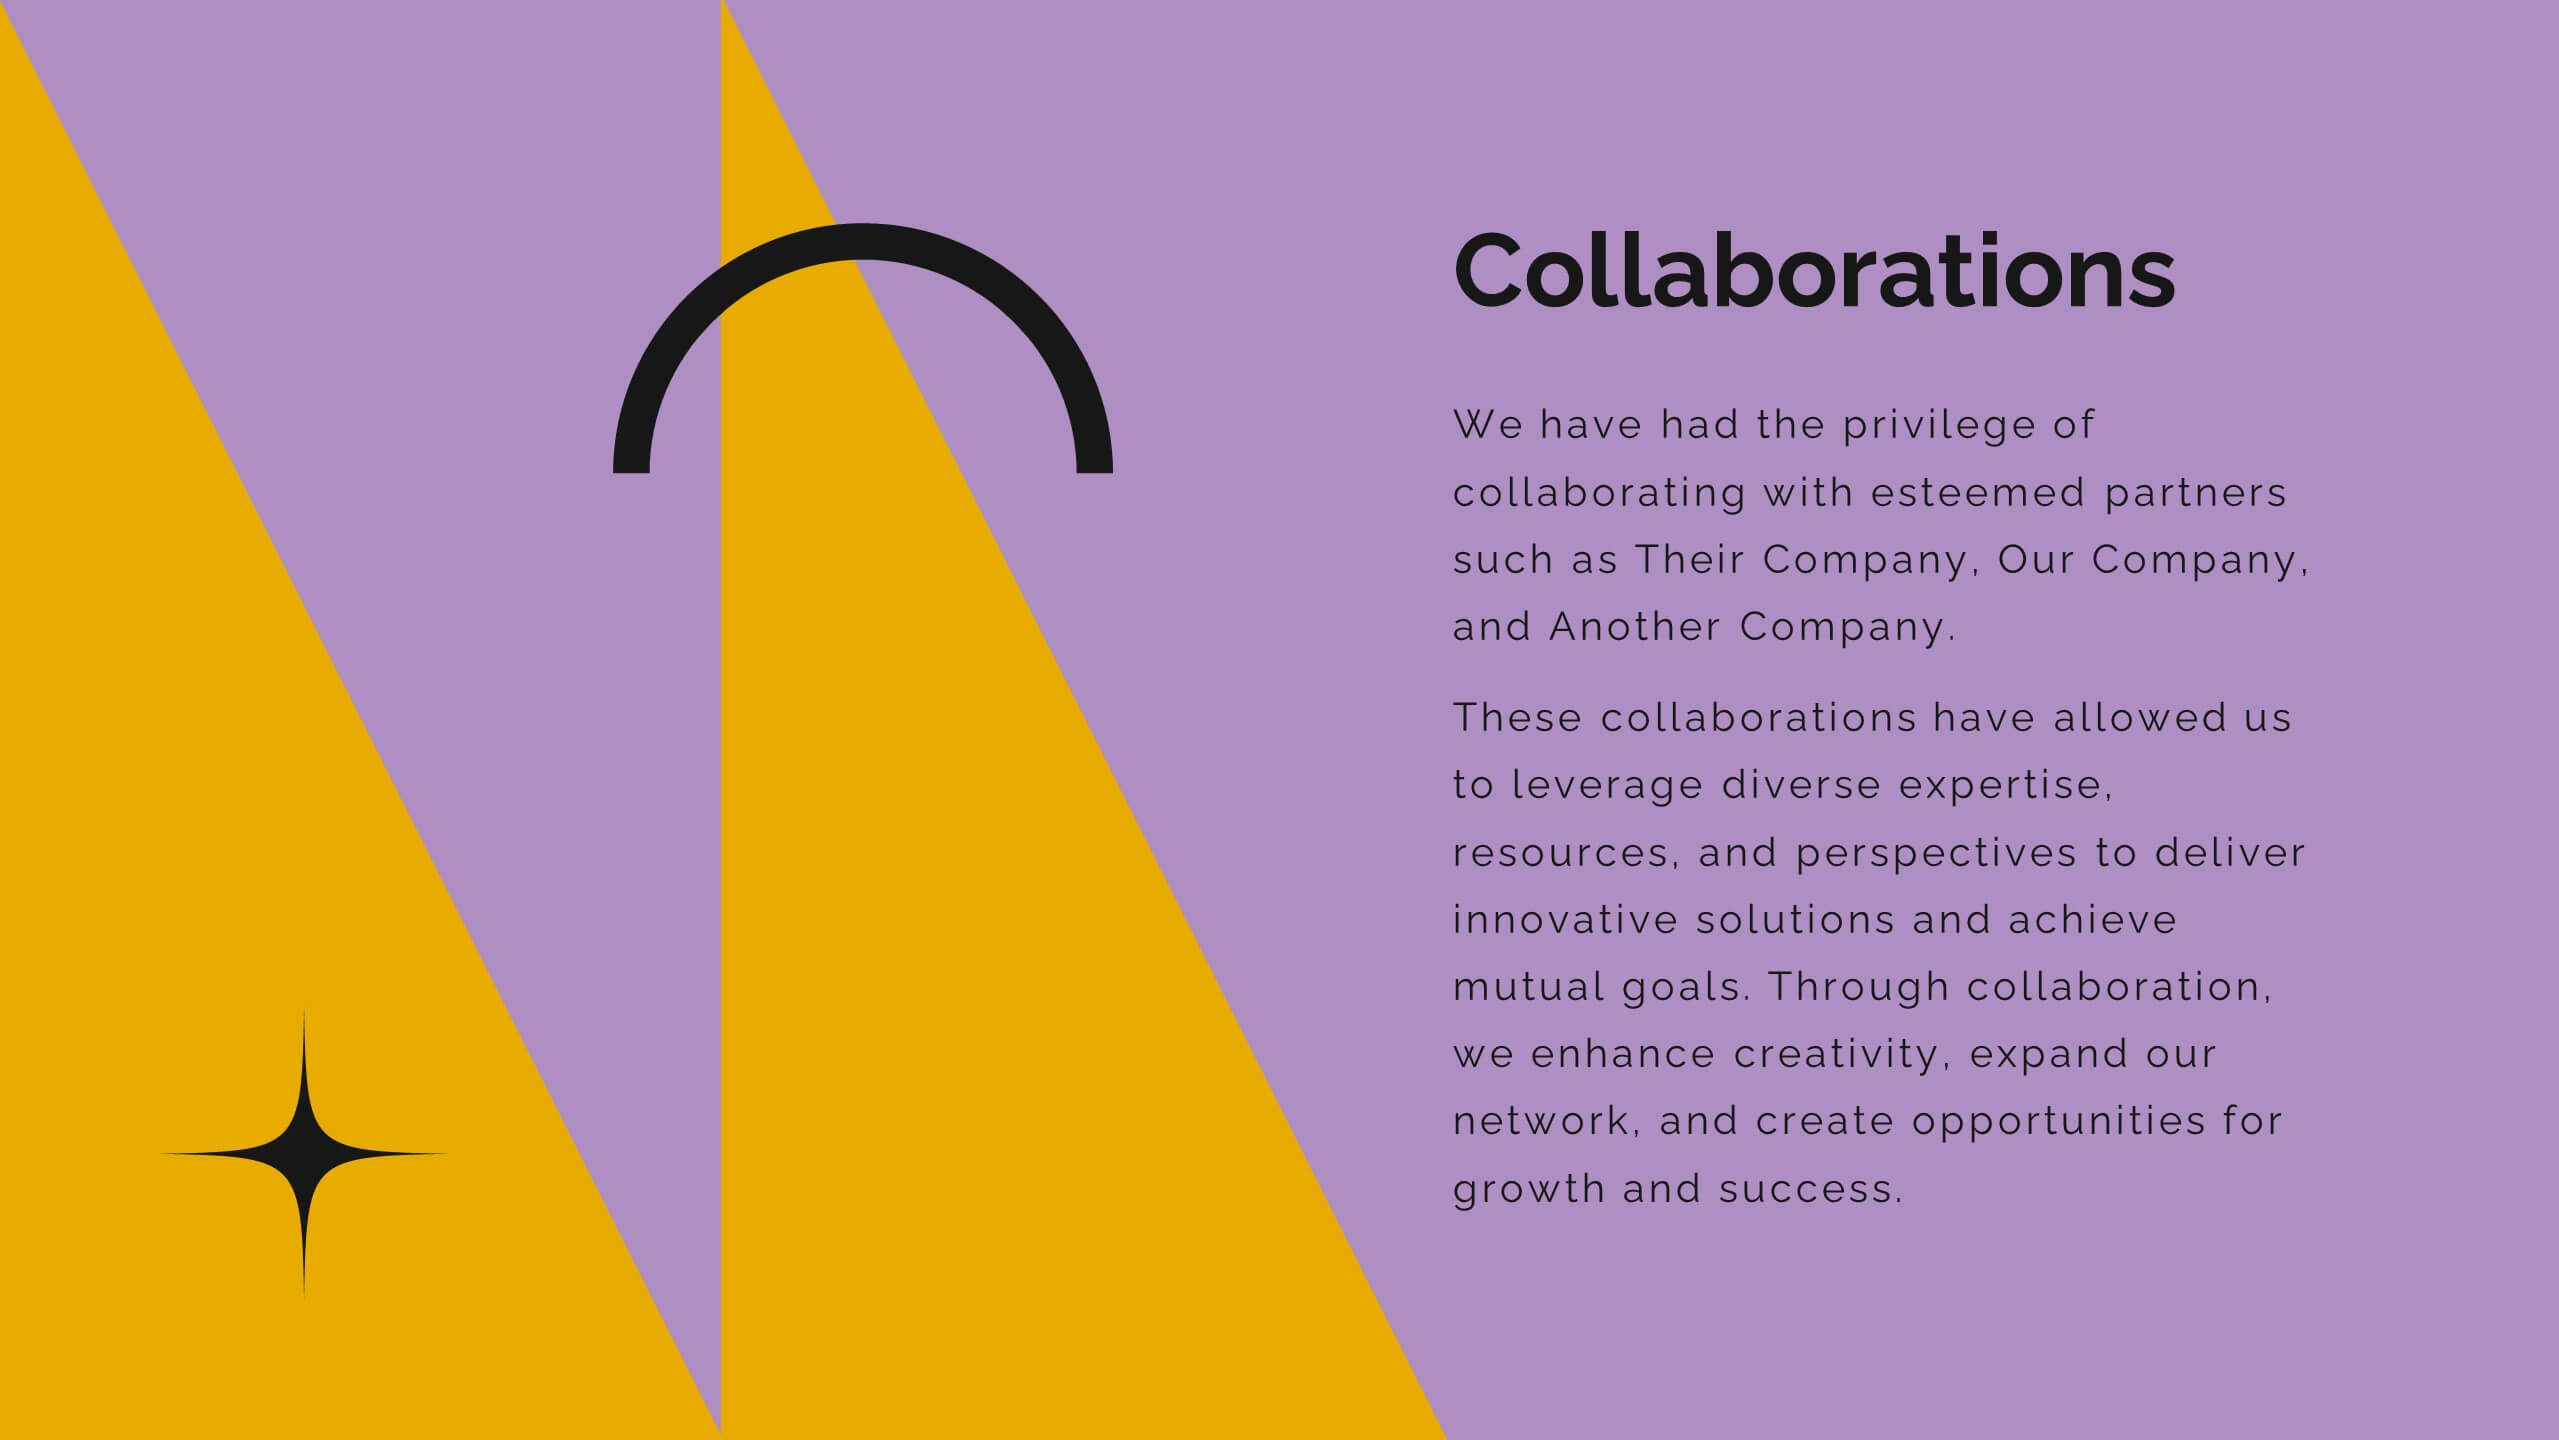
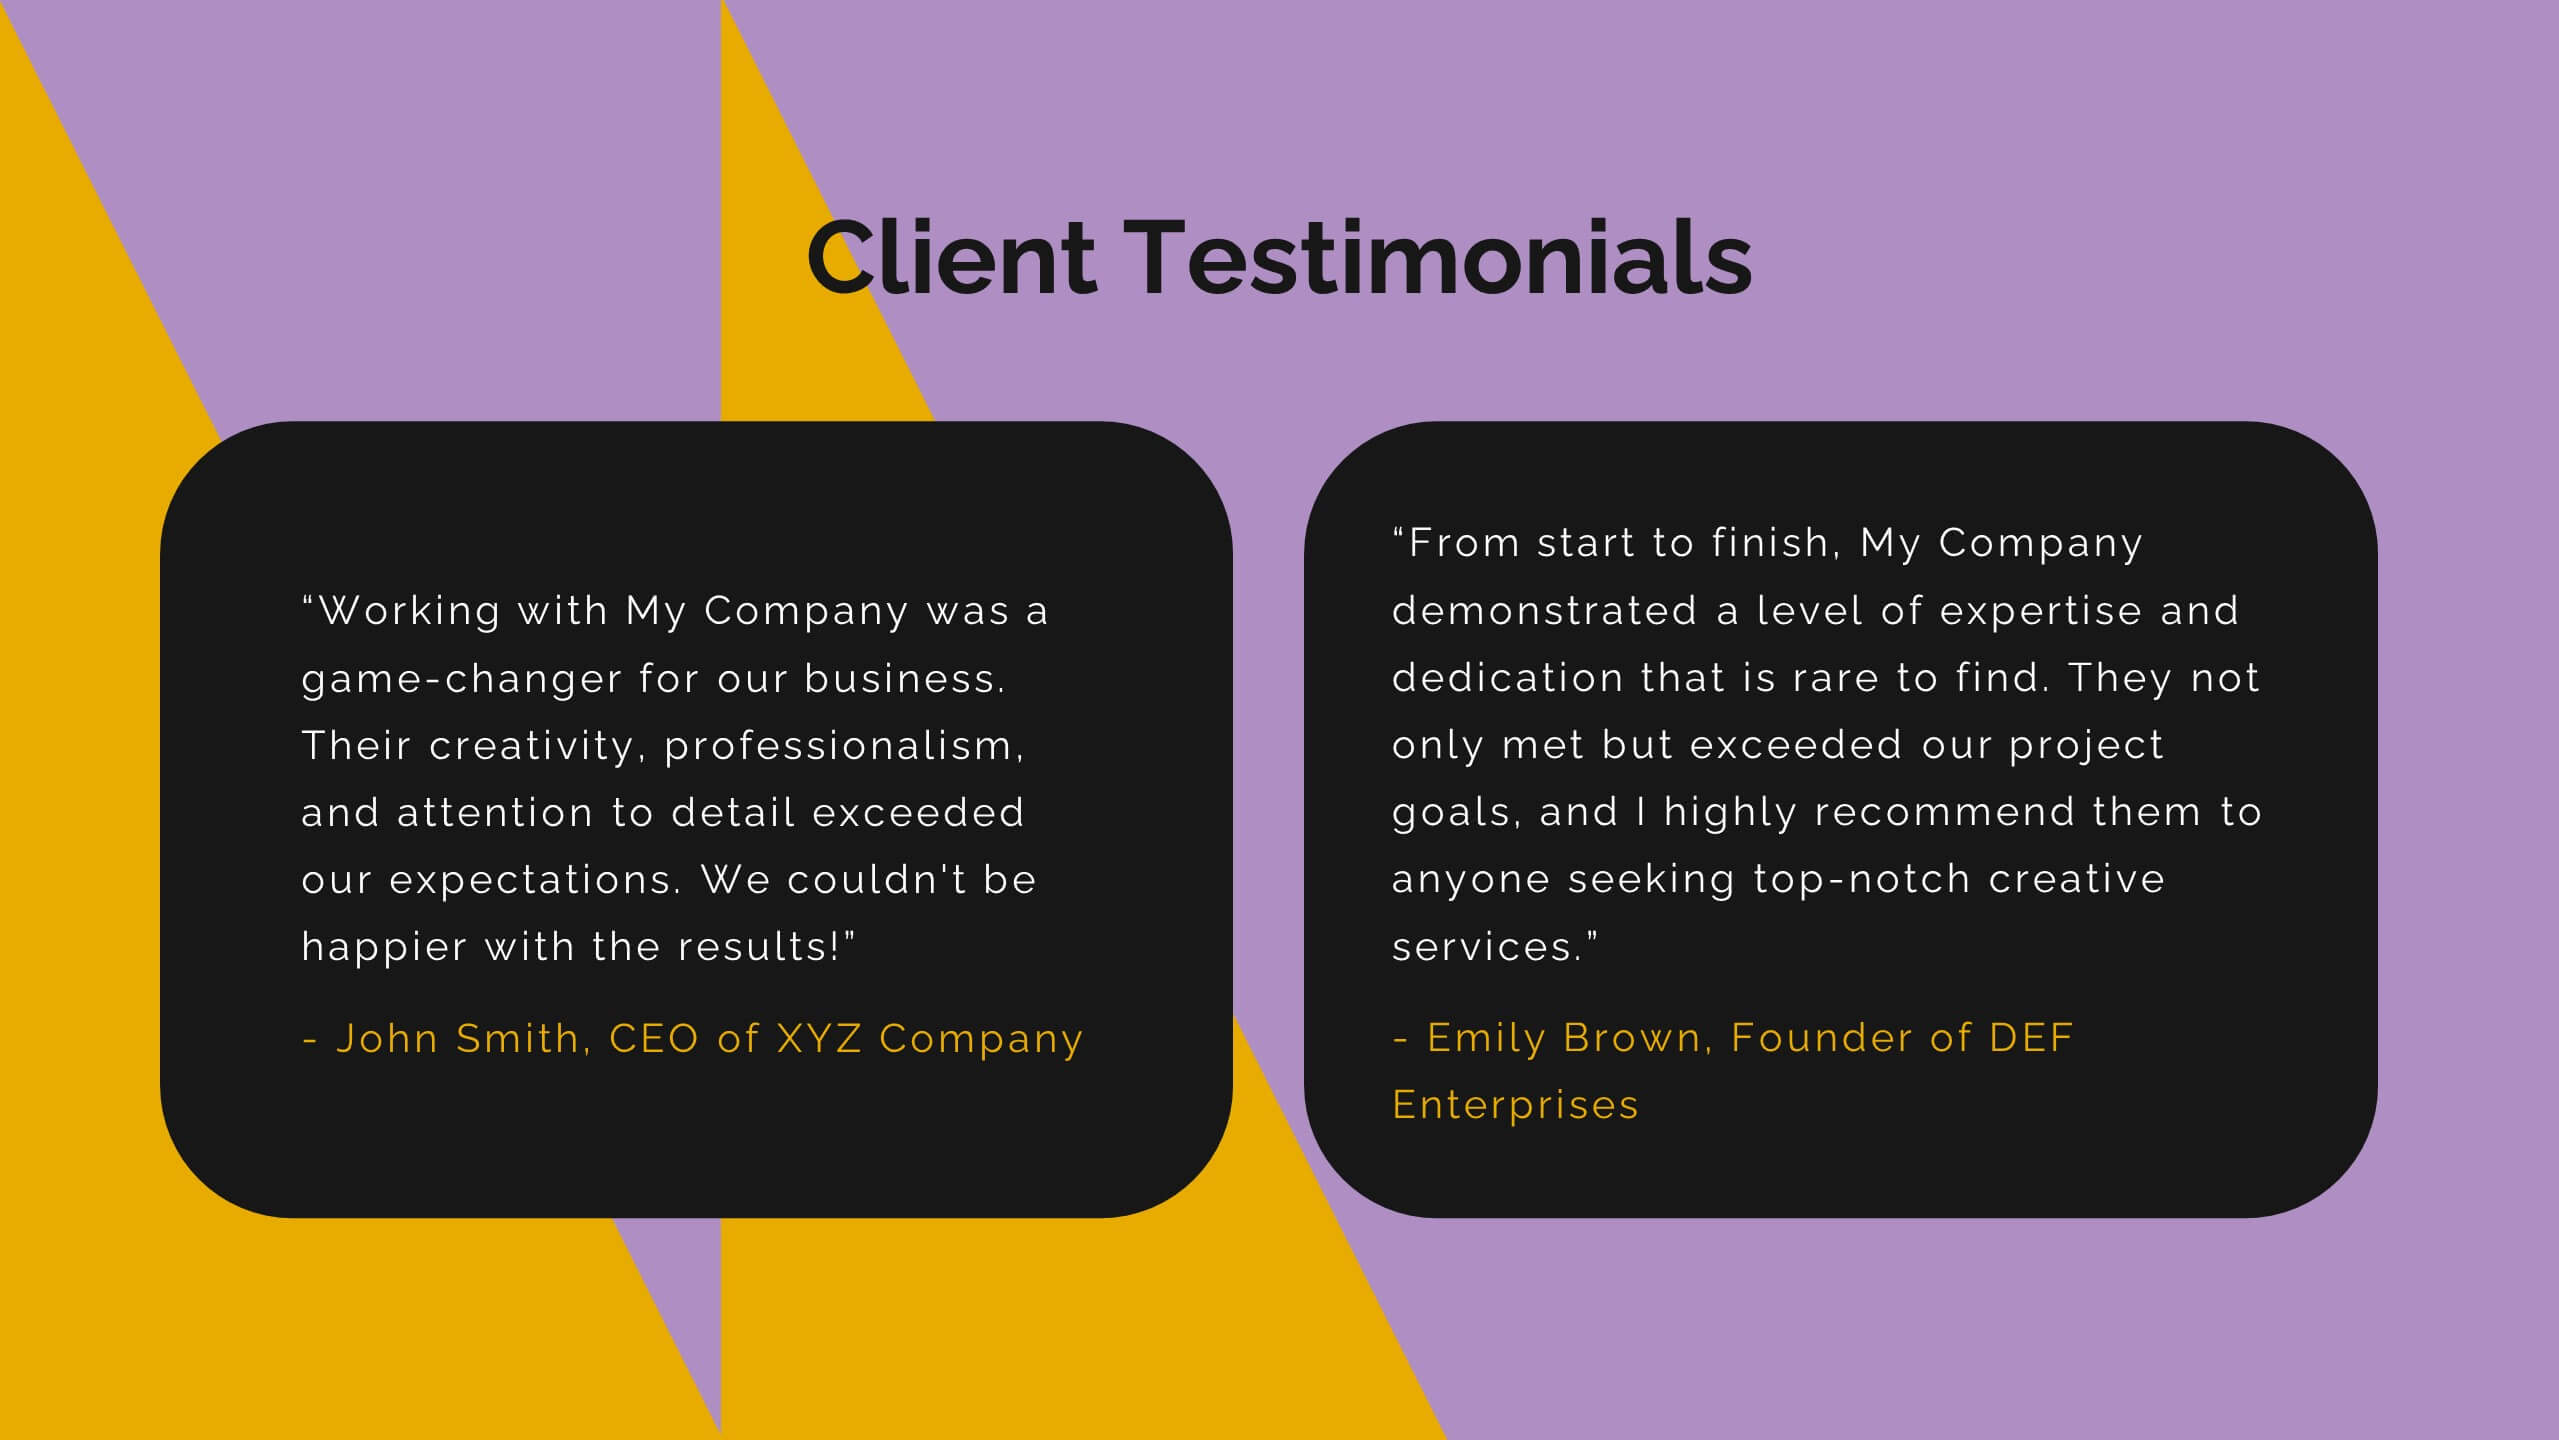
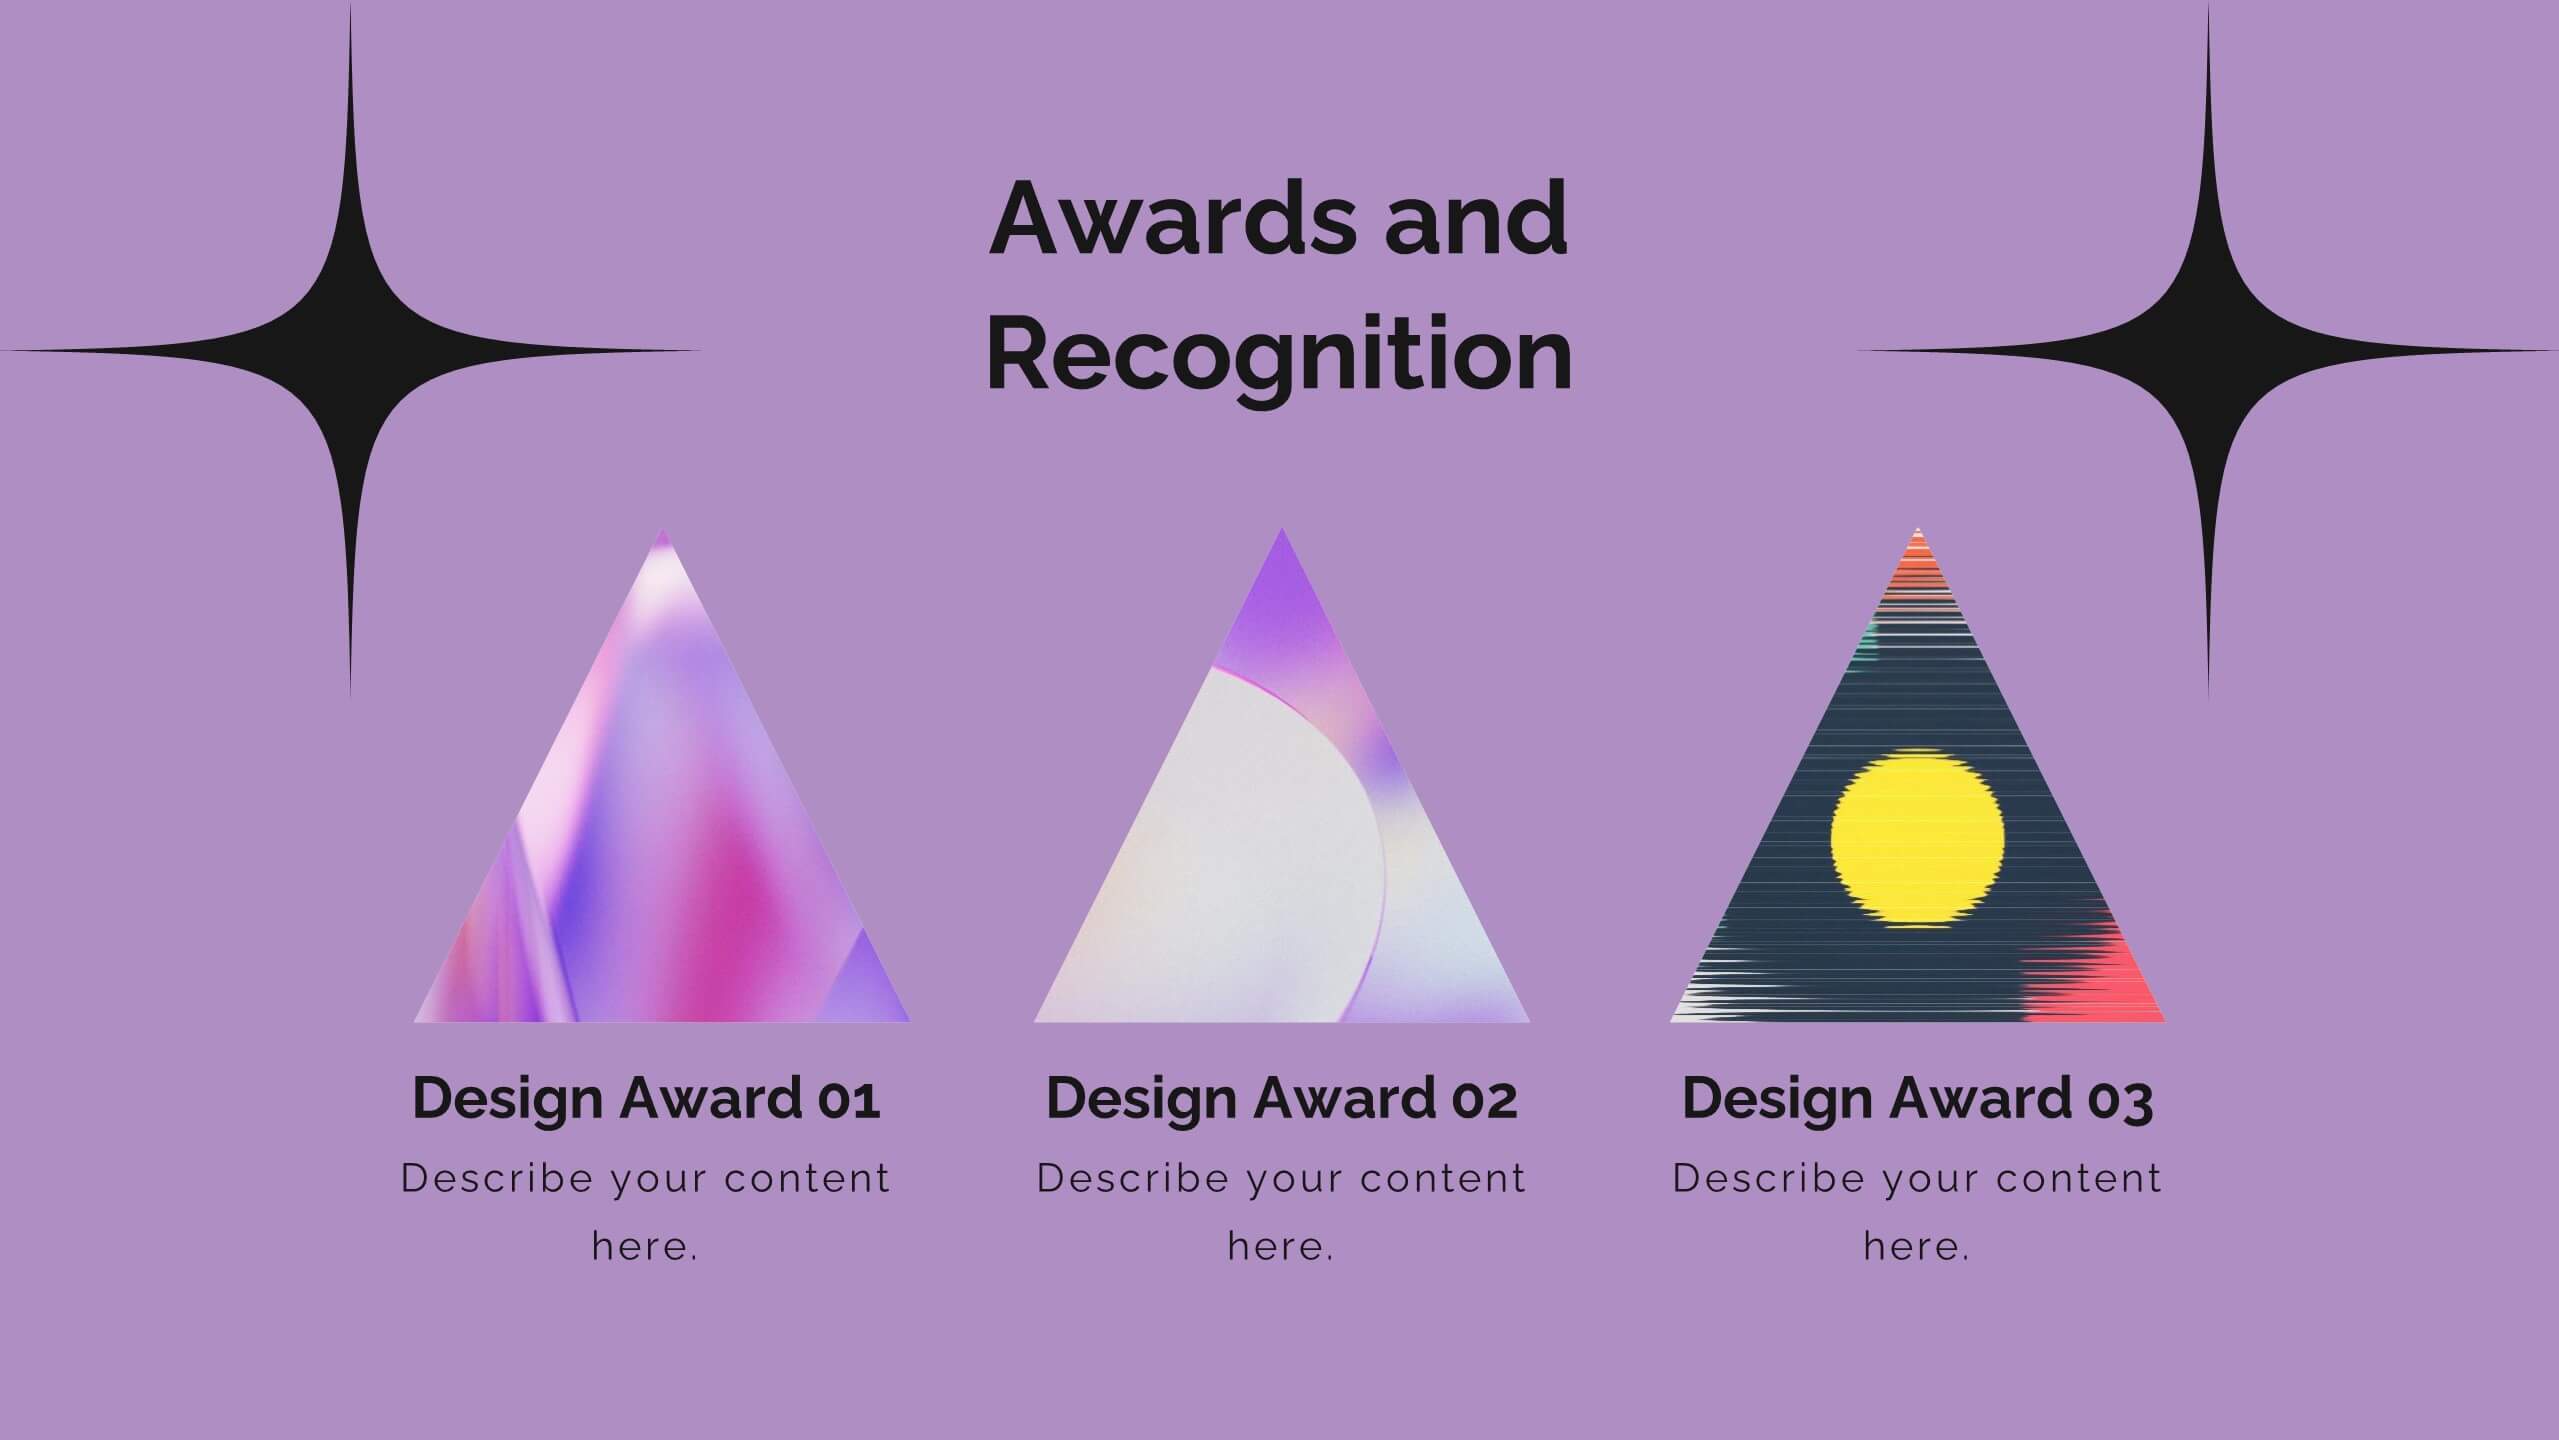
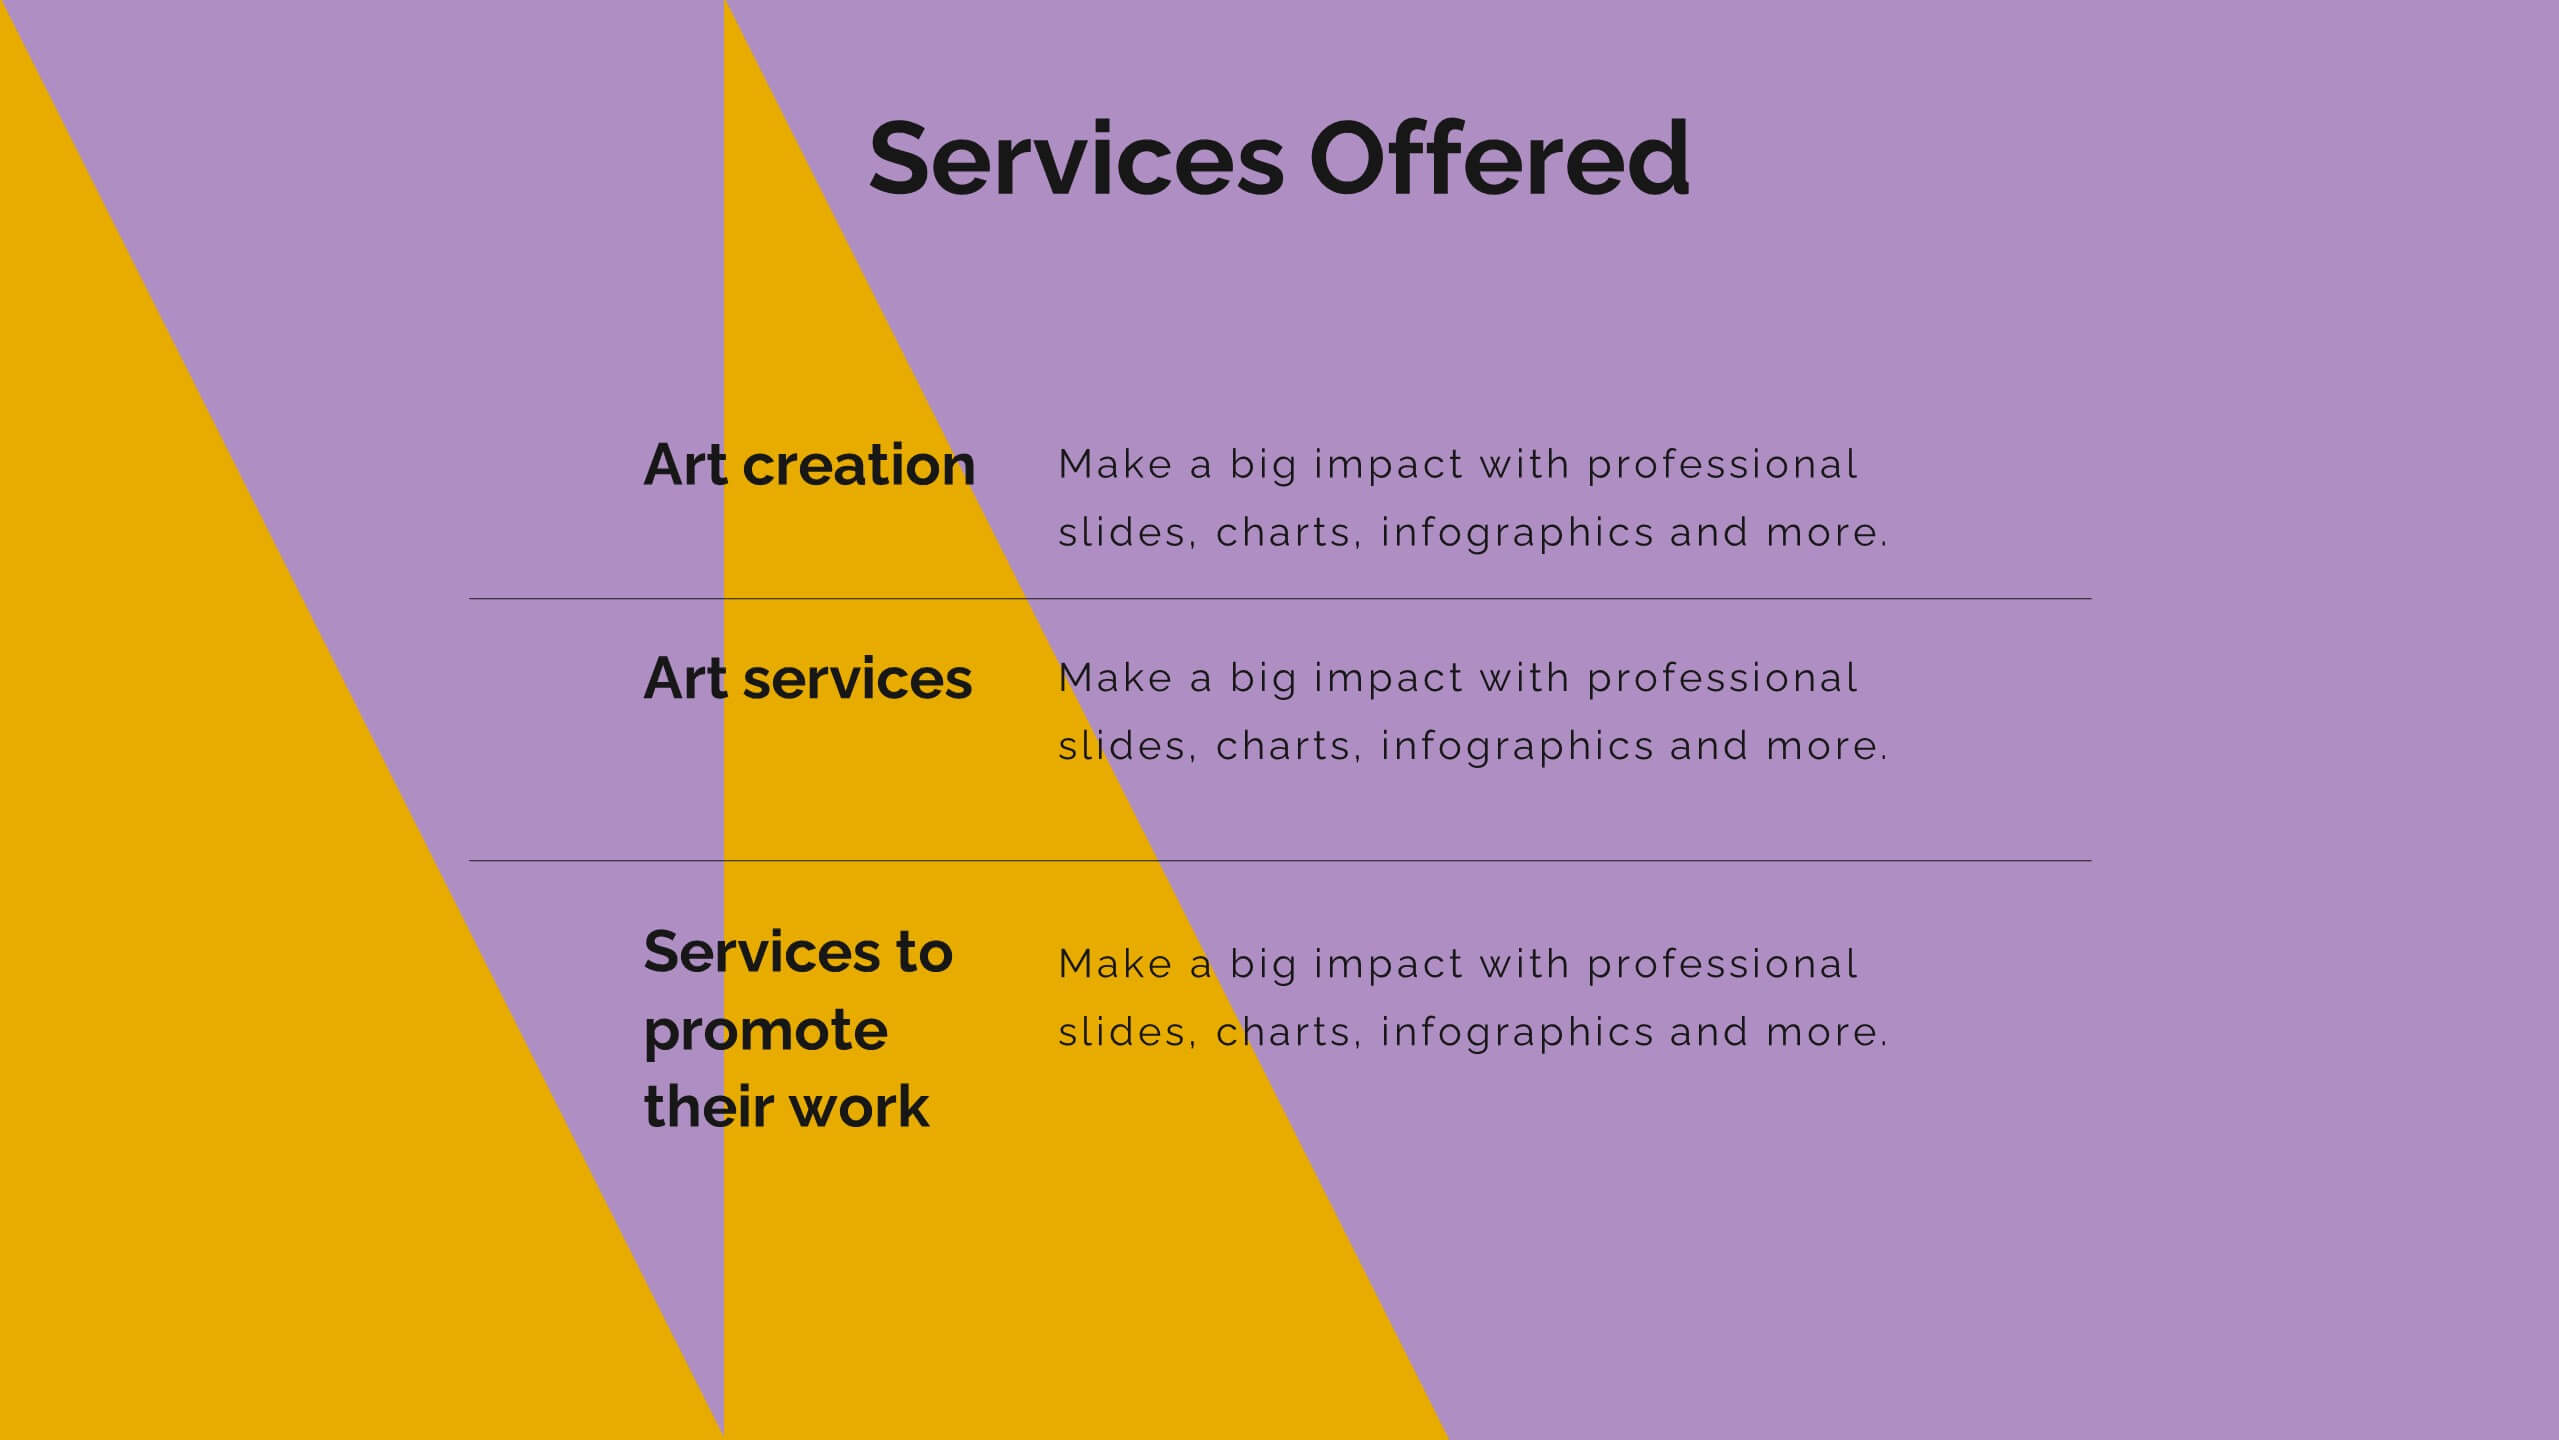
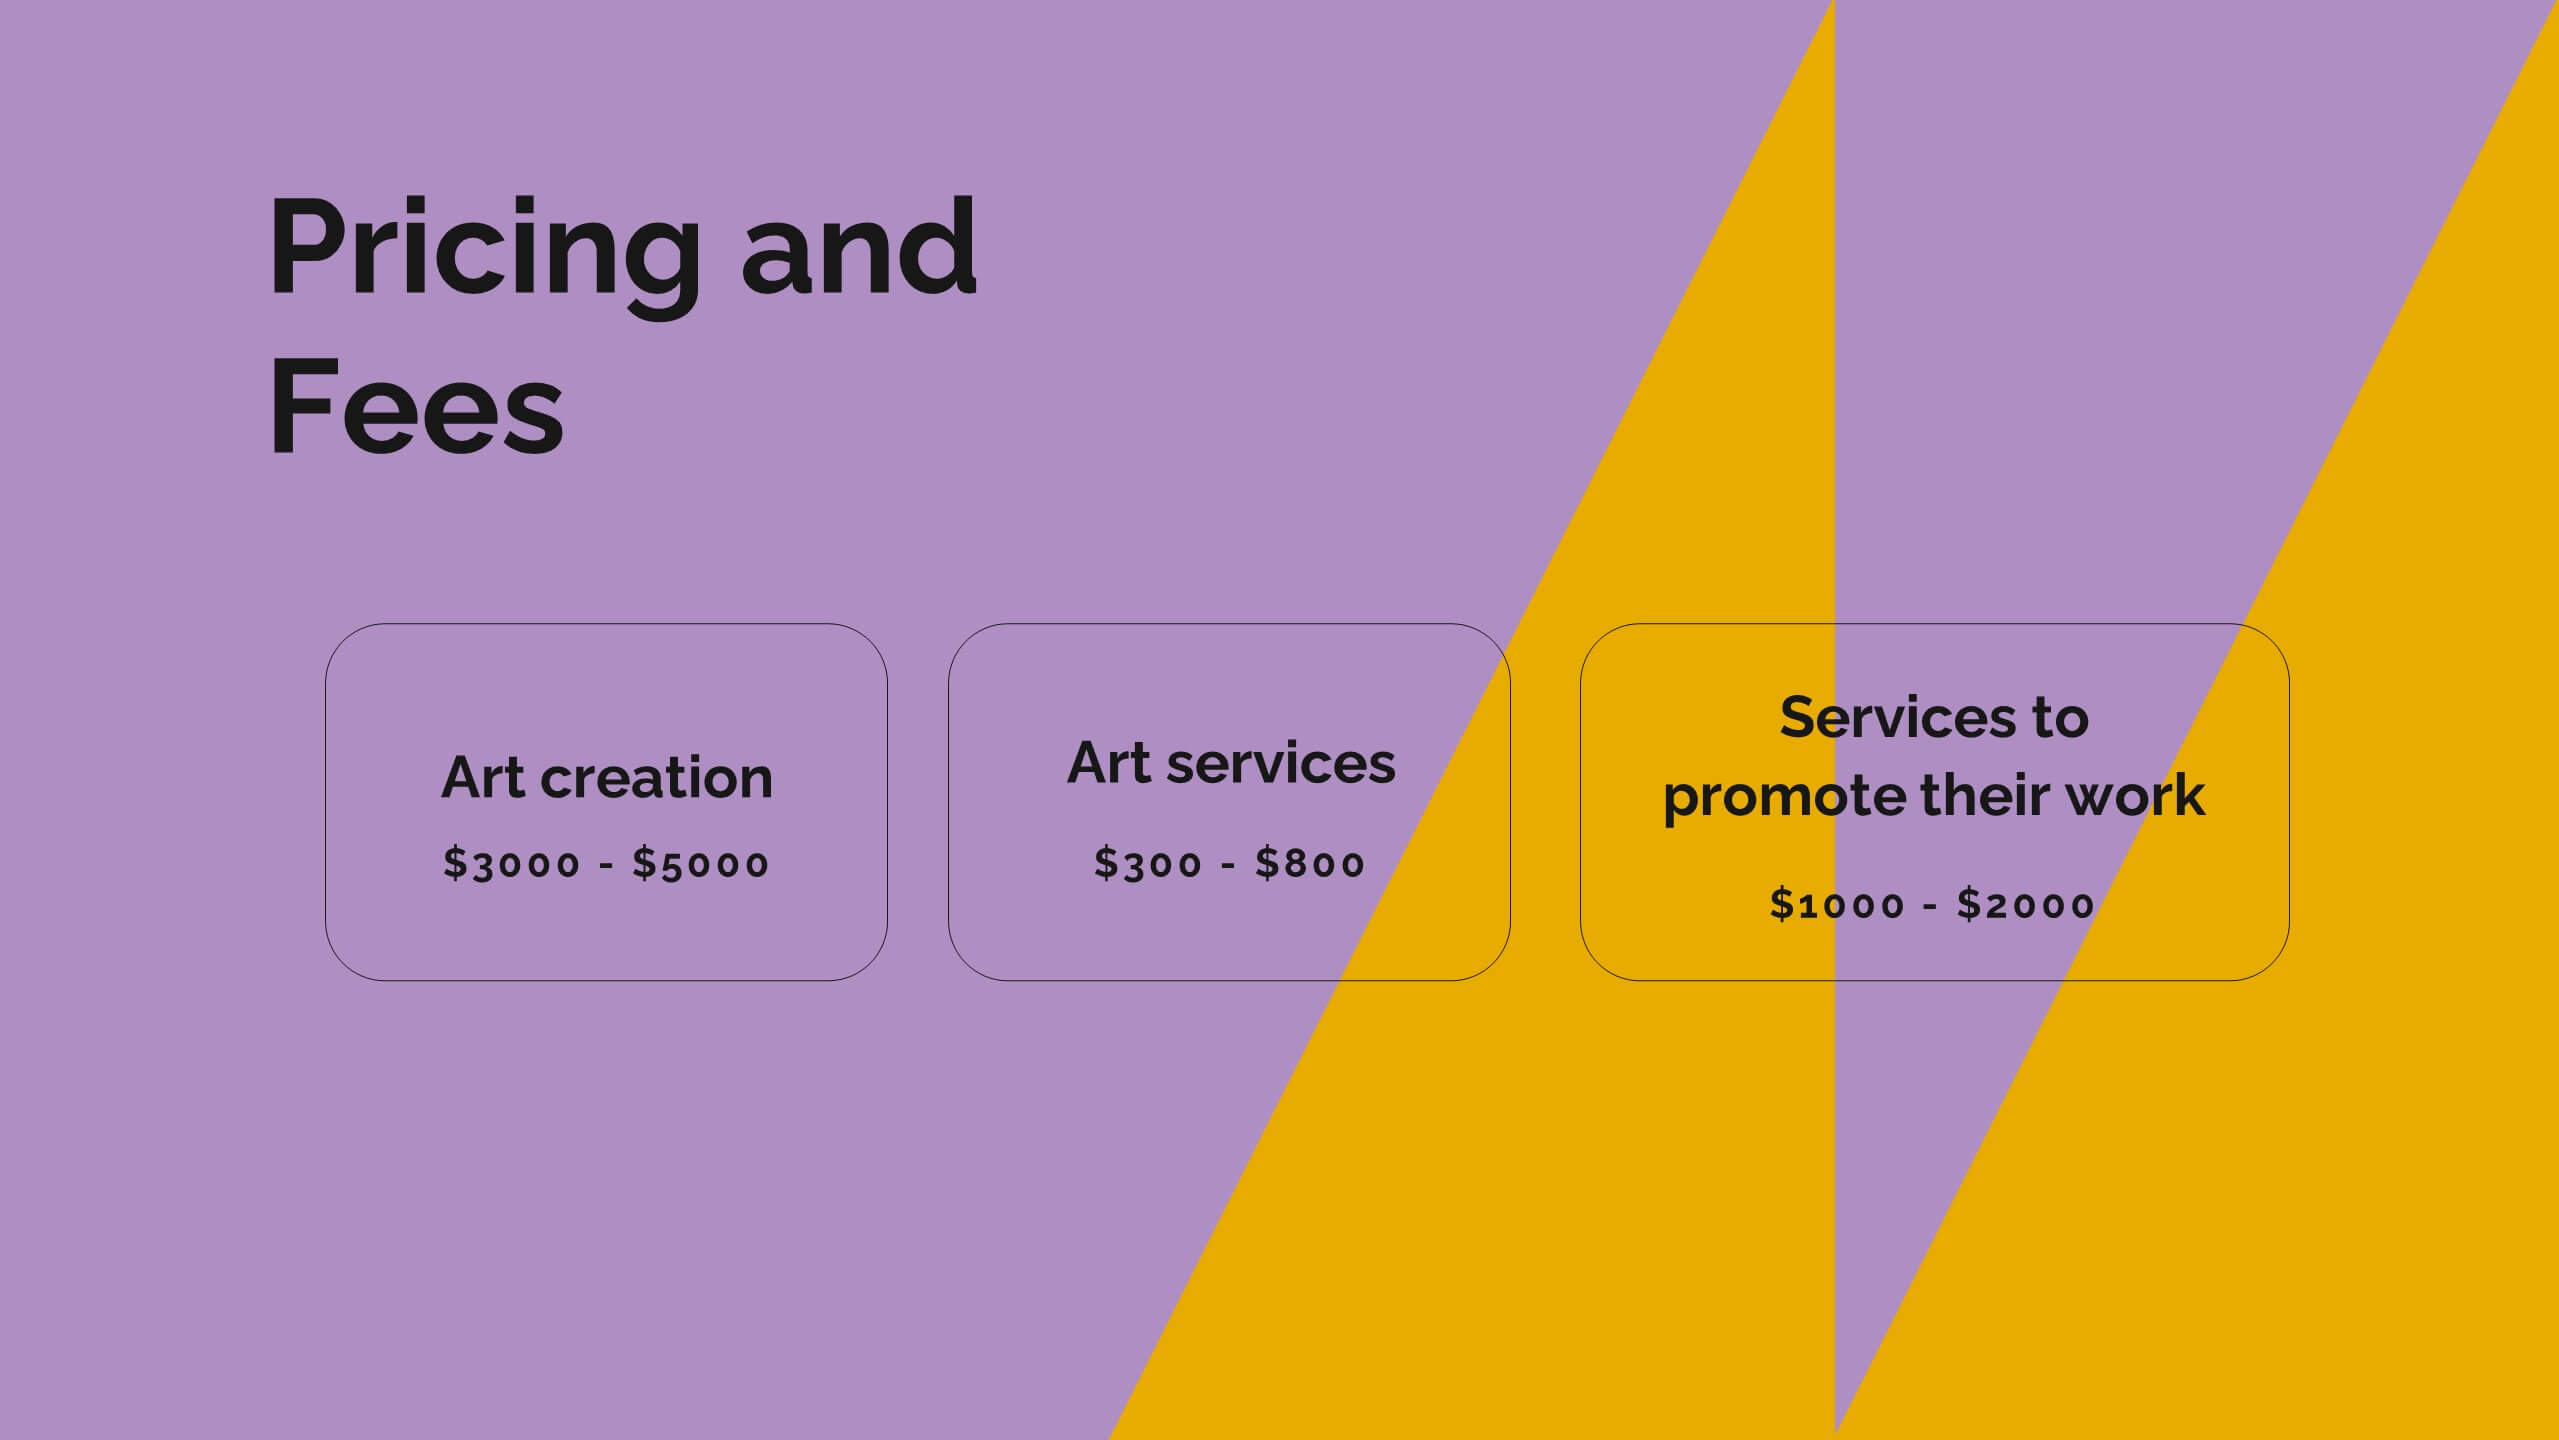
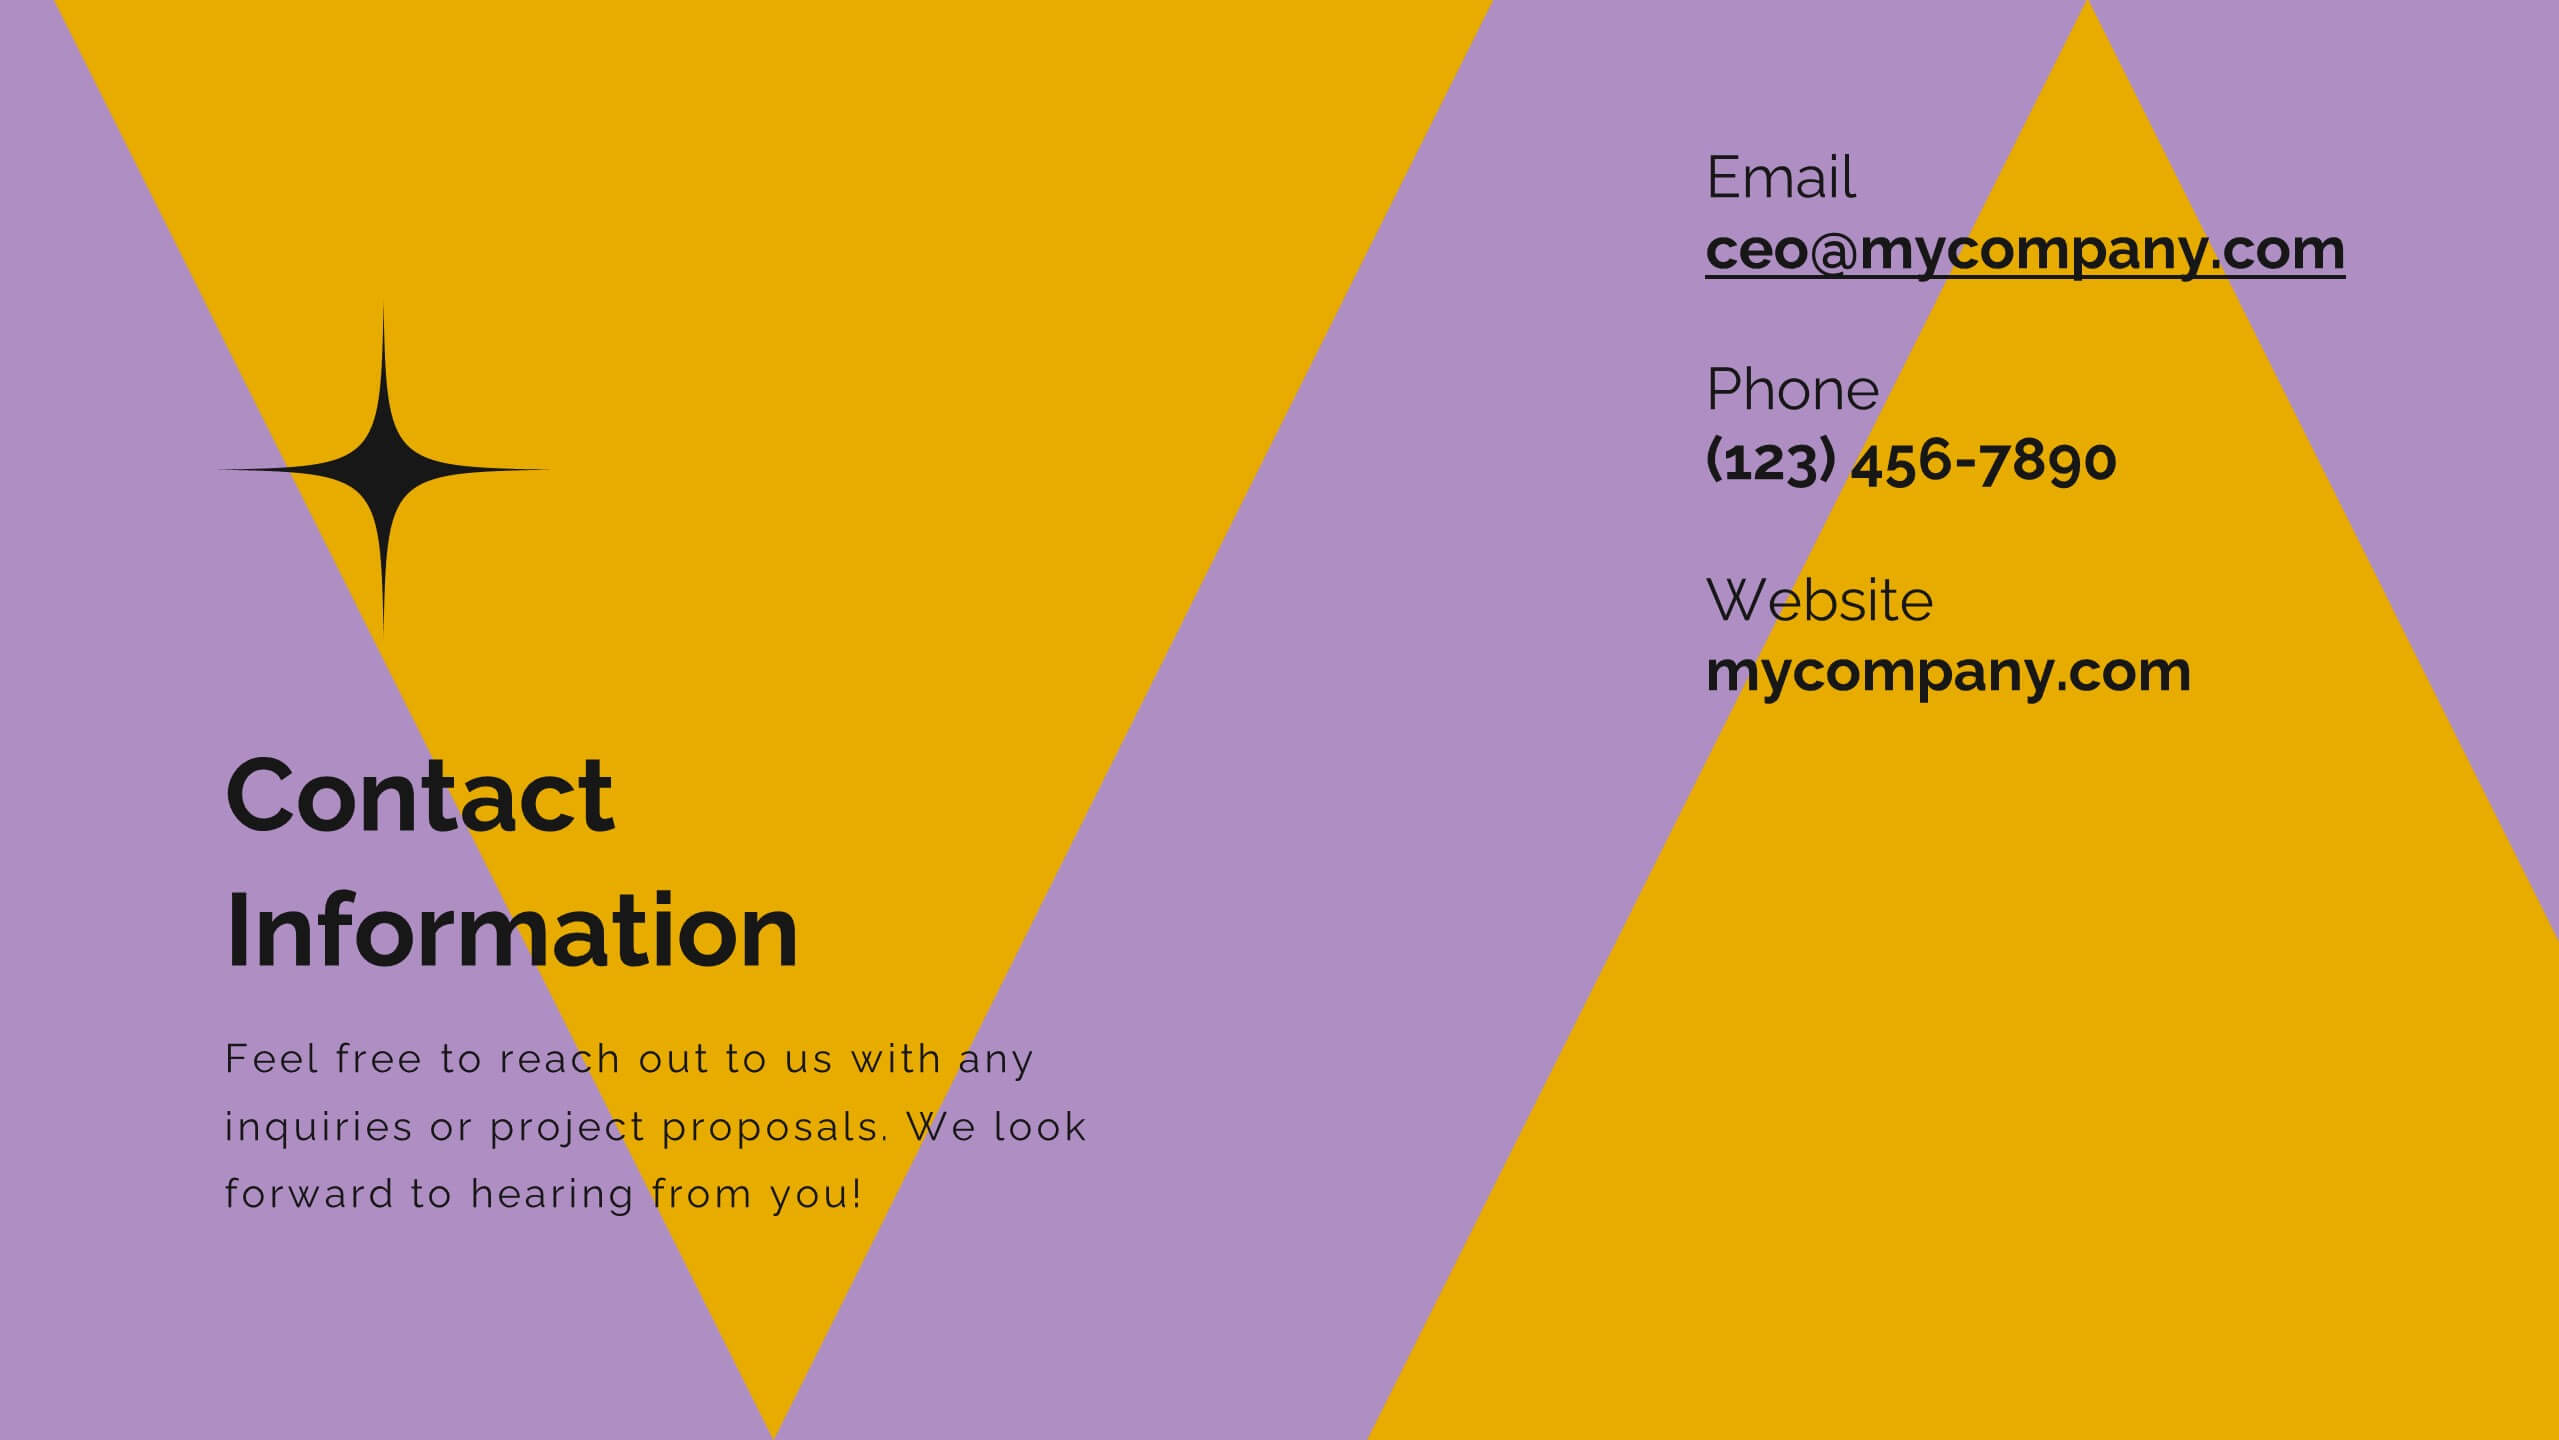
Vortex Artist Portfolio Template Presentation
Showcase your artistic brilliance with this eye-catching portfolio presentation template! Perfect for highlighting your projects, creative process, and awards, it features vibrant slides for your philosophy, collaborations, and client testimonials. Impress potential clients and collaborators with a stunning, well-organized portfolio. Compatible with PowerPoint, Keynote, and Google Slides for seamless presentations on any platform.
20 diapositivas
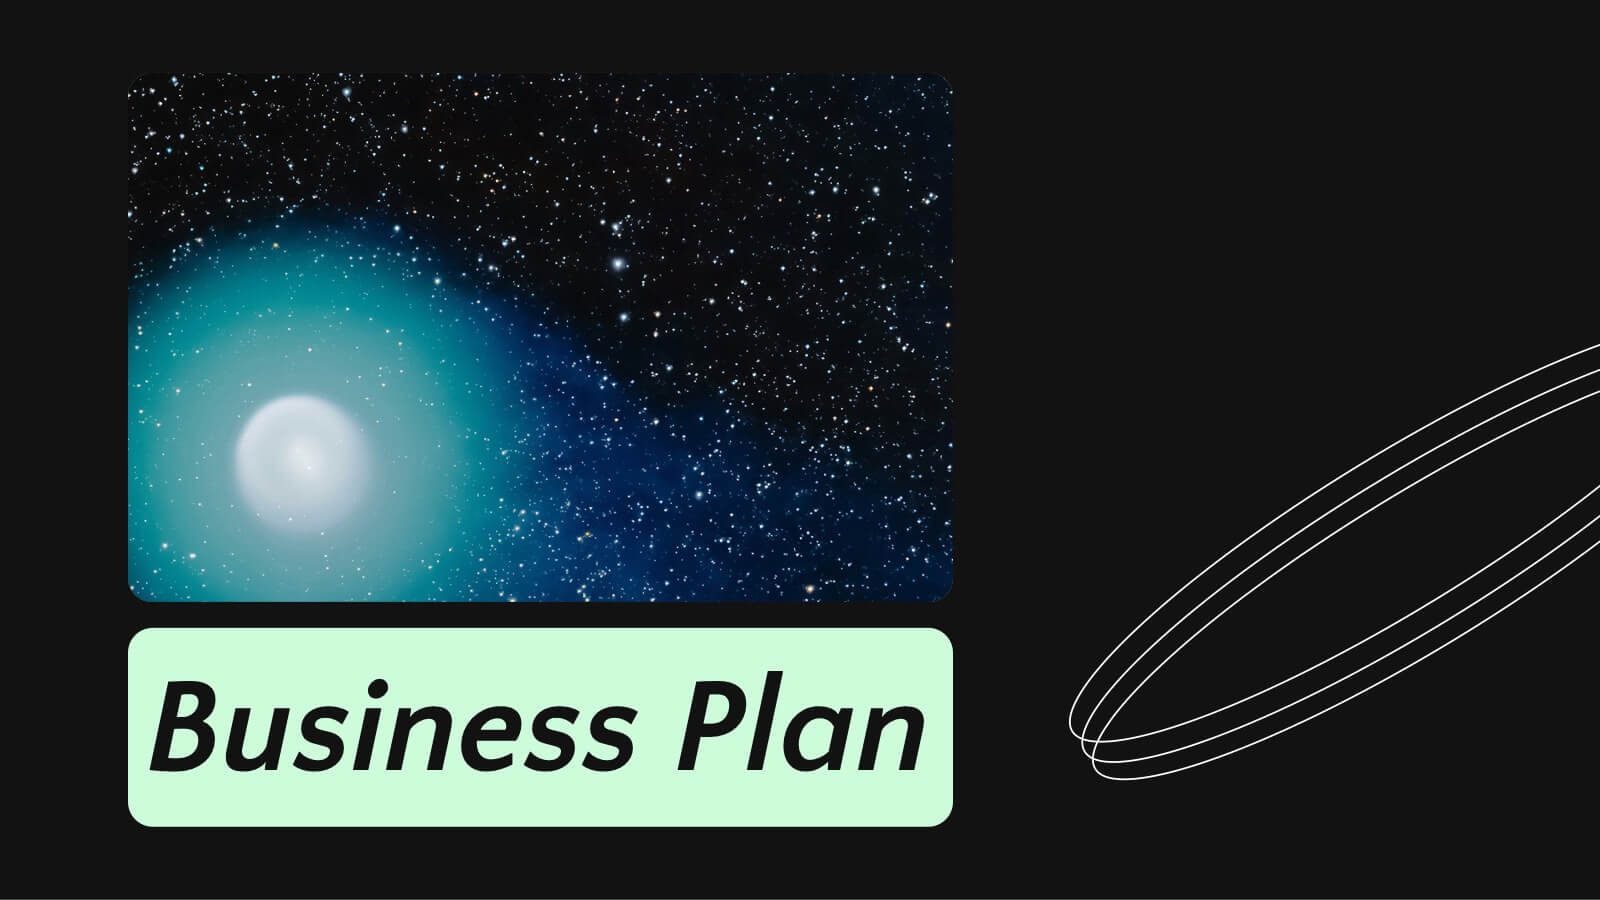
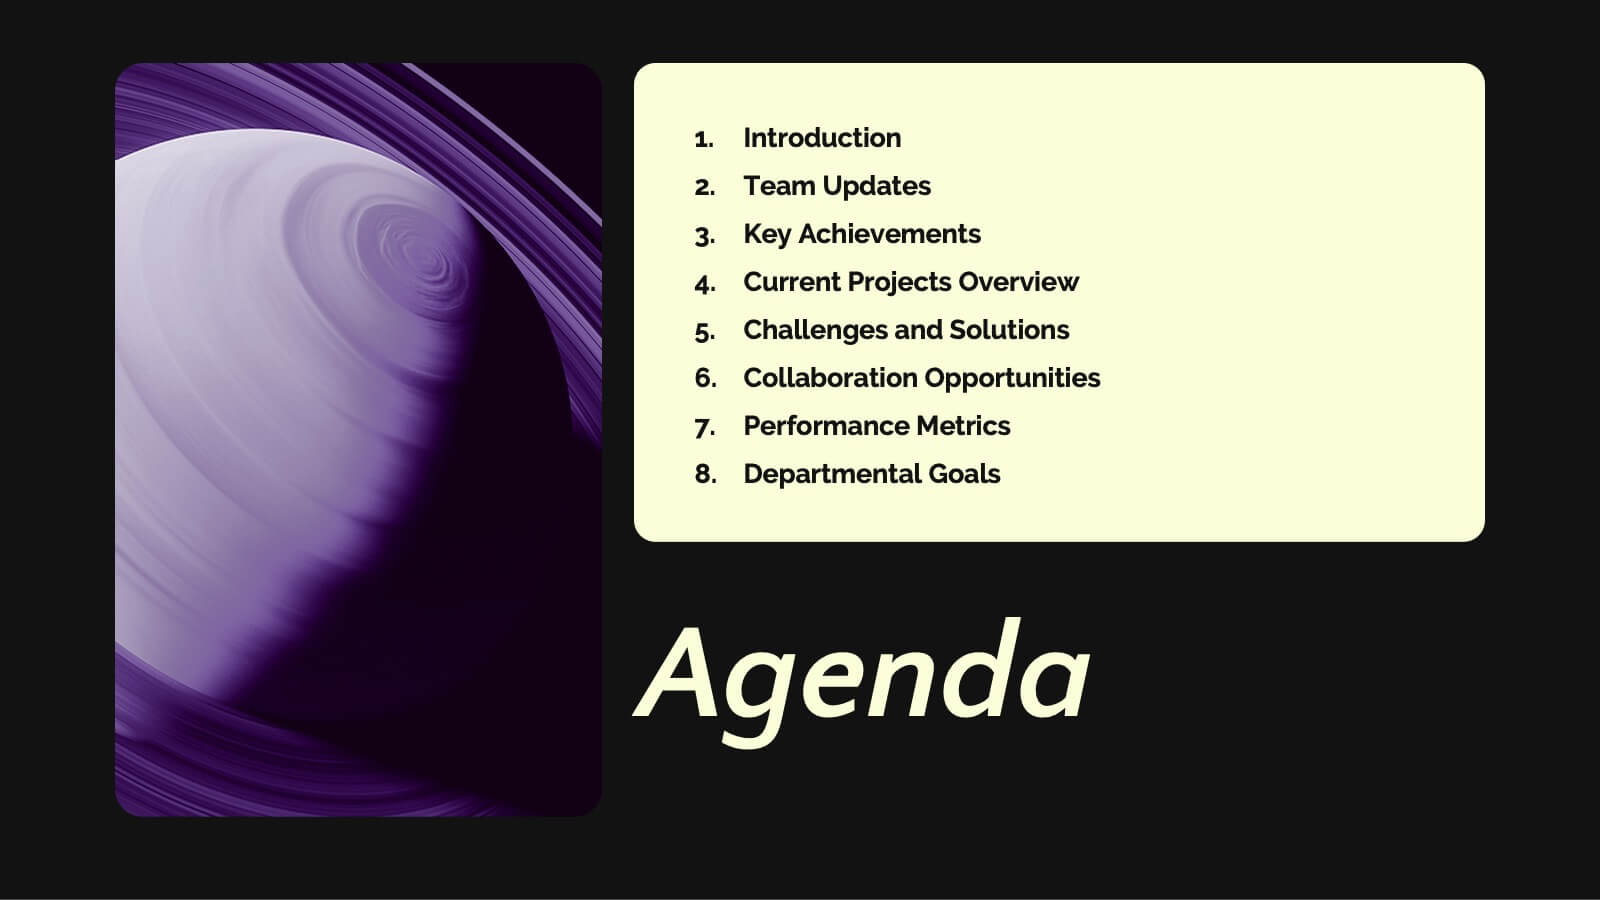
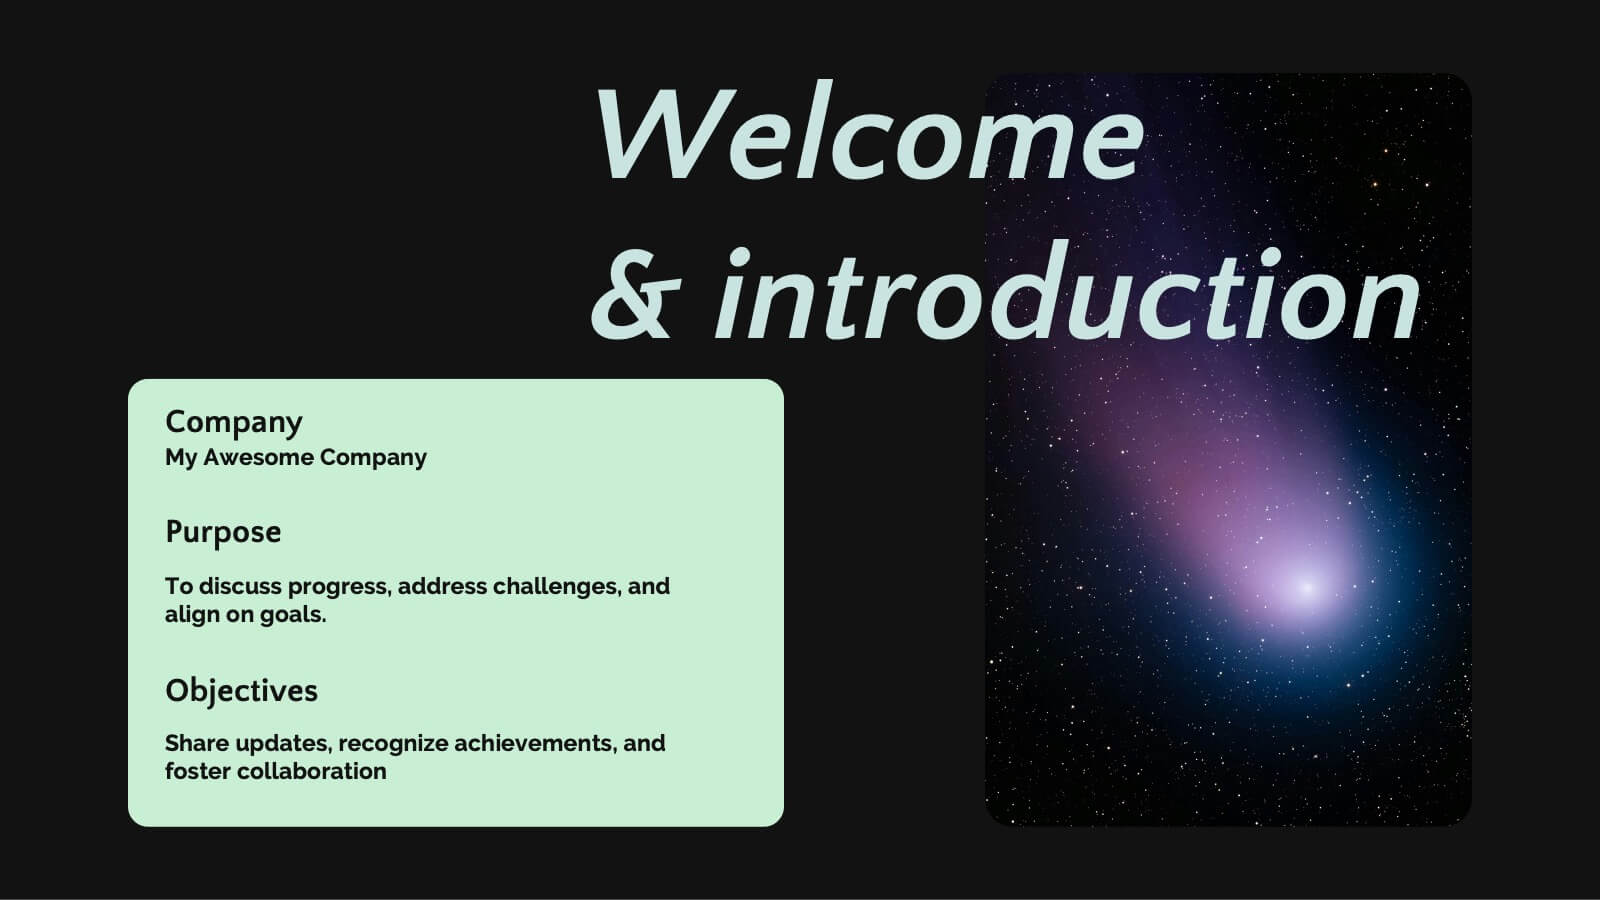
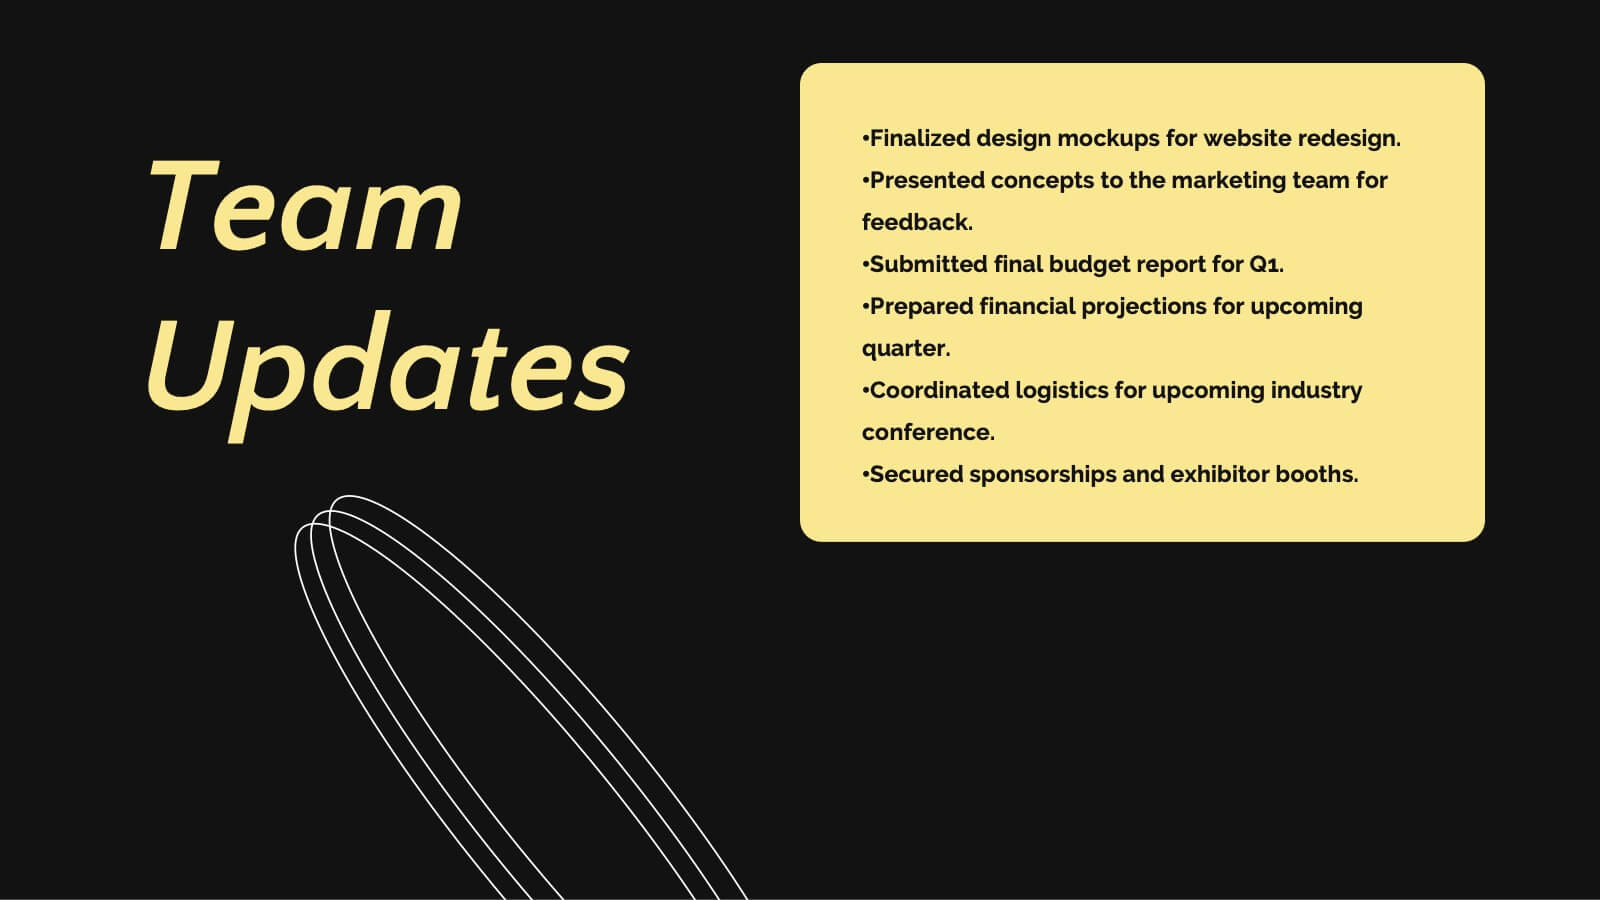
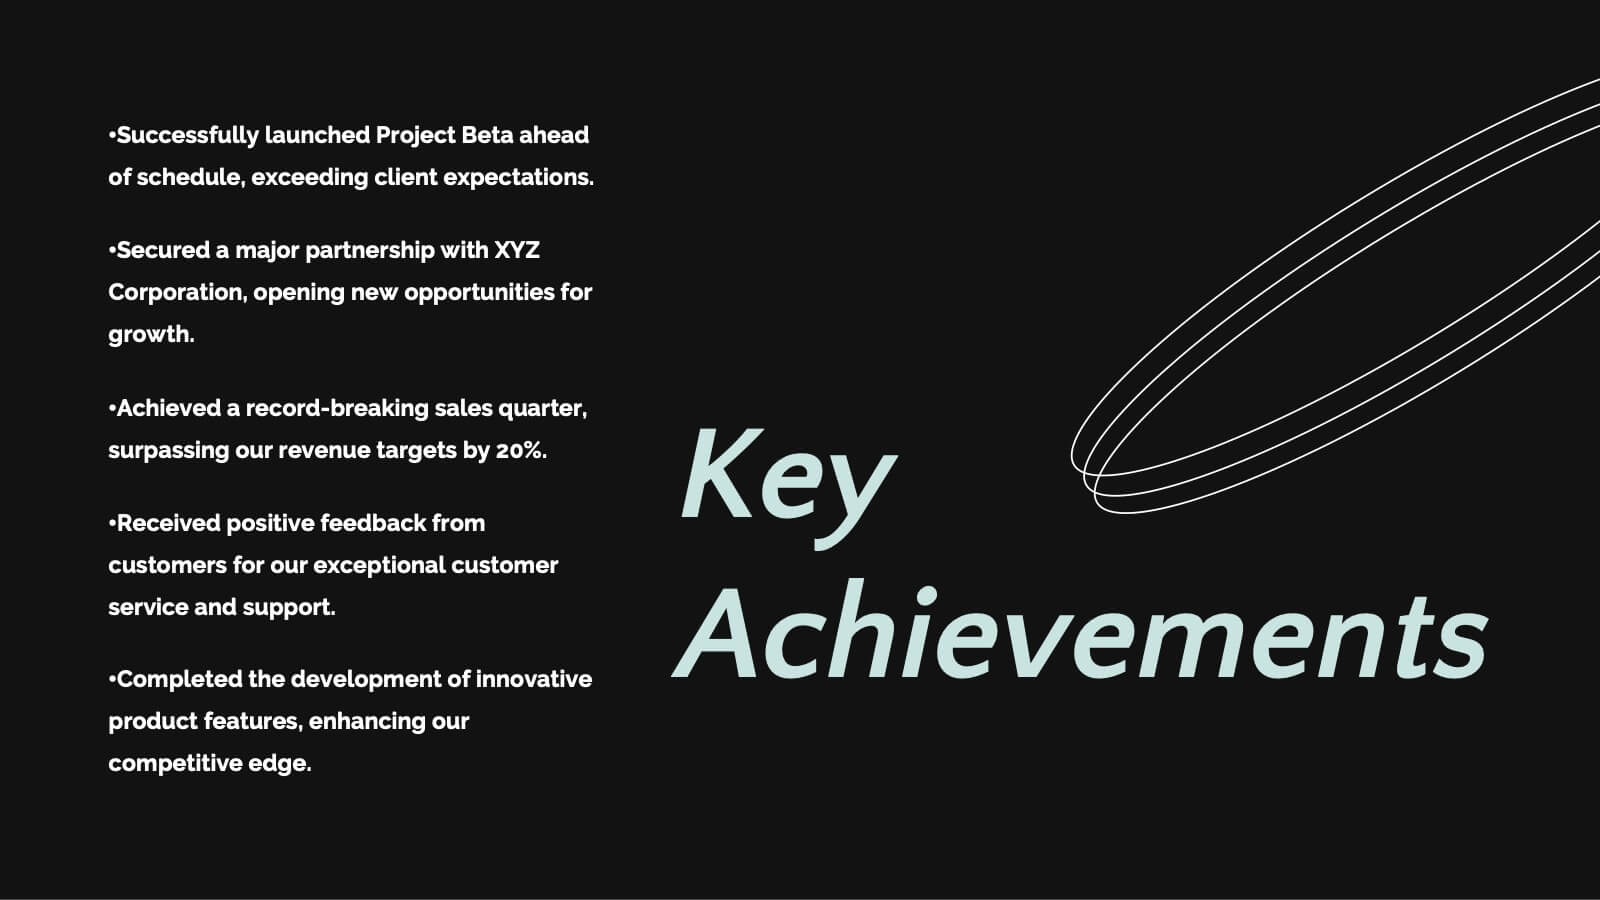
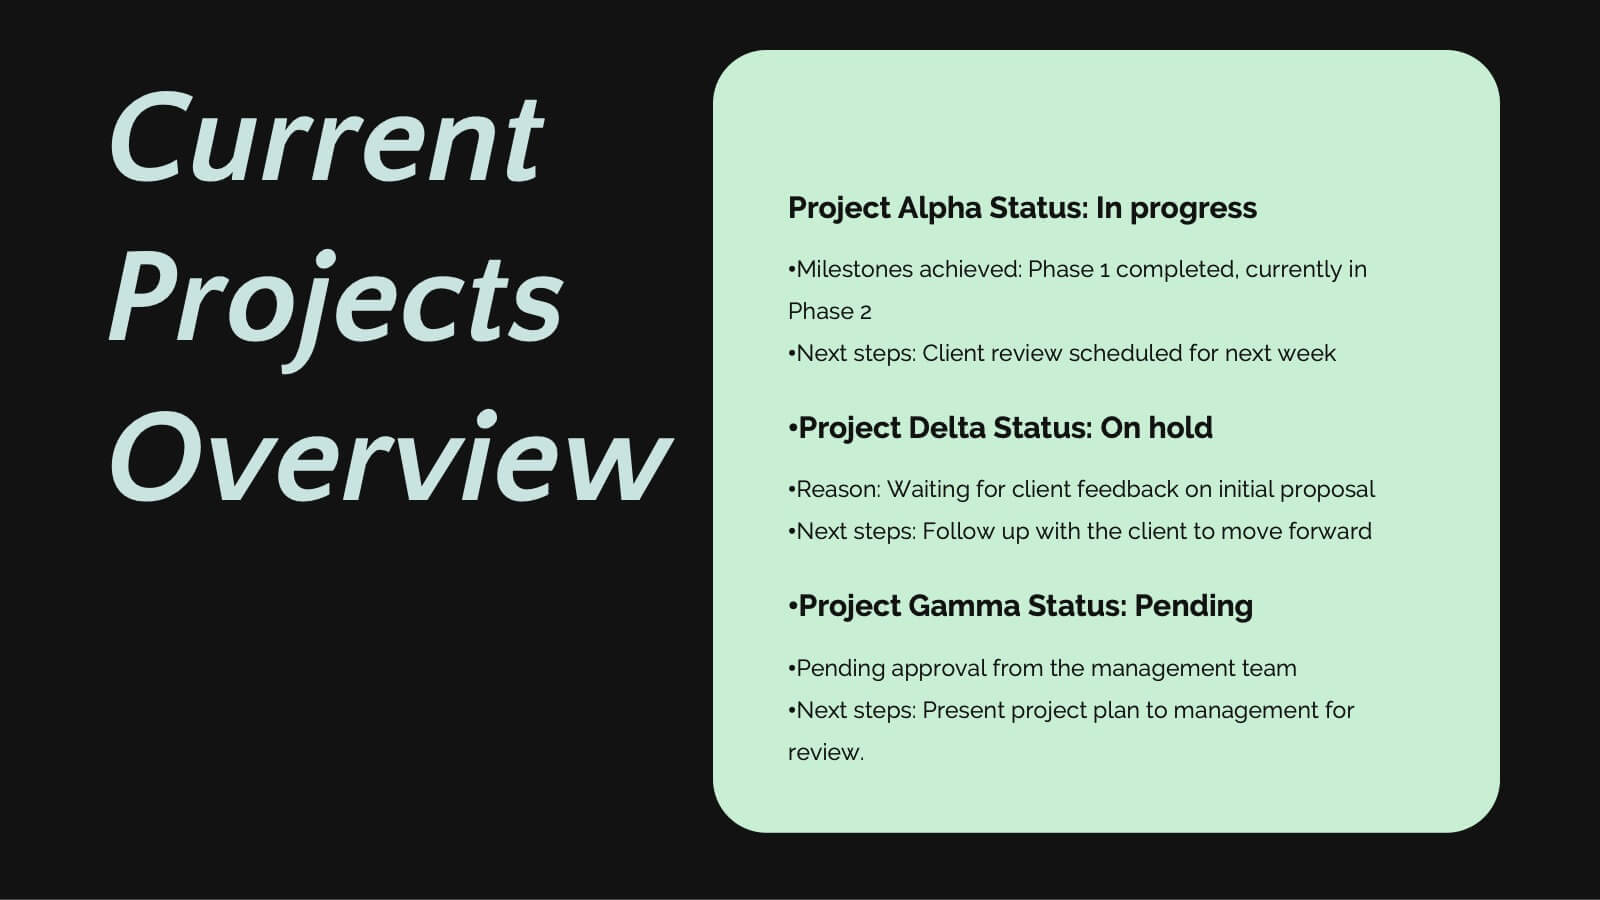
Saturn Business Plan Presentation
Embark on a journey to present your business plan like never before with this stellar presentation template! Perfect for diving deep into key updates, achievements, collaborations, and future goals, it guides your team through essential business strategies and challenges. Compatible with PowerPoint, Keynote, and Google Slides, it offers seamless flexibility and polished professionalism.

22 diapositivas
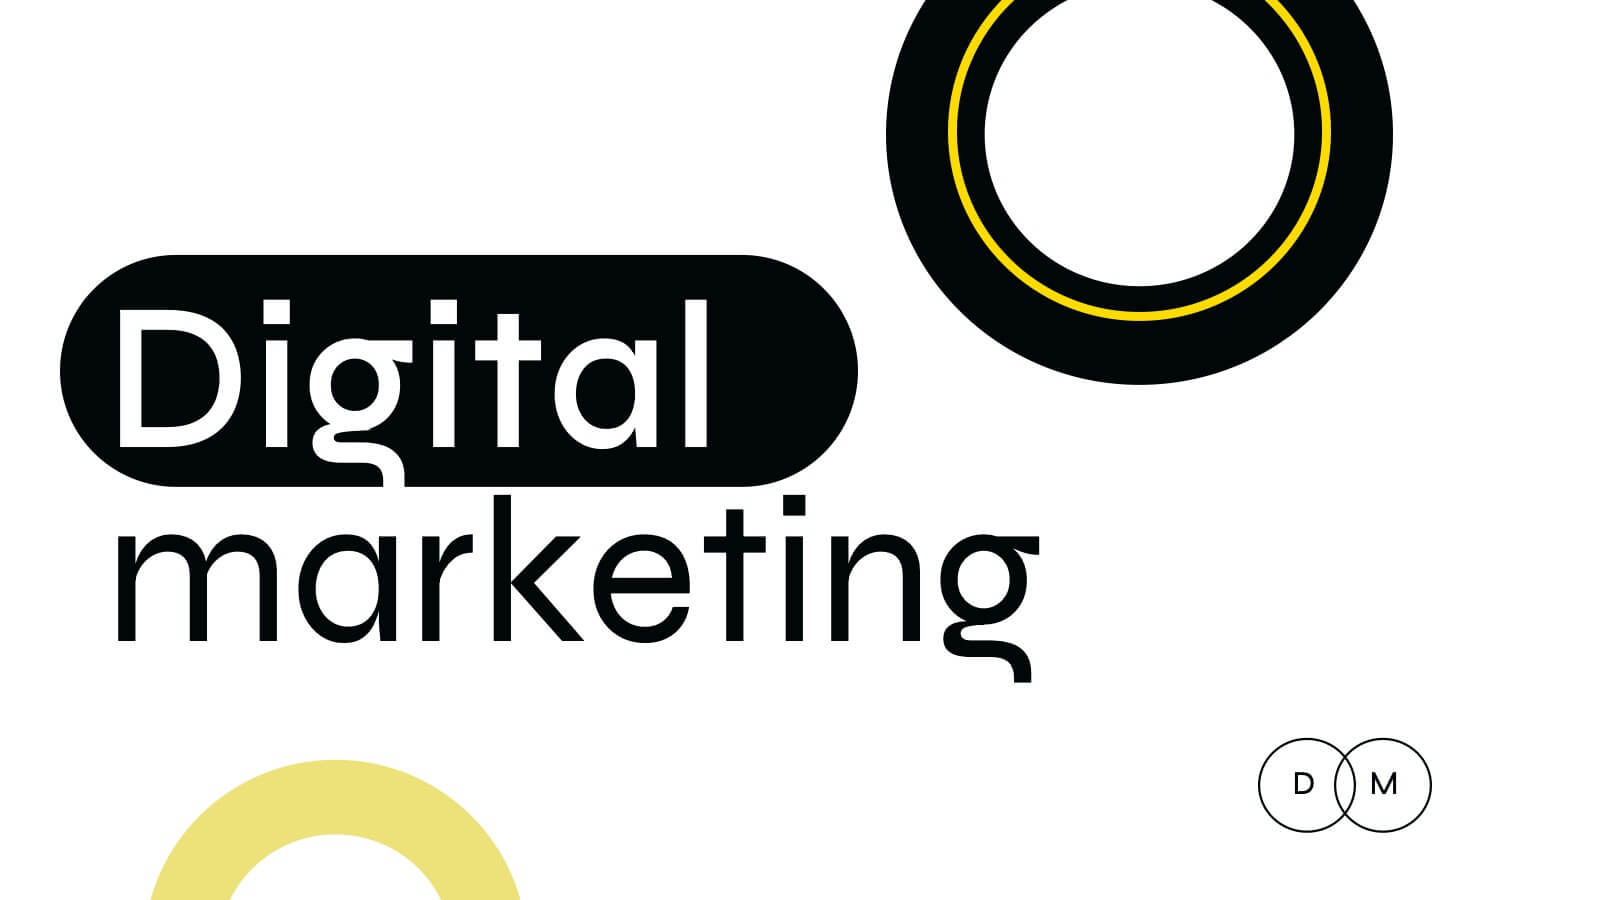
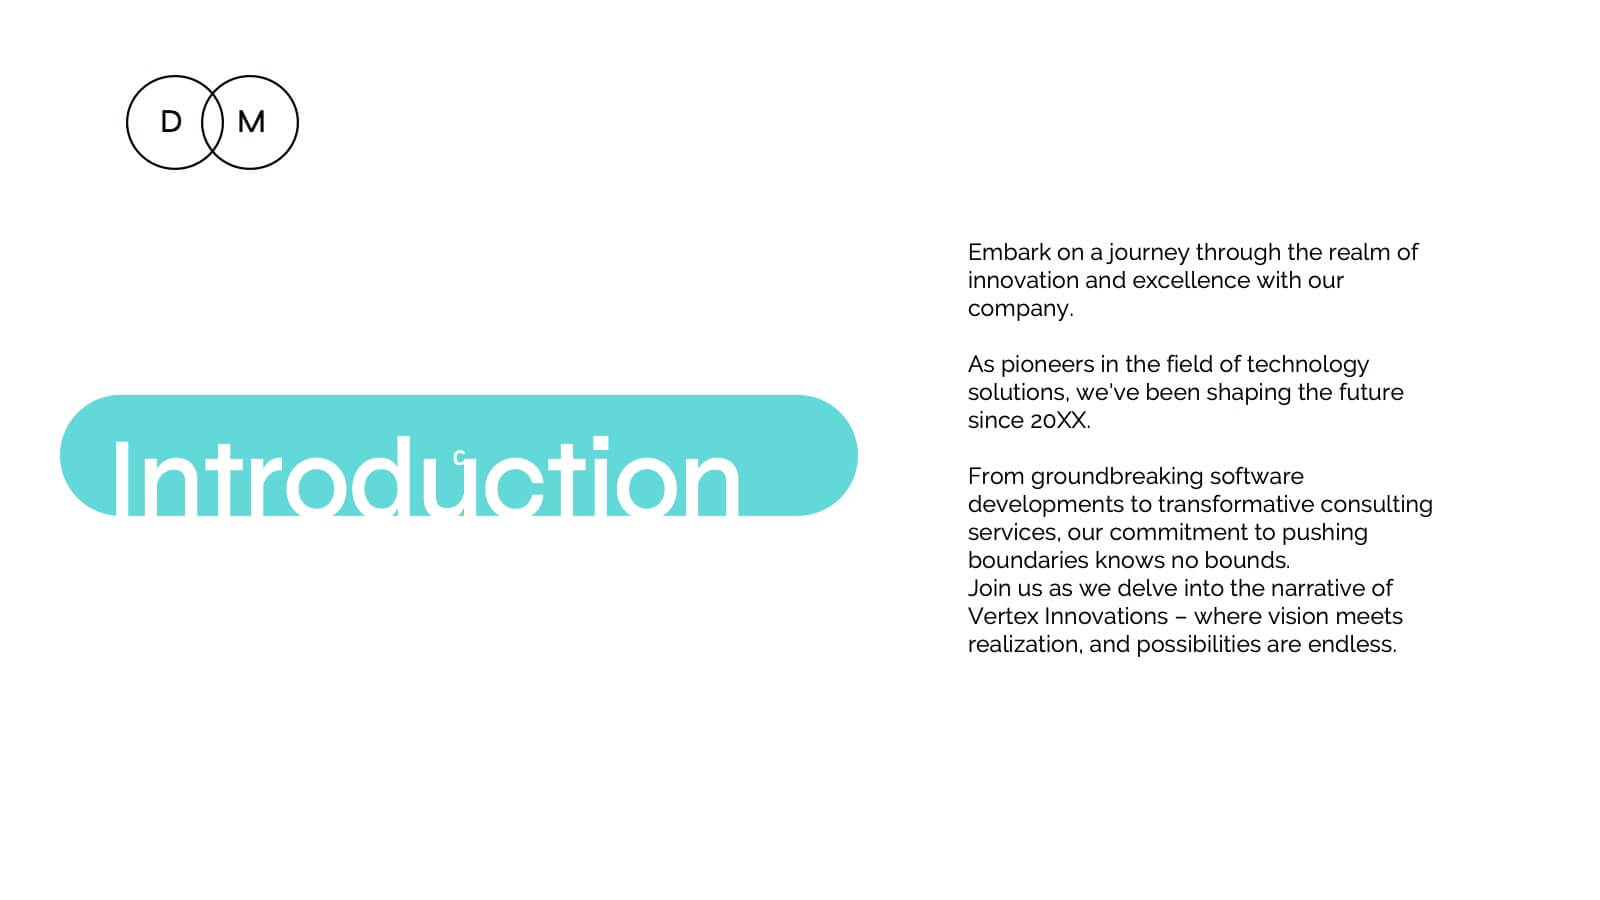
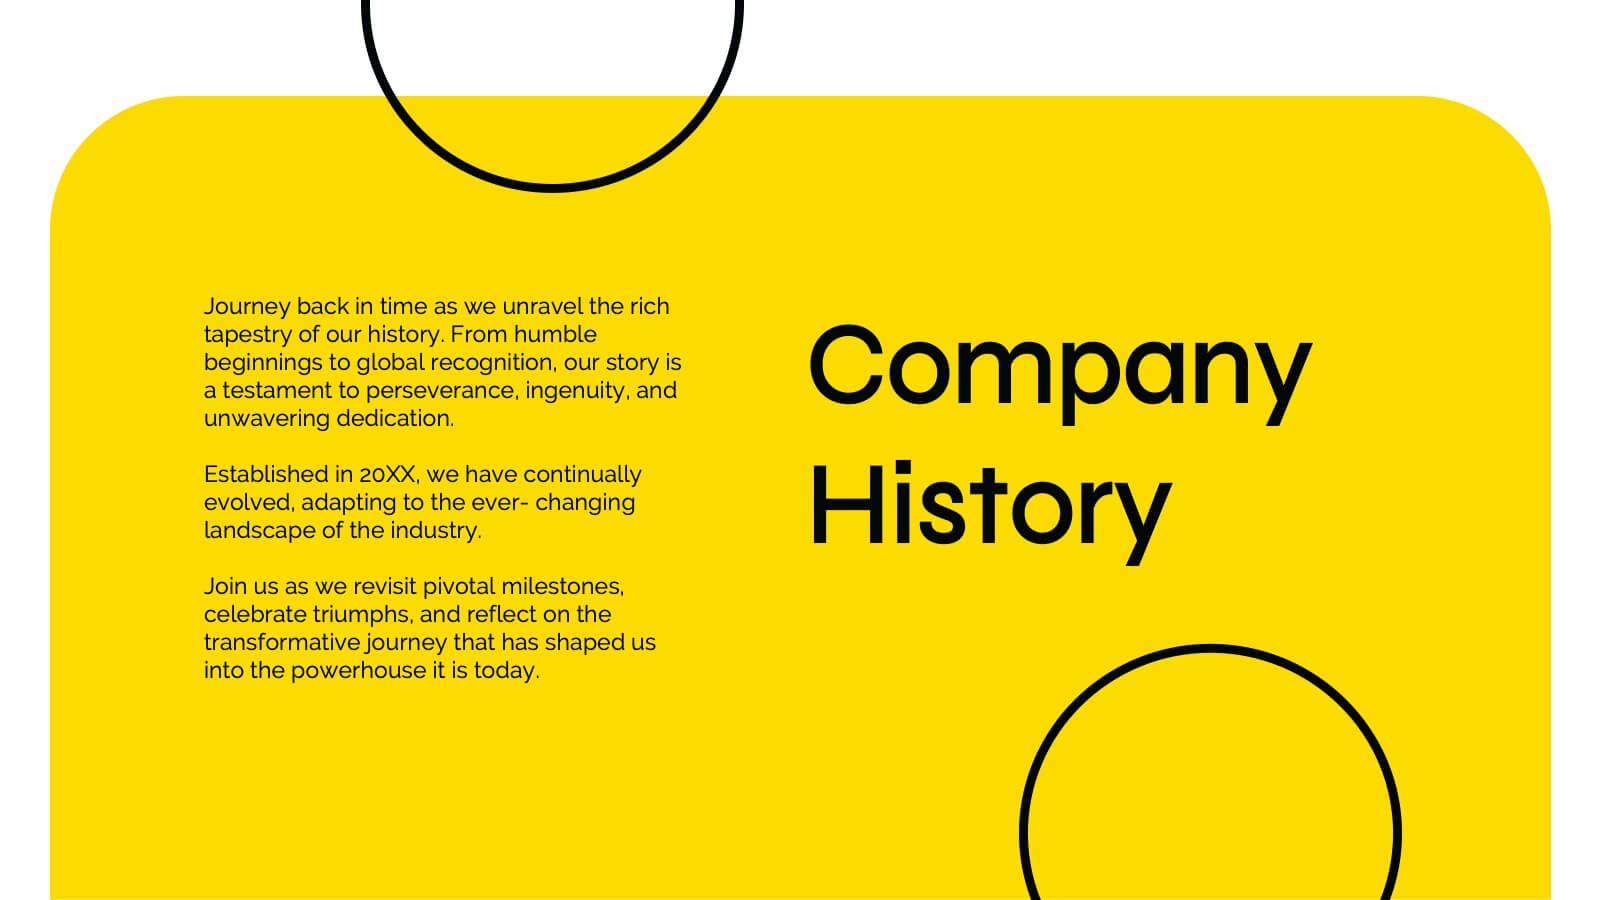
Hercules Digital Marketing Strategy Plan Presentation
Ignite your next marketing presentation with this bold, dynamic template that showcases every key element of your marketing strategy! From company history and target audience insights to competitive landscape analysis, this design makes presenting your marketing message a breeze. Perfect for professionals, it’s fully compatible with PowerPoint, Keynote, and Google Slides for seamless usage across platforms.


5 diapositivas
Online Learning Strategy Slides Presentation
Transform your virtual training ideas into visually engaging lessons with this dynamic presentation. Ideal for educators and online course creators, it helps structure digital learning strategies with clarity and purpose. Clean visuals make complex plans easy to follow. Fully compatible with PowerPoint, Keynote, and Google Slides for effortless customization.