


Características


¿Tienes alguna pregunta?
Recomendar


6 diapositivas
Project Status Dashboard Infographic
"Project status" refers to the current state or progress of a project at a specific point in time. This infographic template provides an overview of the project's accomplishments, milestones achieved, and any potential issues or challenges that may have arisen during its execution. This well-designed project status infographic serves as a quick reference guide for your audience to understand a project's overall health, progress, and potential challenges. Compatible with Powerpoint, Keynote, and Google Slides. The use of icons, images, and graphics help enhance engagement. The incorporation of charts and graphs present quantitative information.


8 diapositivas
Sales Funnel AIDA Strategy Presentation
Streamline your marketing approach with the Sales Funnel AIDA Strategy Presentation template. Designed to visualize the Attention, Interest, Desire, and Action (AIDA) Model, this engaging funnel graphic effectively illustrates how to guide potential customers through the sales journey. Ideal for marketers, sales teams, and business strategists, this fully customizable template is compatible with PowerPoint, Keynote, and Google Slides.


7 diapositivas
Travel Infographic Presentation Template
Our Travel Infographic is a gorgeous infographic template that allows you to instantly create a modern, stylish and eye-catching travel infographic. You can easily customize this travel infographic to suit all your needs in just a few minutes. This Travel Infographic is designed to used as a travel guide with tons of destinations, flight deals and tips to make your trip memorable. This template can be used to help you create dynamic visual content for your travels. This travel infographic is a perfect way to plan, organize and prepare for your next trip or for all the upcoming trips!


6 diapositivas
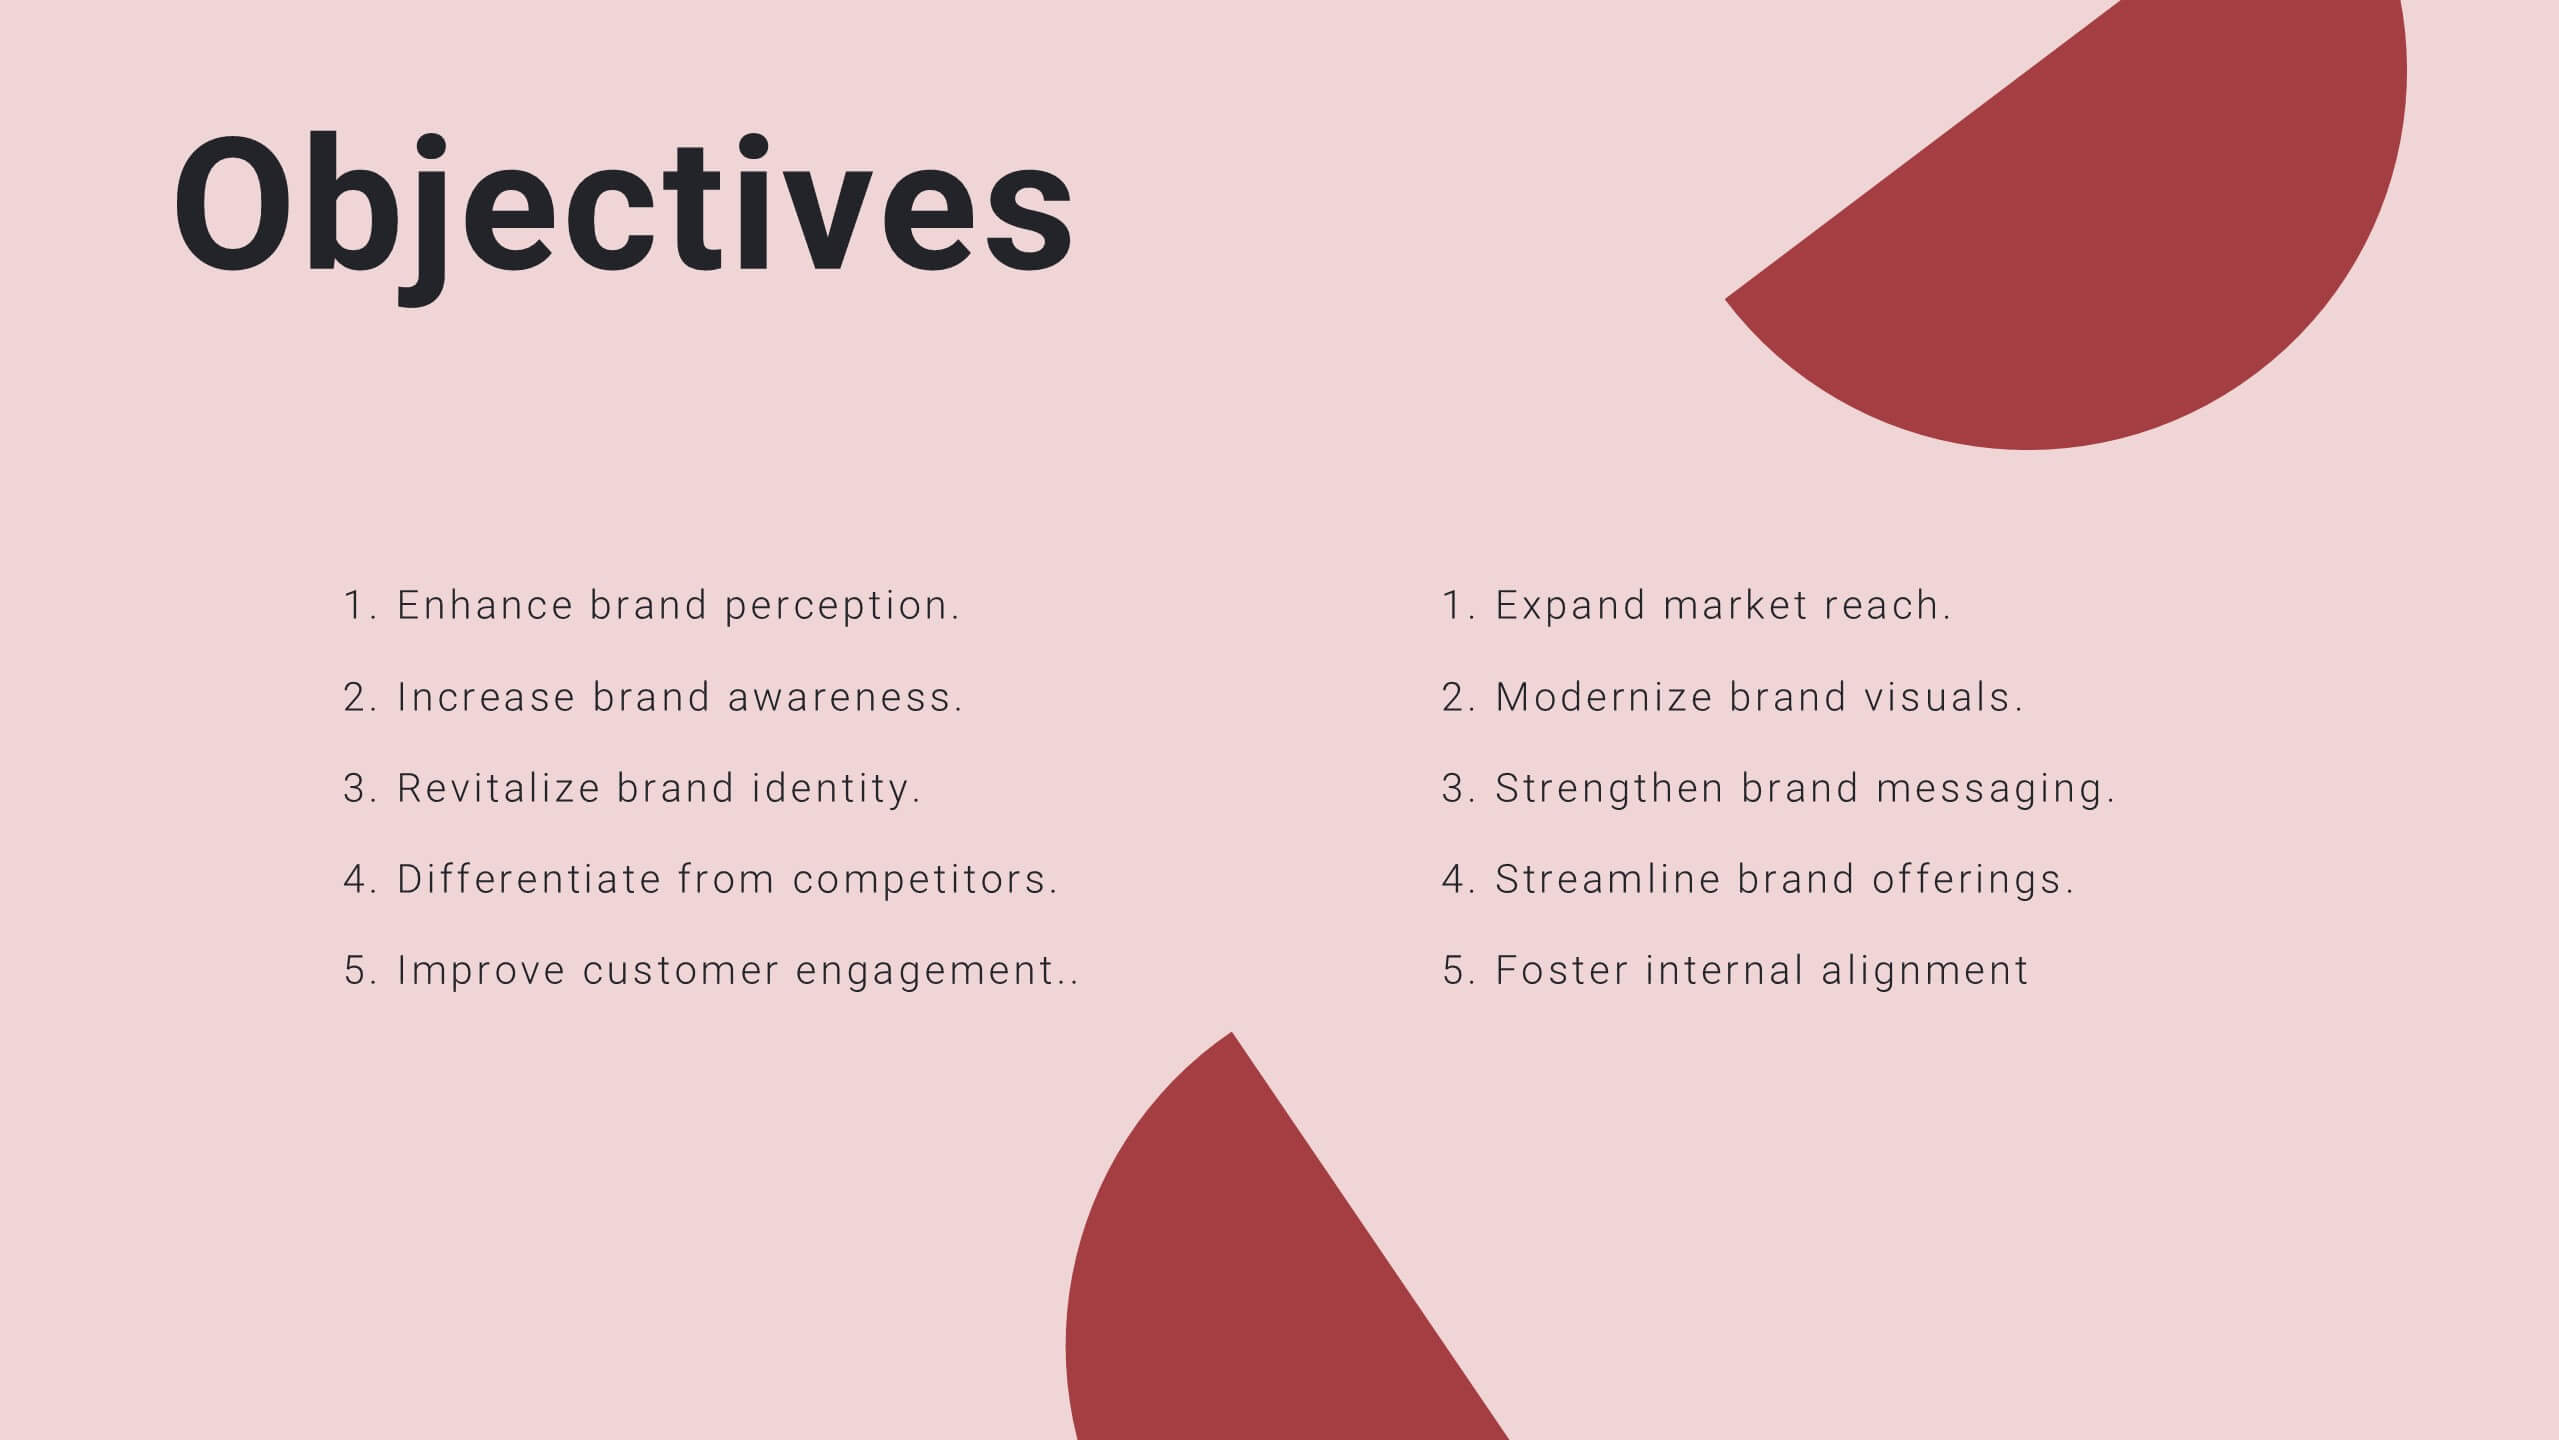
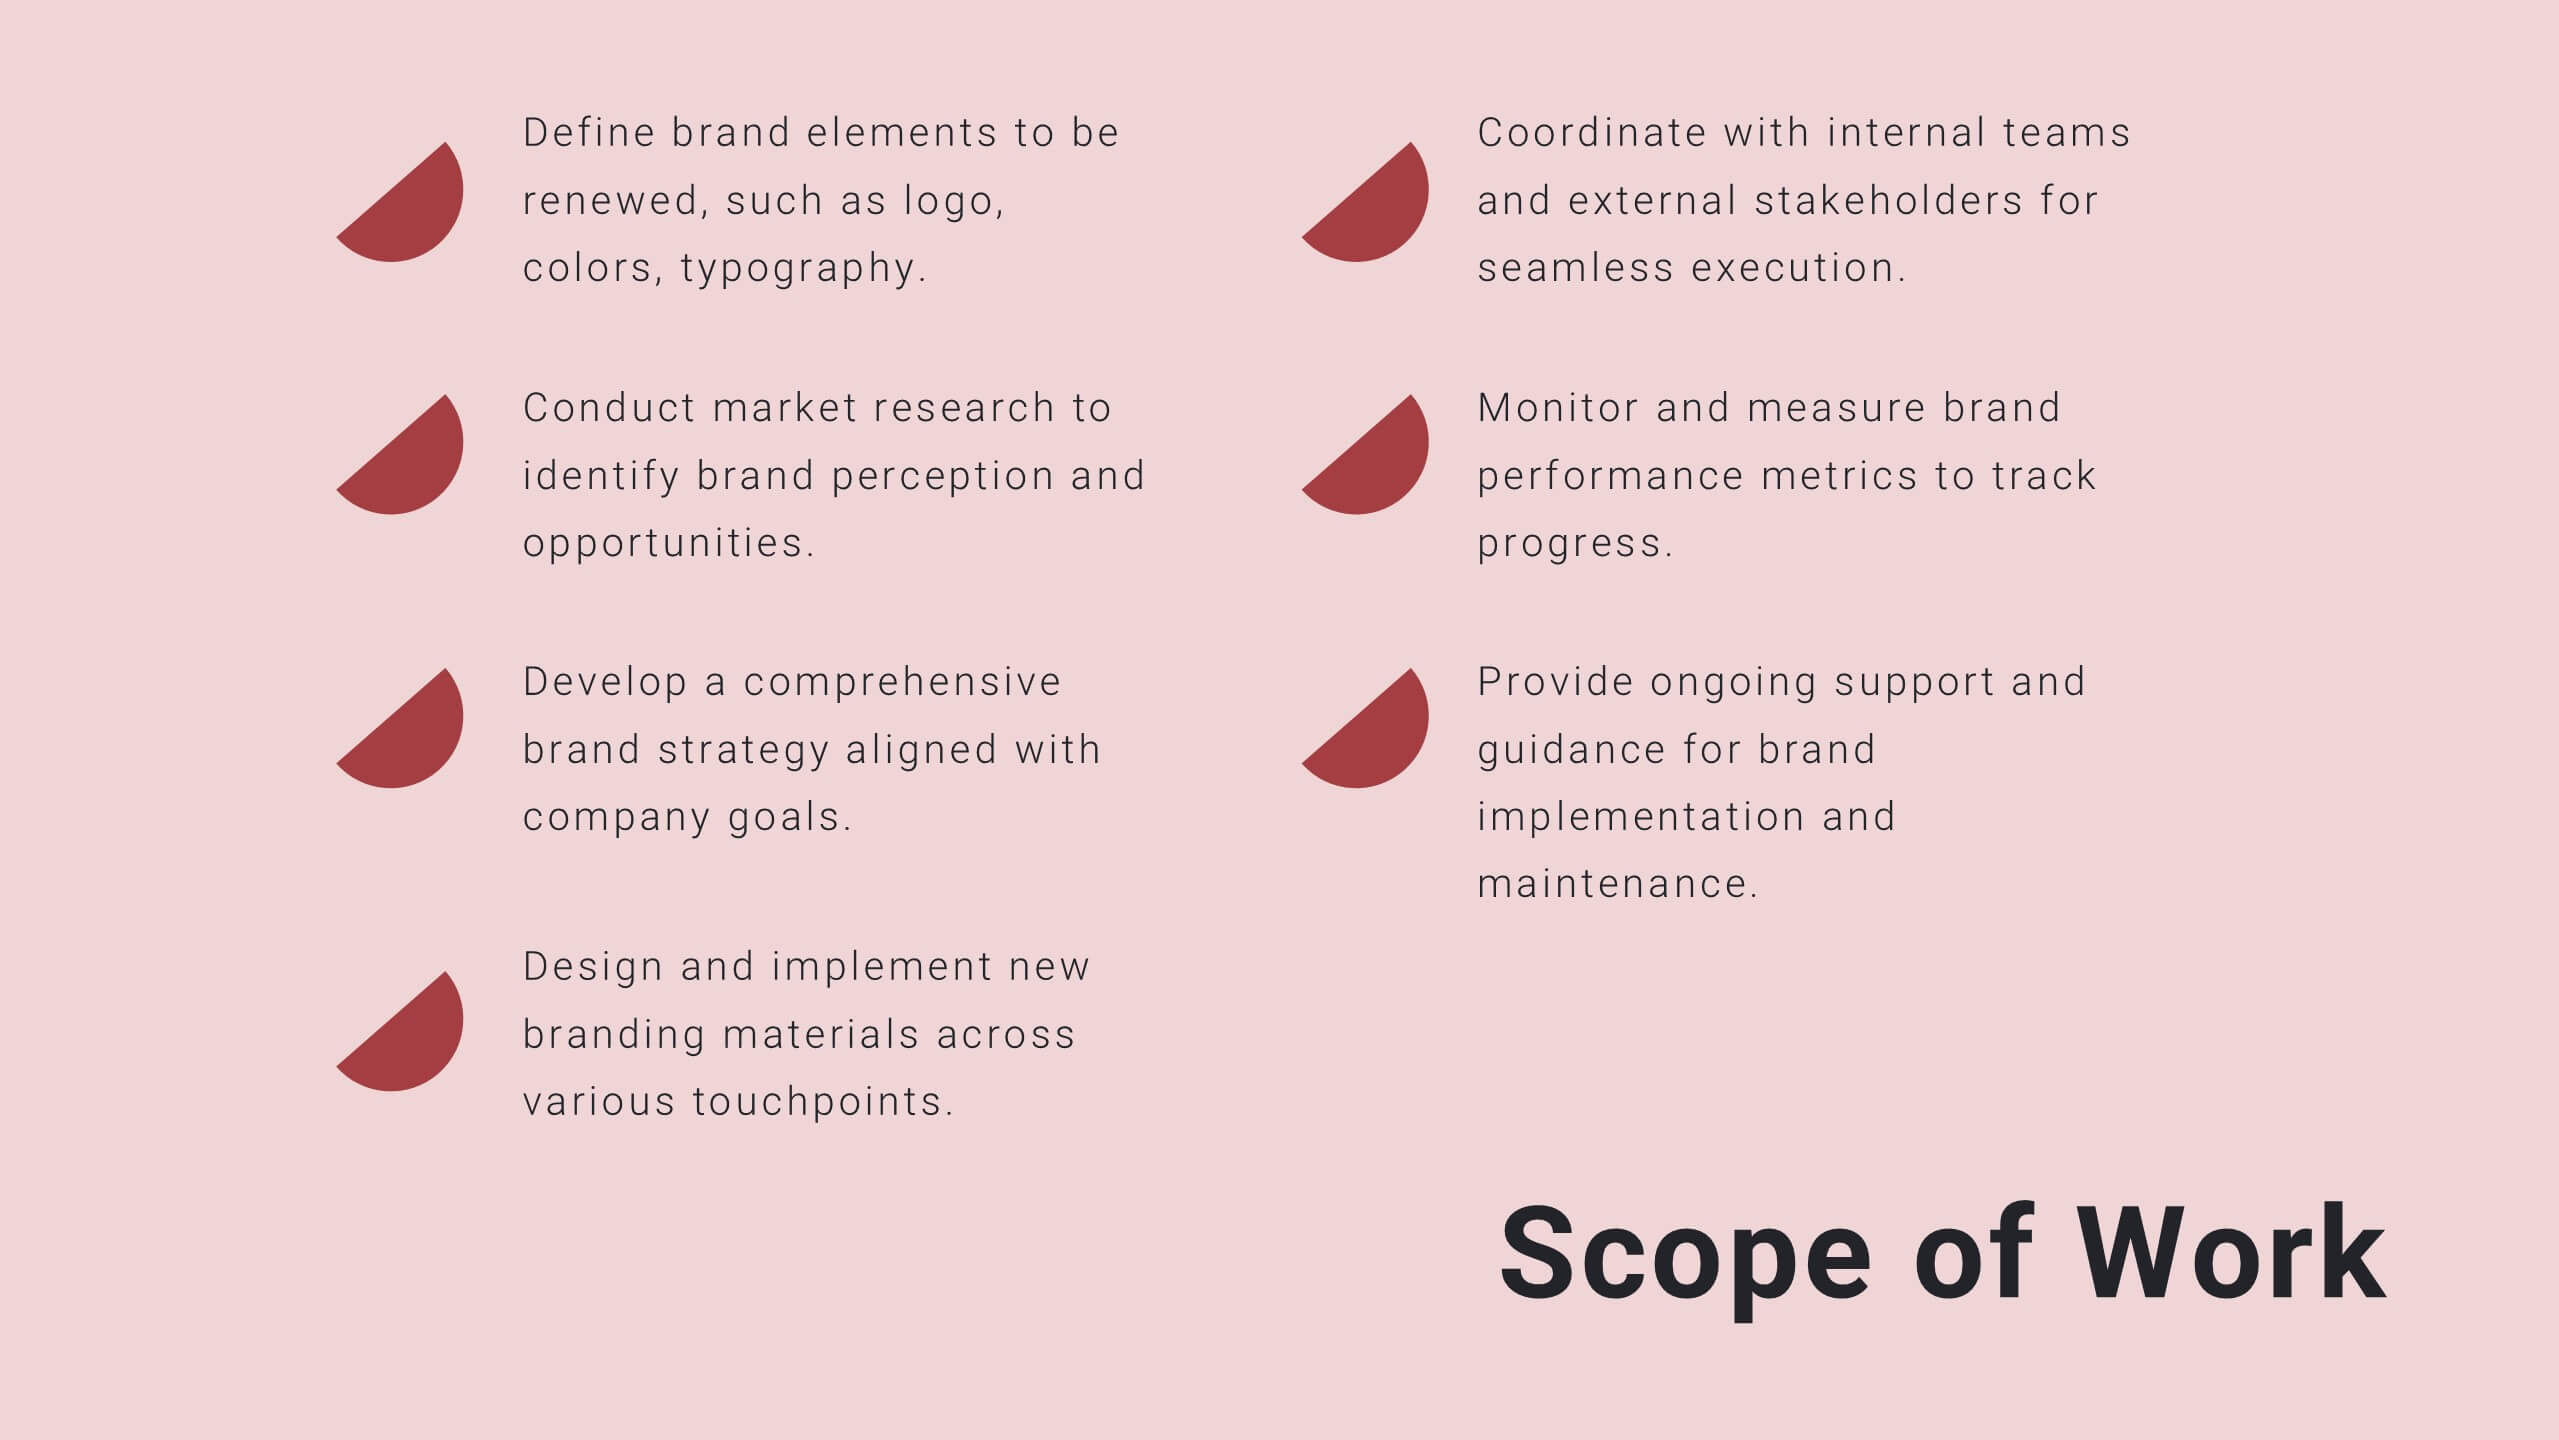
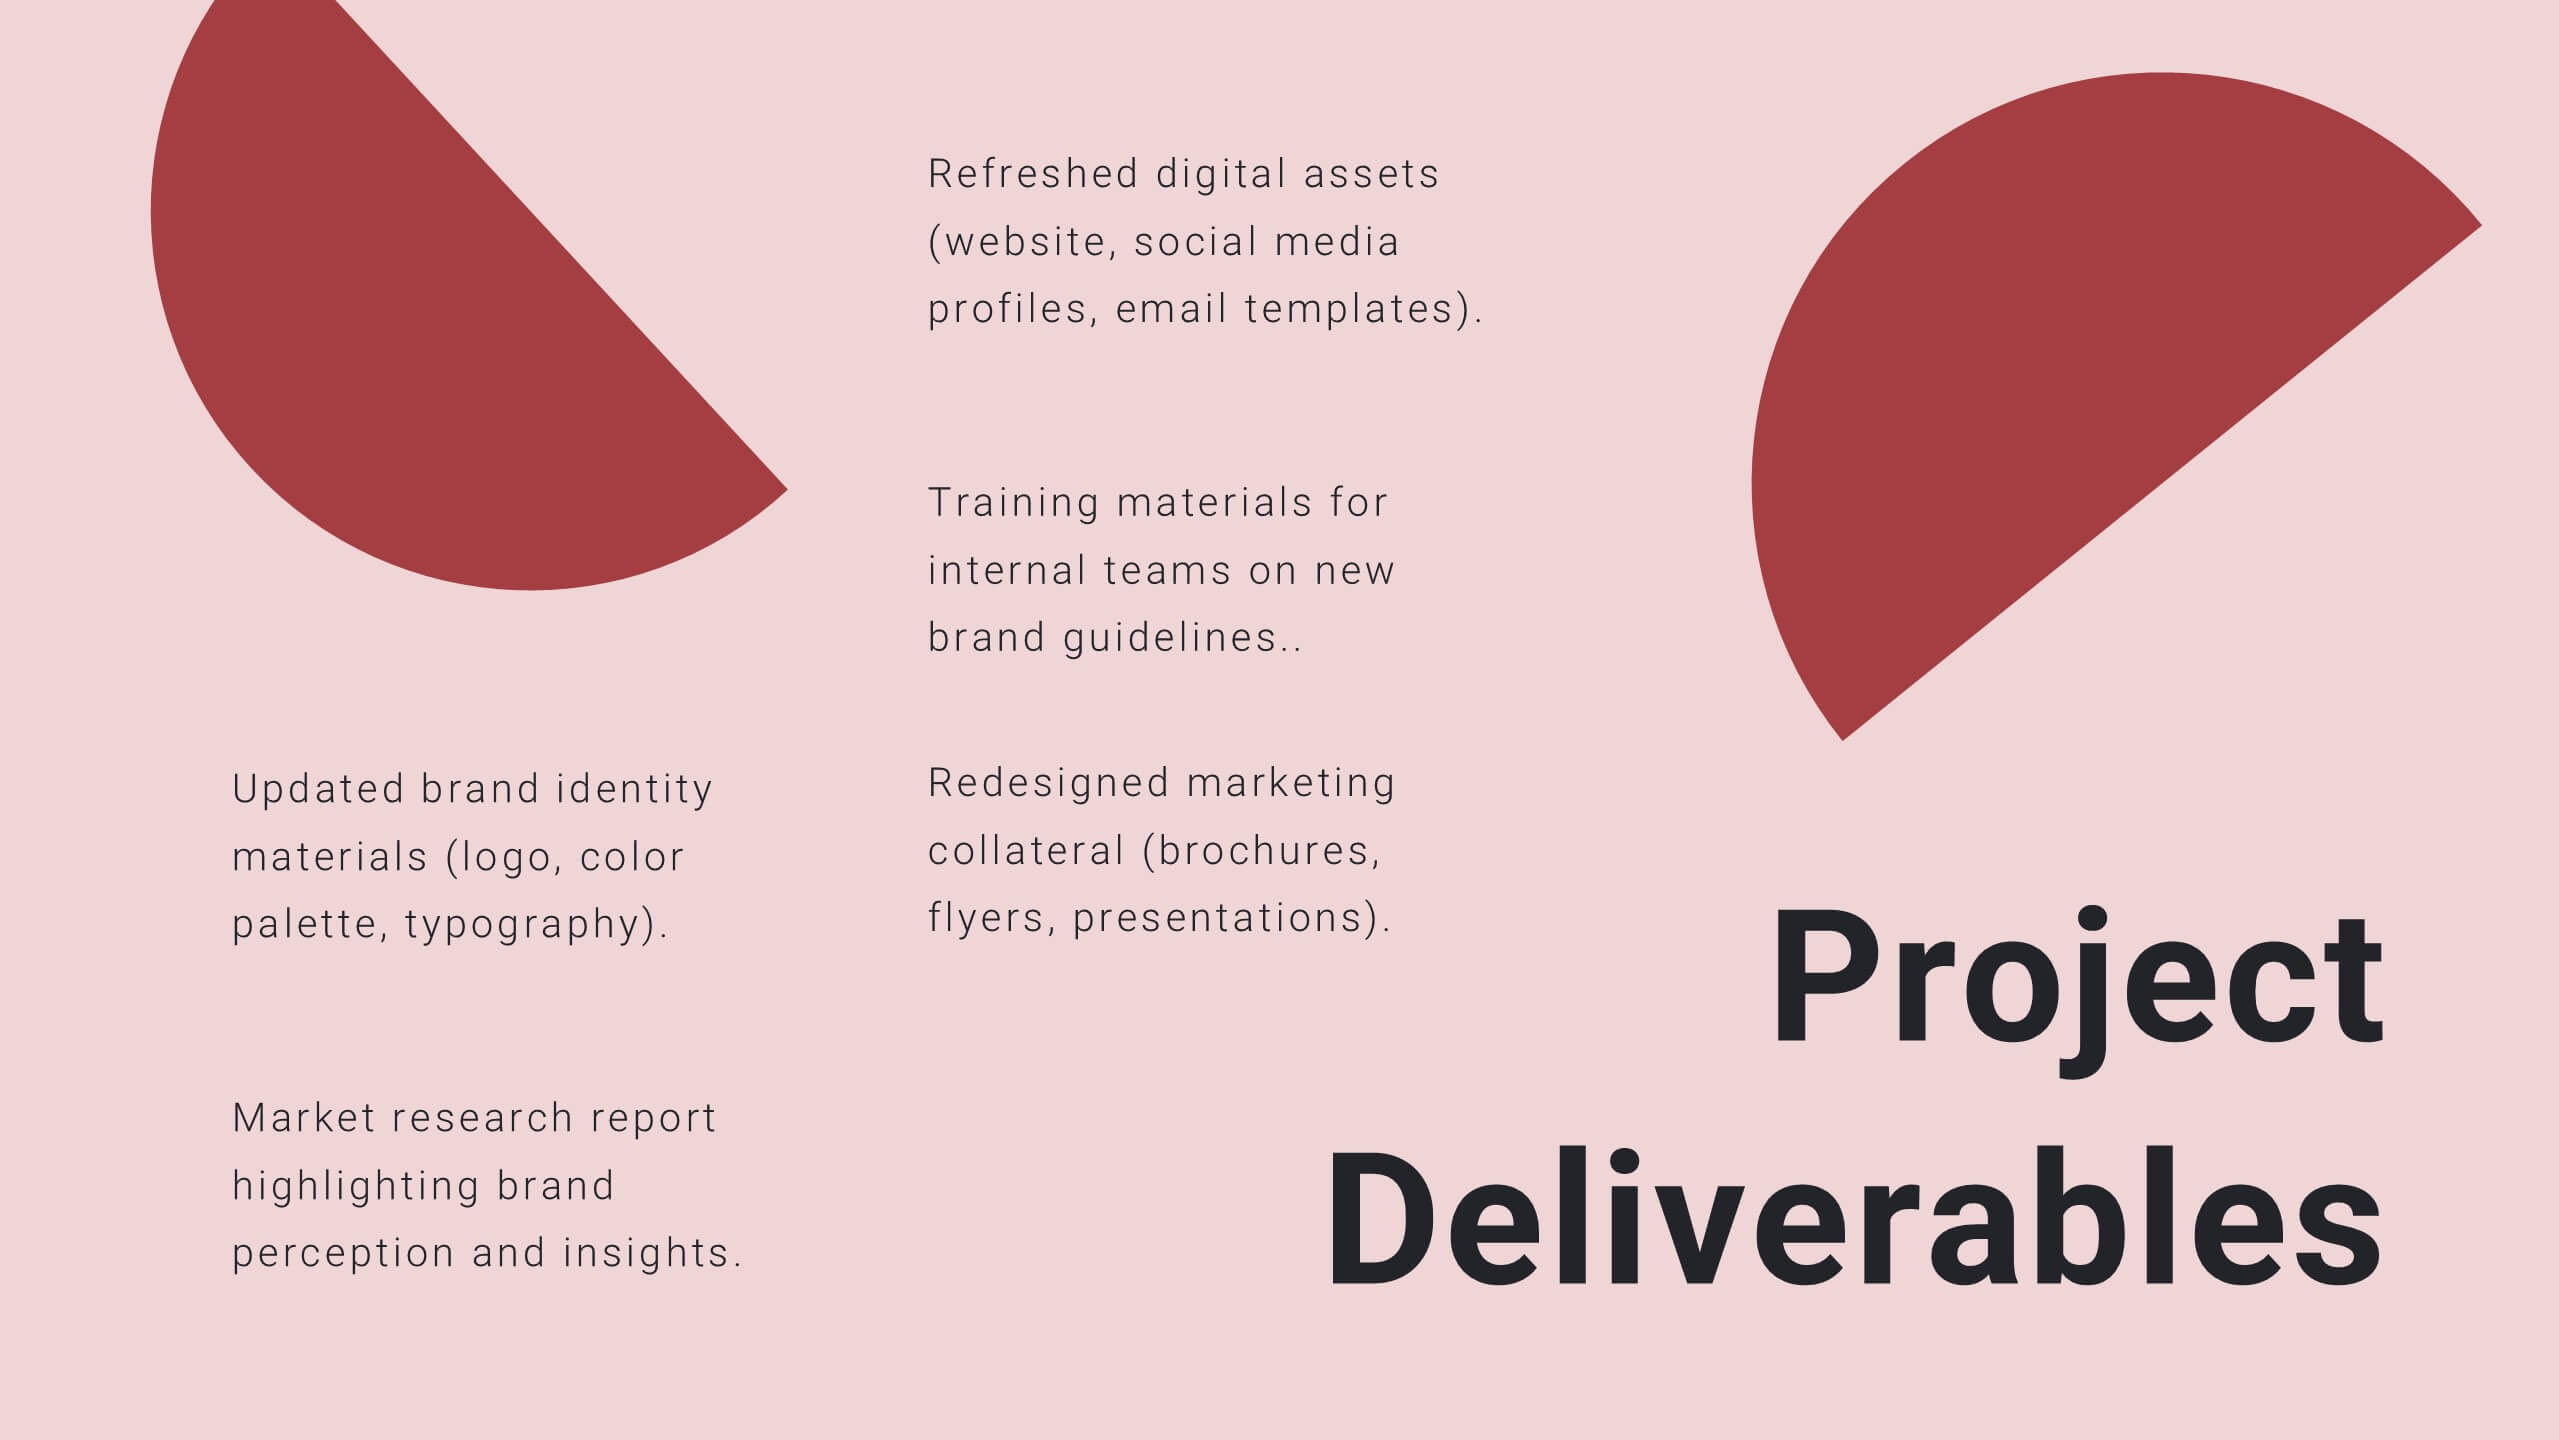
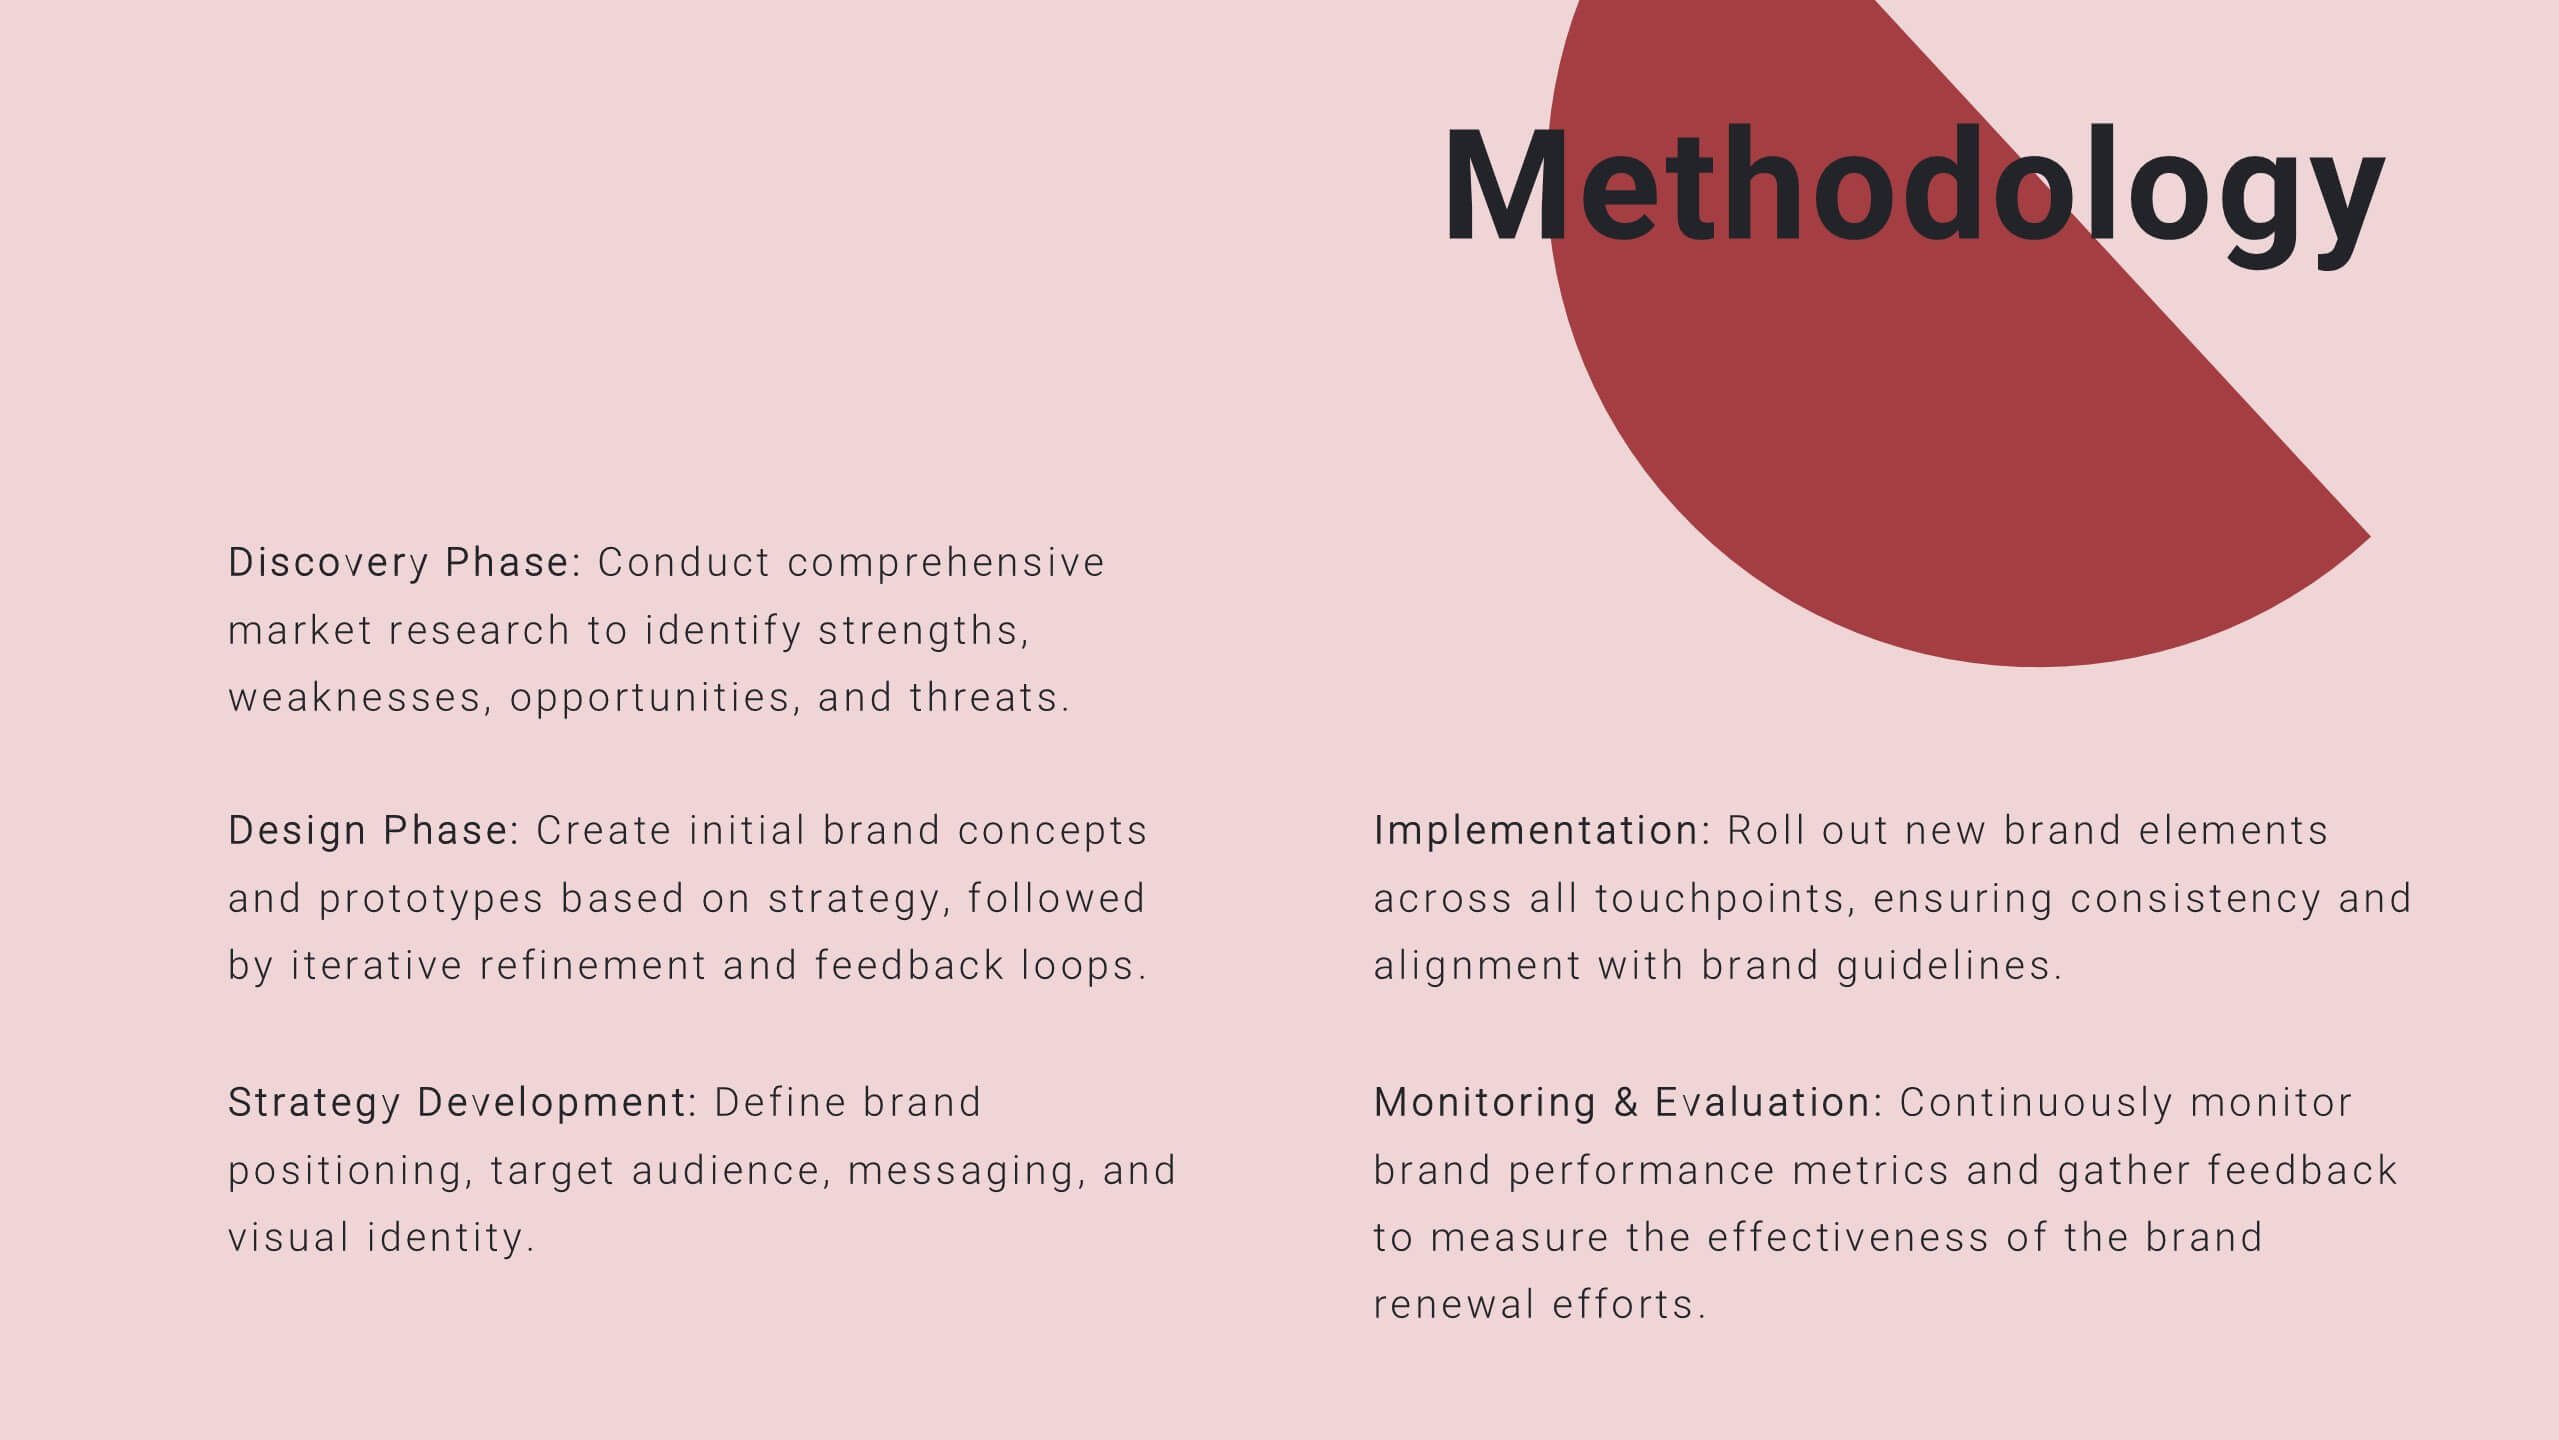
Objective Research Infographics
Enhance your presentation on "Objective Research" with our professionally designed infographic template. This template, compatible with PowerPoint, Keynote, and Google Slides, is the perfect tool for presenting complex research data in a clear and engaging manner. Our template boasts a clean, modern design with a neutral color scheme, making it ideal for both corporate and academic settings. The layout is expertly crafted to showcase your research objectives, methodologies, and findings in a visually appealing way. It includes elements like graphs, charts, and bullet points, ensuring your data is not only accessible but also impactful. Easy to customize and user-friendly, this template empowers you to convey your research objectives with clarity and professionalism. Whether you're presenting to colleagues, students, or stakeholders, this infographic template will elevate your presentation and make your data stand out.


21 diapositivas
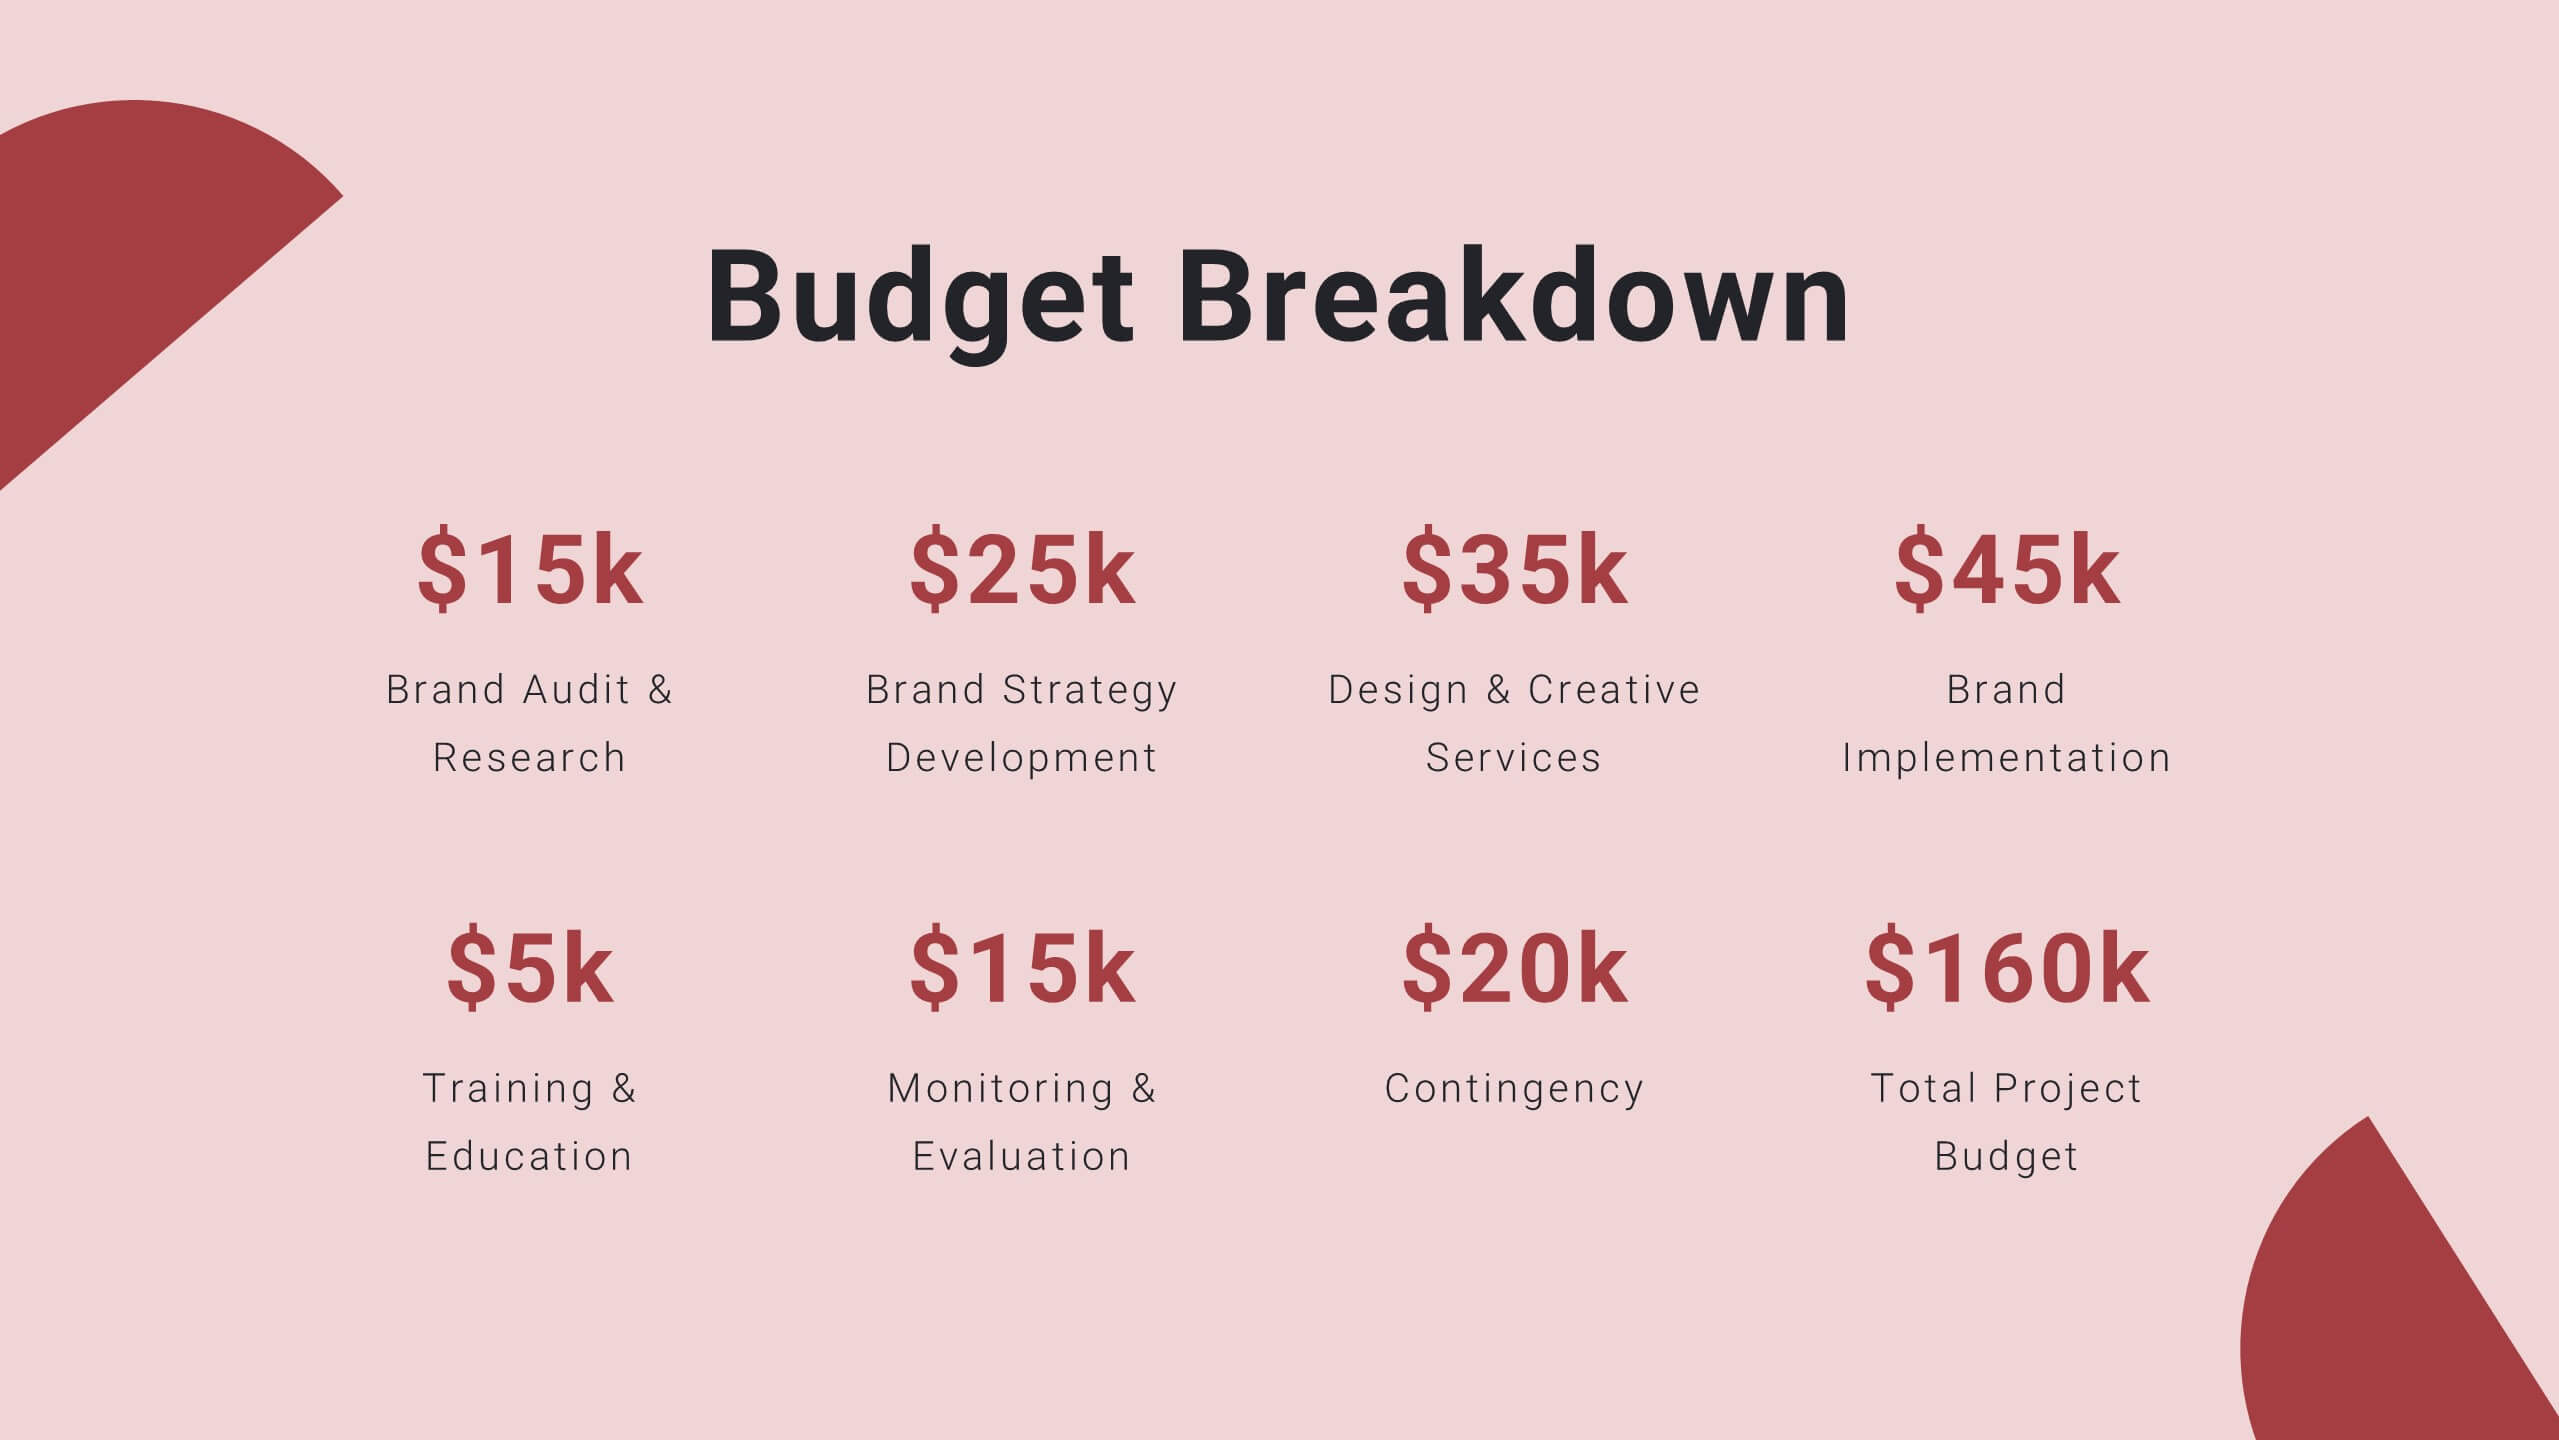
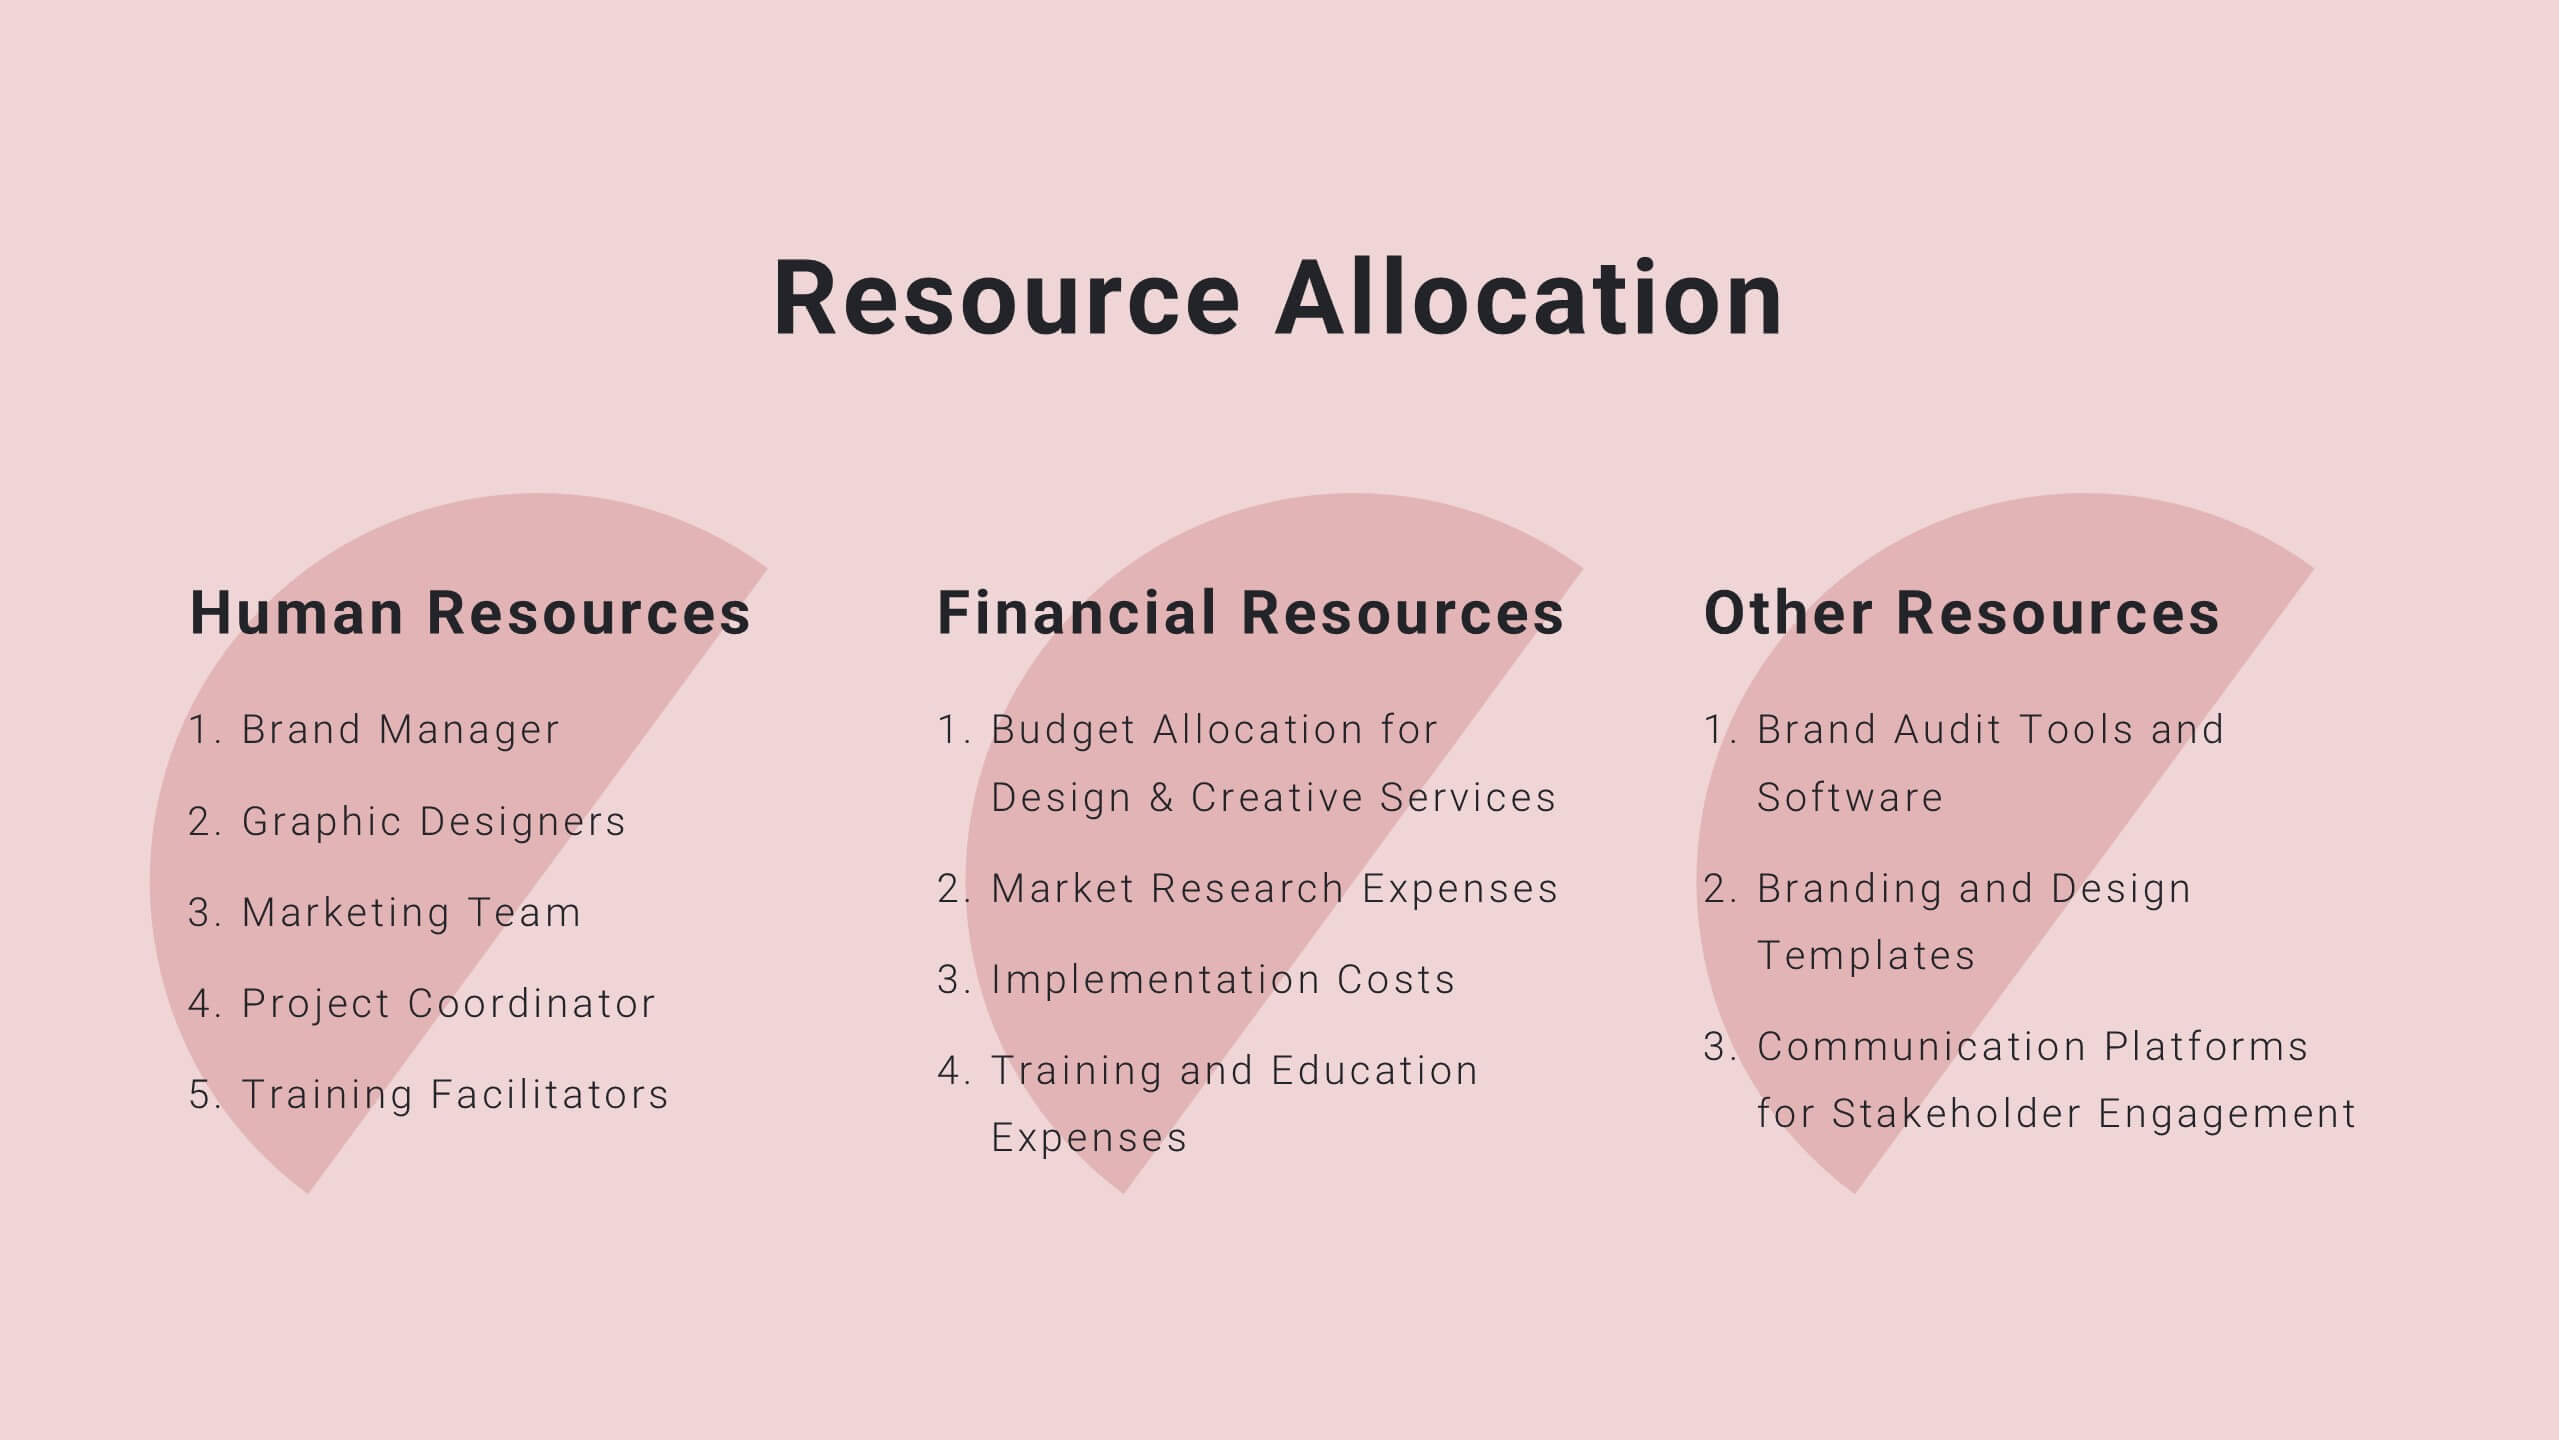
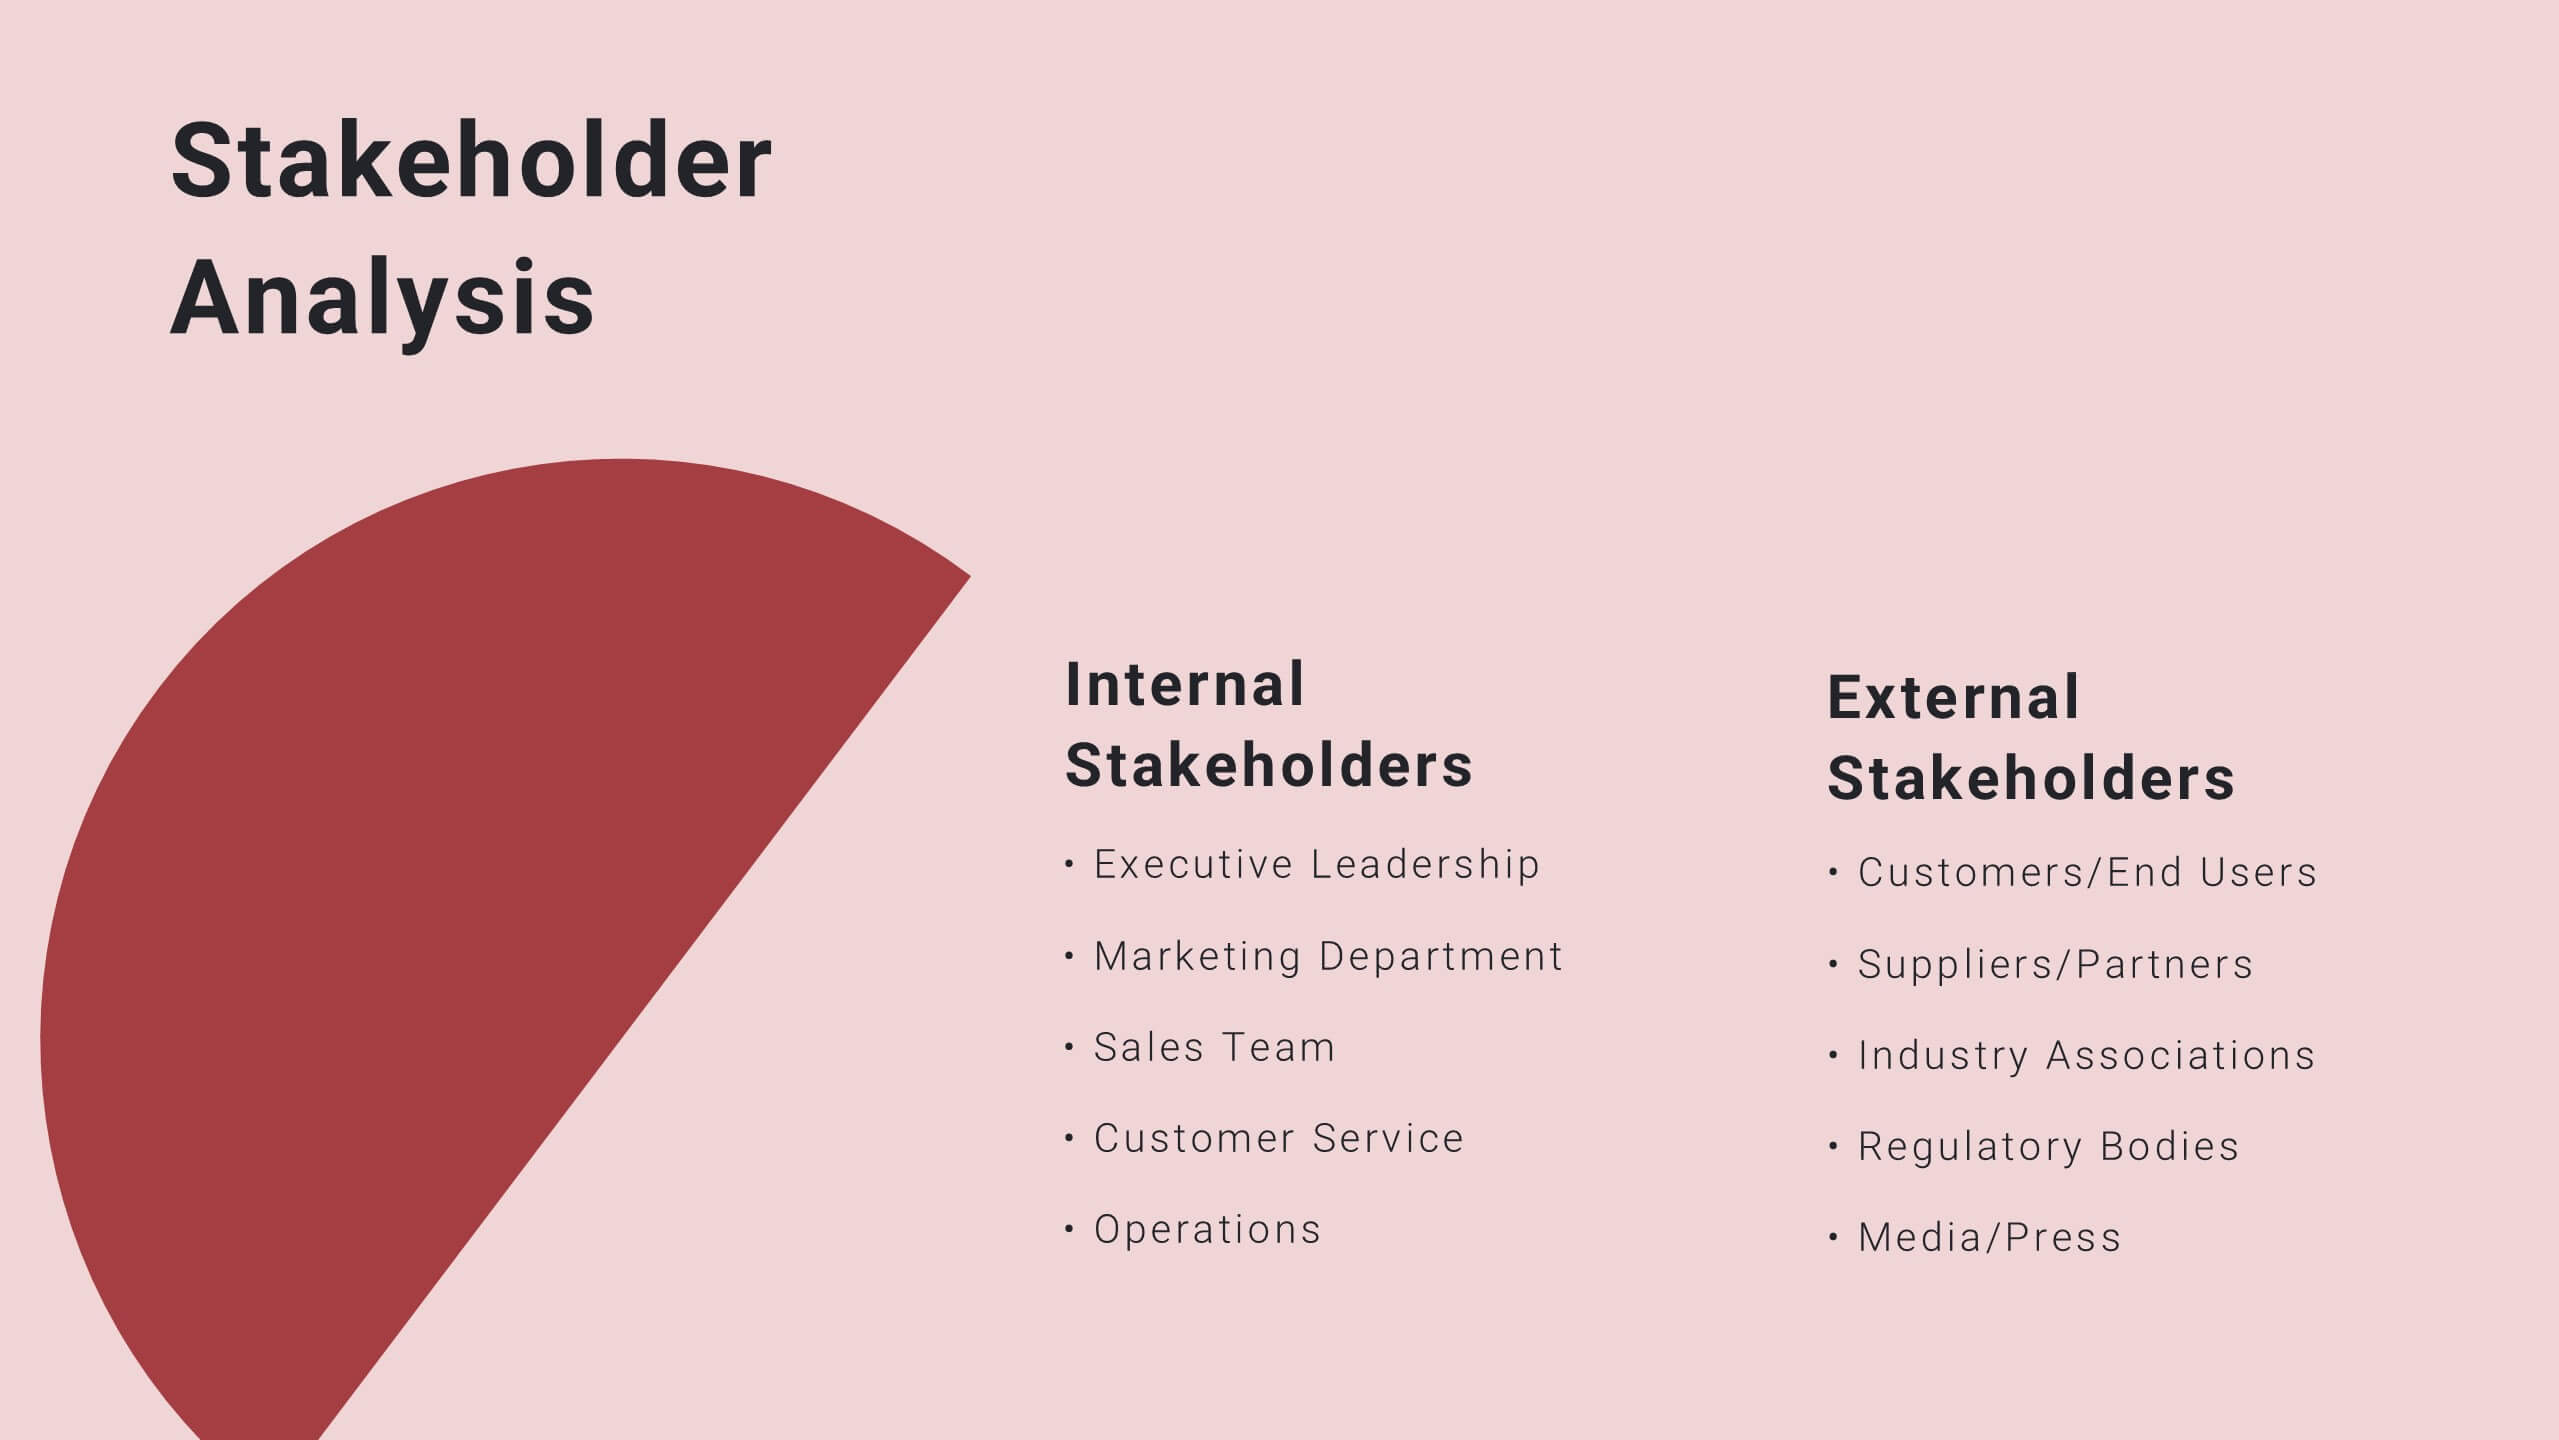
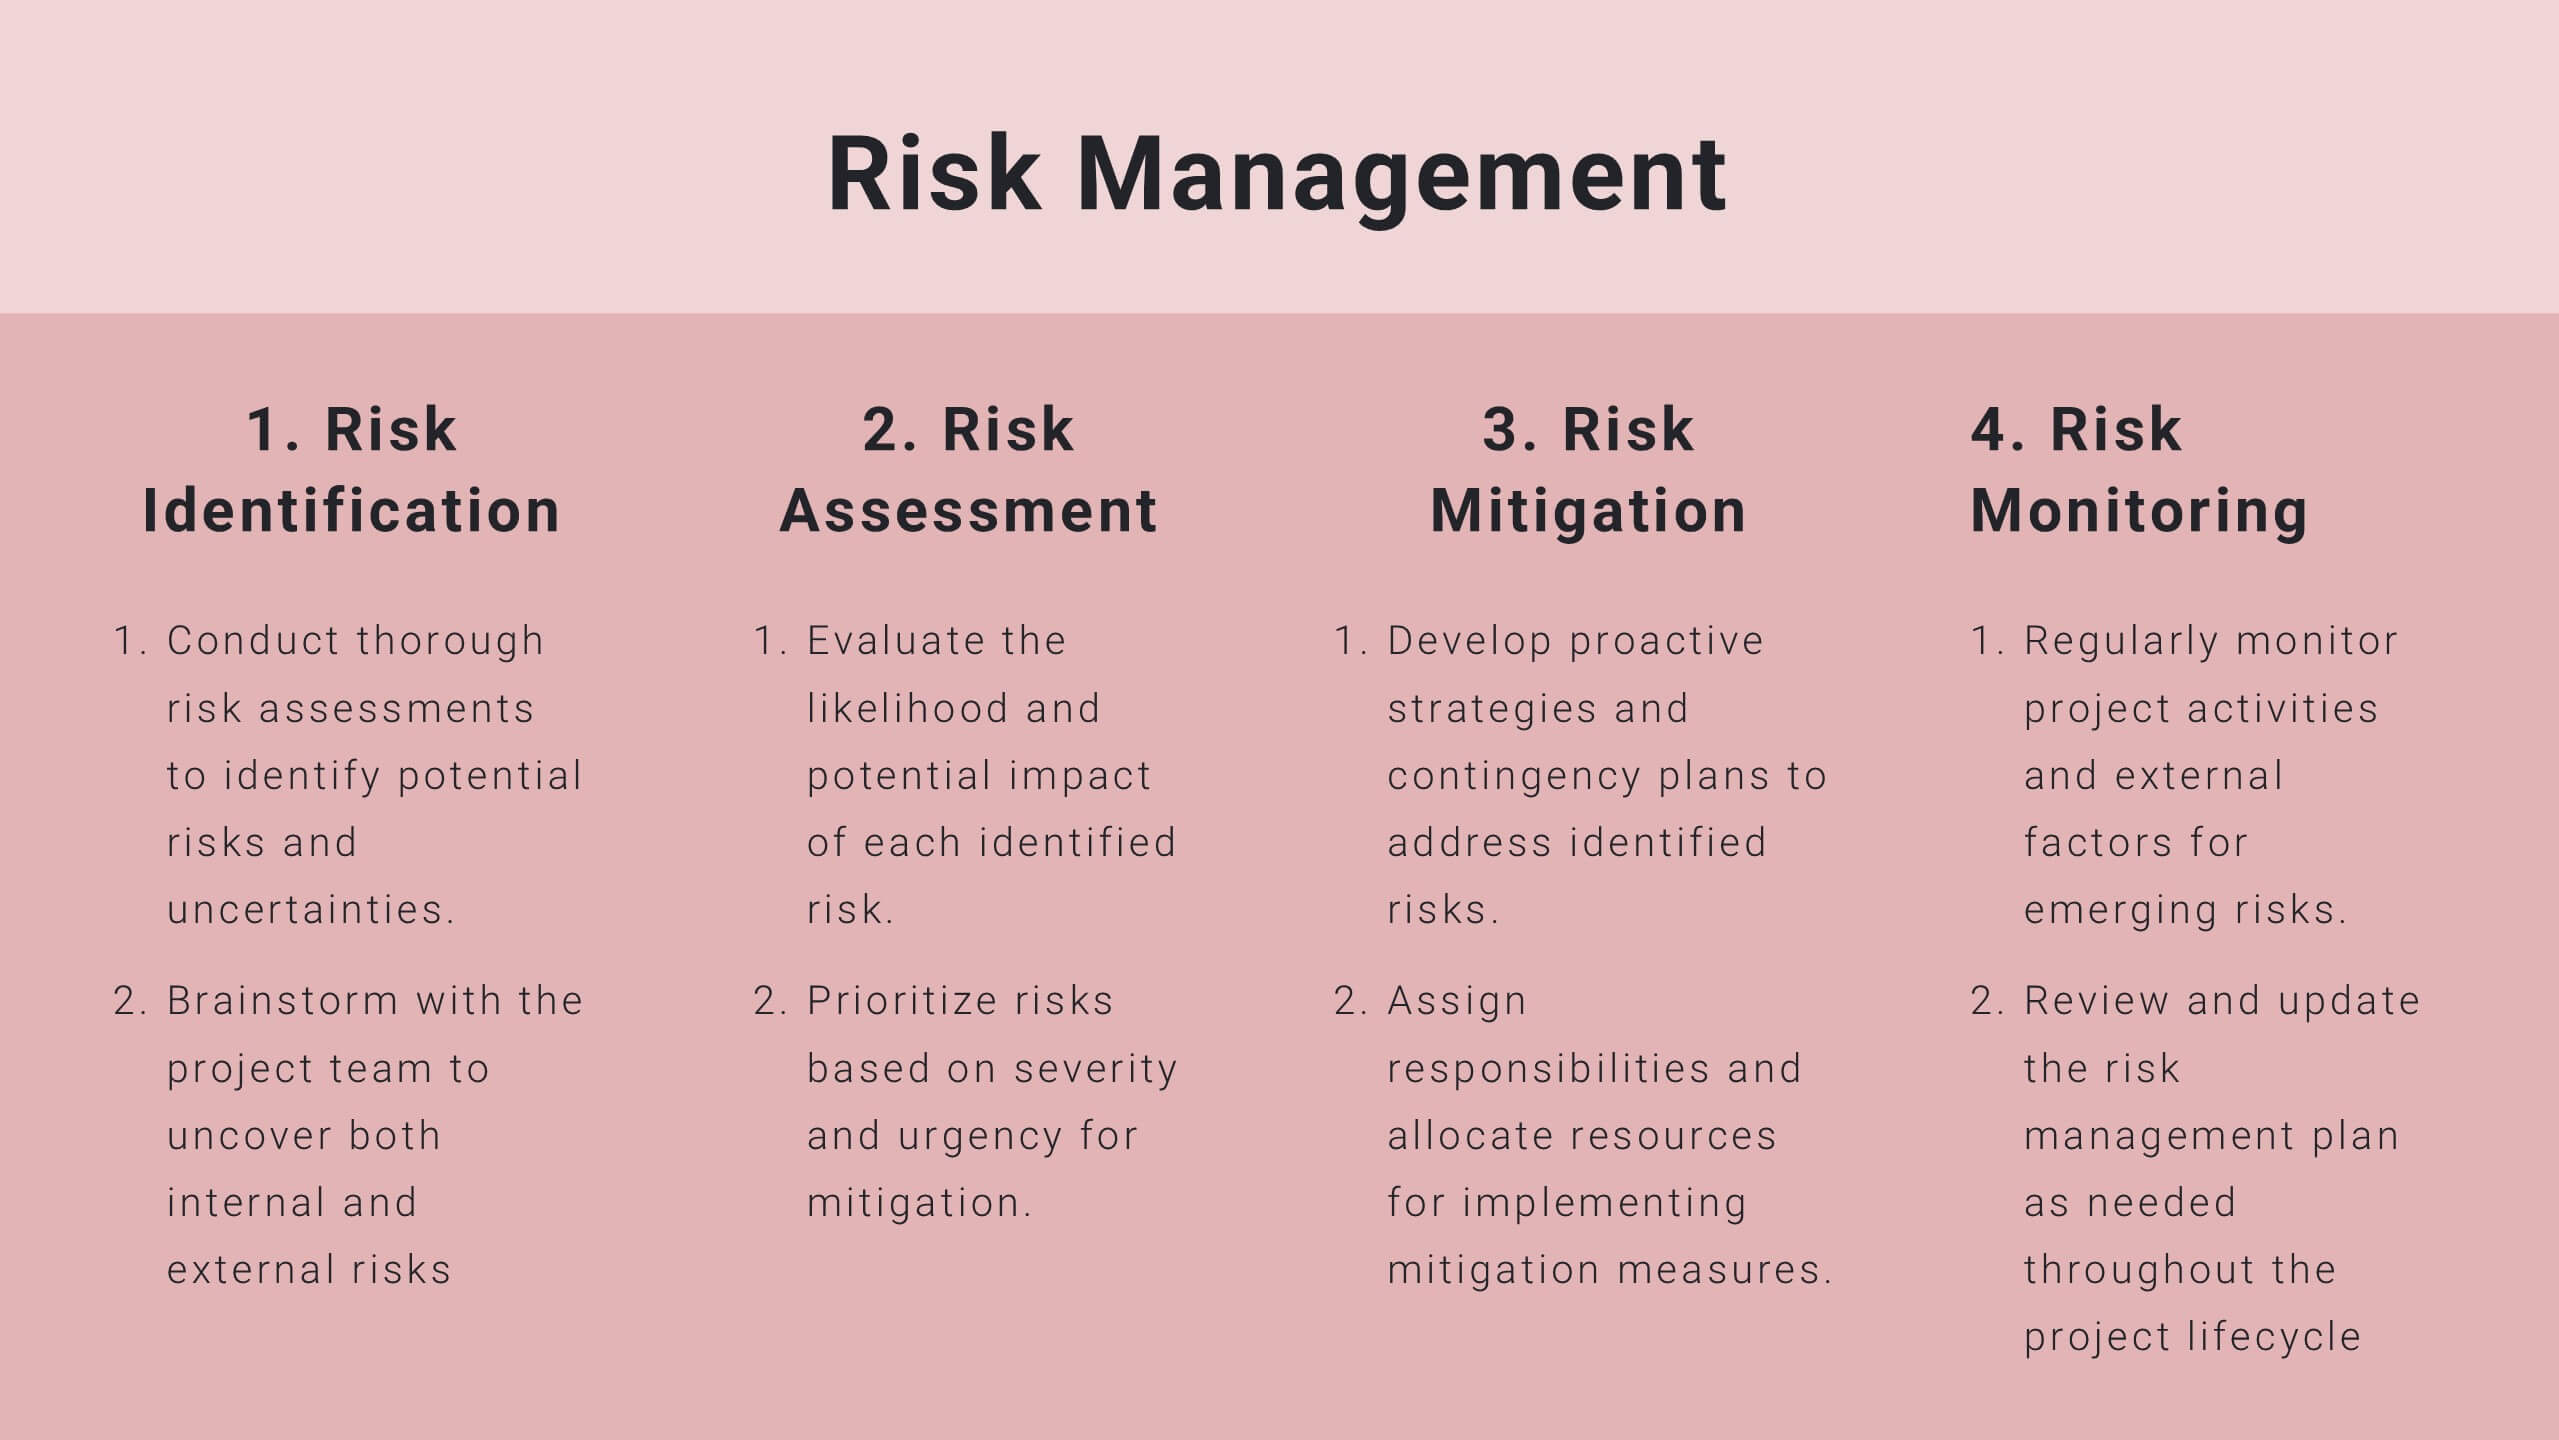
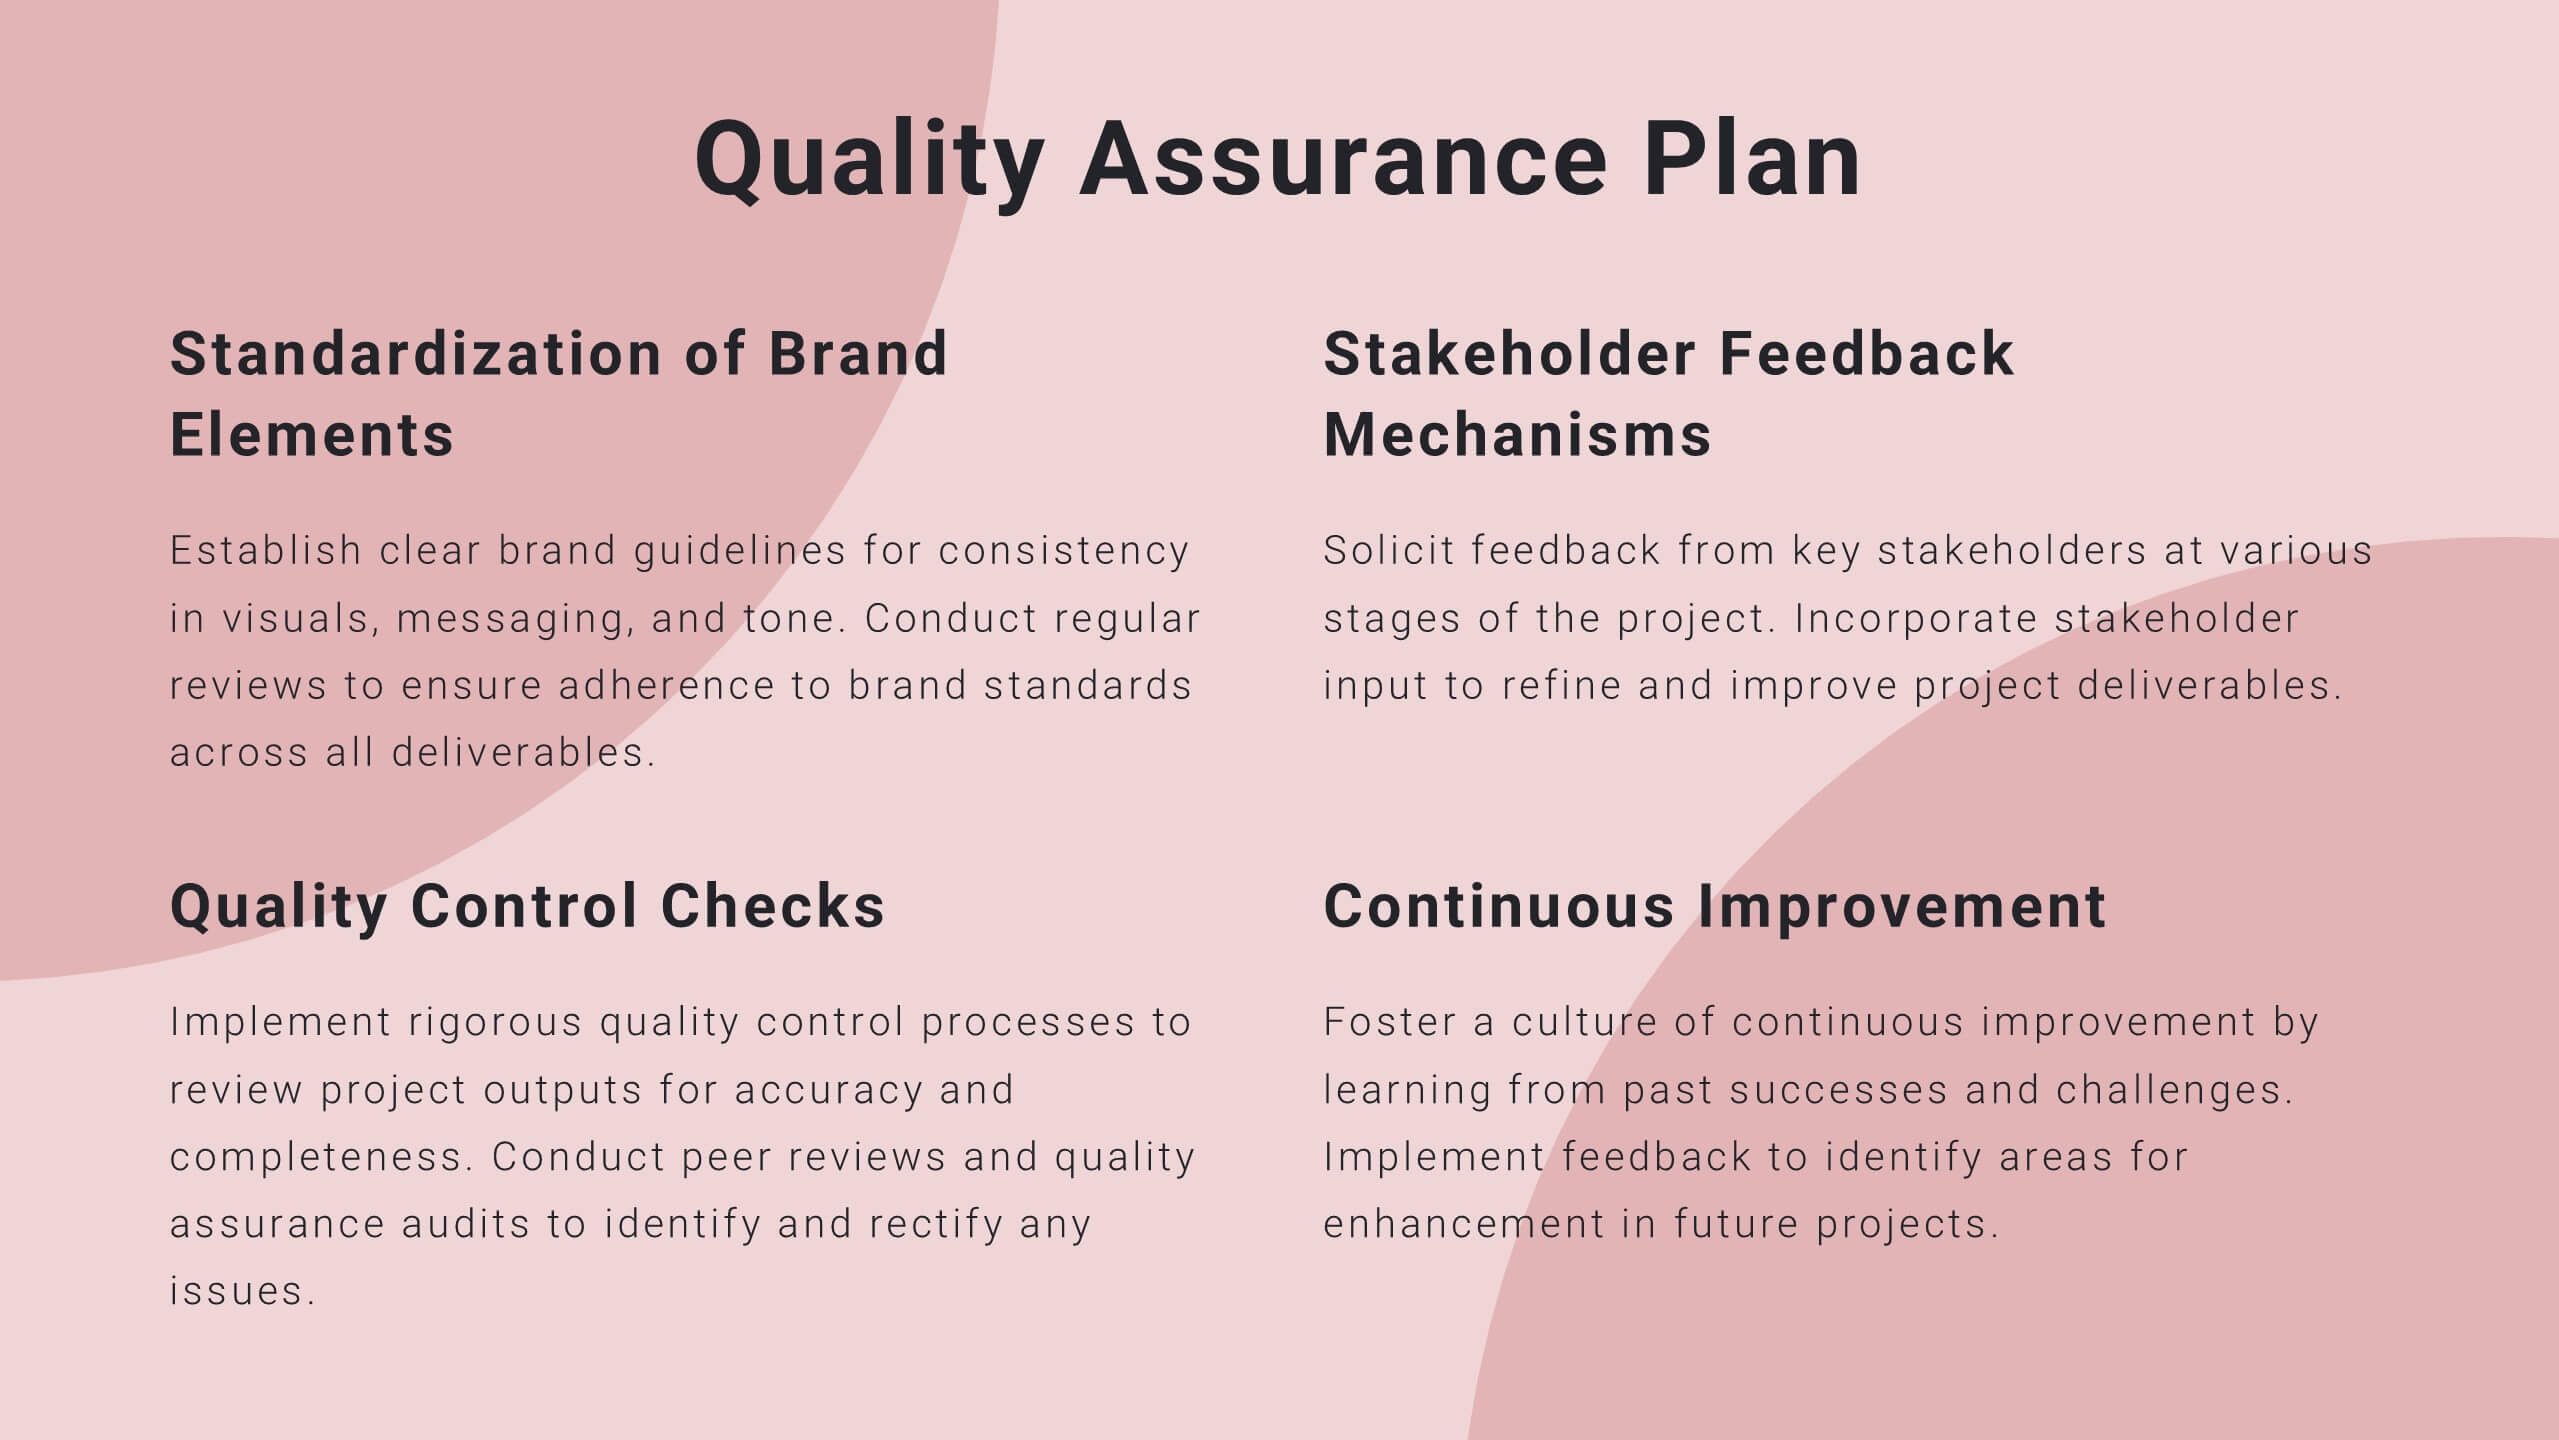
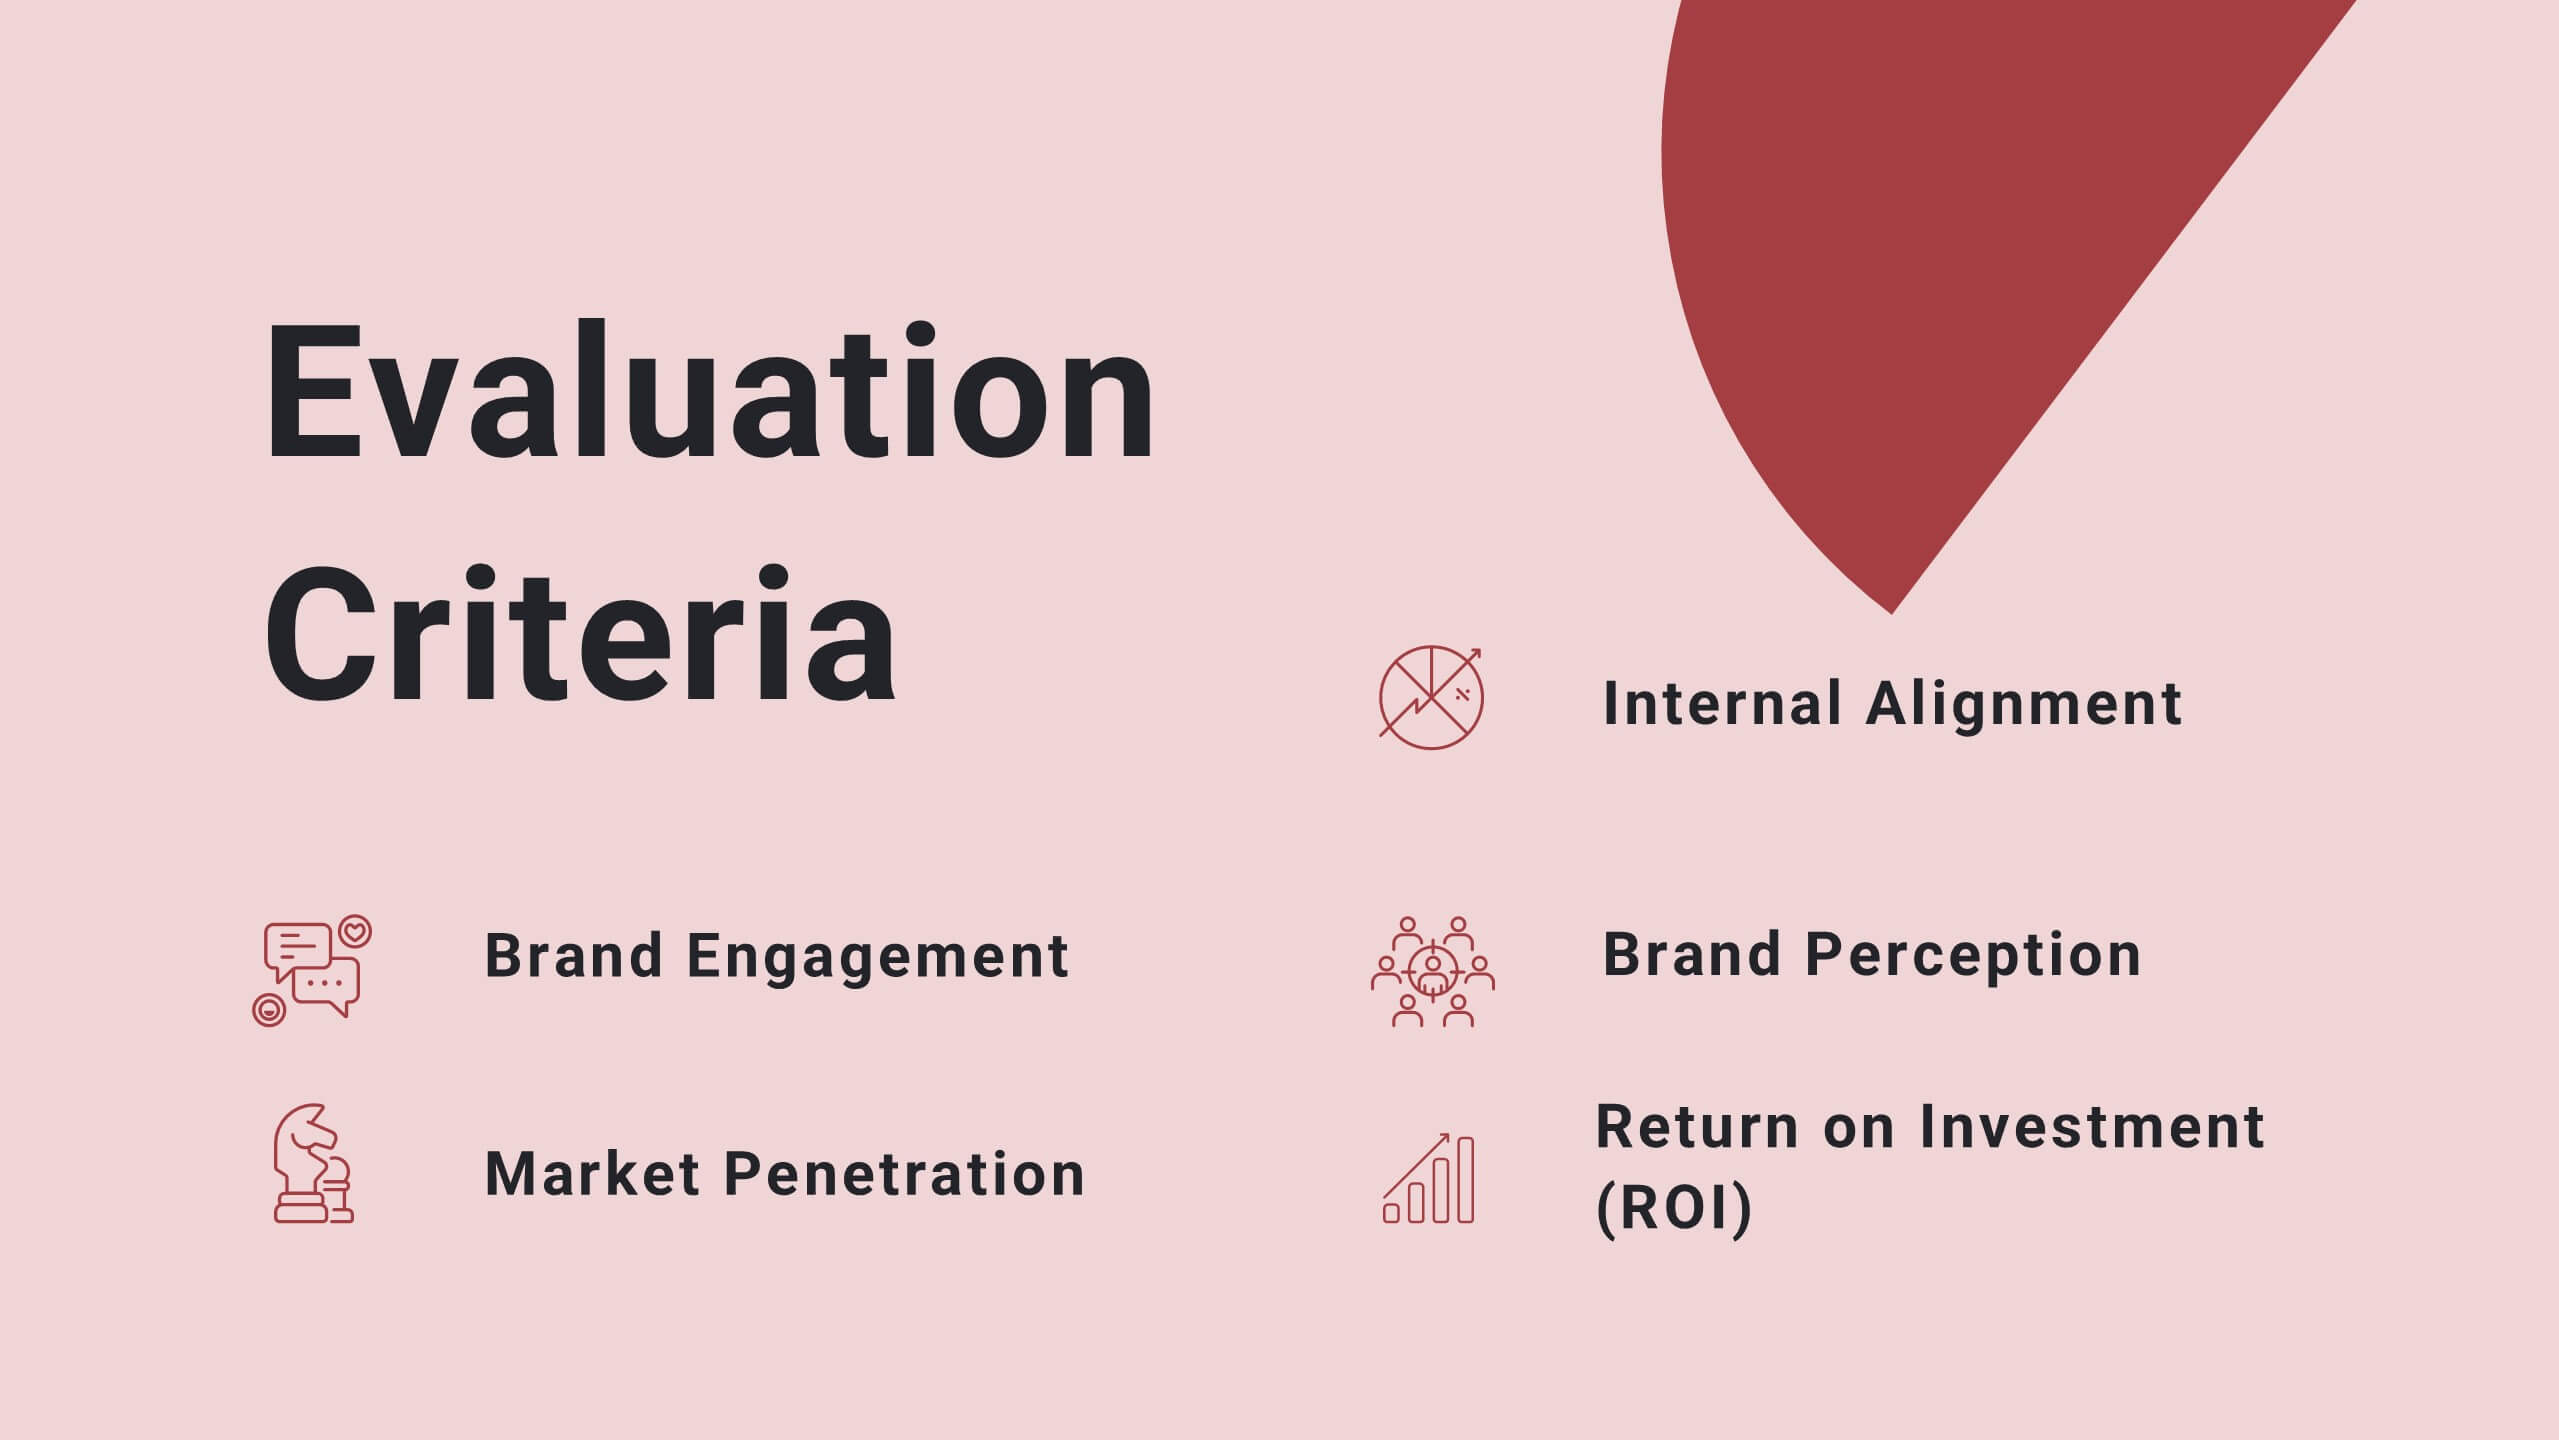
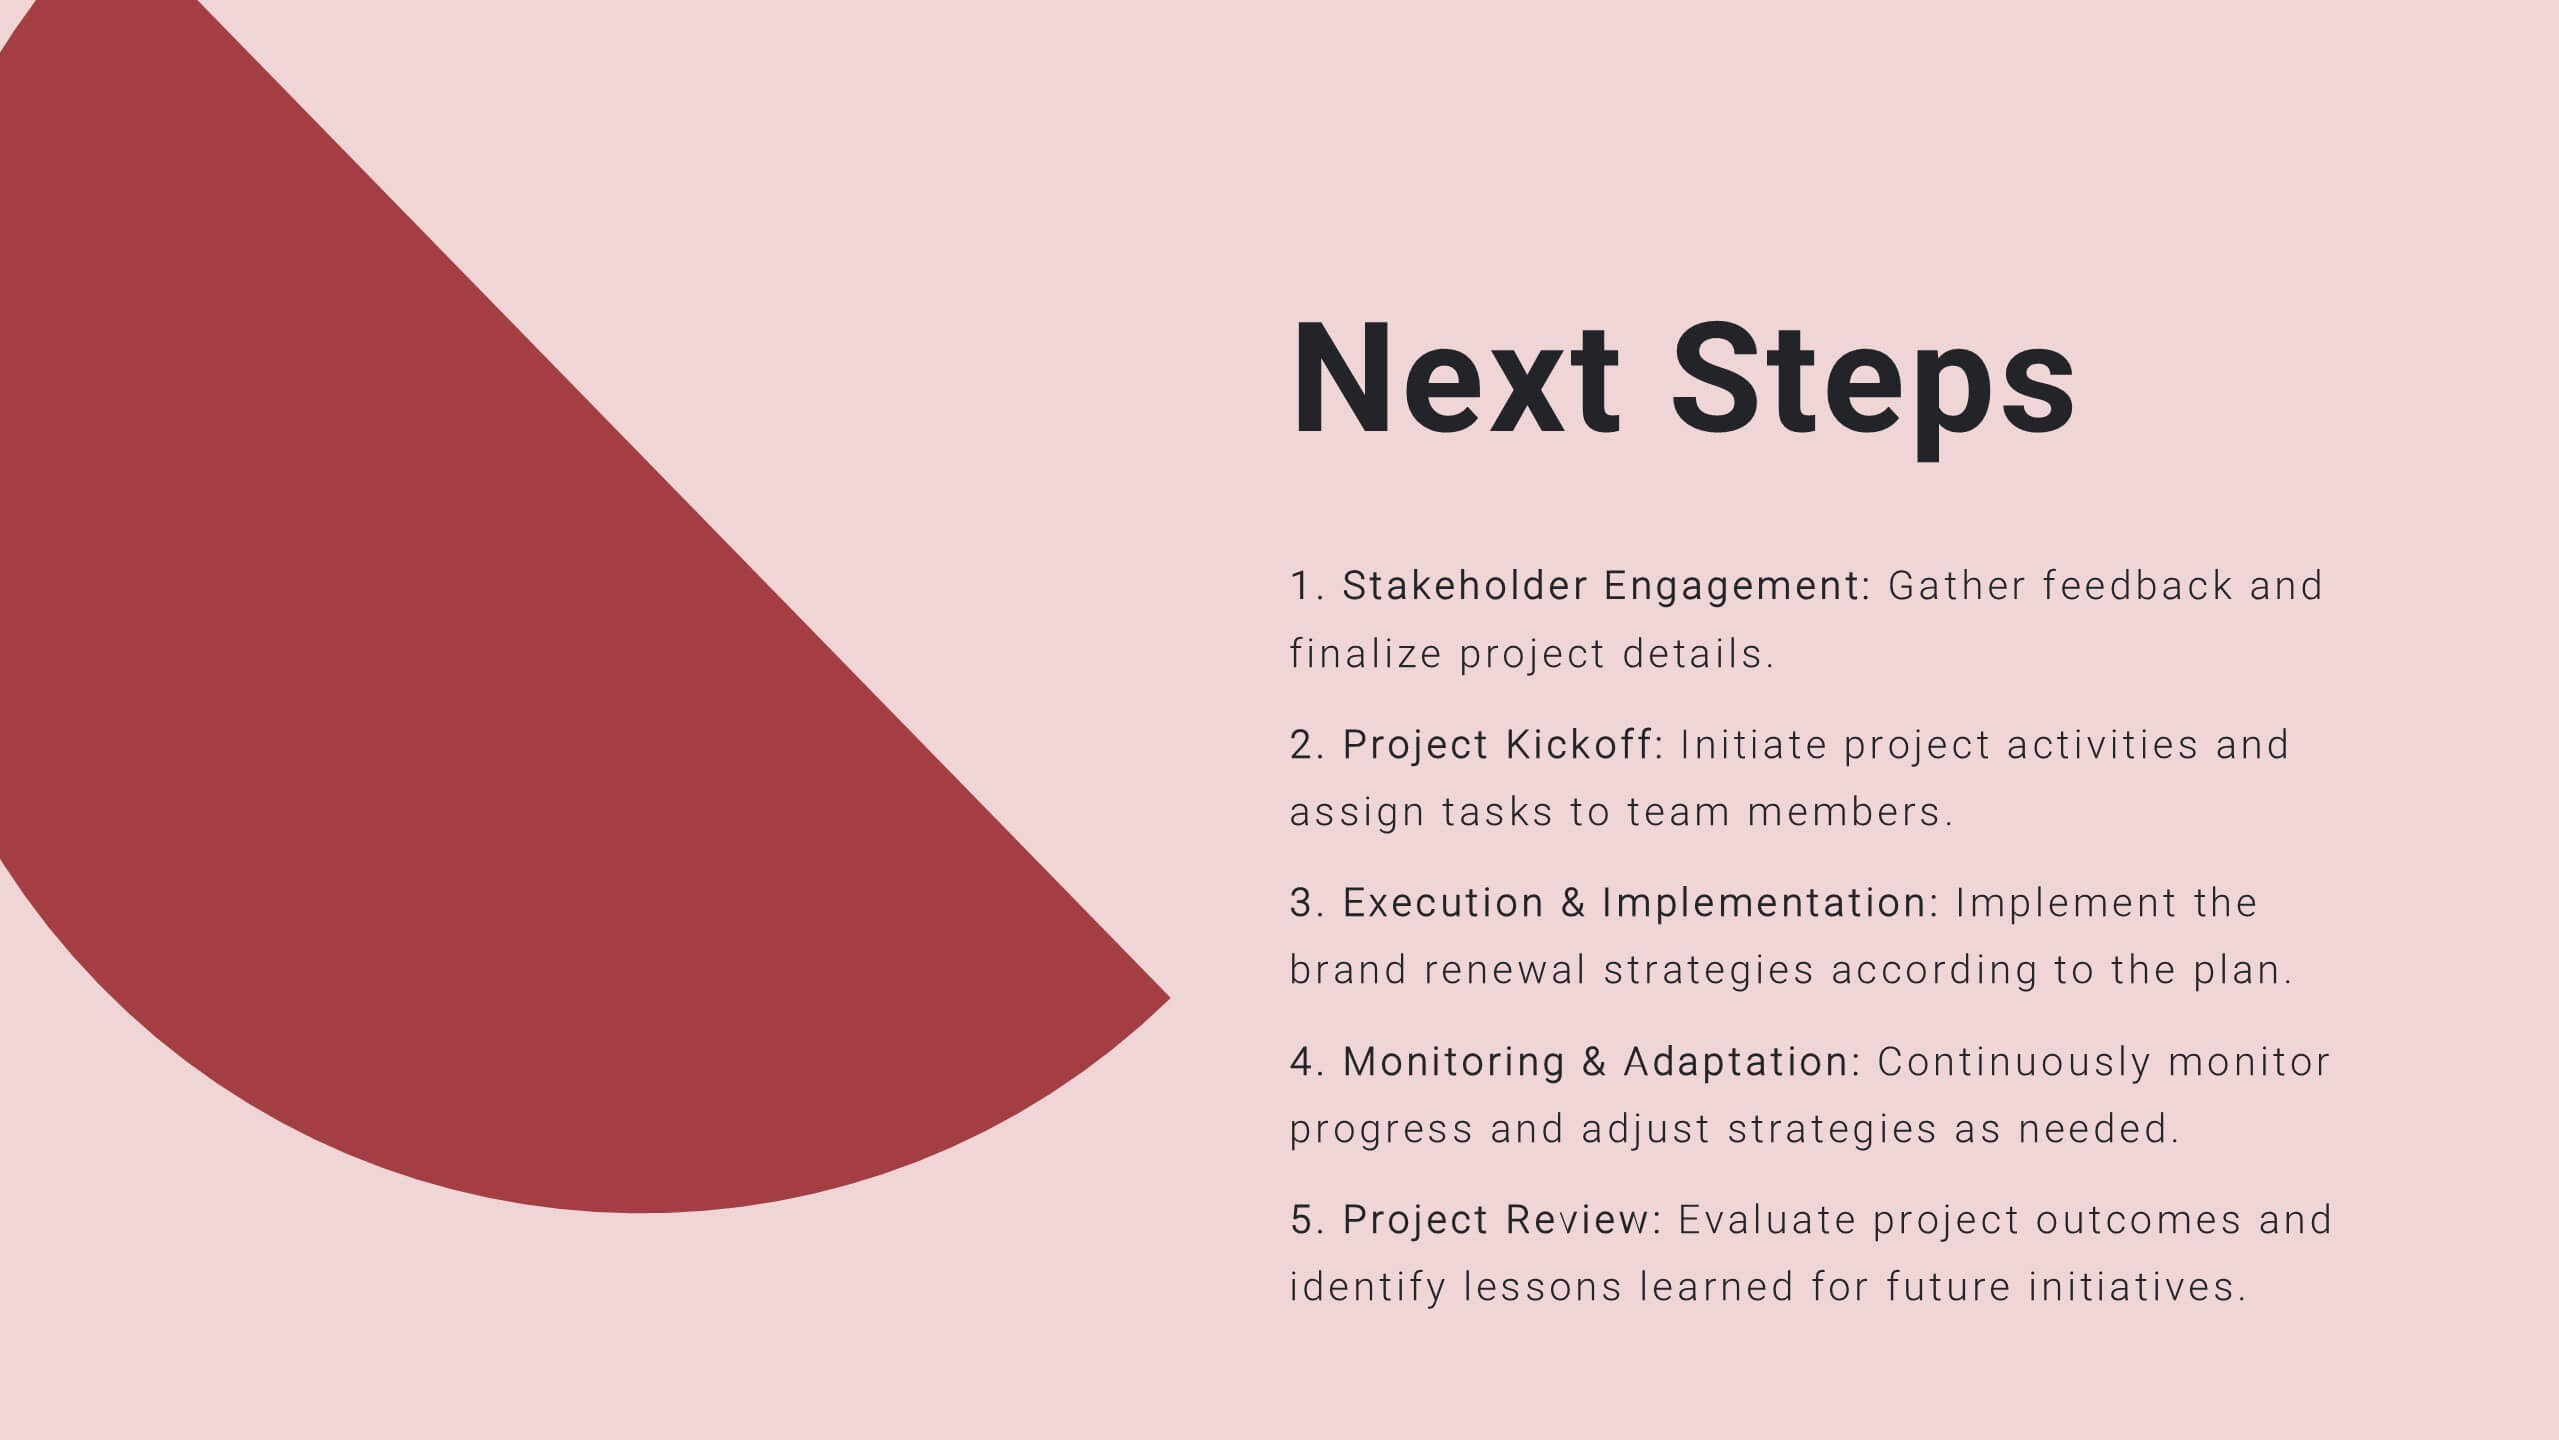
Twilight Project Milestones Report Presentation
Present your project milestones and plan with clarity using this sleek project proposal template! It includes sections for objectives, timelines, budget breakdowns, and risk management. Perfect for organizing and presenting complex project plans, it’s fully customizable and compatible with PowerPoint, Keynote, and Google Slides, ensuring a professional presentation every time.


4 diapositivas
Strategic Gap Planning Template Presentation
Visually map the journey from current state to strategic goals with this puzzle-themed gap analysis template. Ideal for identifying key disconnects, setting priorities, and aligning teams. Fully editable and designed for clarity, this presentation works in PowerPoint, Keynote, and Google Slides—perfect for planning sessions, roadmaps, and executive briefings.


5 diapositivas
Human-Centered Design Thinking Strategy
Showcase empathy-driven innovation with the Human-Centered Design Thinking Strategy Presentation. This slide visually emphasizes user-focused thinking by combining a head silhouette with colorful puzzle icons representing each strategic step. Ideal for UX strategy meetings, product development pitches, and innovation workshops, it includes five editable segments labeled A to E, each with matching text fields to explain your core insights or process stages. Compatible with PowerPoint, Keynote, and Google Slides for seamless editing and presentation.


3 diapositivas
Organized Bullet Point Summary Presentation
Present key facts clearly with the Organized Bullet Point Summary Presentation. Designed for structured communication, this layout visually breaks down your main points with icons, color blocks, and percentage highlights. Perfect for reporting metrics, comparing ideas, or prioritizing tasks. Fully editable in PowerPoint, Keynote, and Google Slides.


5 diapositivas
Pillar-Based Marketing Strategy Presentation
Visualize the foundations of your marketing efforts with our Pillar-Based Marketing Strategy presentation template. This layout helps you define and discuss the critical elements that uphold your marketing campaigns, ensuring clear communication of strategies to your team or stakeholders.


8 diapositivas
Business Strategy Planning Presentation
Strategize with Impact using this Business Strategy Planning Presentation template. This slide provides a visually compelling roadmap to outline key business strategies, objectives, and growth plans in an easy-to-follow format. Perfect for corporate meetings, executive briefings, and business planning sessions, this template ensures your business vision is communicated clearly and effectively. Fully editable and available for PowerPoint, Keynote, and Google Slides for seamless customization.


6 diapositivas
Strategic Planning with Hexagon Diagram
Visualize complex plans with clarity using the Strategic Planning with Hexagon Diagram Presentation. This slide layout features six connected hexagons forming a cohesive structure around a central idea—perfect for mapping out strategic pillars, initiatives, or departmental functions. Each segment is color-coded and labeled A–F, making it easy to present interconnected elements such as goals, KPIs, resources, risks, and action plans. Fully editable in PowerPoint, Keynote, and Google Slides, you can customize the layout to fit your organizational strategy or project flow.


6 diapositivas
Business Roadmap Strategy Presentation
Map your path to success with this Business Roadmap Strategy template. Designed for clarity and impact, it helps you outline goals, milestones, and timelines in a visual journey. Ideal for team planning, strategy meetings, and pitches. Compatible with PowerPoint, Keynote, and Google Slides for seamless editing.


6 diapositivas
Effective Communication Infographics
Master the art of Effective Communication with our customizable infographic template. This template is fully compatible with popular presentation software like PowerPoint, Keynote, and Google Slides, allowing you to easily customize it to illustrate and communicate various aspects of effective communication. The Effective Communication infographic template offers a visually engaging platform to outline the principles, strategies, and skills needed to communicate effectively in various contexts, whether it's in business, personal relationships, or public speaking. Whether you're a professional communicator, leader, or someone looking to improve their communication skills, this template provides a user-friendly canvas to create informative presentations and educational materials. Optimize your communication skills with this SEO-optimized Effective Communication infographic template, thoughtfully designed for clarity and ease of use. Customize it to showcase the importance of active listening, nonverbal communication, effective messaging, and overcoming communication barriers, ensuring that your audience gains valuable insights into this essential skill. Start crafting your personalized infographic today to become a more proficient and confident communicator.


6 diapositivas
Green Business Practice Implementation Presentation
Showcase your sustainability strategy with this Green Business Practice Implementation Presentation. Featuring a segmented lightbulb diagram, this slide is ideal for outlining eco-friendly initiatives, sustainable development goals, or ESG compliance efforts. Perfect for corporate sustainability reports or green business planning. Fully compatible with PowerPoint, Keynote, and Google Slides.


20 diapositivas
Egeria Artist Portfolio Presentation
Showcase your artistry with this vibrant portfolio template, featuring sections for project displays, creative process, awards, and testimonials. Perfect for artists seeking a polished presentation of their work. Customizable and suitable for PowerPoint, Keynote, and Google Slides, this template highlights your unique style and professional journey.


4 diapositivas
Points-Based Membership Program Strategy Presentation
Communicate your rewards system with clarity using the Points-Based Membership Program Strategy presentation. This visual template is ideal for outlining tiered rewards, point accumulation methods, and redemption mechanics through a clean, card-themed layout. Perfect for loyalty teams, marketing strategists, and membership programs. Fully editable in PowerPoint, Keynote, and Google Slides.


8 diapositivas
3-Layered Circular Logic Presentation
Visualize layered processes with this 3-step circular logic diagram. Perfect for illustrating progressive systems, tiered strategies, or interrelated components. Each ring represents a distinct phase, complete with editable icons and text. Compatible with PowerPoint, Keynote, and Google Slides—ideal for business models, strategic frameworks, or simplified logic breakdowns.