


Características


¿Tienes alguna pregunta?
Recomendar


21 diapositivas
Ember Echo Graphic Design Project Plan Presentation
The Ember Graphic Design Project Plan template is the perfect canvas for your creative journey! Kickstart your project with a sleek and professional introduction that sets the tone for your design vision. This template is designed to guide you through every step of the design process, from the initial brief to the final presentation. Highlight your target audience, concept development, and design elements with beautifully crafted slides that capture the essence of your project. Dive into the specifics with dedicated sections for brand identity components, textures, and the design process itself, ensuring that every detail is covered. The template also includes mood boards, prototypes, and design assets, making it easy to showcase your work in progress. With feedback and testing slides, you can iterate and refine your designs before presenting the final product. This template is fully compatible with PowerPoint, Keynote, and Google Slides, making it versatile and easy to use for any creative project.


6 diapositivas
Hospital Management System Presentation
Bring structure and efficiency to your healthcare operations with this professional presentation. Designed to simplify complex hospital workflows, it helps visualize patient management, service coordination, and system processes with clarity. Ideal for administrators and consultants, it’s fully editable and compatible with PowerPoint, Keynote, and Google Slides for seamless customization.


6 diapositivas
Closing Summary and Key Takeaway Presentation
End your presentation with clarity using this Closing Summary and Key Takeaways Presentation. The segmented half-circle design helps you highlight up to 5 final messages or calls to action. Each section is color-coded for visual emphasis and easy understanding. Ideal for wrap-up slides, final reflections, or summary overviews. Fully editable in PowerPoint, Keynote, Google Slides, and Canva.


10 diapositivas
Watercolor Ideas Infographic Presentation
A watercolor infographic is a type of visual graphic that uses watercolor illustrations and designs to convey information. The water colors add a touch of personality and creativity to the template design and can help capture the viewer's attention. Use this infographic to present data, explain a process, or showcase a product or service. This watercolor infographic is compatible with Powerpoint, Keynote and Google Slides. This unique and visually appealing template can be used for any kind of business or academic project. Just download, add your content and make a creative presentation!


8 diapositivas
Identifying and Addressing Business Problems Presentation
Break down challenges with clarity using this structured 4-step business problem-solving slide. Highlight each issue with its own icon, number, and explanation, making it easy to communicate obstacles and outline solutions. Ideal for team strategy meetings, leadership briefings, or client reports. Fully customizable in PowerPoint, Keynote, and Google Slides.


4 diapositivas
Healthcare Procedure and Diagnosis Presentation
Simplify medical communication with the Healthcare Procedure and Diagnosis Presentation. Featuring clean visuals like syringes, hearts, and med kits, this layout is ideal for outlining treatment stages, clinical processes, or patient care steps. Perfect for hospitals, clinics, or healthcare startups. Fully editable in PowerPoint, Keynote, Google Slides, and Canva.


13 diapositivas
Simple Sales Proposal Presentation
This proposal template provides a streamlined approach for presenting sales strategies and solutions. Starting with a visually striking cover slide, it sets the scene for an engaging pitch. The template meticulously organizes content from the initial problem identification to the presentation of real numbers that underscore the proposal's validity. Each section, from the elucidation of the problem to the detailed solutions and real-world case studies, is laid out for maximum impact and understanding. Personable touches are incorporated through the 'Meet Our Team' segment, bolstering the proposal with credibility. The template culminates with a strong call to action, urging the audience to seize the collaborative opportunity, and is rounded off with a polite 'Thank You' to leave a lasting impression. This template is a boon for sales professionals seeking to communicate their value proposition with clarity and persuasiveness.


20 diapositivas
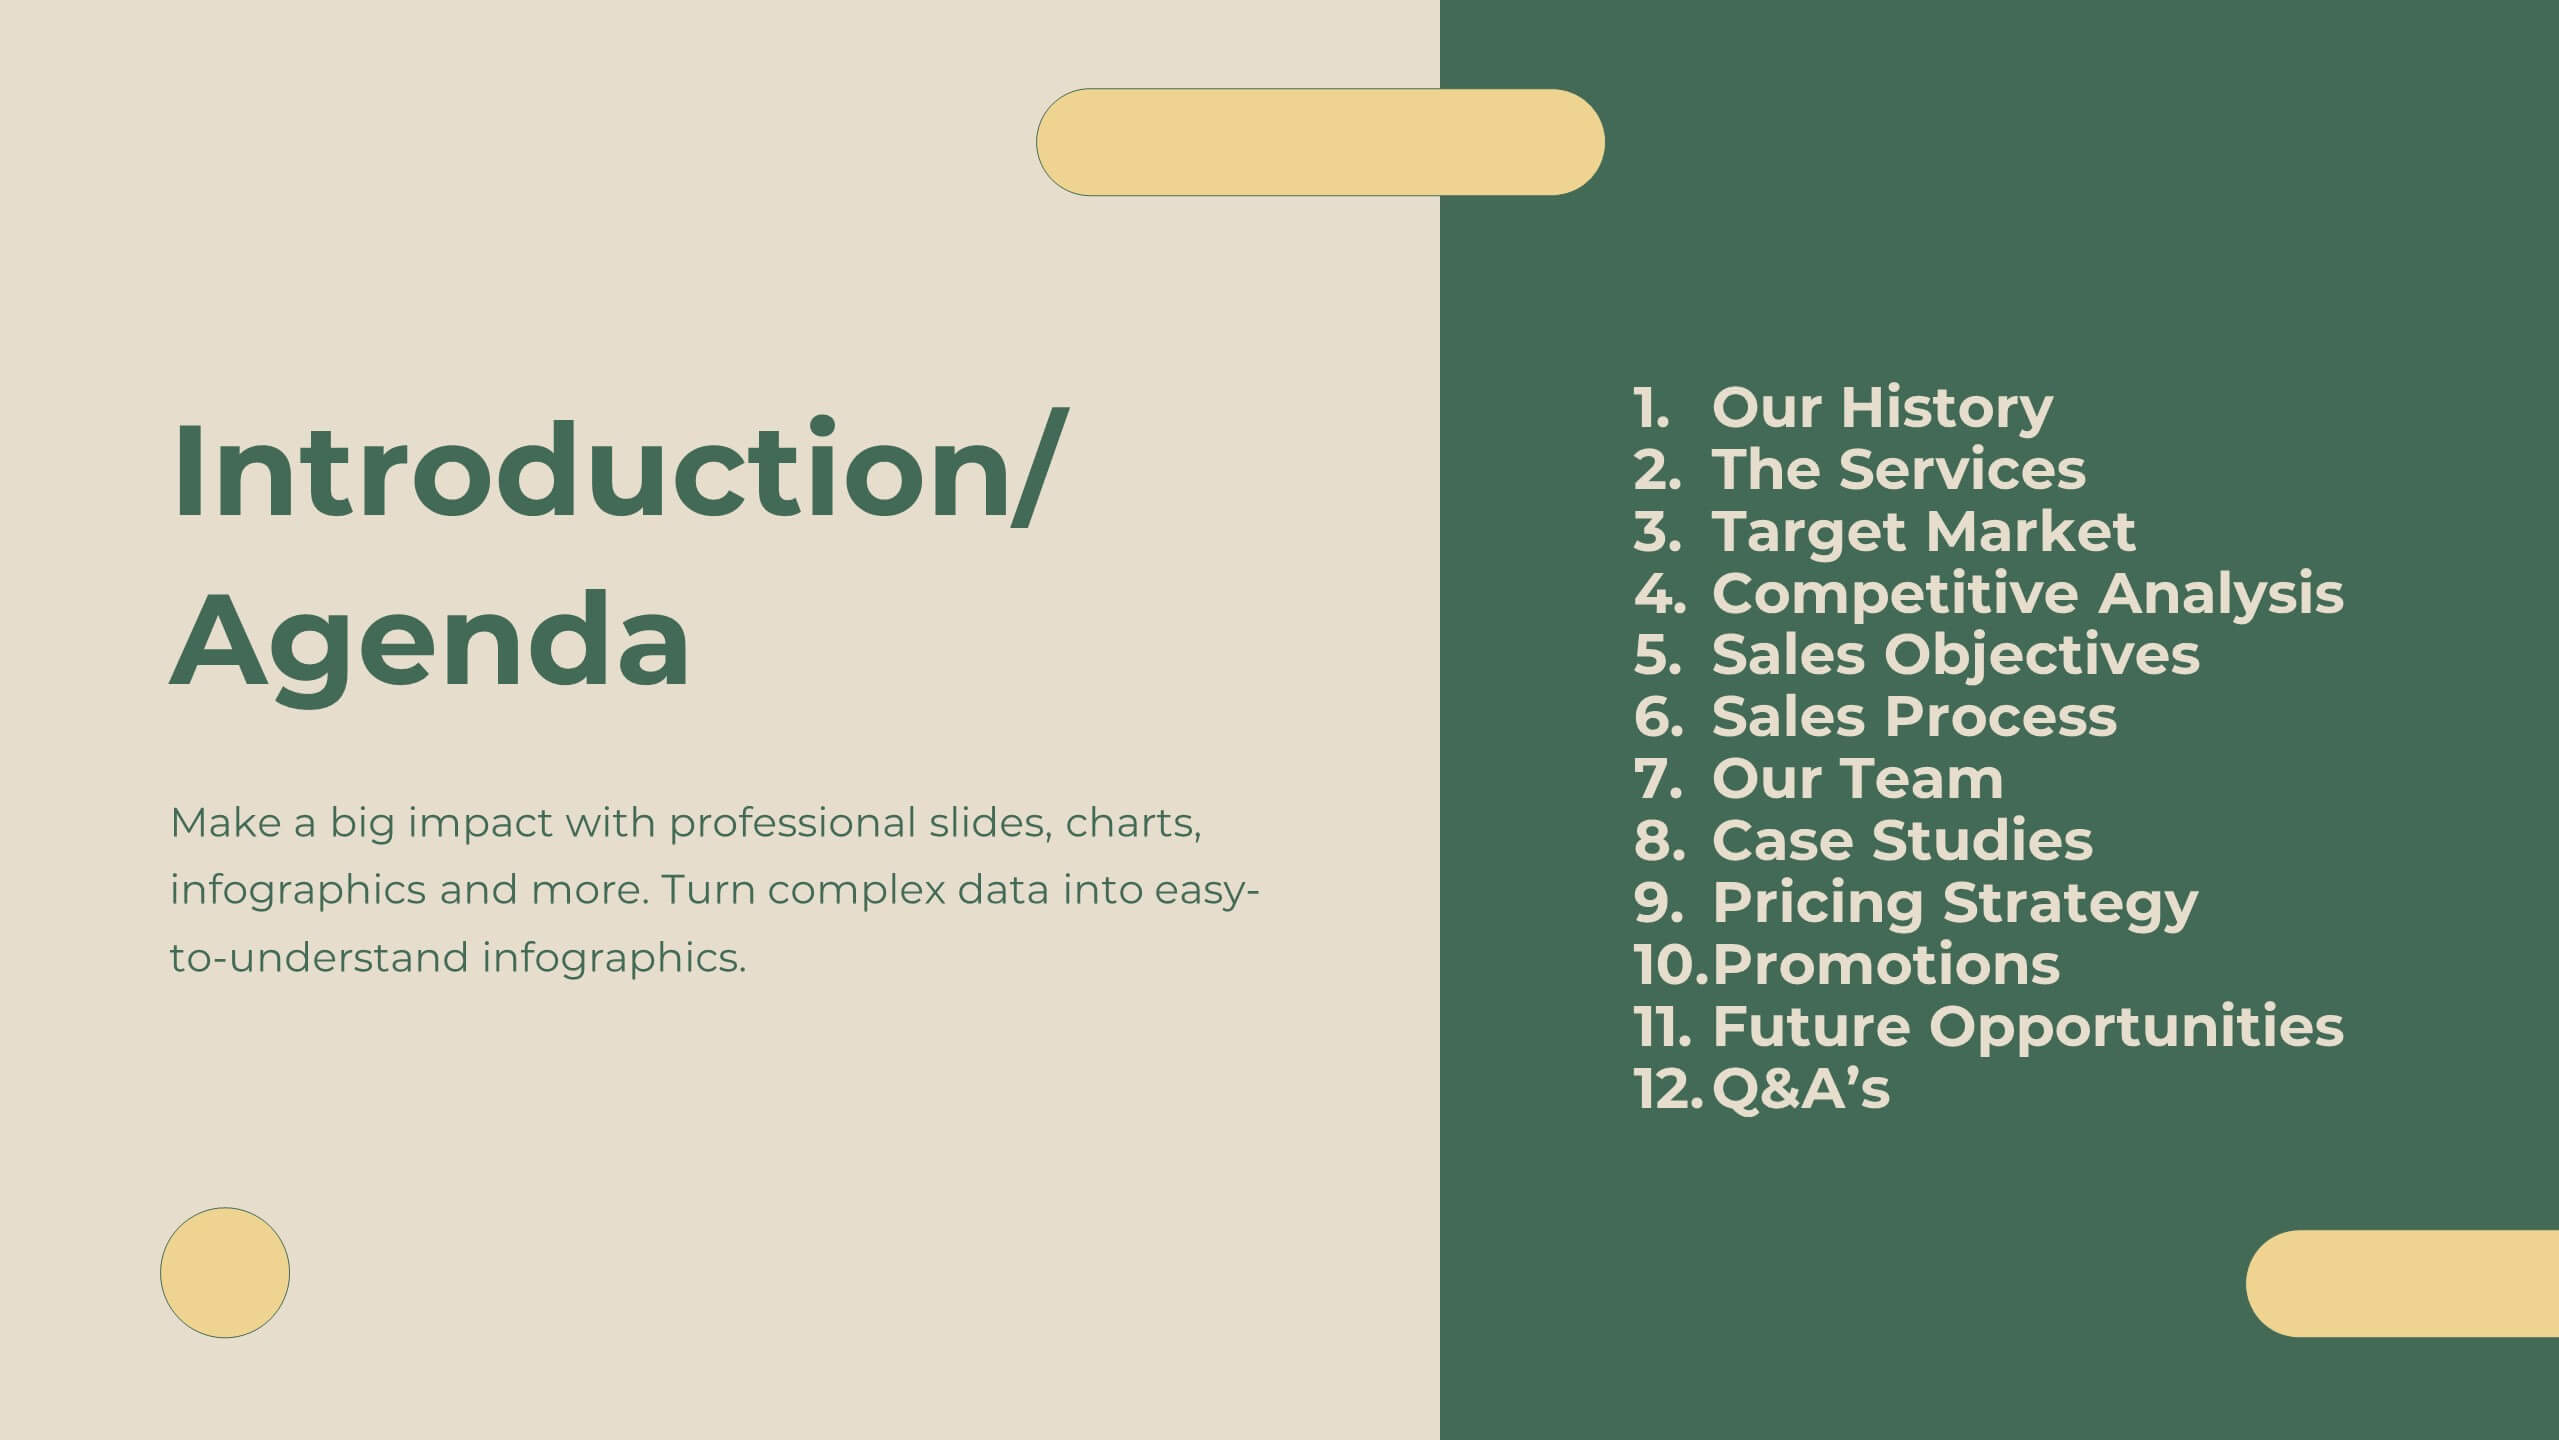
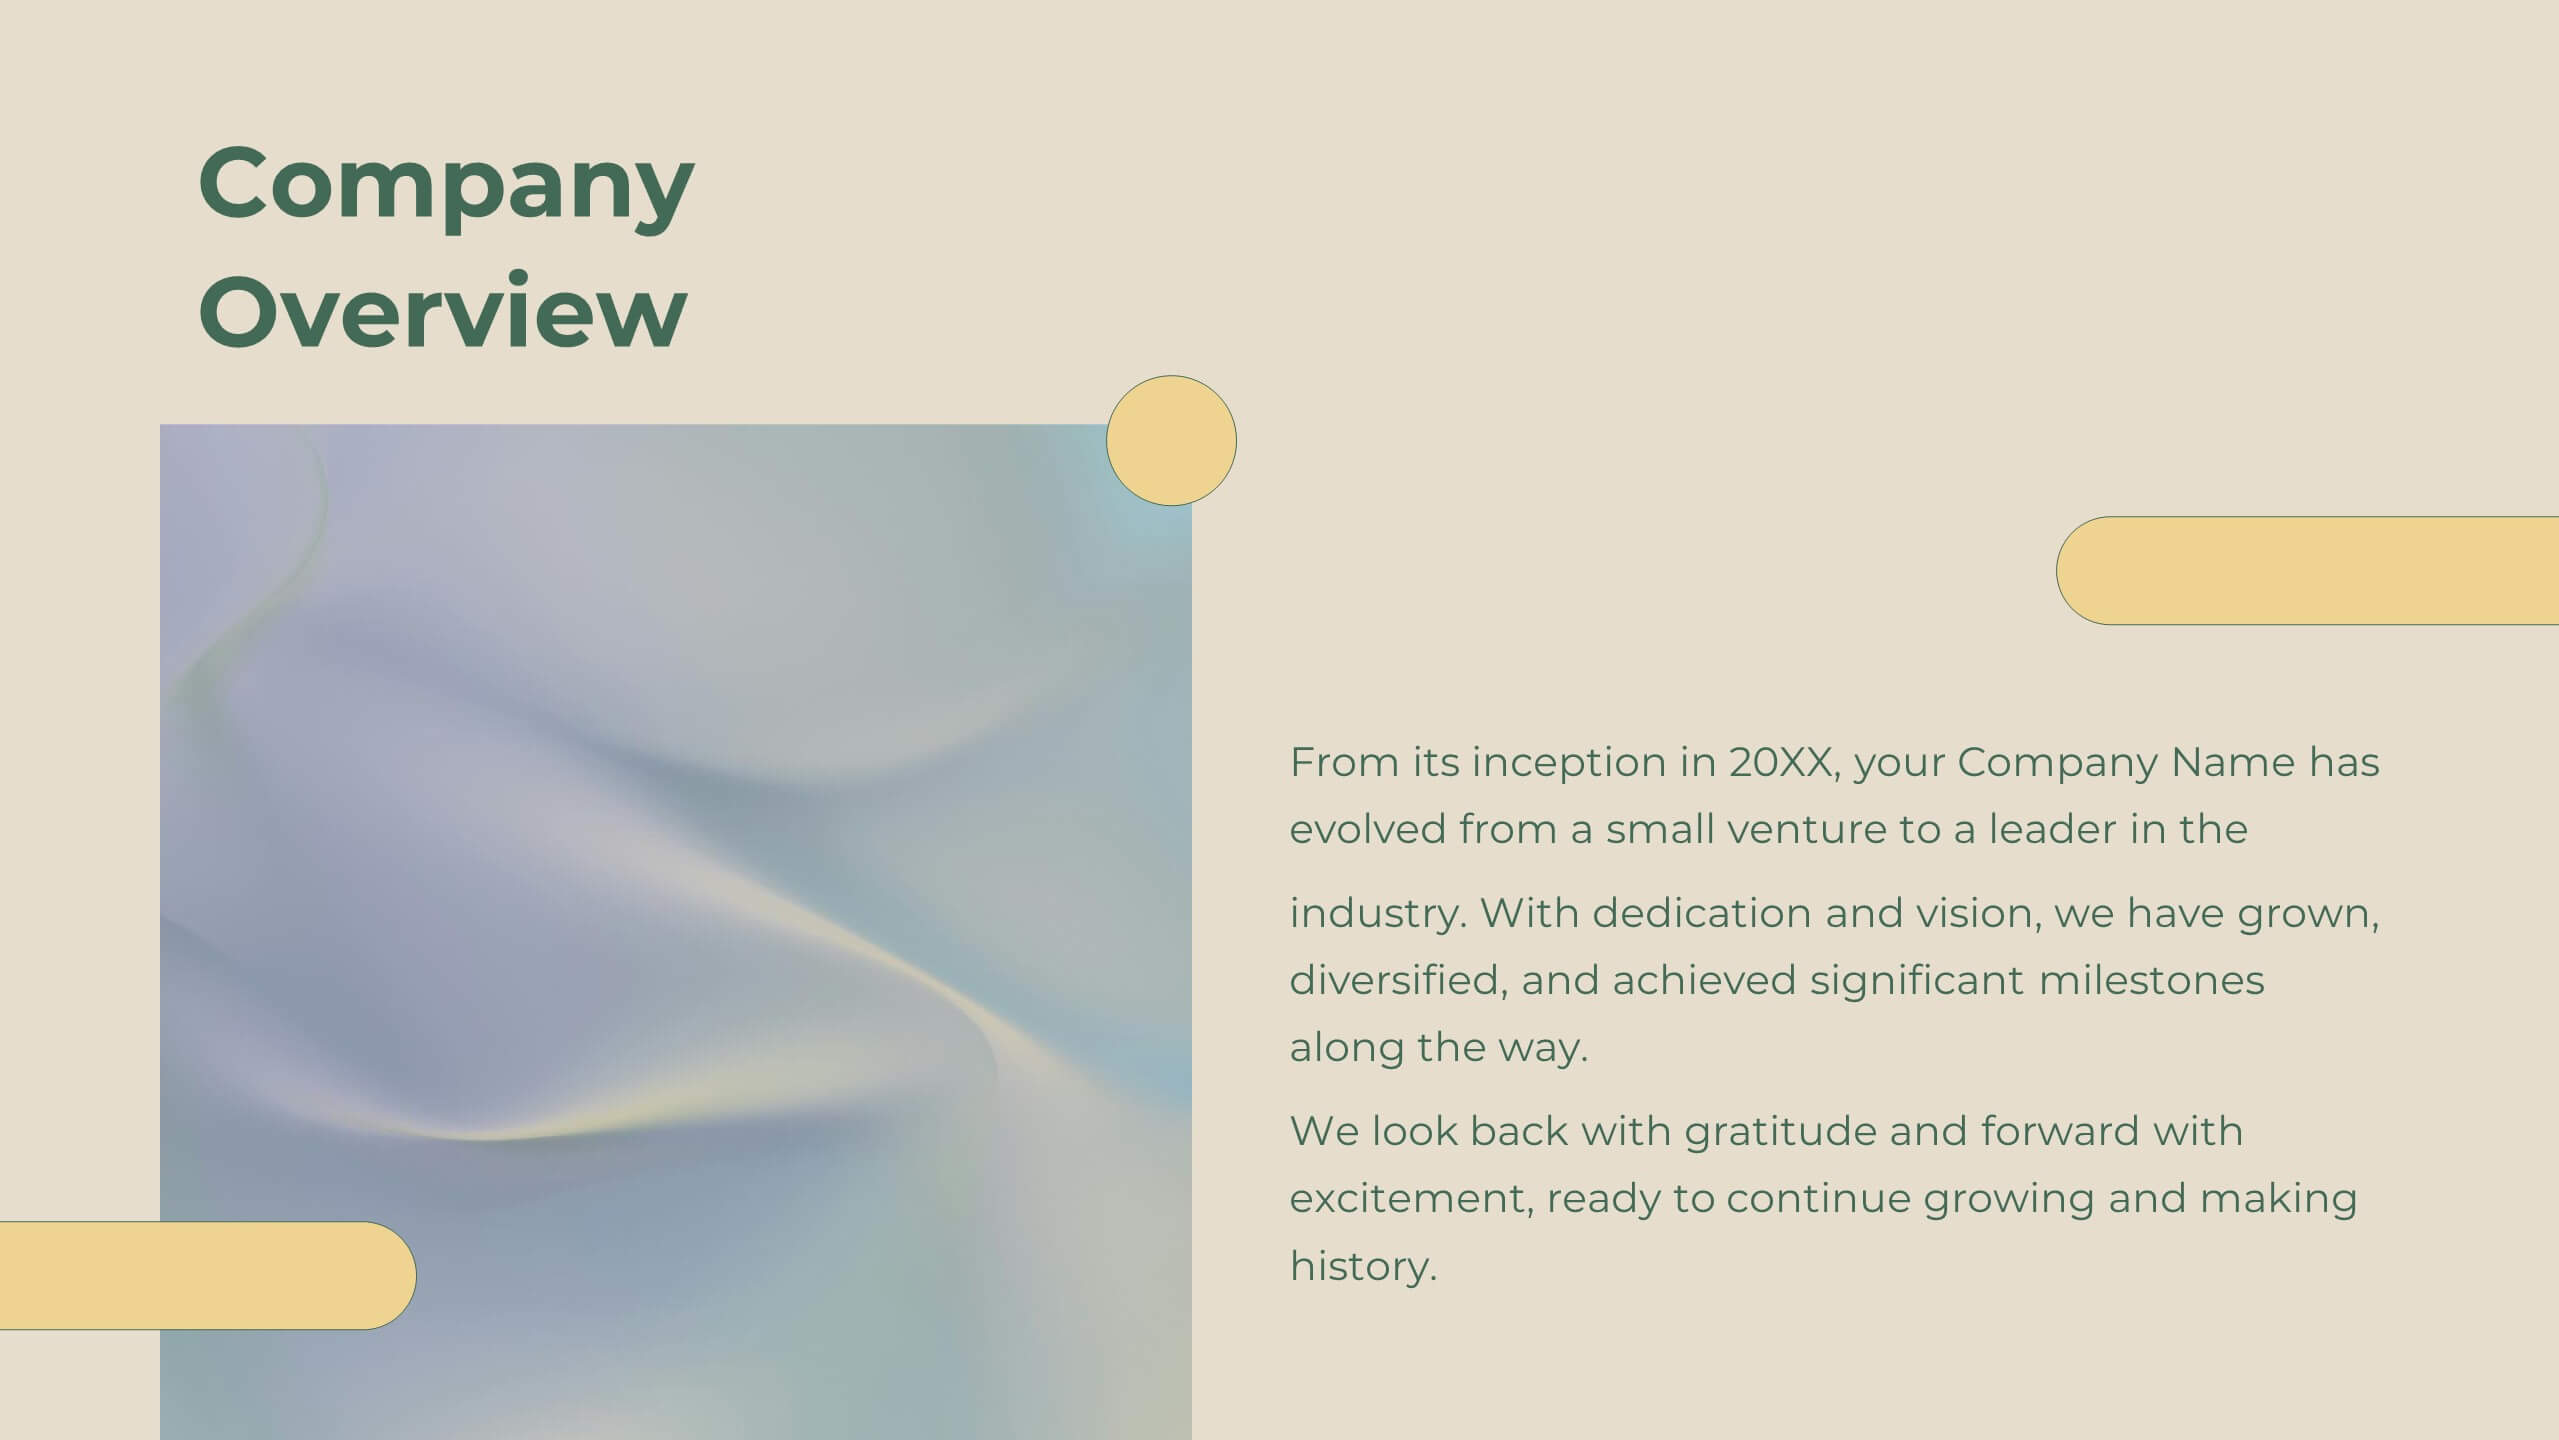
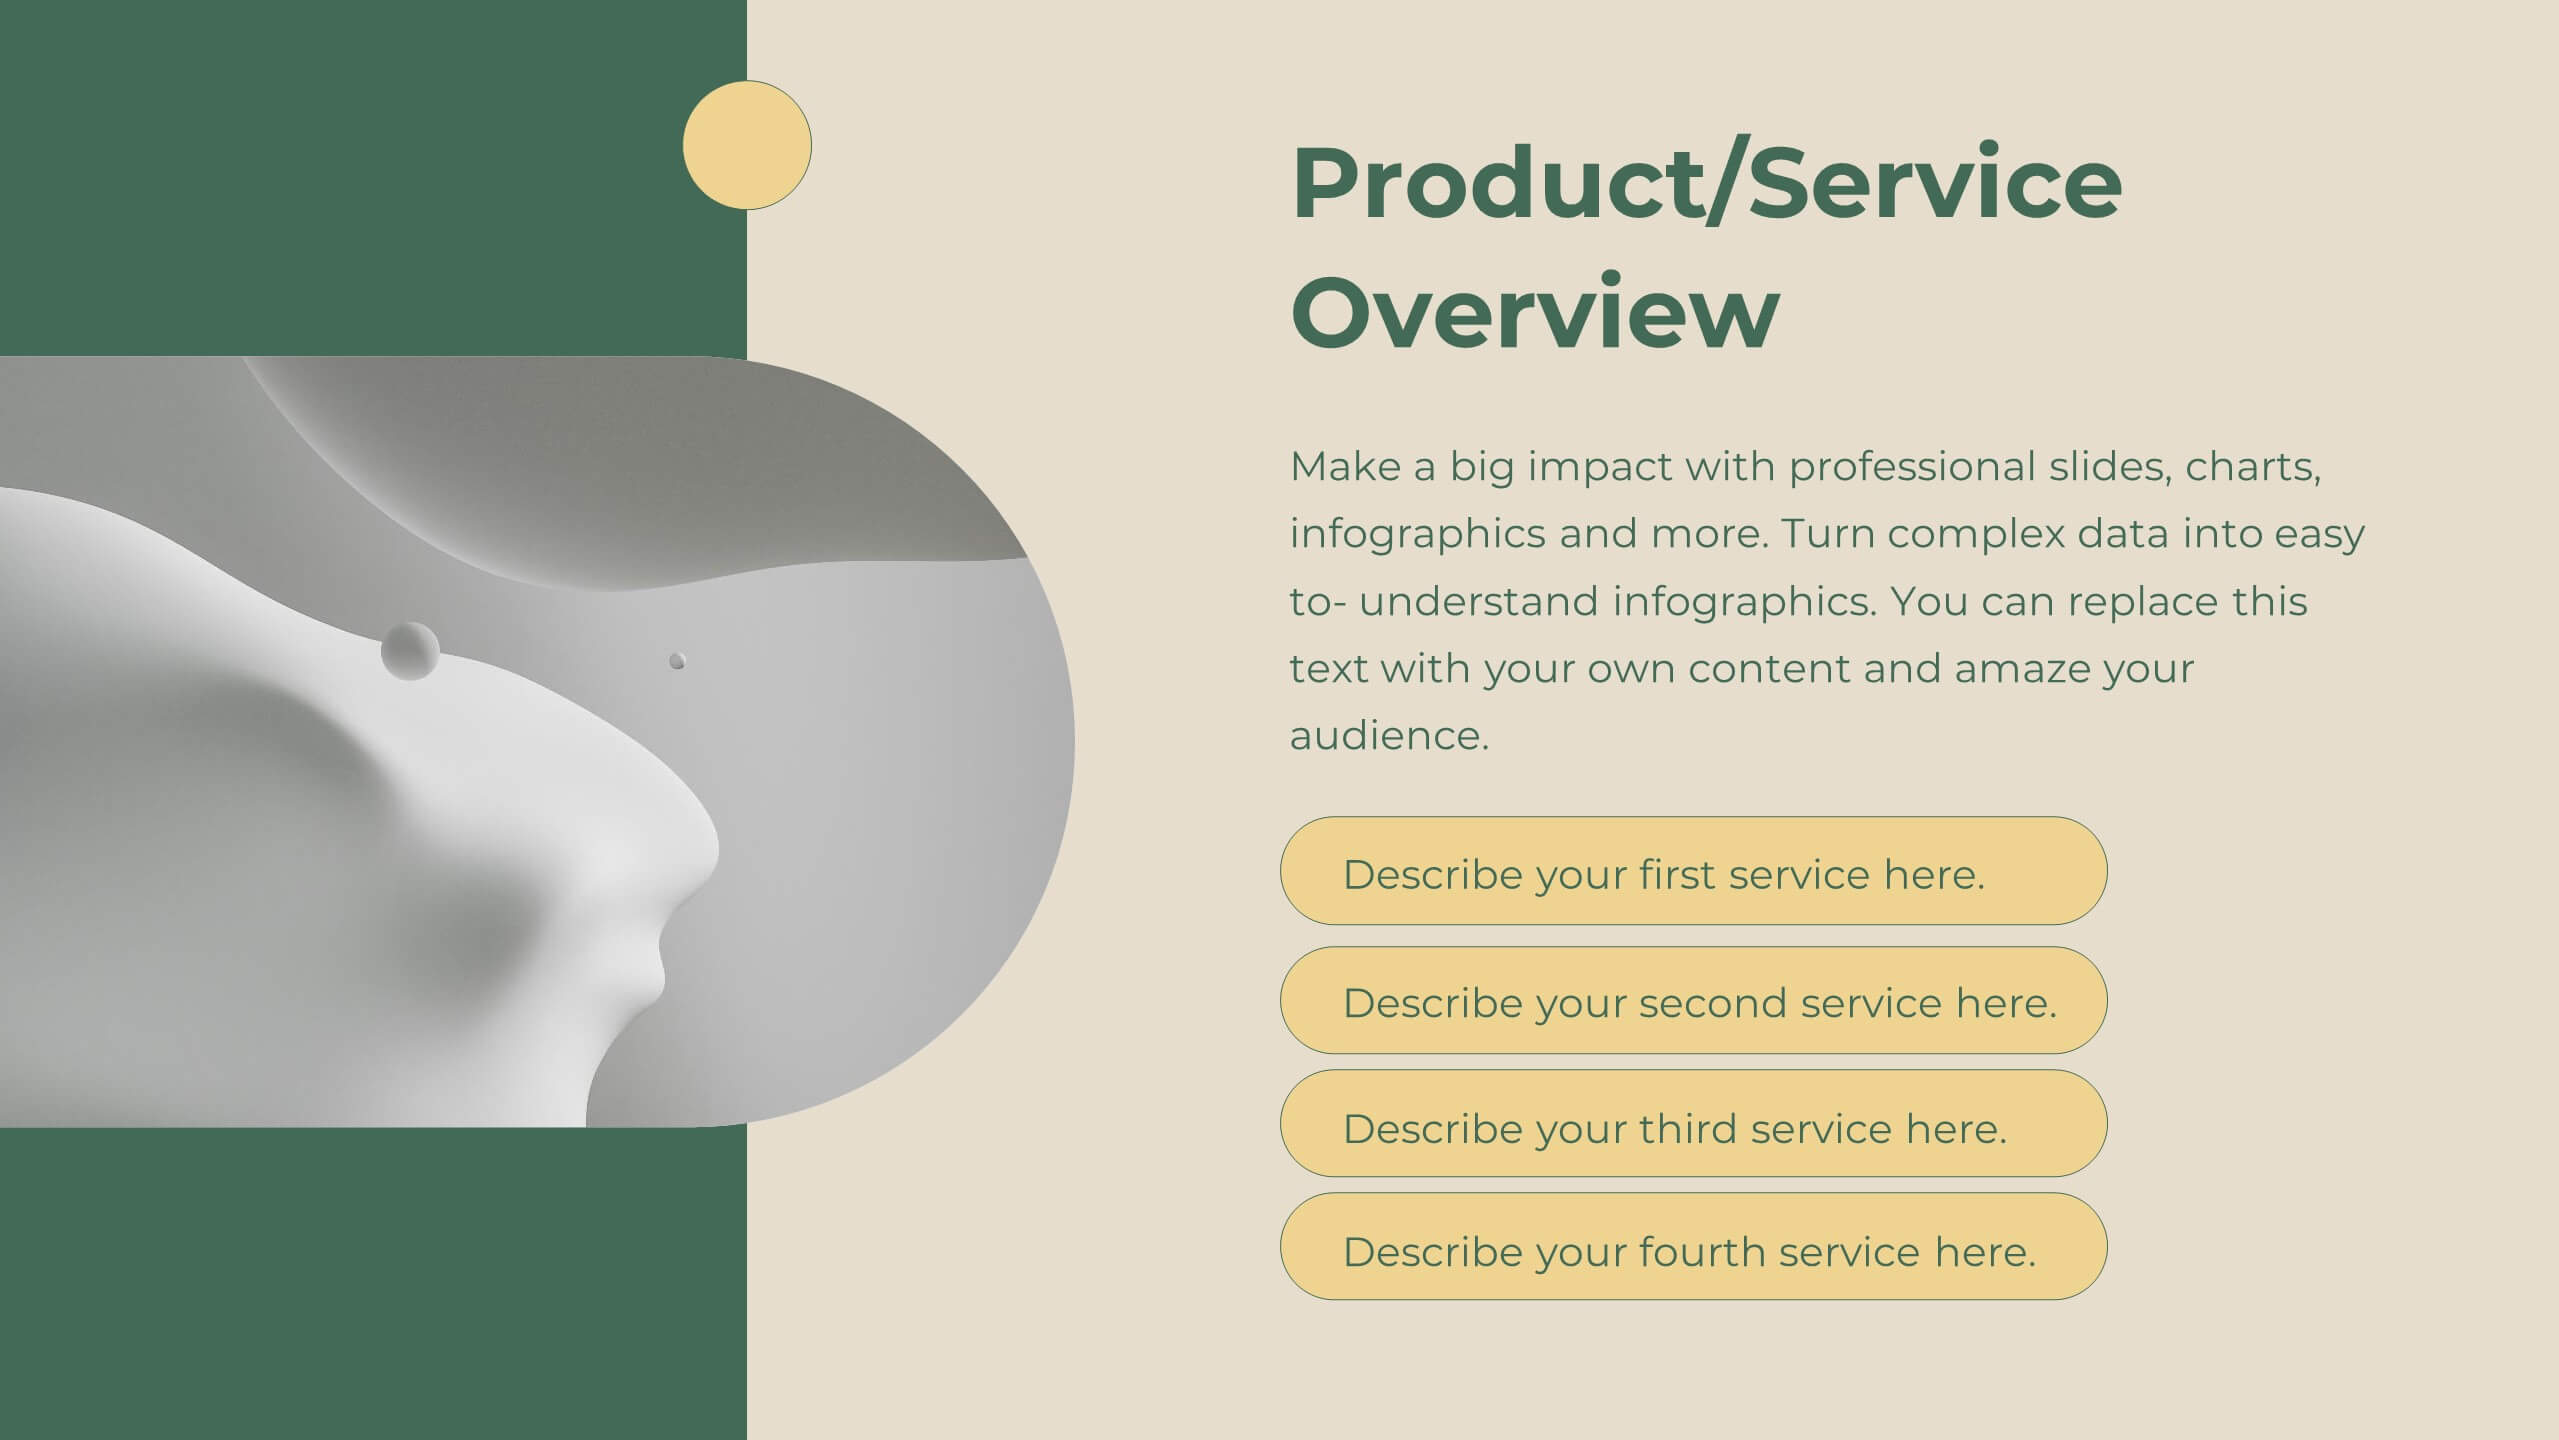
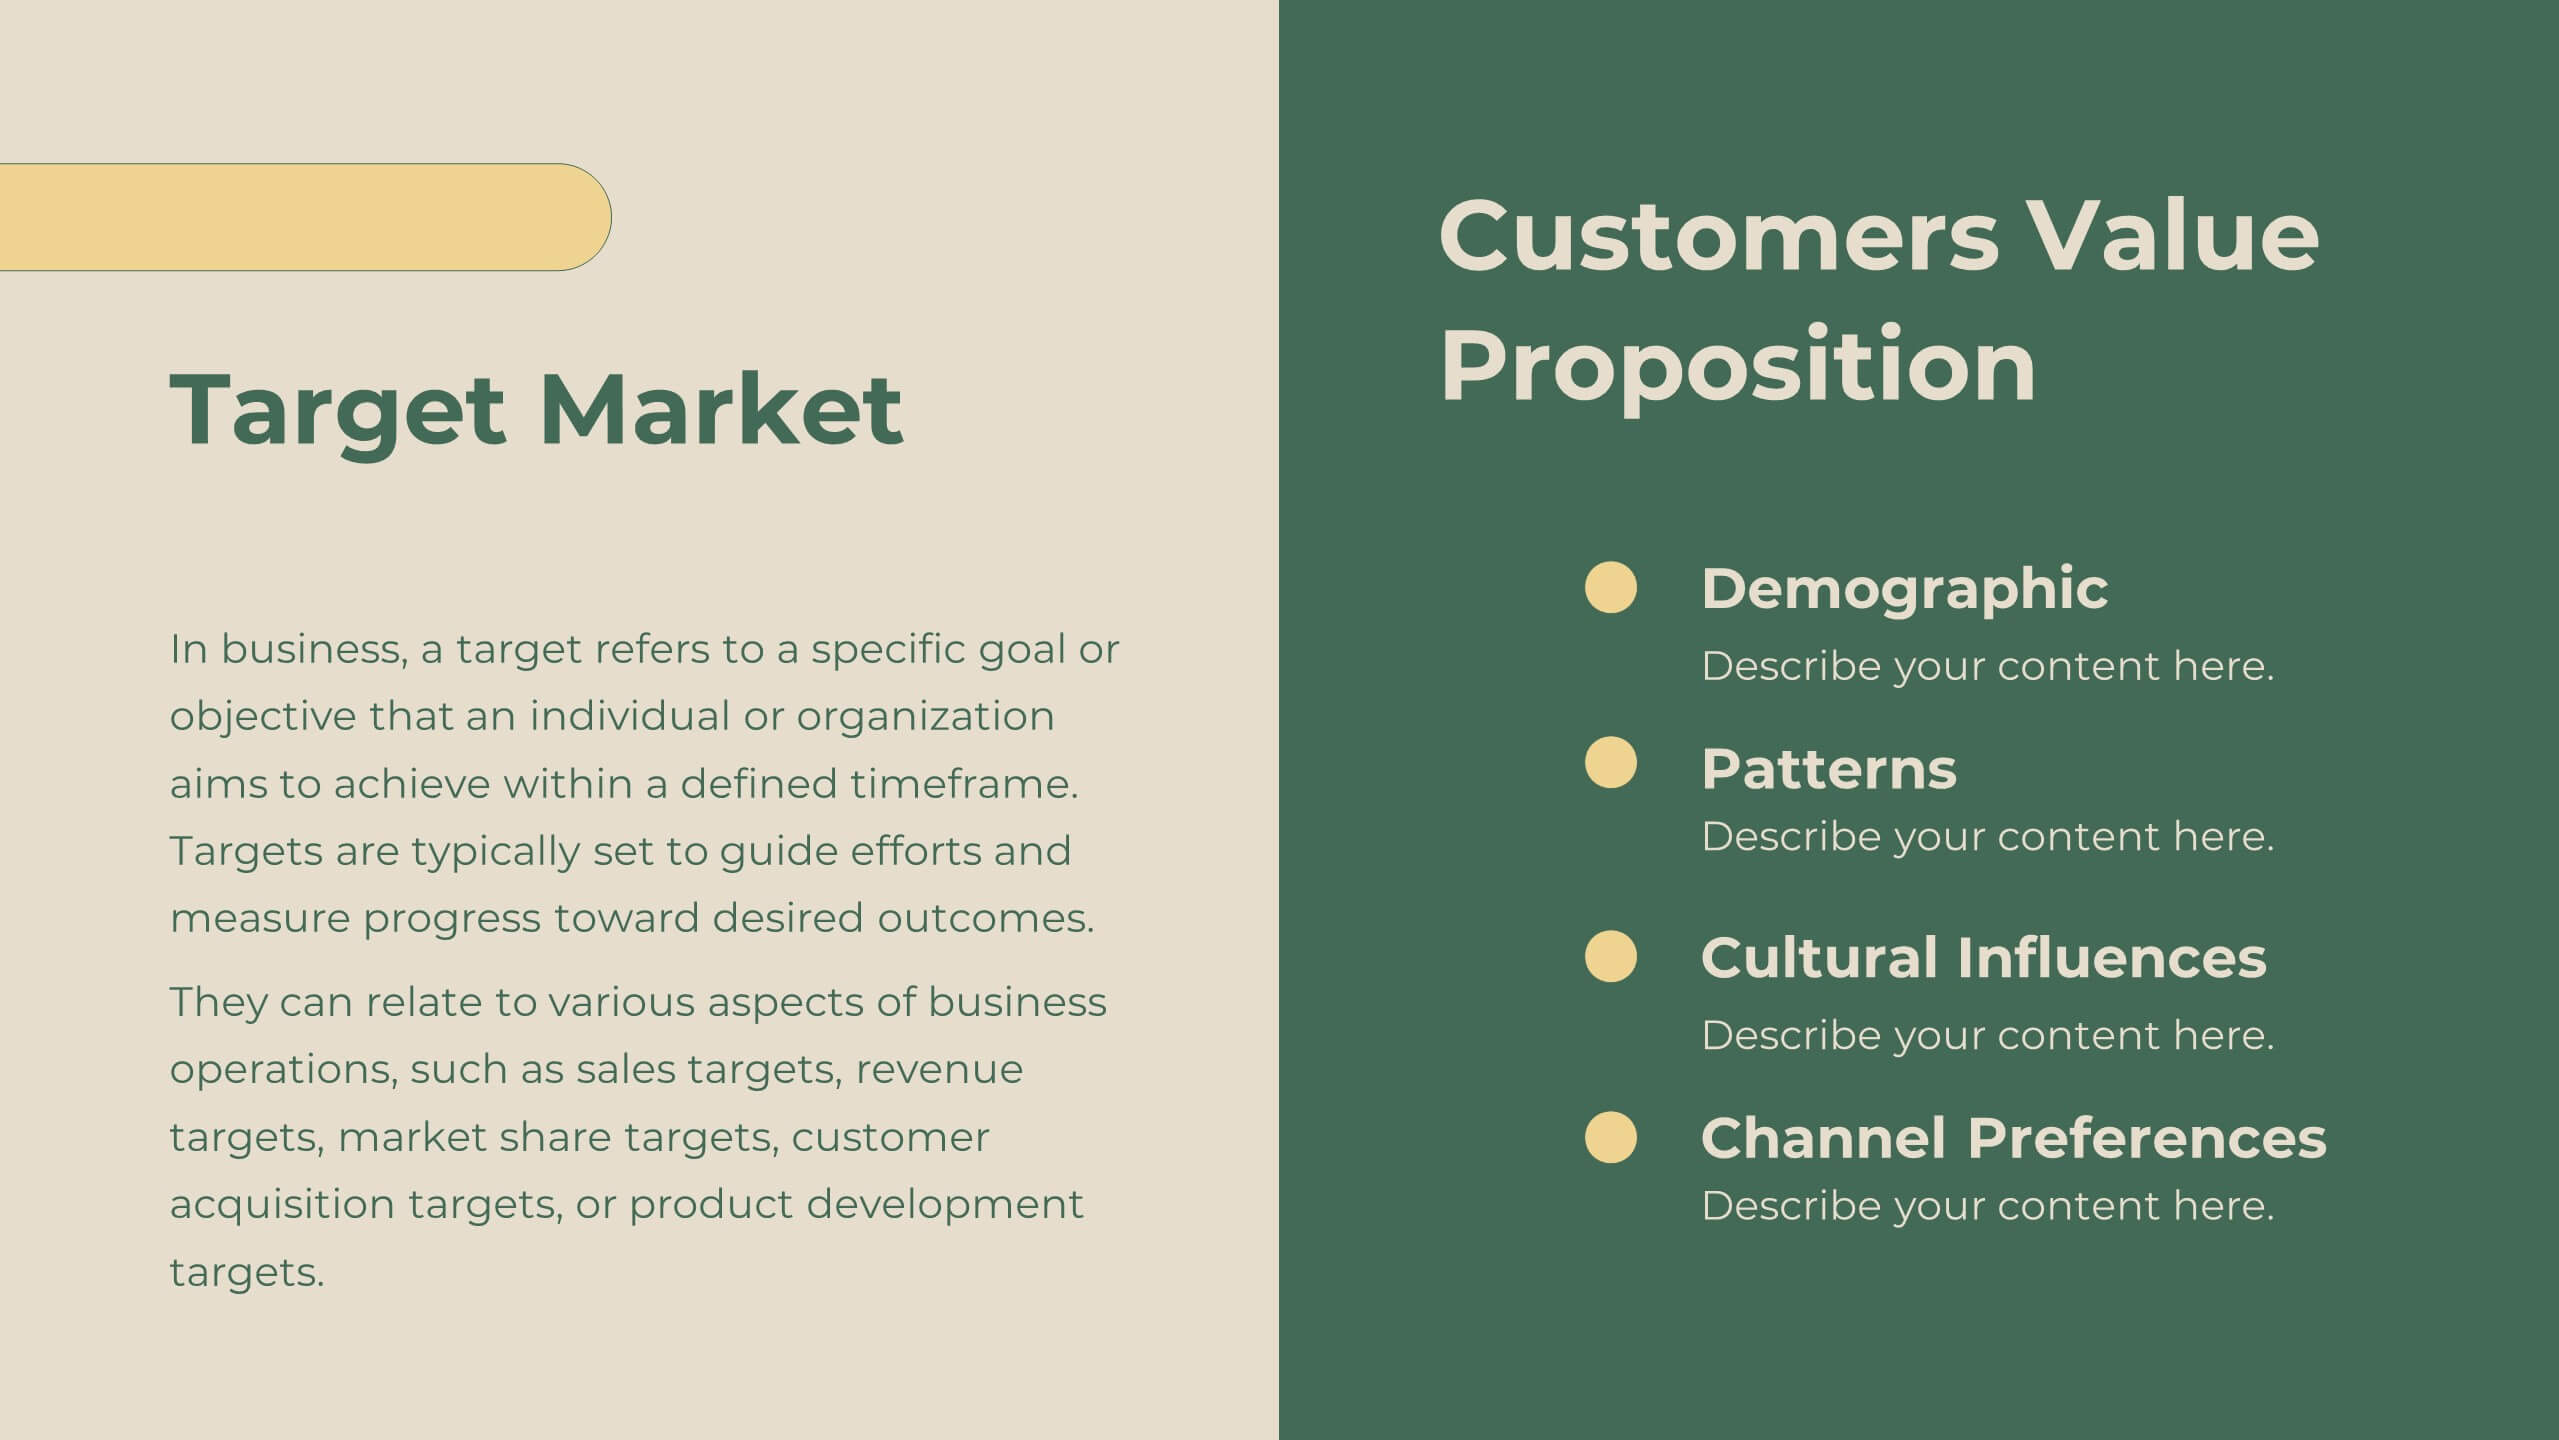
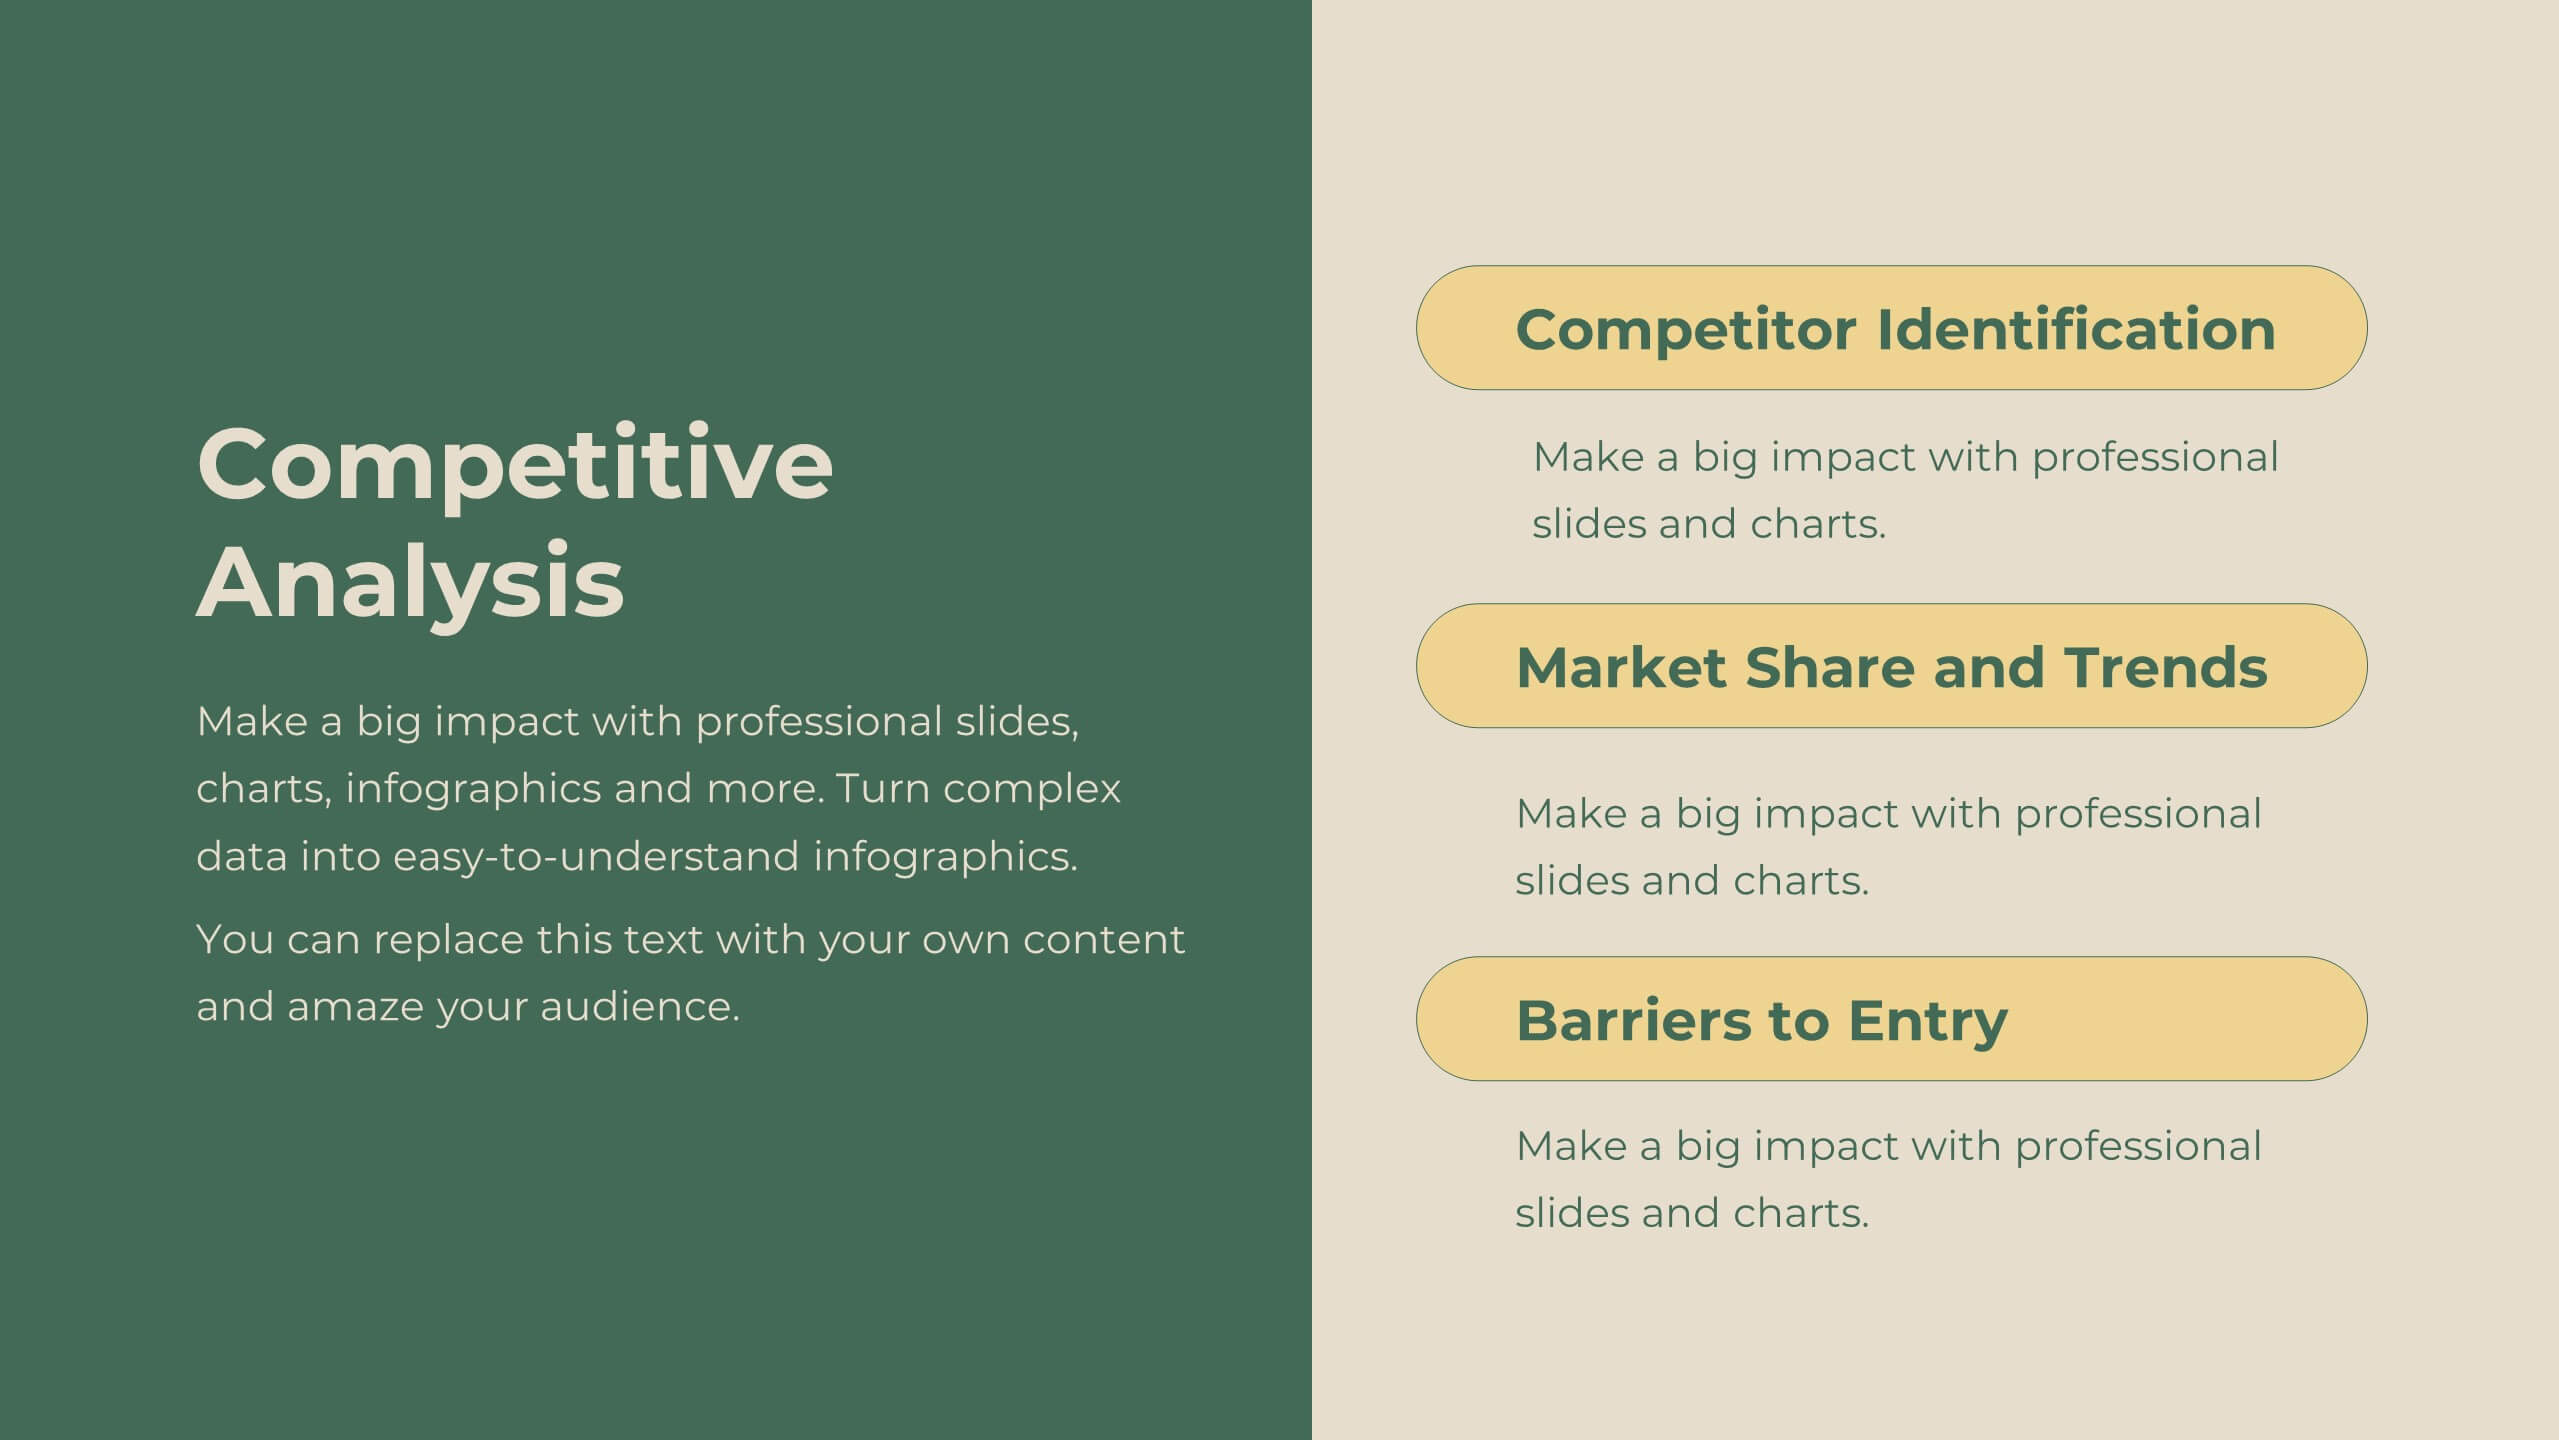
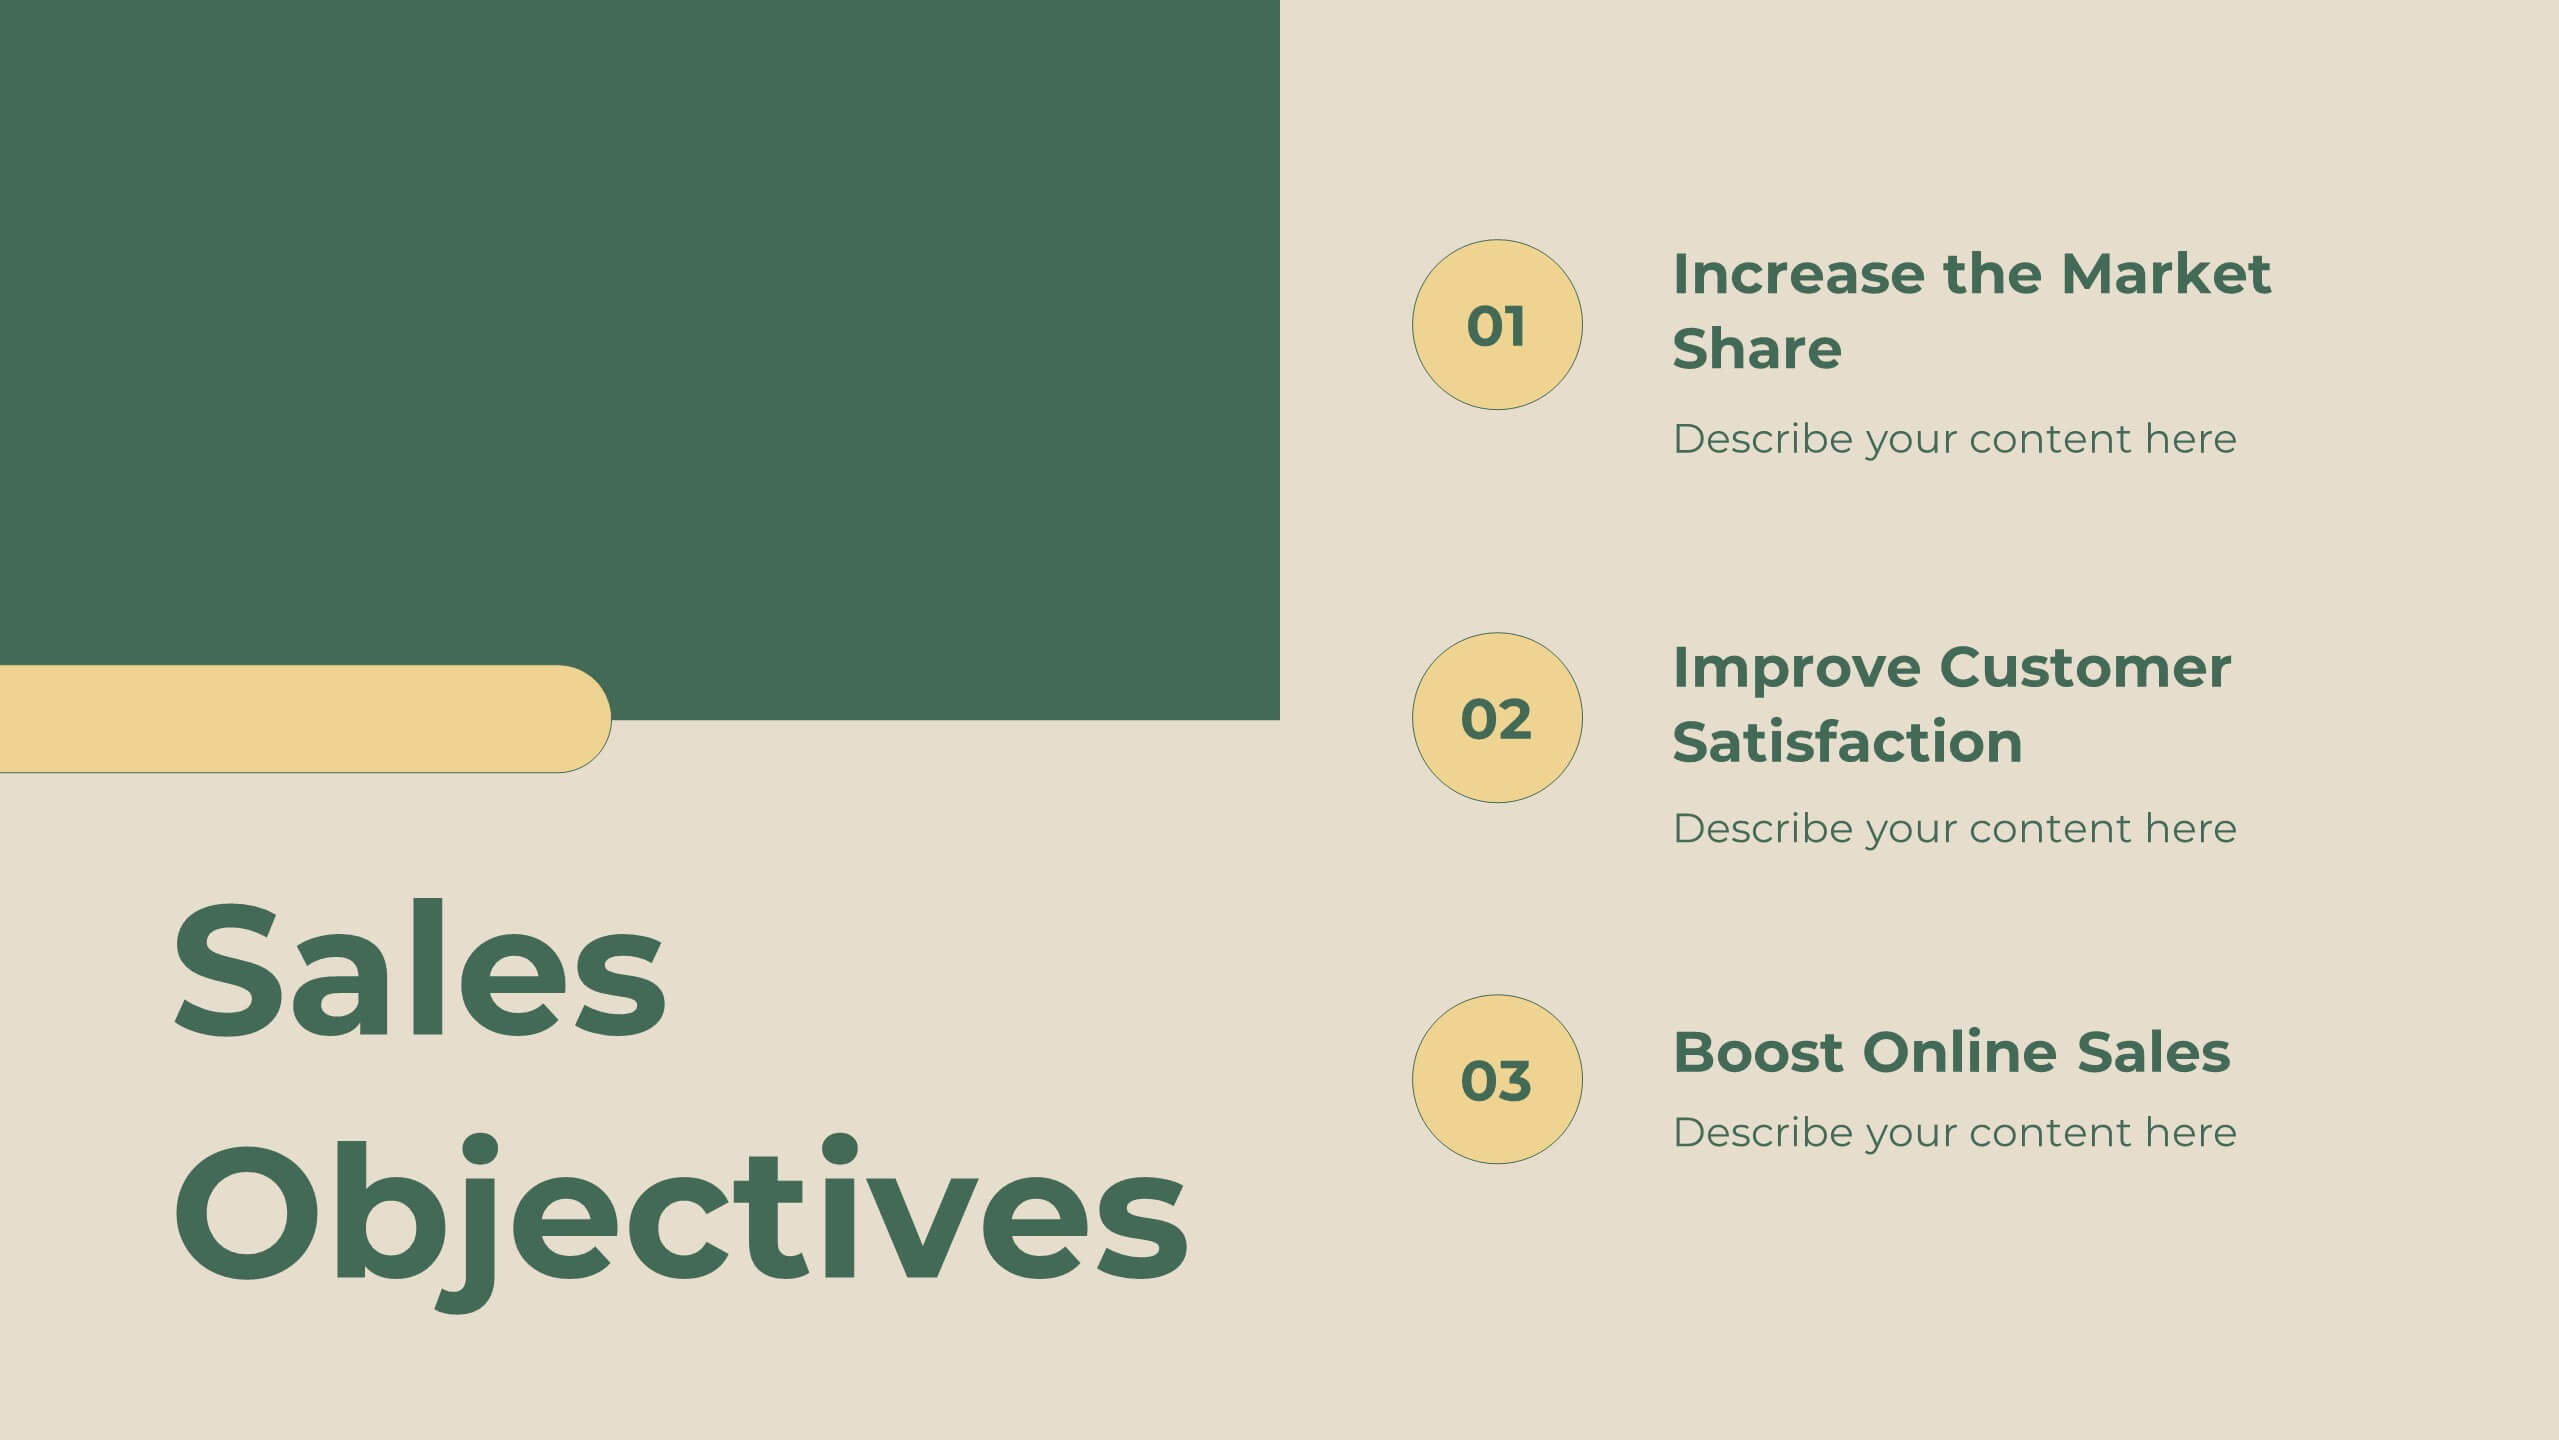
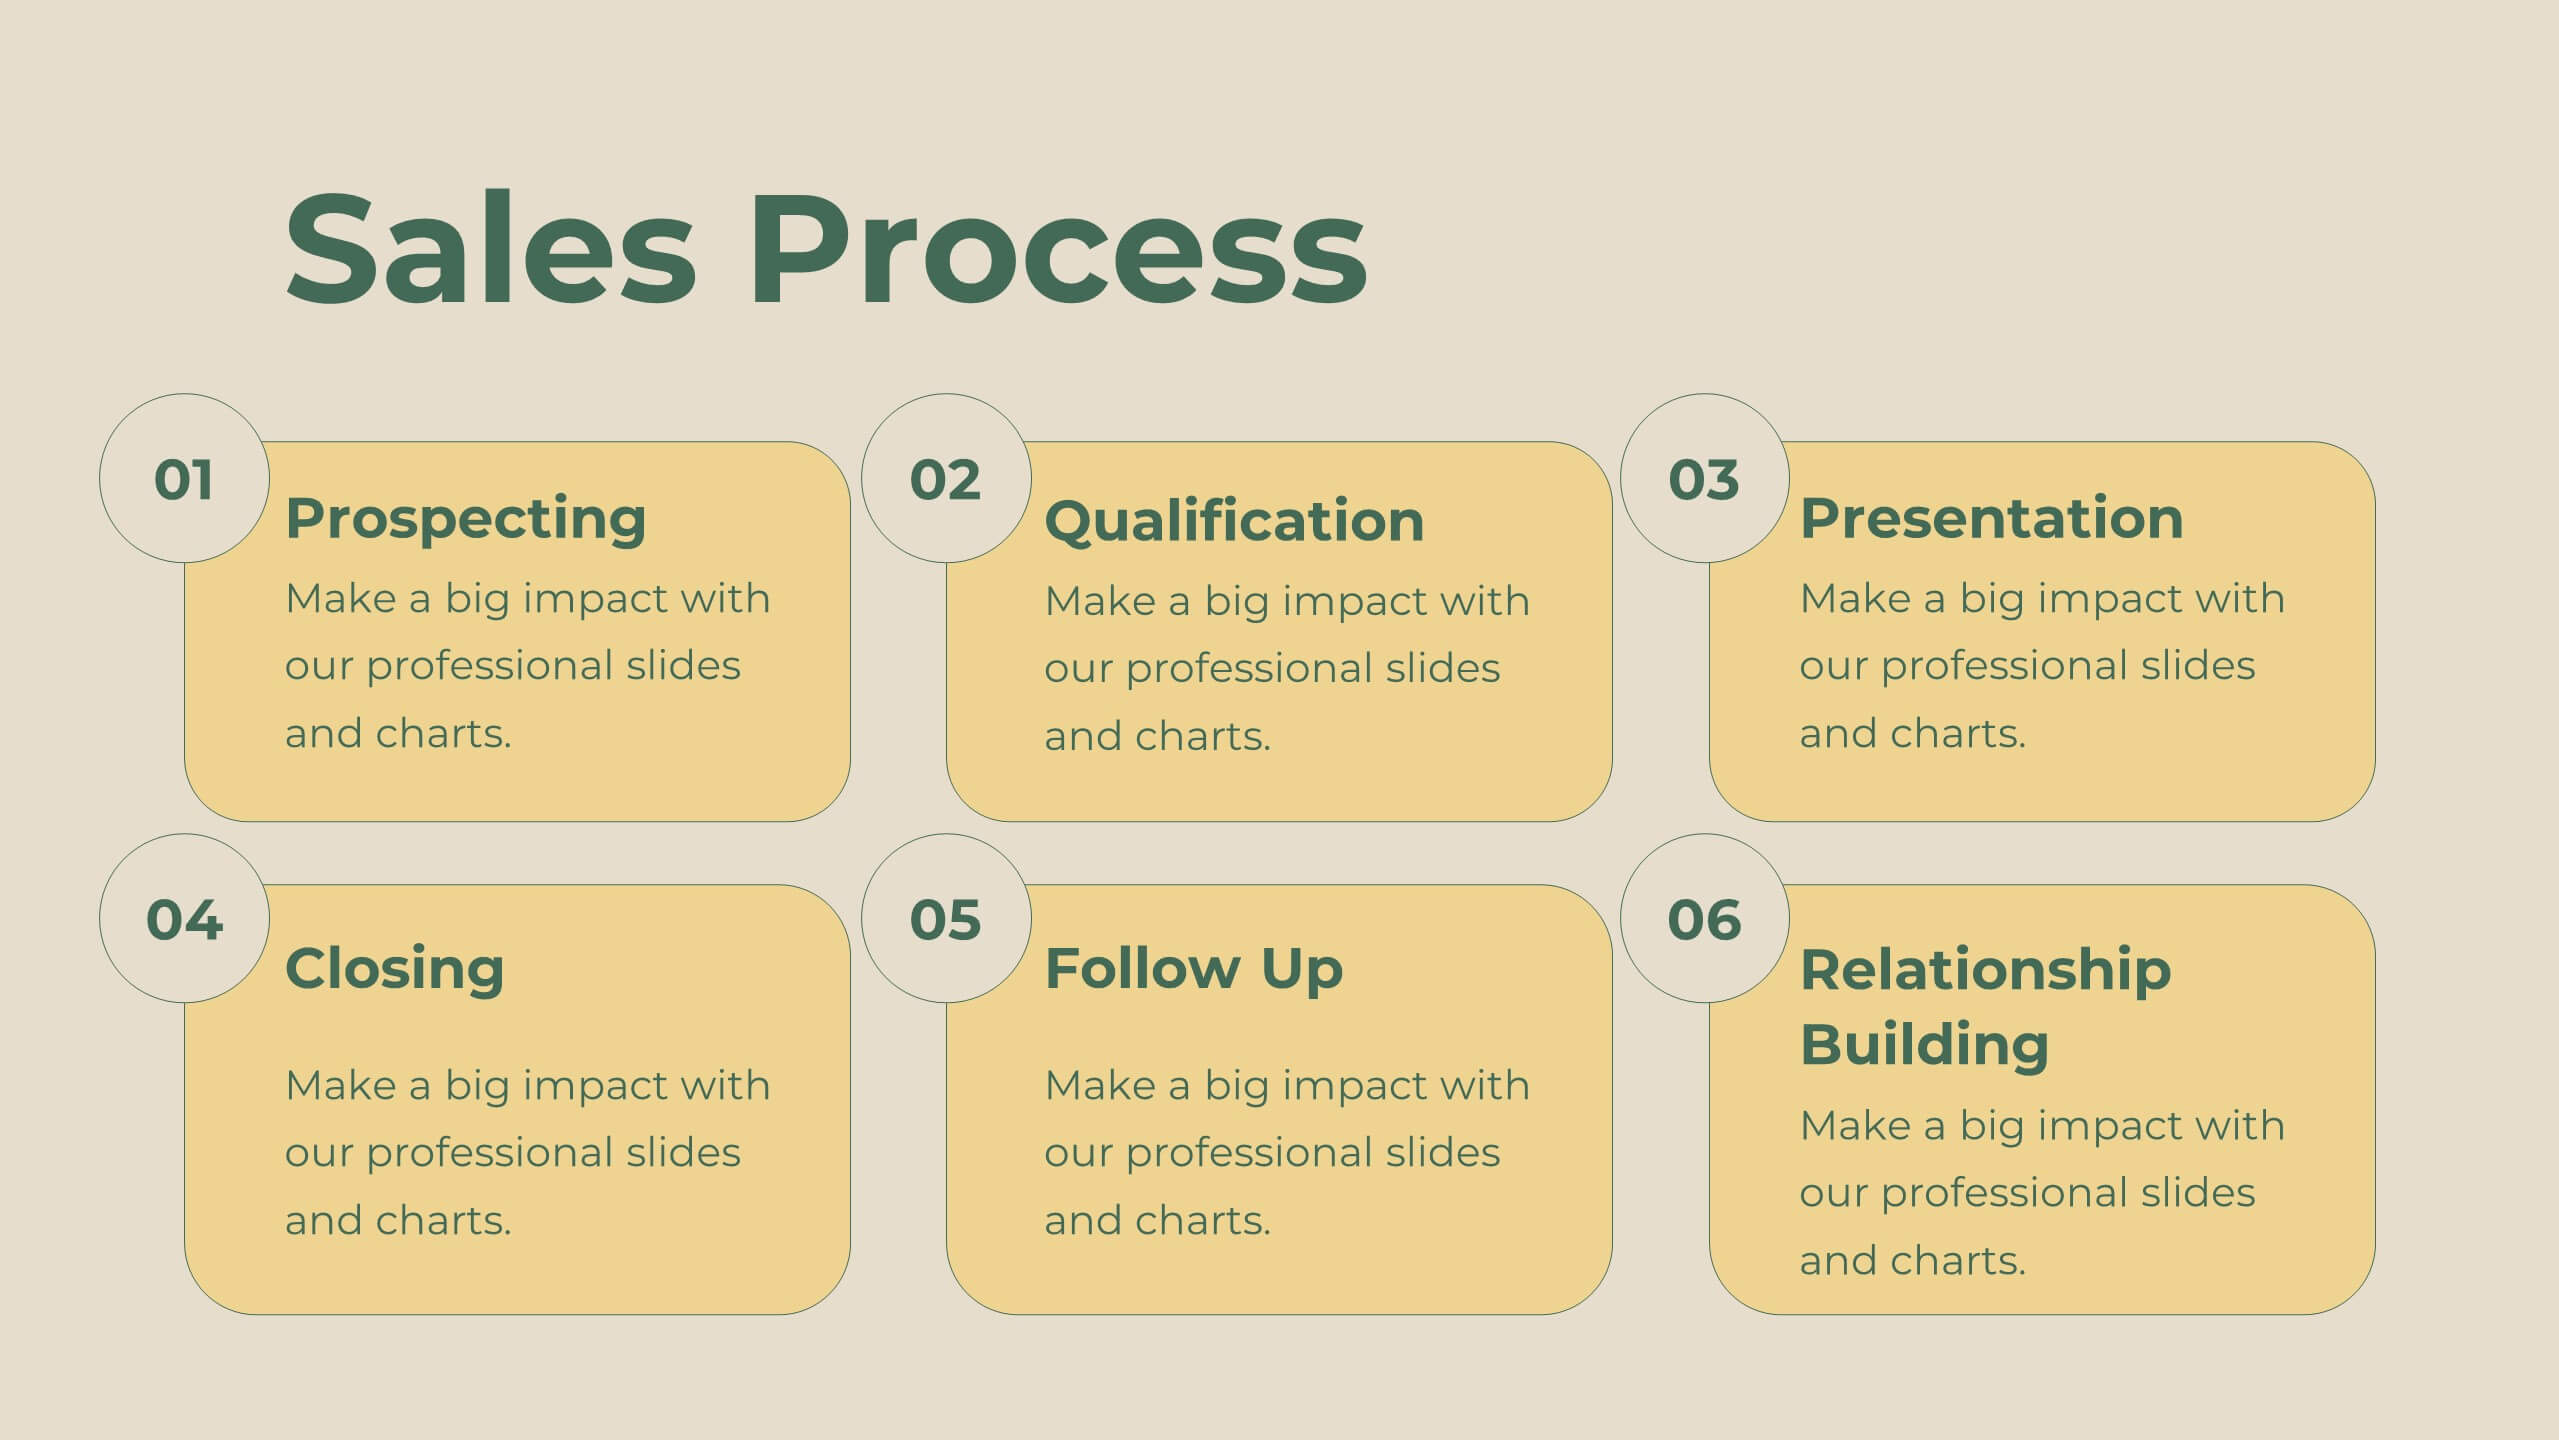
Legacy Sales Strategy Presentation
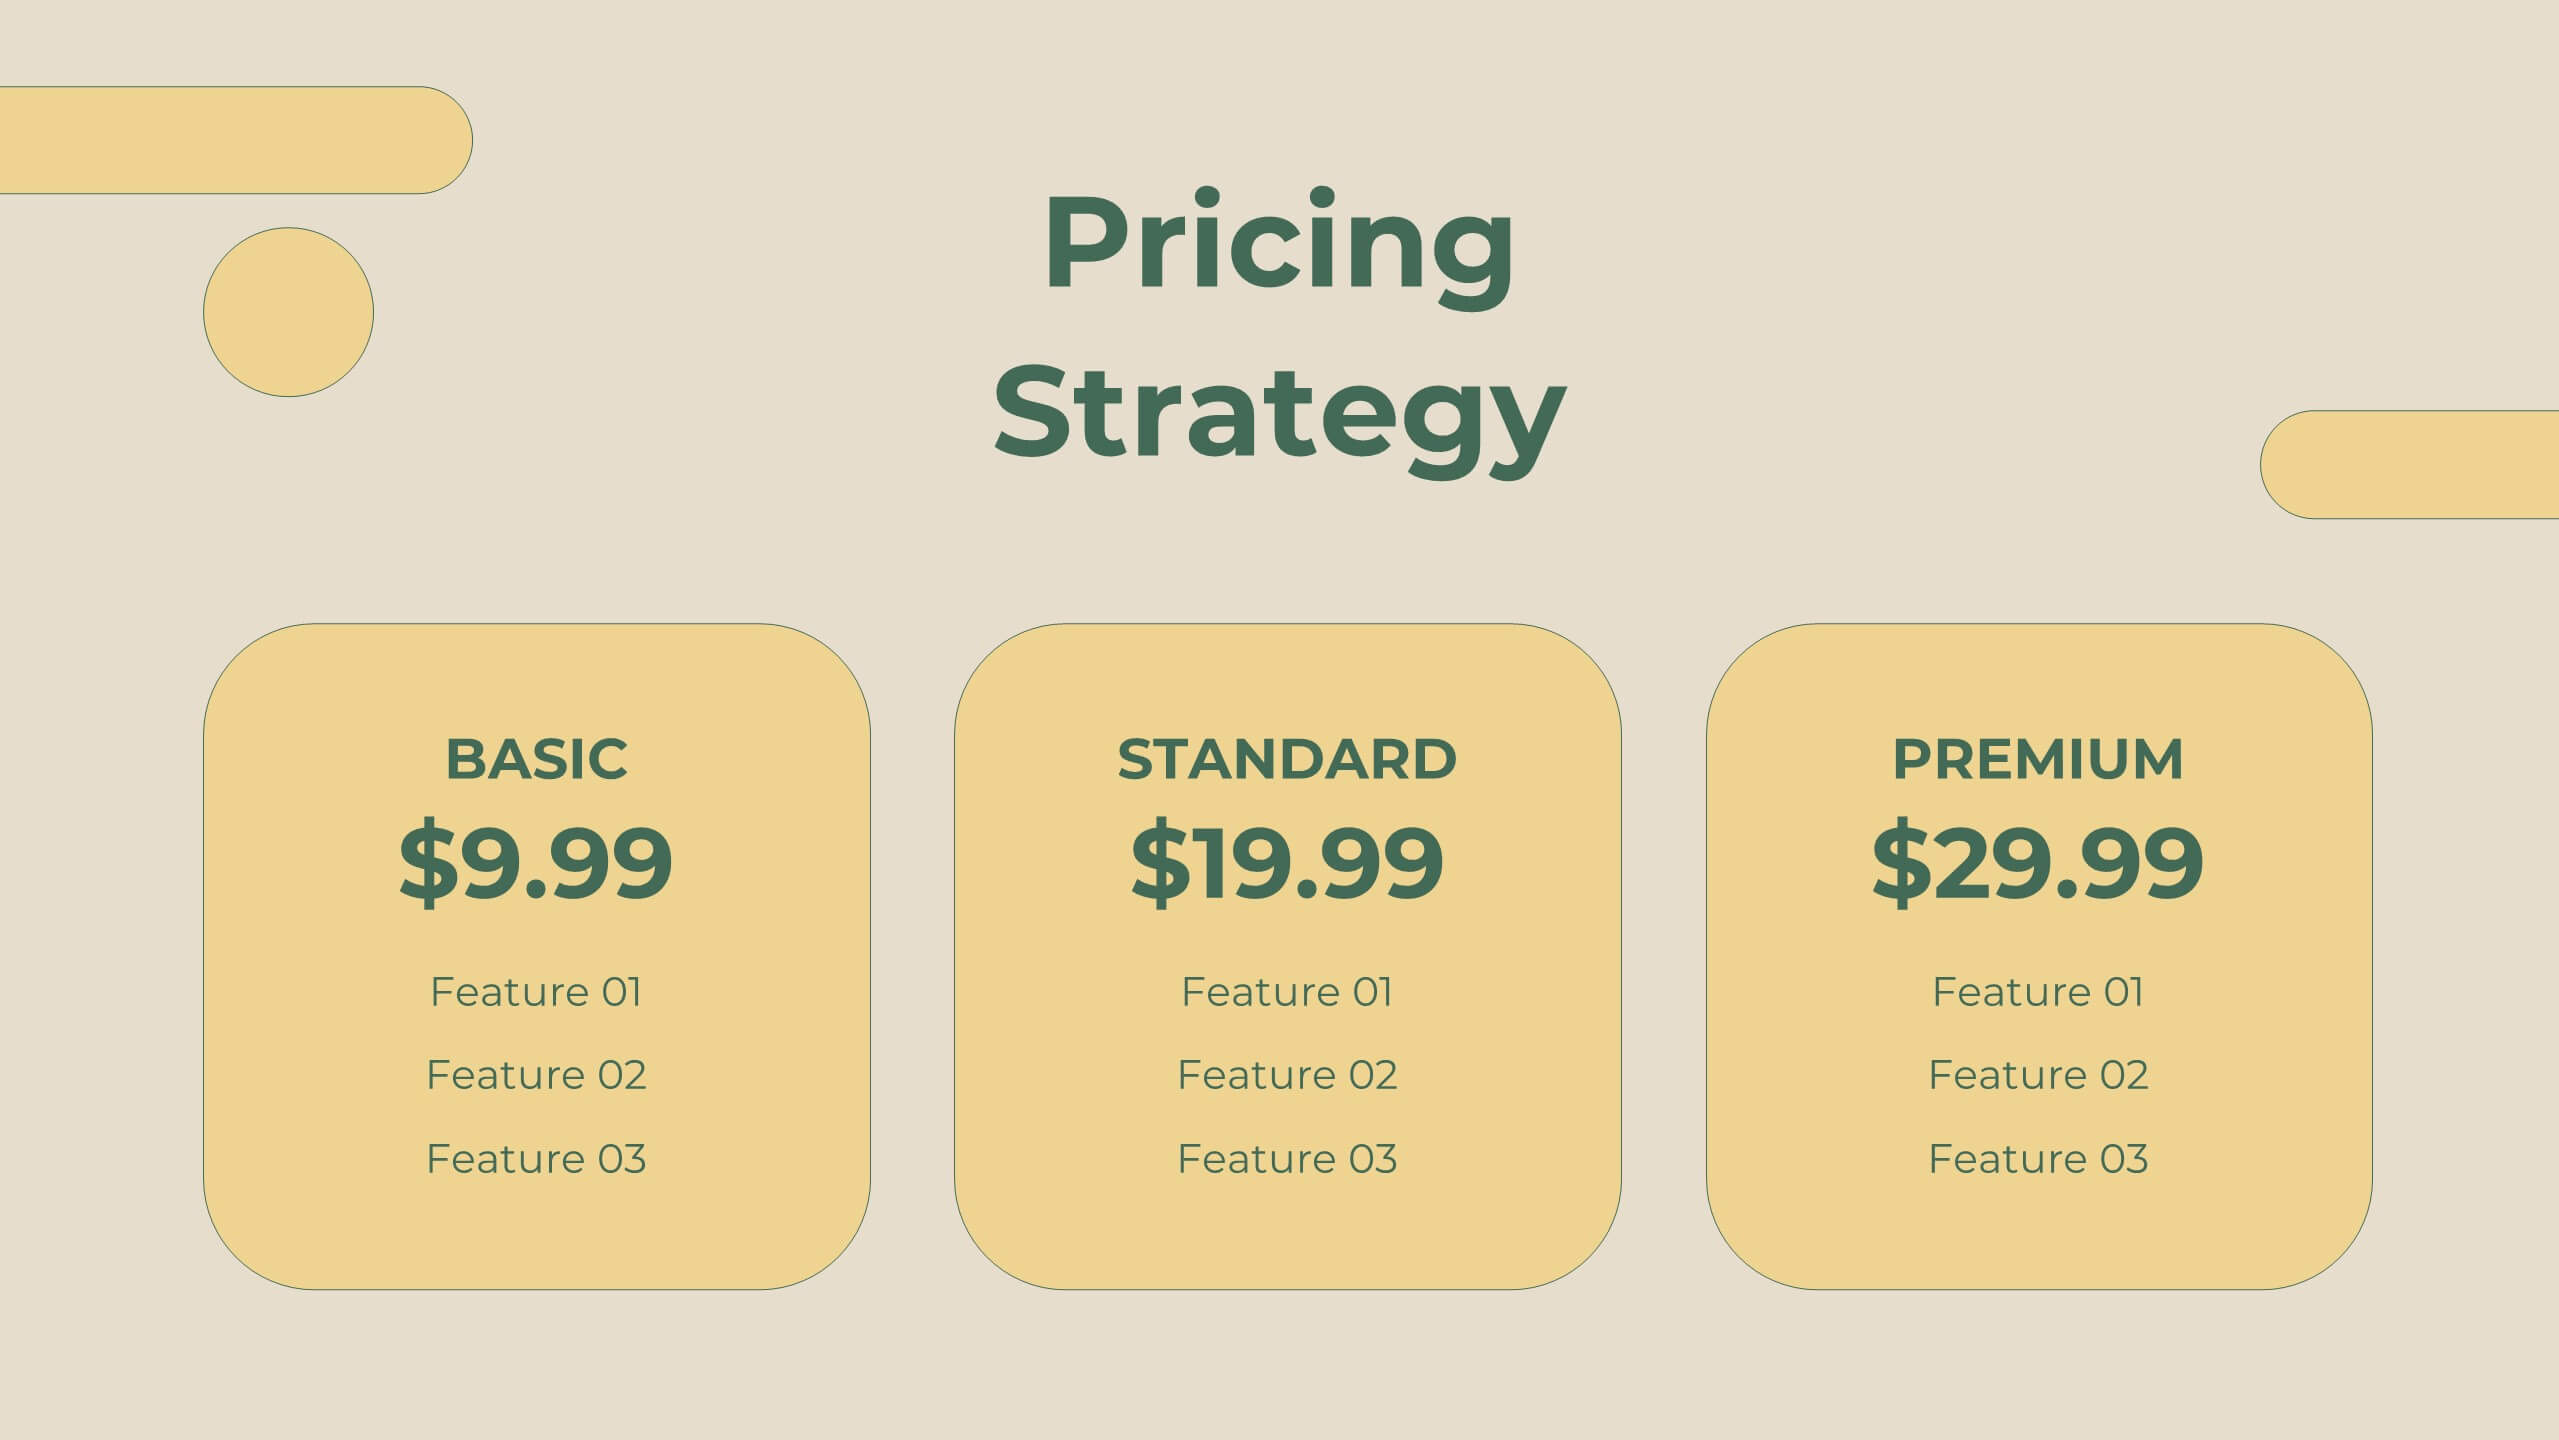
Boost your sales presentations with this modern template! It features sections for objectives, process, team introduction, customer testimonials, and performance metrics. Ideal for outlining strategies, opportunities, and pricing. Engage your audience with a professional, clean design. Compatible with PowerPoint, Keynote, and Google Slides for seamless integration. Make your sales strategy stand out!


20 diapositivas
Astral UX UI Design Pitch Deck Presentation
Present your UX/UI design with flair! This template covers everything from design briefs and process steps to mood boards and final presentations. Perfect for showcasing design elements, wireframes, and project timelines. Ideal for impressing stakeholders and clients. Compatible with PowerPoint, Keynote, and Google Slides. Make your design pitch unforgettable!


5 diapositivas
Teaching Framework Presentation
Bring your teaching steps to life with a clear, uplifting layout that turns educational progression into an easy-to-follow visual journey. This presentation helps you break down concepts, outline stages, and guide learners smoothly from one level to the next. Fully compatible with PowerPoint, Keynote, and Google Slides.


6 diapositivas
Sales Strategy 30-60-90 Day Plan Presentation
Drive sales success with this structured 30-60-90 day strategy template! Designed to help sales teams and professionals set clear objectives, track progress, and optimize performance, this layout ensures a smooth transition from planning to execution. Fully customizable and compatible with PowerPoint, Keynote, and Google Slides for seamless presentations.


7 diapositivas
Work From Home Infographic Presentation Template
A Work From Home Infographic is a visual representation of data related to working from home. This infographic can be used as a guide to get you through some of the best opportunities available. Use this template to get the necessary tools to start working from home. Use this infographic to show your audience how many people work from home by adding statistics, tips and interesting facts. This template is designed to effectively communicate complex information in a simple format, making it great for exploring the topic of working from home. This is a perfect way to promote your business!


5 diapositivas
Global Market Trends World Map Presentation
Visualize your market insights with this sleek and professional Global Market Trends World Map slide. Designed to highlight key regional data with pinpoint accuracy, it’s ideal for presenting statistics, regional performance, or global expansion strategies. The sidebar gradient layout offers space for five categories, each linked to map locations. Fully customizable and compatible with PowerPoint, Keynote, and Google Slides.


6 diapositivas
Legal Compliance and Business Law Presentation
The Legal Compliance and Business Law template elegantly demystifies the complexity of legal compliance, showcasing essential aspects like regulations, law, legal systems, rules, standards, and requirements in an interconnected format. Ideal for presentations that require clear and concise delivery of compliance strategies. This template is compatible with PowerPoint, Keynote, and Google Slides.


10 diapositivas
Startup Pitch Deck Presentation
Make your big idea impossible to ignore with a sleek, investor-ready design that tells your startup’s story with clarity and confidence. This presentation helps you outline your vision, market potential, and business strategy in a compelling way. Fully compatible with PowerPoint, Keynote, and Google Slides for effortless customization.


4 diapositivas
Strategic SWOT Matrix Overview Presentation
Present your strategic insights with clarity using the Strategic SWOT Matrix Overview Presentation. This modern slide layout features a sleek horizontal design that separates Strengths, Weaknesses, Opportunities, and Threats into visually distinct segments. Ideal for business planning, strategy reviews, or team discussions. Fully editable in PowerPoint, Canva, and Google Slides.


26 diapositivas
Briarfall Rebranding Project Plan Presentation
This Brand Presentation Template offers a modern and structured approach to showcasing your brand identity, values, and strategic direction. Covering essential elements like audience personas, brand positioning, touchpoints, and performance metrics, it's fully customizable and perfect for businesses looking to strengthen their brand presence. Compatible with PowerPoint, Keynote, and Google Slides.