


Características


¿Tienes alguna pregunta?
Recomendar


7 diapositivas
KPI Software Dashboard Infographic
Maximize the effectiveness of your performance analysis with our KPI Software Dashboard infographic, optimized for use in Powerpoint, Keynote, and Google Slides. This dynamic infographic is an indispensable tool for business analysts, project managers, and data-driven professionals seeking to present key performance indicators (KPIs) in an insightful and engaging manner. Our KPI Software Dashboard infographic offers a clear, visual representation of critical data points that influence business decisions. With its diverse array of charts, graphs, and meters, it provides an at-a-glance overview of company performance across various metrics. The design is tailored to enhance readability and comprehension, allowing your audience to quickly grasp complex data trends and patterns. Whether you're reviewing sales figures, monitoring customer satisfaction, or tracking project progress, this infographic is designed to streamline the presentation of your data. The compatibility with popular presentation platforms ensures a smooth integration into your slide deck, making it a breeze to communicate the insights that matter. Utilize this infographic to turn your KPI data into compelling narratives that drive strategic business actions.


6 diapositivas
Solution Architect Infographics
Our Solution Architect infographic is an exceptional visual aid designed for Powerpoint, Keynote, and Google Slides. This infographic is perfectly suited for solution architects, systems engineers, and IT professionals who need to convey complex architectural solutions in a clear and concise manner. The infographic is structured to outline the components of a solution architecture framework, including the software, hardware, and network infrastructure. It helps in visualizing the relationships between different system components, making it easier to understand how they work together to create a comprehensive solution. Using this infographic in your presentations will not only add a professional touch but also enhance the audience's comprehension of the solution architecture. Whether you're explaining the architecture of a new software system, the integration of various technologies, or the planning of an IT project, this infographic provides a streamlined way to share that information, ensuring your concepts are communicated effectively.


5 diapositivas
Linear Business Process Flowchart Presentation
Visualize sequential processes with this clean linear flowchart layout. Ideal for workflows, decision-making steps, or procedural overviews. Featuring directional connectors and labeled shapes, this design keeps your message structured and easy to follow. Fully editable in PowerPoint, Keynote, or Google Slides—perfect for business processes, planning, and operations presentations.


6 diapositivas
Modern 3D Infographic Presentation
Add a fresh, dimensional twist to your data storytelling with this clean and modern pyramid layout. Ideal for showcasing layered structures, hierarchical information, or process stages, it’s designed to make your visuals pop. Fully editable and compatible with PowerPoint, Keynote, and Google Slides for easy customization.


7 diapositivas
Investment Infographic Presentation Template
This Investment Infographic template is a professionally designed presentation made to present your ideas in an easy to understand format. This template features a professional design, easy color customization and a number of other useful elements to help you create an amazing infographic. This template is designed to include a variety of charts and graphs to visually demonstrate key points, and incorporates animated elements that make it more interesting for the viewer. This is the perfect presentation to introduce your company's investment portfolio to potential investors.


26 diapositivas
Remote Work Strategies Presentation
Enhance your team's flexibility with our Remote Work Strategies presentation template, designed for use with PowerPoint, Keynote, and Google Slides. This template is an invaluable asset for team leaders, HR professionals, and business consultants dedicated to cultivating a productive remote work culture. Our template is tailored to provide an in-depth analysis of remote work best practices, offering slides that cover essential strategies for communication, collaboration, and project management in a virtual environment. It also includes insights on setting up a successful home office, maintaining work-life balance, and leveraging technology for seamless remote operations. With customizable elements, you can illustrate the advantages of remote work, share success stories, and provide actionable tips to maximize team efficiency from afar. This template is SEO-optimized to ensure your presentation reaches those seeking to optimize their remote work operations and foster a thriving digital workplace.


8 diapositivas
Mission Objectives and Long-Term Goals Presentation
Clearly define your roadmap with this Mission Objectives and Long-Term Goals presentation. This clean, step-by-step layout is ideal for showcasing strategic milestones, vision pillars, or future goals. Each point is visually aligned for logical progression, making it perfect for planning sessions. Fully editable in Canva, PowerPoint, or Google Slides.


26 diapositivas
Corporate Culture Development Presentation
Embark on a journey to forge a vibrant corporate culture with this expertly designed presentation template, where every slide is a brushstroke in the larger picture of your company’s ethos. Orange and blue hues leap off the screen, infusing each slide with the energy and innovation that are the hallmarks of a thriving workplace. Use this template to paint a vivid narrative of your company’s values, mission, and people. Chart the growth of your organizational climate with data-driven graphics, celebrate the uniqueness of your team with personalized profiles, and map out the future with strategic infographics. This template is not just a collection of slides; it's a canvas for storytelling, perfect for HR visionaries and leaders dedicated to nurturing a workspace that breathes collaboration and creativity. Ready for action in your preferred software, it's the gateway to transforming the abstract concept of company culture into a tangible, inspiring reality.


7 diapositivas
Change Management Presentation Template
Our Change Management Infographic is designed to visually present your information. This infographic presentation comes with a seven page layout, all neatly arranged into a well-organized structure, which shows the steps of a change management process. This can be used for any kind of presentation purpose, education, employees, new product launch or even for training executives, managers and supervisors. With this template the variety of elements included are to help you create your own personalized content, you can make your own presentations for any business or industry in just minutes!
4 diapositivas
Growth Path Arrow Design Presentation
Rise with momentum as you visualize progress in a clean, modern layout built for showcasing goals, achievements, and forward movement. This presentation highlights each stage in a clear upward path, helping audiences follow your narrative with ease. Fully editable and compatible with PowerPoint, Keynote, and Google Slides.


7 diapositivas
Trading Cryptocurrency Infographic
The world of cryptocurrency is ever-evolving, and keeping track of trading insights is crucial. The trading cryptocurrency infographic offers a dynamic visualization of this digital currency realm. Using a vivid palette of white, red, and blue, it deciphers complex trading data into comprehensible visuals. Ideal for traders, financial analysts, and those new to the crypto market, this infographic serves as an essential guide to navigate the digital finance landscape. Its compatibility with PowerPoint, Keynote, and Google Slides ensures that presenting your trading insights has never been easier or more stylish.


6 diapositivas
Bitcoin and Blockchain Technology Overview Presentation
Break down complex blockchain systems into digestible visuals with this sleek overview slide. Featuring six color-coded icons around a secure lock illustration, it’s ideal for explaining blockchain architecture, bitcoin components, or crypto processes. Fully editable in PowerPoint, Keynote, and Google Slides for seamless customization.


6 diapositivas
Strategic PESTEL Presentation
Kickstart smarter strategy sessions with a clean, colorful layout that makes external factor analysis feel effortless. This presentation helps teams map trends, identify risks, and understand the broader environment shaping business decisions. Clear visuals keep insights organized and actionable. Fully compatible with PowerPoint, Keynote, and Google Slides.


8 diapositivas
Educational Learning and School Management Presentation
Enhance academic planning with the Educational Learning and School Management Diagram. This structured template visualizes key processes in education, ensuring a streamlined approach to school administration and curriculum development. Ideal for educators, administrators, and policymakers, it offers a clear, customizable layout to communicate strategies effectively. Fully compatible with PowerPoint, Keynote, and Google Slides.


7 diapositivas
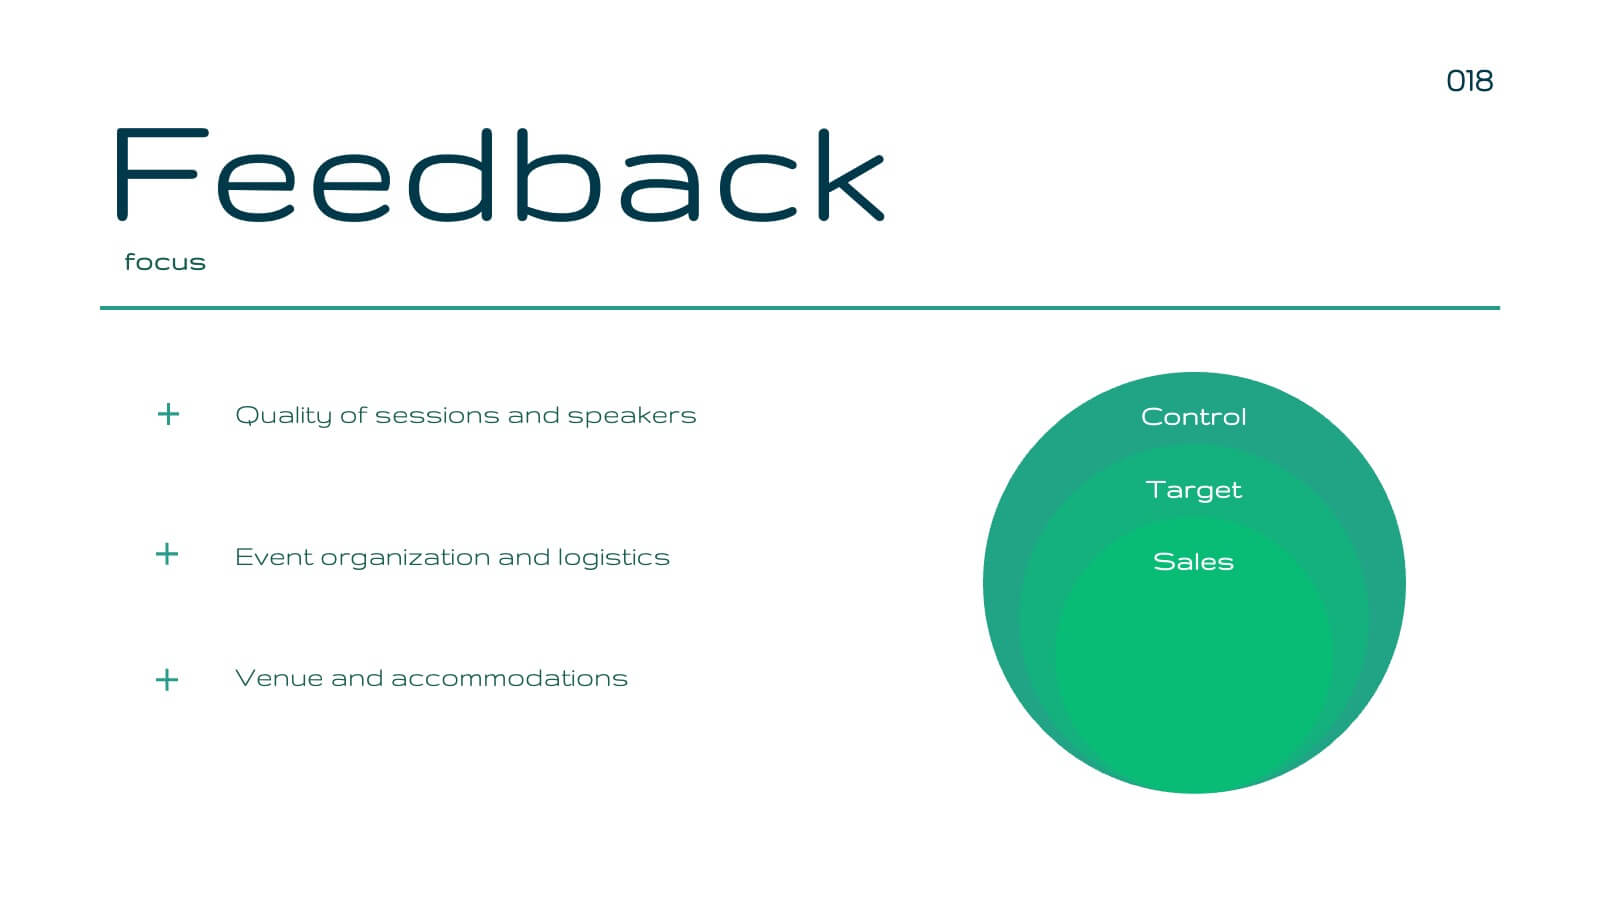
TAM SAM SOM Analysis Infographic Presentation
A TAM SAM SOM Infographic is a visual representation of a business concept that is used to describe a company's potential market size and growth opportunities. TAM stands for Total Addressable Market, SAM stands for Serviceable Addressable Market, and SOM stands for Serviceable Obtainable Market. This template includes a series of concentric circles, rectangles, and other shapes with the TAM being the largest circle, followed by the SAM and SOM. This infographic also includes text, icons, and other graphic elements to help illustrate key points and communicate your growth strategy.


5 diapositivas
SWOT Analysis Business Presentation
Identify key business factors with the SWOT Analysis Business Infographic. This structured template visually highlights strengths, weaknesses, opportunities, and threats, making it ideal for strategy planning, competitive analysis, and decision-making. Fully customizable with editable colors, text, and icons. Compatible with PowerPoint, Keynote, and Google Slides for effortless presentation use.


22 diapositivas
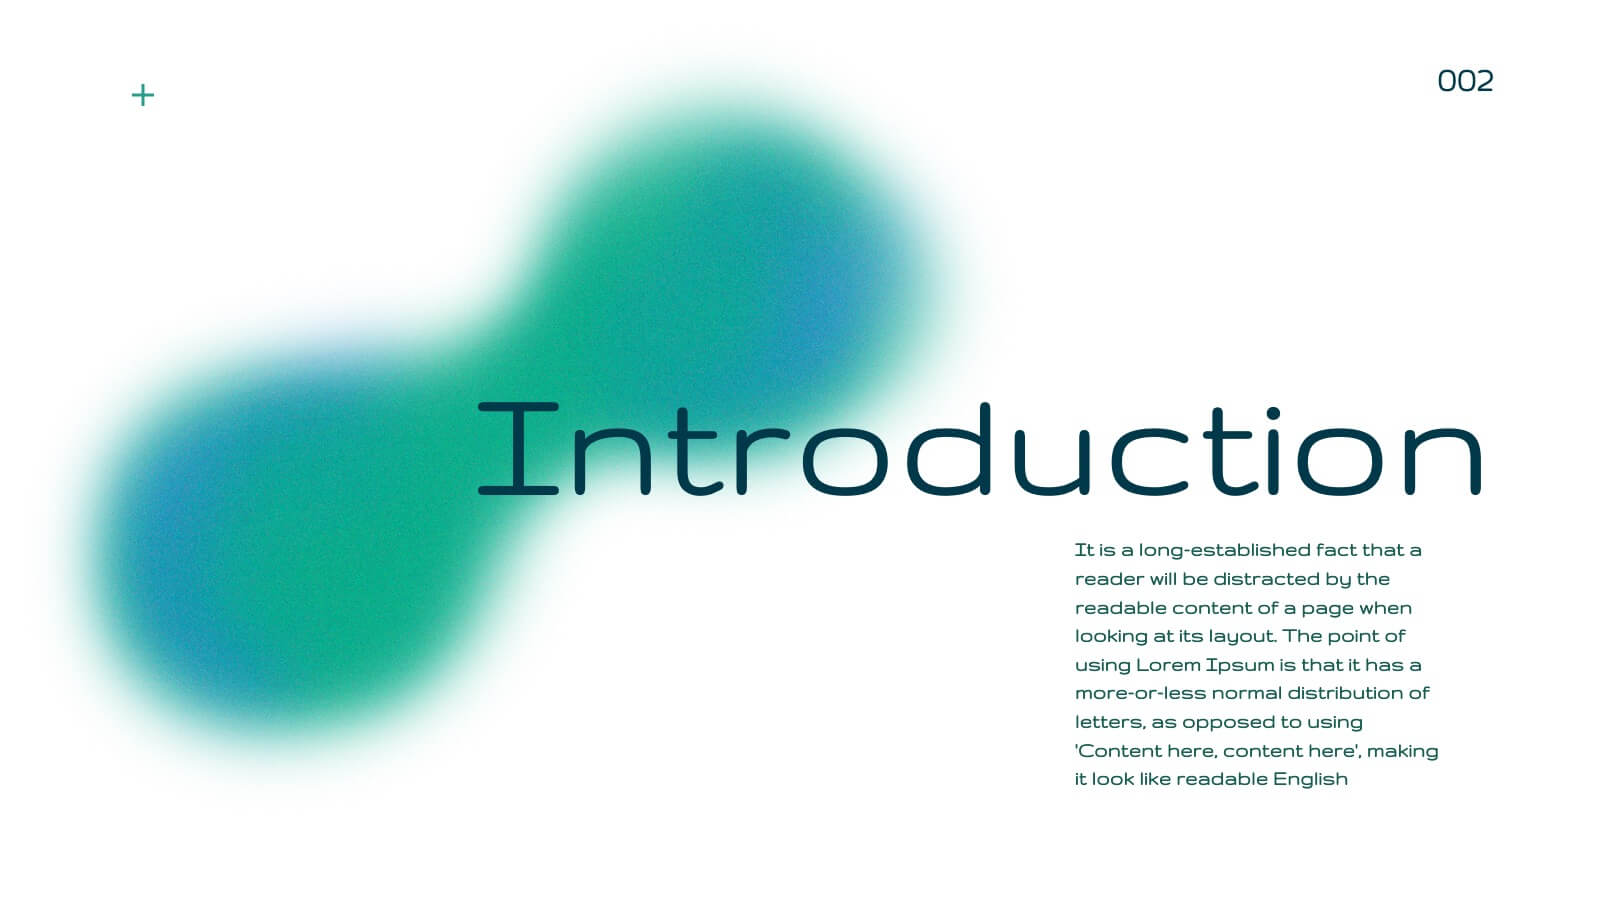
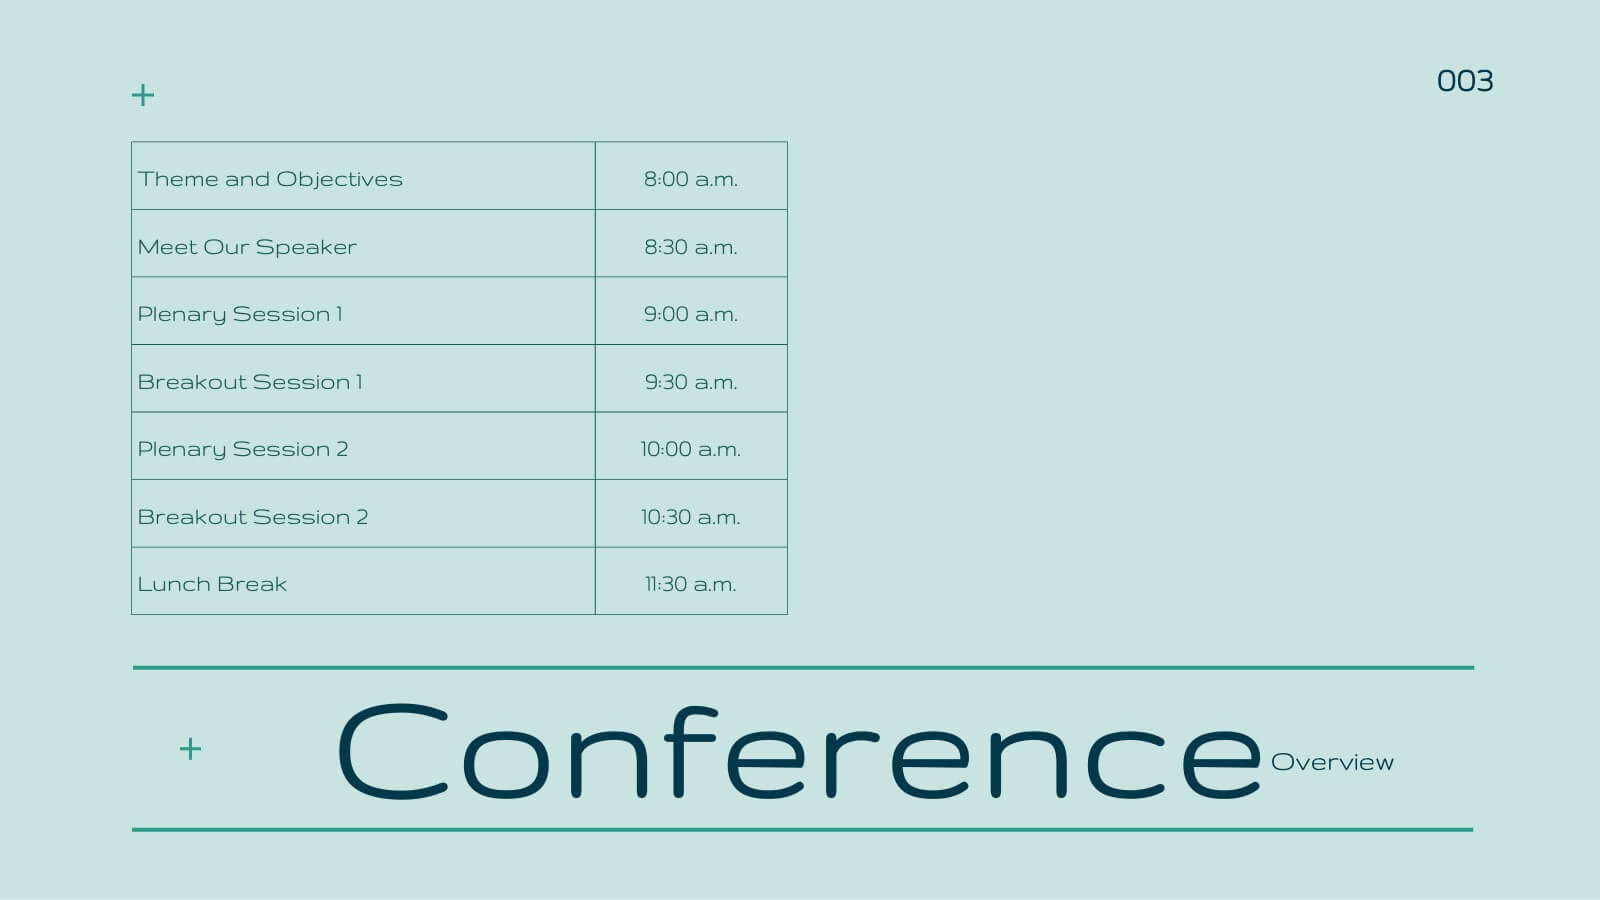
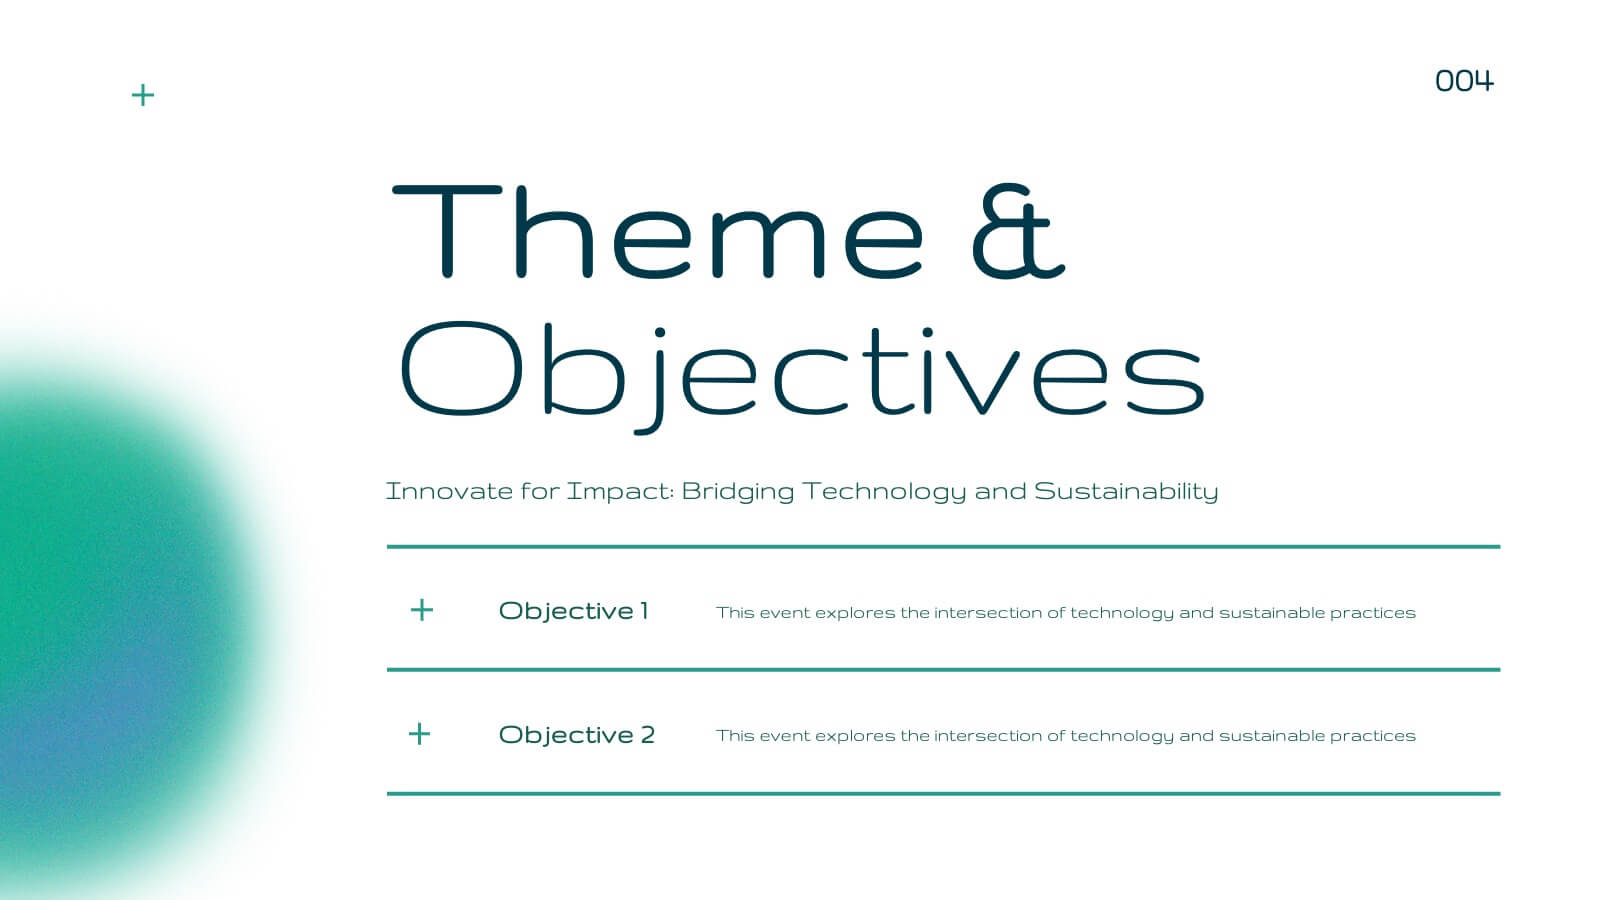
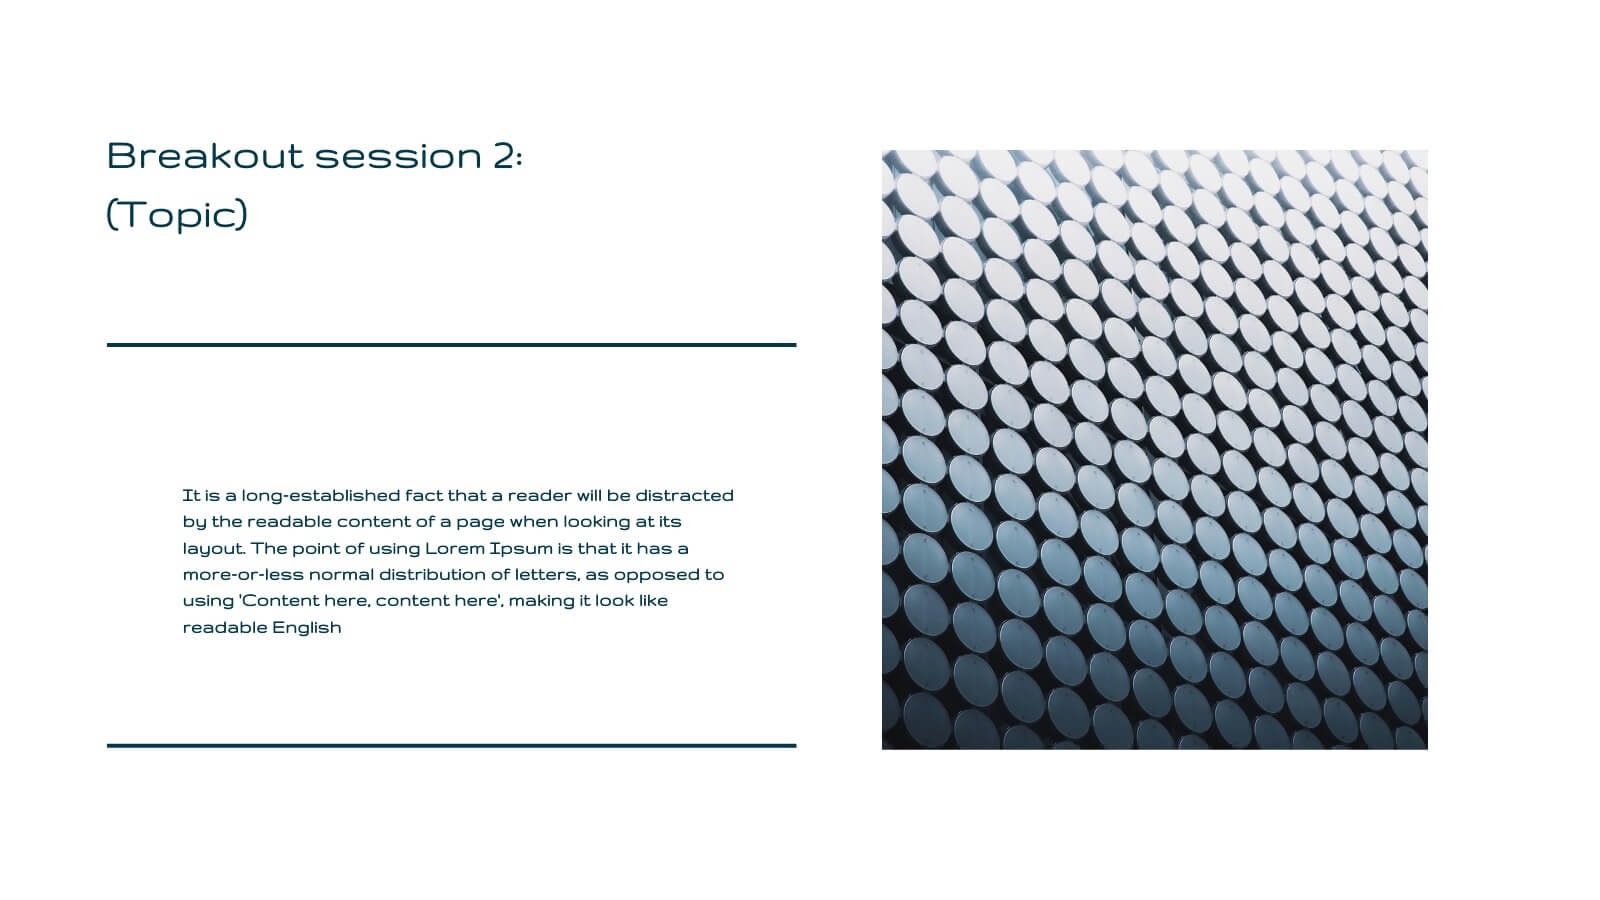
Blaze Business Operations Plan Presentation
Elevate your business presentations with this elegant, modern template designed for comprehensive business operations. Perfect for covering themes, objectives, workshops, and panel discussions, it ensures a professional and engaging delivery. The clean design and structured layout enhance clarity and impact. Compatible with PowerPoint, Keynote, and Google Slides, it’s versatile for any platform.